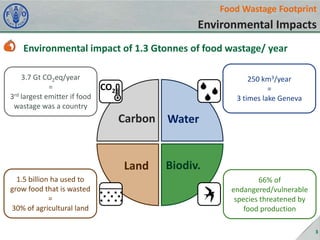
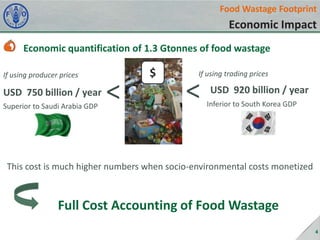
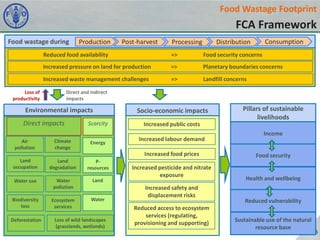
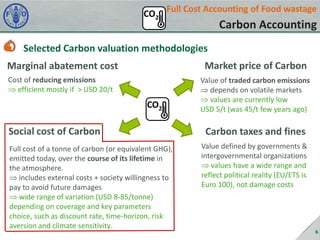
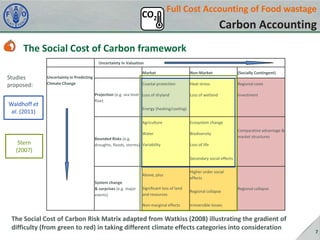
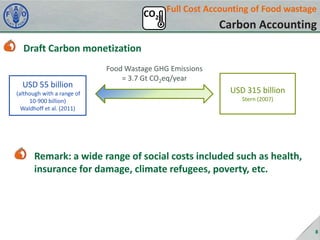
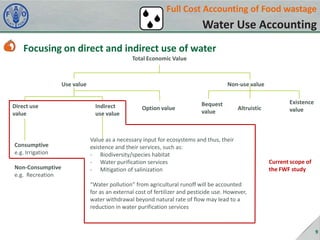
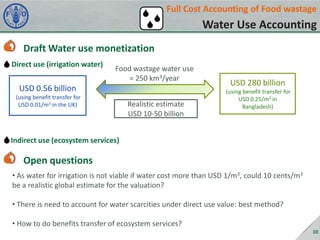
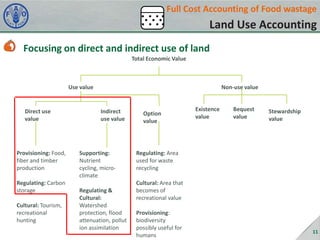
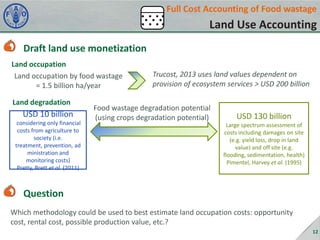
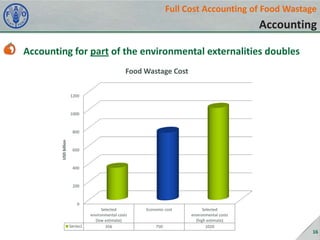
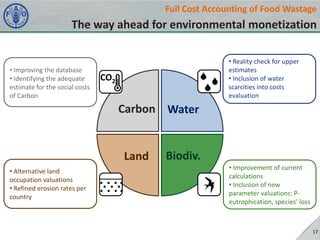
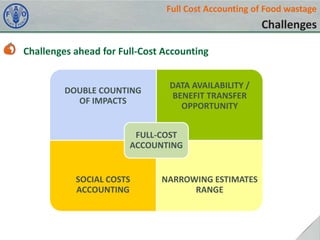
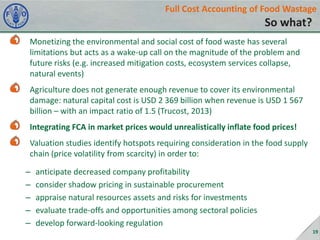
1. True-Cost Accounting in Food and Farming, London, 6 December 2013
Full Cost Accounting of Food Wastage
Nadia El-Hage Scialabba
Senior Officer, Natural Resources Management and Environment Department
2. Full Cost Accounting of Food Wastage
Why bother?
After coal power generation, agriculture has globally the
highest impact sector on the environment when measured in
monetary terms
The economic loss incurred by food wastage has not triggered
the necessary investments in reduction measures, despite
decades of FAO assistance to countries on post-harvest
losses; at the retail and consumer levels, it is economically
“profitable” to waste food
FCA seeks to lower the “profitability” of unsustainable
production and consumption practices by monetizing
unpriced natural resources’ inputs to food production
Social costs are used to assess the contribution of ecosystems
to human wellbeing and inform strategic decision-making
2
3. Food Wastage Footprint
Environmental Impacts
Environmental impact of 1.3 Gtonnes of food wastage/ year
3.7 Gt CO2eq/year
=
3rd largest emitter if food
wastage was a country
250 km3/year
=
3 times lake Geneva
CO2
Carbon Water
Land
1.5 billion ha used to
grow food that is wasted
=
30% of agricultural land
Biodiv.
66% of
endangered/vulnerable
species threatened by
food production
3
4. Food Wastage Footprint
Economic Impact
Economic quantification of 1.3 Gtonnes of food wastage
If using producer prices
USD 750 billion / year
Superior to Saudi Arabia GDP
<
$
If using trading prices
<
USD 920 billion / year
Inferior to South Korea GDP
This cost is much higher numbers when socio-environmental costs monetized
Full Cost Accounting of Food Wastage
4
5. Food Wastage Footprint
FCA Framework
Food wastage during
Production
Post-harvest
Processing
Consumption
Distribution
Reduced food availability
=>
Food security concerns
Increased pressure on land for production
=>
Planetary boundaries concerns
Increased waste management challenges
=>
Landfill concerns
Loss of
productivity
Direct and indirect
impacts
Environmental impacts
Direct impacts
Air
pollution
Climate
change
Scarcity
Energy
Socio-economic impacts
Increased public costs
Increased labour demand
Increased food prices
Land
occupation
Land
degradation
Presources
Water use
Water
pollution
Land
Ecosystem
services
Water
Biodiversity
loss
Deforestation
Loss of wild landscapes
(grasslands, wetlands)
Pillars of sustainable
livelihoods
Increased pesticide and nitrate
exposure
Increased safety and
displacement risks
Reduced access to ecosystem
services (regulating,
provisioning and supporting)
Income
Food security
Health and wellbeing
Reduced vulnerability
Sustainable use of the natural
resource base
5
6. CO2 Full Cost Accounting of Food wastage
Carbon Accounting
Selected Carbon valuation methodologies
Marginal abatement cost
Market price of Carbon
Cost of reducing emissions
efficient mostly if > USD 20/t
Value of traded carbon emissions
depends on volatile markets
values are currently low
USD 5/t (was 45/t few years ago)
CO2
Social cost of Carbon
Full cost of a tonne of carbon (or equivalent GHG),
emitted today, over the course of its lifetime in
the atmosphere.
includes external costs + society willingness to
pay to avoid future damages
wide range of variation (USD 8-85/tonne)
depending on coverage and key parameters
choice, such as discount rate, time-horizon, risk
aversion and climate sensitivity.
Carbon taxes and fines
Value defined by governments &
intergovernmental organizations
values have a wide range and
reflect political reality (EU/ETS is
Euro 100), not damage costs
6
7. CO2
Full Cost Accounting of Food wastage
Carbon Accounting
The Social Cost of Carbon framework
Uncertainty in Valuation
Studies
proposed:
Waldhoff et
al. (2011)
Market
Non-Market
(Socially Contingent)
Coastal protection
Uncertainty in Predicting
Climate Change
Heat stress
Regional costs
Loss of wetland
Investment
Projection (e.g. sea level Loss of dryland
Rise)
Energy (heating/cooling)
Agriculture
Water
Stern
(2007)
Ecosystem change
Biodiversity
Bounded Risks (e.g.
droughts, floods, storms) Variability
Comparative advantage &
market structures
Loss of life
Secondary social effects
Above, plus
Significant loss of land
and resources
Regional collapse
Non-marginal effects
System change
& surprises (e.g. major
events)
Higher order social
effects
Irreversible losses
Regional collapse
The Social Cost of Carbon Risk Matrix adapted from Watkiss (2008) illustrating the gradient of
difficulty (from green to red) in taking different climate effects categories into consideration
7
8. CO2 Full Cost Accounting of Food wastage
Carbon Accounting
Draft Carbon monetization
USD 55 billion
(although with a range of
10-900 billion)
Waldhoff et al. (2011)
Food Wastage GHG Emissions
= 3.7 Gt CO2eq/year
USD 315 billion
Stern (2007)
Remark: a wide range of social costs included such as health,
insurance for damage, climate refugees, poverty, etc.
8
9. Full Cost Accounting of Food wastage
Water Use Accounting
Focusing on direct and indirect use of water
Total Economic Value
Use value
Direct use
value
Consumptive
e.g. Irrigation
Non-Consumptive
e.g. Recreation
Non-use value
Indirect
use value
Option value
Bequest
value
Altruistic
Value as a necessary input for ecosystems and thus, their
existence and their services, such as:
- Biodiversity/species habitat
- Water purification services
- Mitigation of salinization
Existence
value
Current scope of
the FWF study
“Water pollution” from agricultural runoff will be accounted
for as an external cost of fertilizer and pesticide use. However,
water withdrawal beyond natural rate of flow may lead to a
reduction in water purification services
9
10. Full Cost Accounting of Food wastage
Water Use Accounting
Draft Water use monetization
Direct use (irrigation water)
Food wastage water use
= 250 km3/year
USD 0.56 billion
(using benefit transfer for
USD 0.01/m3 in the UK)
Realistic estimate
USD 10-50 billion
USD 280 billion
(using benefit transfer for
USD 0.25/m3 in
Bangladesh)
Indirect use (ecosystem services)
Open questions
• As water for irrigation is not viable if water cost more than USD 1/m3, could 10 cents/m3
be a realistic global estimate for the valuation?
• There is need to account for water scarcities under direct use value: best method?
• How to do benefits transfer of ecosystem services?
10
11. Full Cost Accounting of Food wastage
Land Use Accounting
Focusing on direct and indirect use of land
Total Economic Value
Use value
Direct use
value
Provisioning: Food,
fiber and timber
production
Regulating: Carbon
storage
Cultural: Tourism,
recreational
hunting
Non-use value
Indirect
use value
Supporting:
Nutrient
cycling, microclimate
Regulating &
Cultural:
Watershed
protection, flood
attenuation, pollut
ion assimilation
Option
value
Existence
value
Bequest
value
Stewardship
value
Regulating: Area
used for waste
recycling
Cultural: Area that
becomes of
recreational value
Provisioning:
biodiversity
possibly useful for
humans
11
12. Full Cost Accounting of Food wastage
Land Use Accounting
Draft land use monetization
Land occupation
Land occupation by food wastage
= 1.5 billion ha/year
Land degradation
USD 10 billion
considering only financial
costs from agriculture to
society (i.e.
treatment, prevention, ad
ministration and
monitoring costs)
Pretty, Brett et al. (2011)
Trucost, 2013 uses land values dependent on
provision of ecosystem services > USD 200 billion
Food wastage degradation potential
(using crops degradation potential)
USD 130 billion
Large spectrum assessment of
costs including damages on site
(e.g. yield loss, drop in land
value) and off site (e.g.
flooding, sedimentation, health)
Pimentel, Harvey et al. (1995)
Question
Which methodology could be used to best estimate land occupation costs: opportunity
cost, rental cost, possible production value, etc.?
12
13. Full Cost Accounting of Food Wastage
Biodiversity/Ecosystems Accounting
Total Economic Value
Use value
Direct use
value
Direct harvest of
wild species for
pharmaceutics;
pollination services
of pollinators
Non-use value
Indirect
use value
Water
purification, climate
change mitigation
(e.g. soil carbon
sequestration in
wetlands)
Option value
Existence
value
Pharmaceutics
not yet
discovered
Existence of
the Great
Barrier Reef
Altruistic
value
Knowledge
that others
can use the
Great Barrier
Reef (e.g. for
tourism)
Bequest value
Conserving
the Great
Barrier Reef
for future
generations
Focus area for the FWF Project
13
14. Full Cost Accounting of Food Wastage
Biodiversity/ Ecosystems Accounting
Drivers of biodiversity loss (MEA, 2005) and draft indicators
Over-exploitation
Pollution
• N-eutrophication
• P-eutrophication
• Pollinator loss (linked to
pesticides)
• Fisheries depletion
• Grassland degradation
(cf land use component)
Climate change
• Global Warming Potential
(cf carbon component)
Habitat change
• Deforestation (cf land use
component)
Invasive Species
14
15. Full Cost Accounting of Food Wastage
Biodiversity/ Ecosystems Accounting
Draft Biodiversity/Ecosystem Loss Monetization
Overfishing costs for lost/wasted fish
N
USD 50 billion/ year
Damages due to N runoff into protected areas
Loss of pollinators
USD 20 billion/ year
USD 20-25 billion/ year
Remark: the quantification of biodiversity impact is too rough,
incomplete and difficult to estimate meaningfully
15
16. Full Cost Accounting of Food Wastage
Accounting
Accounting for part of the environmental externalities doubles
Food Wastage Cost
1200
1000
USD billion
800
600
400
200
0
Series1
Selected
environmental costs
(low estimate)
356
Economic cost
750
Selected
environmental costs
(high estimate)
1020
16
17. Full Cost Accounting of Food Wastage
The way ahead for environmental monetization
• Improving the database
• Identifying the adequate
estimate for the social costs
of Carbon
• Reality check for upper
estimates
• Inclusion of water
scarcities into costs
evaluation
CO2
Carbon Water
Land
• Alternative land
occupation valuations
• Refined erosion rates per
country
Biodiv.
• Improvement of current
calculations
• Inclusion of new
parameter valuations: Peutrophication, species’ loss
17
18. Full Cost Accounting of Food wastage
Challenges
Challenges ahead for Full-Cost Accounting
DOUBLE COUNTING
OF IMPACTS
DATA AVAILABILITY /
BENEFIT TRANSFER
OPPORTUNITY
FULL-COST
ACCOUNTING
SOCIAL COSTS
ACCOUNTING
NARROWING ESTIMATES
RANGE
19. Full Cost Accounting of Food Wastage
So what?
Monetizing the environmental and social cost of food waste has several
limitations but acts as a wake-up call on the magnitude of the problem and
future risks (e.g. increased mitigation costs, ecosystem services collapse,
natural events)
Agriculture does not generate enough revenue to cover its environmental
damage: natural capital cost is USD 2 369 billion when revenue is USD 1 567
billion – with an impact ratio of 1.5 (Trucost, 2013)
Integrating FCA in market prices would unrealistically inflate food prices!
Valuation studies identify hotspots requiring consideration in the food supply
chain (price volatility from scarcity) in order to:
–
–
–
–
–
anticipate decreased company profitability
consider shadow pricing in sustainable procurement
appraise natural resources assets and risks for investments
evaluate trade-offs and opportunities among sectoral policies
develop forward-looking regulation
19