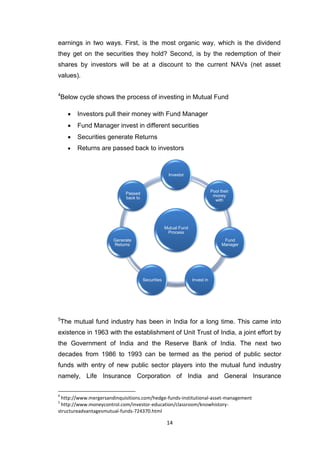
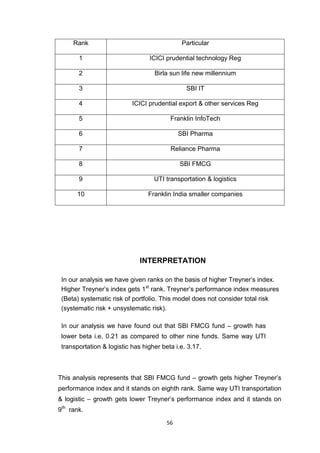
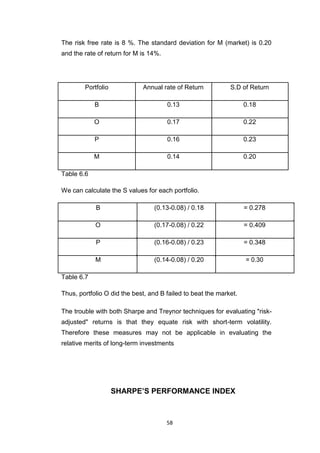
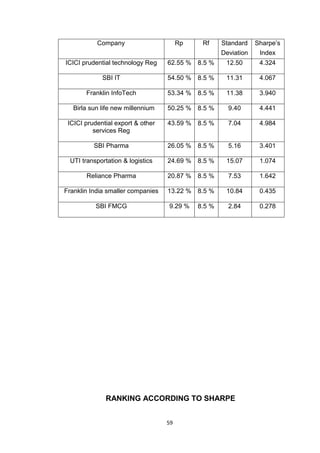
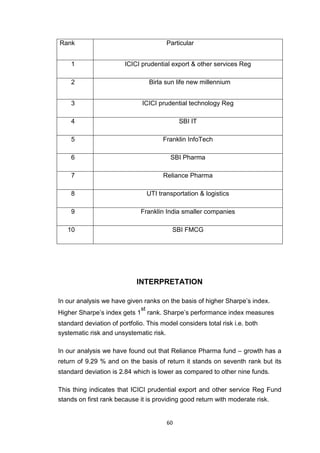
SlideShare a Scribd company logo
A
COMPREHENSIVE PROJECT REAPORT
ON
“PERFORMANCE EVALUATIN OF MUTUAL FUND”
SUBMITTED TO
SOM – LALIT INSTITUTE BUSINESS MANAGEMENT
IN PARTIAL FULLFILLMENT OF THE
REQUIREMENT OF THE AWARD FOR THE DEGREE OF
MASTER OF BUSINESS ADMINISTRATION
UNDER
Gujarat Technological University
UNDER THE GUIDENCE OF
Mr. KARAN SHASTRI
SUBMITTED BY
NIRAV THANKI – 127780592111
DARSHITA RUPARELIA – 127780592074
M.B.A – SEMESTER III
SOM – LALIT INSTITUTE OF BUSINESS MANAGEMENT
M.B.A PROGRAMME
Affiliated to Gujarat Technological University
Ahmadabad
Jan – 2014
PREFACE
This project provides an opportunity to demonstrate application of our
knowledge, skill and competencies required during the financial session. This
project helps us to devote our skill to analyze the problem to suggest alternative
solutions and to evaluate them.
We have worked on the topic is “PERFORMANCE EVALUATION OF
MUTUAL FUND”
We have put our level best to prepare our project an error free project every
effort has been made to offer the most authenticate position with accuracy.
ACKNOWLEDGEMENT
We would like to express our profound gratitude to all those who have been
instrumental in the preparation of this report which has been prepared in partial
fulfillment of Comprehensive Project in the Semester IV of an MBA programme.
We wish to thank Mr. Jagdish Joshipura, director of Som – Lalit Institute of
Management and all the Faculty members of SLIBM for their support and vision.
This project could only be completed with the assistance of Mr. Karan Shastri
having being a valued guide.
Finally we would like to thank our Parents, Family, Friends and God almighty for
their unending inspiration and encouragement.
Place: Ahmadabad Nirav Thanki
Date: 10-01-2014 Darshita Ruparelia
DECLARATION
We, Nirav Thanki and Darshita Ruparelia, hereby declare that the report for
“Comprehensive Project” entitled “Performance Evaluation of Mutual Funds”
is the result of our own work and our indebtness to other work publications,
references, if any, have been duly acknowledged.
Place: Ahmadabad Nirav Thanki
Date: 10-01-2014 Darshita Ruparelia
Institute’s Certificate
Certified that this Comprehensive Project Report Titled “Performance
Evaluation of Mutual Fund” is the bonafide work of Mr. Nirav Thanki, and Ms.
Darshita Ruparelia (Enrollment No. 127780592111, 127780592074), who
carried out the research under my supervision. I also certify further, that to the
best of my knowledge the work reported herein does not form part of any other
project report or dissertation on the basis of which a degree or award was
conferred on an earlier occasion on this or any other candidate.
Prof. Mr. Karan Shastri.
Director. Mr. Jagdish Joshipura.
TABLE OF CONTENTS
CHAPTER PARTICULARS PAGE NO
NO.
EXECUTIVE SUMMARY 1
PART – 1 GENERAL INFORMATION
1 MUTUAL FUND INDUSTRY
1.1 About The Industry 5
1.2 World Market 9
1.3 Indian Market 11
1.4 Growth Of The Industry 14
2 MAJOR COMPANIES IN THE MUTUAL FUND
INDUSTRY
2.1 Companies on the basis of return 21
3 Product Profile
3.1 Types of mutual fund 23
3.2 Benefits of mutual fund 25
3.3 Disadvantage of mutual fund 26
3.4 Different plans that mutual fund offer 27
3.5 Factors influencing the performance of mutual 28
Fund
PART – 2 PRIMARY STUDY
4 INTRODUCTION OF THE STUDY
4.1 literature Review 32
4.2 Background of the study 36
4.3 Problem statement and importance of the 37
Study
4.4 Objectives of the study 38
5 Research Methodology
5.1 Research Design 40
5.2 Sources of Data 41
5.3 Data collection Method 41
5.4 Population 41
5.5 Sampling method 42
6 Data Analysis and Interpretation
6.1 Analysis of mutual fund performance 44
7 Results and Findings 59
8 Limitations of the study 61
9 Conclusion/Suggestion 63
8
10 ANNEXURE
Appendix – 1
1.1 Returns of mutual fund for the year 2013 66
1.2 Return of index for the year 2013 69
Appendix – 2
2.1 Calculation of beta 70
2.2 Calculation of standard deviation 74
11 Bibliography 78
9
EXECUTIVE SUMMERY
There are so many investment avenues. So that investors does not know
which avenues provides best return. As per the financial rule of “Do not put all
the eggs in one basket” investor’s portfolio are most diversified. So that risk
should be minimized. If the person do not have knowledge of how to get
maximum return with minimum risk or vice-versa then they should invest in
mutual fund. There are so many funds and schemes are available in mutual
fund market. Investors know that how much risk they can take and based on
that they have to choose schemes. The primary object of the present project
is to know about which mutual funds gave highest performance within one-
year.
This study has been undertaken to evaluate the performance of the Indian
Mutual Funds vis-à-vis the Indian stock market. For the purpose of this study,
10 open ended equity based growth mutual funds were selected as the
Sample. The data, which is the quarterly NAV’s of the funds and the closing of
the S & P NIFTY Index, were collected for a period of 1 year starting
01/01/2013. to 31/12/2013.
Different statistical tools were used on the data obtained to calculate the
Average returns, Standard deviation, Fund Beta, Treynor’s Performance
Index, Sharpe’s Performance Index and Jensen’s Alpha. These variables of
the funds were compared with the same variables of the market to assess
how the different funds have performed against the market.
Data we have used to calculate average returns are 10 fund’s quarterly
returns and S & P NIFTY’s quarterly returns for the year 2013. Data we have
used to calculate standard deviation of portfolio (σp) is the average return of
mutual fund and market. Data we have used to calculate beta of portfolio (βp)
is the covariance of the returns of the fund and market and variance of the
market.
10
We have used return of portfolio (mutual fund) i.e. Rp, return of risk free
securities i.e. Rf and beta of portfolio to calculate Treynor’s Performance
Index. We have used return of portfolio i.e. Rp, return of risk free securities
i.e. Rf and standard deviation of portfolio to calculate Sharpe’s Performance
Index. We have used Rp, Rf, βp and Rm i.e. return of market to calculate
Jensen’s alpha.
Sharpe and Treynor model are used to compare the performance of mutual
funds and rank them according to their performance. Jensen model is used to
calculate the fund manager’s stock selection capability.
In this project we have calculated Sharpe, Treynor and Jensen’s performance
index of 10 mutual funds and rank them according to that. We have also
calculated the same for market to compare the performance of mutual funds
with the market and to check whether the mutual funds can beat the market or
not.
11
PART – I
GENERAL
INFORMATION
12
CHAPTER – I
MUTUAL FUND
INDUSTRY
1.1 ABOUT THE INDUSTRY
Financial Institutions comprises following services
13
Definition
1
Mutual funds are investment companies that pool money from investors at
large and offer to sell and buy back its shares on a continuous basis and use
the capital thus raised to invest in securities of different companies. The
stocks these mutual funds have are very fluid and are used for buying or
redeeming and/or selling shares at a net asset value. Mutual funds posses
shares of several companies and receive dividends in lieu of them and the
earnings are distributed among the share holders.
2
Mutual funds are conceived as institutions for providing small investors with
avenues of investments in the capital market. .Since small investors generally
do not have adequate time, knowledge, experience and resources for directly
accessing the capital market, they have to rely on an intermediary, which
undertakes informed investment decisions and provides consequential
benefits of professional expertise.
3
Mutual funds have diversified investments spread in calculated proportions
amongst securities of various economic sectors. Mutual funds get their
1
http://goldentalk.com/archive/index.html/t-41439.html
2
http://indianresearchjournals.com/pdf/IJMFSMR/2012/February/ijm-6.pdf
3
http://www.studymode.com/essays/Mutual-Funds-883302.html
Financial
Institution
Commerci
al Bank
Insurance
Compnies
Mutual
Fund
Providend
Fund
Non-
Banking
Financial
Institution
14
earnings in two ways. First, is the most organic way, which is the dividend
they get on the securities they hold? Second, is by the redemption of their
shares by investors will be at a discount to the current NAVs (net asset
values).
4
Below cycle shows the process of investing in Mutual Fund
 Investors pull their money with Fund Manager 

 Fund Manager invest in different securities 

 Securities generate Returns 

 Returns are passed back to investors 


5
The mutual fund industry has been in India for a long time. This came into
existence in 1963 with the establishment of Unit Trust of India, a joint effort by
the Government of India and the Reserve Bank of India. The next two
decades from 1986 to 1993 can be termed as the period of public sector
funds with entry of new public sector players into the mutual fund industry
namely, Life Insurance Corporation of India and General Insurance
4
http://www.mergersandinquisitions.com/hedge-funds-institutional-asset-management
5
http://www.moneycontrol.com/investor-education/classroom/knowhistory-
structureadvantagesmutual-funds-724370.html
Mutual Fund
Process
Investor
Pool their
money
with
Fund
Manager
Invest inSecurities
Generate
Returns
Passed
back to
15
Corporation of India.
6
The year of 1993 marked the beginning of a new era in the Indian mutual
fund industry with the entry of private players like Morgan Stanley, J.P
Morgan, and Capital International. This was the first time when the mutual
fund regulations came into existence.
SEBI (Security Exchange Board of India) was established under which all the
mutual funds in India were required to be registered. SEBI was set up as a
governing body to protect the interest of investor. By the end of 2008, the
number of players in the industry grew enormously with 46 fund houses
functioning in the country.
With the rise of the mutual fund industry, establishing a mutual fund
association became a prerequisite. This is when AMFI (Association of Mutual
Funds India) was set up in 1995 as a non-profit organization. Today AMFI
ensures mutual funds function in a professional and healthy manner thereby
protecting the interest of the mutual funds as well as its investors.
The mutual fund industry is considered as one of the most dominant players
in the world economy and is an important constituent of the financial sector
and India is no exception. The industry has witnessed startling growth in
terms of the products and services offered, returns churned, volumes
generated and the international players who have contributed to this growth.
Today the industry offers different schemes ranging from equity and debt to
fixed income and money market.
7
The market has graduated from offering plain vanilla and equity debt
products to an array of diverse products such as gold funds, exchange traded
funds
(ETF’s), and capital protection oriented funds and even thematic funds. In
addition investments in overseas markets have also been a significant step.
Due credit for this evolution can be given to the regulators for building an
appropriate framework and to the fund houses for launching such different
6
http://www.moneycontrol.com/investor-education/classroom/knowhistory-
structureadvantagesmutual-funds-724370.html
7
http://www.getcited.org/pub/103509466
16
products. All these reasons have encouraged the traditional conservative
investor, from parking fund in fixed deposits and government schemes to
investing in other products giving higher returns.
8
It is interesting to note that the major benefits of investing in a mutual funds is
to capitalize on the opportunity of a professionally managed fund by a set of
fund managers who apply their expertise in investment. This is beneficial to
the investors who may not have the relevant knowledge and skill in investing.
Besides investors have an opportunity to invest in a diversified basket of
stocks at a relatively low price. Each investor owns a portion of the fund and
hence shares the rise and fall in the value of the fund. A mutual fund may
invest in stocks, cash, bonds or a combination of these.
9
Mutual funds are considered as one of the best available investment options
as compare to others alternatives. They are very cost efficient and also easy
to invest in. The biggest advantage of mutual funds is they provide
diversification, by reducing risk & maximizing returns.
10
India is ranked one of the fastest growing economies in the world. Despite
this huge progression in the industry, there still lies huge potential and room
for growth. India has a saving rate of more than 35% of GDP, with 80% of the
population who save. These savings could be channelized in the mutual funds
sector as it offers a wide investment option. In addition, focusing on the
rapidly growing tier II and tier III cities within India will provide a huge scope
for this sector. Further tapping rural markets in India will benefit mutual fund
companies from the growth in agriculture and allied sectors. With subsequent
easing of regulations, it is estimated that the mutual fund industry will grow at
a rate of 30% - 35% in the next 3 to 5 years and reach US 300 billion by 2015.
1.2 MUTUAL FUND INDUSTRY IN WORLD MARKET
8
http://pt.slideshare.net/subhodeepbandopadhyay/market-risk-and-investment-performance-of-
equity-mutual-funds-in-india
9
http://www.scribd.com/doc/27550490/Dissertation-on-Past-Performance-of-Mutual-Funds
10
http://www.slideshare.net/hemanthcrpatna/finance-project-on-performance-evaluation-of-indian-
mutual-funds
17
Mutual Fund – A Globally Proven Investment
11
Worldwide, the Mutual Fund has a long and successful history. The
popularity of the Mutual Fund has increased manifold. In developed financial
markets, like the United States, Mutual Funds have almost overtaken bank
deposits and total assets of insurance funds.
12
Internationally, on-line investing continues its meteoric rise. Many have
debated about the success of e-commerce and its breakthroughs, but it is true
that this aspect of technology could and will change the way financial sectors
function. However advanced countries like US, mutual funds buy-sell
transactions have already begun on the net, while in India the net is used as a
source of information. Such changes could facilitate easy access, lower
intermediation costs and better services for all.
Since the creation of the first mutual fund in 1929, the mutual fund industry
has enjoyed the fastest growth rate of the financial investment industry. In
1949, all mutual fund companies combined controlled $2 billion; fund assets
soared to $6.5 trillion at the outset of 2003, and more than $12 trillion in 2007,
making the funds America’s largest financial investment vehicles.
13
The mutual fund industry consists of investment companies that sell shares
in one or more portfolios of financial assets. Fund managers determine the
composition of the portfolio, which may include stocks, bonds, government
securities, shares in precious metals, and other financial assets. As open-end
funds, they are sold publicly, and their shares must be redeemed by the
investment company on request of the shareholder.
Mutual funds are categorized by their general investment objectives. Equity
funds consist of common stocks and are organized to achieve capital growth.
Bond funds are composed of corporate, U.S. government or municipal bonds
and emphasize regular income.
11
http://www.capitalmarket.com/mutual/mf-faqa.htm
12
http://www.ashishbusiness.in/mutual-funds
13
https://www.sec.gov/about/offices/oia/oia_investman/rplaze-042012.pdf
18
14
Income funds have the same objective as bond funds but include
Government National Mortgage Association securities, government securities,
and common and preferred stocks as well as bonds. Money market mutual
funds consist of short-term instruments, such as U.S. government securities,
bank certificates of deposit and commercial paper.
15
The mutual fund industry is regulated by the Securities and Exchange
Commission (SEC) and by state regulations and securities laws. The first
mutual fund was developed on March 21, 1924, when three Boston securities
executives pooled their money to establish the Massachusetts Investors
Trust. In just one year, the mutual fund grew from $50,000 to $392,000 in
assets. Investors welcomed the innovation and invested in this new vehicle
heavily; however, the stock market crash of 1929 slowed its growth. To instill
investors with confidence, the U.S. Congress passed the Securities Act of
1933, the Securities Exchange Act of 1934, and the Investment Company Act
of 1940, which set standards with which mutual funds must comply.
16
By the end of the 1960’s, there were approximately 270 funds with $48
billion in assets. One of the largest contributors to the mutual funds’ growth
was the provision added to the Internal Revenue Code in 1975 that allowed
individuals already in a corporate pension fund to contribute up to $2,000 per
year to an individual retirement account (IRA). Mutual funds became popular
in employer sponsored 401(k) retirement plans, IRAs, and Roth IRAs. In
1976, John Bogle founded the first retail index fund (a passively managed
fund that tries to mirror the performance of a specific index, such as the S&P
500), named First Index Investment Trust. Later renamed Vanguard 500
Index Fund, it revolutionized investing, becoming one of the world’s largest
mutual funds, with more than $115 billion in assets. Mutual fund assets first
reached the trillion dollar mark in January, 1990. By the end of 1990, the
industry had also posted new records, both in the number of funds (3,108)
and in the number of individual accounts (62.6 million). By 1996, total mutual
fund assets reached $3 trillion. The industry blossomed in the dawn of the
14
http://www.capitalmarket.com/mutual/mf-faqa.htm
15
http://my-people.net/mutual-fund-industry/
16
http://my-people.net/mutual-fund-industry/
19
new millennium, and in 2007, there were 8,015 mutual funds, with a combined
worth of $12.4 trillion.
1.3 MUTUAL FUND INDUSTRY IN INDIAN MARKET
17
The Indian mutual funds industry is witnessing a rapid growth as a result of
infrastructural development, increase in personal financial assets, and rise in
foreign participation. With the growing risk appetite, rising income, and
increasing awareness, mutual funds in India are becoming a preferred
investment option compared to other investment vehicles like Fixed Deposits
(FDs) and postal savings that are considered safe but give comparatively low
returns, according to “Indian Mutual Fund Industry”.
18
Market capitalization
Individual investors make up for 96.86% of the total number of investor
accounts and contribute 36.9% of the net assets under management.
17
http://businesstoday.intoday.in/story/mutual-fund-schemes-and-offers-in-coming-
months/1/19520.html
18
http://indianresearchjournals.com/pdf/APJMMR/2012/October/19.pdf
0
5
10
15
20
25
30
35
40
45
Equity Bond Money Market Mixed Others
Asset Allocation in %
INDIA
WORLD
20
Size of industry
The size of Indian Mutual Fund Industry has grown and now has the boast of
having dominance in this industry. In April 2008 the total Asset Under
Management popularly known as AUM has increased from Rs.1, 01, 565
crores in January 2000 to Rs.5, 67, 601.98 crores
According to the Association of Mutual Funds in India, the growth of mutual
fund industry has been exceptional. This industry has indeed come a very
long way with only 34 players in the market and more than 480 schemes.
Domestic and Export Share
Despite the growth of Mutual Fund Industry, penetration levels in India are low
as compared to other global economies. Assets under management as a
percentage of GDP is less than 5% in India as compared to 70% in the US,
67% in France and 37% in Brazil.
The industry has grown in size and manages total assets of more than
$30351 million. Of the various sectors, the private sector accounts for nearly
91% of the resources mobilized showing their overwhelming dominance in the
market. Individuals constitute 98.04% of the total number of investors and
contribute US $12062 million, which is 55.16% of the net assets under
management.
19
Employment opportunities
Indian Mutual Fund Industry is playing an active role in the capital market
today and is one of the fastest growing industries in the country. The industry
offers multiple career options to the youths irrespective of their academic
subjects. Graduates from arts, science and commerce can easily find a job in
this promising and growing sector. Due to the participation of private players
and many financial institutions into the mutual funds markets, they have
further widened the scope of employment in this sector. Career in Mutual
19
http://indianresearchjournals.com/pdf/APJMMR/2012/October/19.pdf
21
funds require the minimum qualification of a certification (Advisor Module) and
a registration number from the Associations of Mutual Funds in India (AMFI).
SEBI has made mandatory for any entity or person engaged in marketing and
selling of mutual fund products to pass AMFI certification test (Advisors
Module) and obtain registration number from. This certification remains valid
for 5 years from the date of the test.
Latest developments

20
The Indian mutual funds retail market, growing at a CAGR of about
30%, is forecasted to reach US$ 300 Billion by 2015. 

 Income and growth schemes made up for majority of Assets under
Management (AUM) in the country. At about 84% (as on March 31,
2008), private sector Asset Management Companies account for
majority of mutual fund sales in India. 

 Individual investors make up for 96.86% of the total number of investor
accounts and contribute 36.9% of the net assets under management. 

 The Rs.7.2 trillion Indian Mutual Fund Industry is revisiting its business
model to be in sync with the new norms put in place by the capital
market regulator, the Securities and Exchange Board of India, or SEBI. 

 India has 36 asset management companies (AMCs) and at least some
of them are planning to start their own distribution business instead of
selling funds through third-party distributors. Among other things, they
plan to cut distributors’ commission by 25-30 basis points (bps) and
shift their focus from frequent churning of funds to managing money for
the longer term. One basis point is one-hundredth of a percentage
point. 

 Out of the 32 Crore employed Indians, only 2.5% are investors. Many
investors, particularly youth mostly having the dispensable income opt
for mutual funds to enter into the securities market indirectly. Hence,
potential investors in mutual funds need evaluation not only by financial
institutions but also by academicians so that they can make a right
20
http://www.rncos.com/Report/IM142.htm
22
choice in their investment decisions. 
.
1.4 GROWTH OF MUTUAL FUND INDUSTRY
21
The mutual fund industry in India started in 1963 with the formation of Unit
Trust of India, at the initiative of the Government of India and Reserve Bank of
India. The history of mutual funds in India can be broadly divided into four
distinct phases.
22
Phase I - Establishment and Growth of Unit Trust of
India 1964-87
Unit Trust of India (UTI) was established on 1963 by an Act of Parliament. It
was set up by the Reserve Bank of India and functioned under the Regulatory
and administrative control of the Reserve Bank of India. In 1978 UTI was de-
linked from the RBI and the Industrial Development Bank of India (IDBI) took
over the regulatory and administrative control in place of RBI. The first
scheme launched by UTI was Unit Scheme 1964. At the end of 1988 UTI had
Rs. 6,700 crores of assets under management.
Phase II – Entry of Public Sector Funds
1987-93
1987 marked the entry of non- UTI, public sector mutual funds set up by
public sector banks and Life Insurance Corporation of India (LIC) and General
Insurance Corporation of India (GIC). SBI Mutual Fund was the first non- UTI
Mutual Fund in June 1987 followed by Can bank Mutual Fund (Dec 87),
Punjab National Bank Mutual Fund (Aug 89), Indian Bank Mutual Fund (Nov
89), Bank of India (Jun 90), Bank of Baroda Mutual Fund (Oct 92). LIC
established its mutual fund in June 1989 while GIC had set up its mutual fund
21
http://www.amfiindia.com/research-information/mf-history
22
http://finance.indiamart.com/india_business_information/mutual_funds_industry.html
23
in December 1990. At the end of 1993, the mutual fund industry had assets
under management of Rs. 47,004 crores.
Phase III – Entry of Private Sector Funds
1993-96
With the entry of private sector funds in 1993, a new era started in the Indian
mutual fund industry, giving the Indian investors a wider choice of fund
families. Also, 1993 was the year in which the first Mutual Fund Regulations
came into being, under which all mutual funds, except UTI were to be
registered and governed. The erstwhile Kothari Pioneer (now merged with
Franklin Templeton) was the first private sector mutual fund registered in July
1993.
Phase IV - Growth and SEBI Regulation
1996-04
The number of mutual fund houses went on increasing, with many foreign
mutual funds setting up funds in India and also the industry has witnessed
several mergers and acquisitions. As at the end of January 2003, there were
33 mutual funds with total assets of Rs. 1,21,805 crores. The Unit Trust of
India with Rs. 44,541 crores of assets under management was way ahead of
other mutual funds.
In February 2003, the UTI Act was repealed and UTI was stripped of its
Special legal status as a trust formed by an Act of Parliament. The primary
objective behind this was to bring all mutal fund players on the same level.
UTI was re-organized into two parts: 1. The Specified Undertaking, 2. The UTI
Mutual Fund. UTI Mutual Fund is still the largest player in the industry. In
1999, there was a significant growth in mobilization of funds from investors
and assets under management which is supported by the following data:
TABLE 1.1 GROSS FUND MOBILISATION
24
GROSS FUND MOBILISATION (RS. CRORES)
FROM TO UTI
PUBLIC PRIVATE
TOTAL
SECTOR SECTOR
1-4-98 31-3-99 11,679 1,732 7,966 21,377
1-4-99 31-3-00 13,536 4,039 42,173 59,748
1-4-00 74,35231-3-01 12,413 6,192 92,957
1-4-01 31-3-02 4,643 13,613 1,46,267 1,64,523
1-4-02 31-3-03 5,505 22,923 2,20,551 2,48,979
1-4-03 31-3-03 * 7,259* 58,435 65,694
1-4-03 31-3-04 - 68,558 5,21,632 5,90,190
1-4-04 31-3-05 - 1,03,246 7,36,416 8,39,662
1-4-05 31-3-06 - 1,83,446 9,14,712 10,98,158
TABLE 1.2 ASSETS UNDER MANAGEMENT
ASSETS UNDER MANAGEMENT (RS. CRORES)
AS ON UTI PUBLIC SECTOR
PRIVATE
TOTAL
SECTOR
31-March-99 53,320 8,292 6,860 68,472
25
23
Phase V – Growth
&Consolidation 2004 onwards
The industry has also witnessed several mergers and acquisitions recently,
examples of which are acquisition of schemes of Alliance Mutual Fund by
Birla Sun Life, Sun F&C Mutual Fund and PNB Mutual Fund by Principal
Mutual Fund. Simultaneously, more international mutual fund players have
entered India like Fidelity, Franklin Templeton Mutual Fund etc. There were
29 funds as at the end of March 2006. This is a continuing phase of growth of
the industry through consolidation and entry of new international and private
sector players.
TABLE 1.3 EVOLUTION OF THE INDIAN MF INDUSTRY
Year No of
AMCs
No of
schemes
AUM US
$(mn)
Mar 98 31 235 17451
Mar 98 32 277 16111
23
http://finance.indiamart.com/india_business_information/mutual_funds_industry.html
26
Mar 00 32 337 25889
Mar 01 35 393 19336
Mar 02 35 417 20601
Mar 03 33 382 16719
Mar 04 31 403 32170
Mar 05 29 451 34289
Mar 07 30 756 75728
Mar 08 33 956 126225
0
5
10
15
20
25
30
35
40
No. of AMC
No. of AMC
0
500
1000
1500
No. of Scheme
No. of Scheme
27
24
Factor contributing to the growth of the industry
 Large market potential – high saving rate
 Comprehensive Regulatory framework
 Favorable tax policies
 Introduction of new products
 Role of distributors
 Investor’s education campaign
 Performance record
24
http://smallbusiness.chron.com/factors-affecting-economic-development-growth-1517.html
17451 16111
25889
19336 20601
16719
32170 34289
52127
75728
126225
0
20000
40000
60000
80000
100000
120000
140000
Growth in AUM US $ (mn.)
Grow
th in
AUM
US $
(mn.)
28
CHAPTER – 2
MAJOR COMPANIES
IN MUTUAL FUND
INDUSTRY
2.1 COMPANIES ON THE BASIS OF RETURN
Company NAV Return %
IDFC Premier Equity-A 1376.30 83.2
ING Dividend Yield 36.53 76.8
Reliance RSF – Equity 2722.37 74.2
Birla SL Dividend Yield ( G ) 384.83 69.8
Sundaram S.M.I.L.E Fund 663.86 66.1
29
ICICI Prudential Discovery Fund 1083.58 63.7
HDFC Top 200 Fund 7490.21 63.4
Can Robeco Equity Diversified 323.88 57.8
Quantum Long-Term Equity 53.45 57.1
Baroda Pioneer Growth 52.17 55.7
83.2
76.8 74.2
69.8
66.1 63.7 63.4
57.8 57.1 55.7
Series 1
30
CHAPTER – 3
PRODUCT PROFILE
3.1 TYPES OF MUTUAL FUND
31
25
A Mutual Fund may float several schemes which may be classified on the
basis of its structure, its investment objectives and other objectives.
A) MUTUAL FUND SCHEMES BY STRUCTURE
Open-Ended Funds: Open-Ended fund scheme is open for subscription all
through year. An investor can buy or sell the units at "NAV" (Net Asset Value)
related price at any time.
Close-Ended Funds: A Close-Ended fund is open for subscription only
during a specified period, generally at the time of initial public issue. The
Close-Ended fund scheme is listed on the some stock exchanges where an
investor can buy or sell the units of this type of scheme.
Interval Funds: Interval Funds combines both the features of Open-Ended
funds and Close-Ended funds.
B) MUTUAL FUND SCHEMES BY INVESTMENT OBJECTIVES
25
http://timesofindia.indiatimes.com/articles/Different-Types-and-Kinds-of-Mutual-
Funds/articleshowhsbc/22624820.cms
Type of Mutual Fund
According to Structure
According to
Investment Objective
According to Other
Objective
32
26
Growth Funds: The objective of Growth Fund scheme is to provide capital
appreciation over the medium to long term. This type of scheme is an ideal
scheme for the investors seeking capital appreciation for a long period.
Income Funds: The Income Fund schemes objective is to provide regular
and steady income to investors.
Balanced Funds: The objective of Balanced Fund schemes is to provide both
growth and regular income to investors.
Money Market Funds: The objectives of Money market funds are to provide
easy liquidity, regular income and preservation of income.
C) OTHER FUNDS
27
Tax Saving Schemes: The objective of Tax Saving schemes is to offer tax
rebates to the investors under specific provisions of the Indian Income Tax
Laws. Investments made under some schemes are allowed as deduction u/s
88 of the Income Tax Act.
Industry specific Schemes: Industry specific schemes invest only in the
industries specified in the offer document of the schemes.
Sectorial Schemes: The scheme invest particularly in a specified industries
or initial public offering.
Index schemes: Such schemes links with the performance of BSE sensex or
NSE.
Loan Funds: Loan Funds charges a commission each time when you buy or
sale units in the fund.
26
http://www.assetmanagement.hsbc.com/in/mutual-funds/learning-
centre/faqs/mut_funds_faqs.html
27
http://www.assetmanagement.hsbc.com/in/mutual-funds/learning-
centre/faqs/mut_funds_faqs.html
33
3.2 BENEFITS OF MUTUAL FUNDS
28
Mutual Funds offer several benefits to an investor such as potential return,
liquidity, transparency, income growth, good post tax return and reasonable
safety. There are number of options available for an investor offered by a
mutual fund.
Before investing in a Mutual Fund an investor must identify his needs and
preferences. While selecting a Mutual Fund's schemes he should consider
the effect of inflation rate, diversification of investment, the time period of
investment and the risk factors. There are various types of risk factors as:
 Market Risk 

 Credit Risk 

 Interest Rate Risk 

 Inflation Risk 

 Political Environment 
The major benefits are good post-tax returns and reasonable safety,
the other benefits in investing in Mutual Funds are
Professional Management: Mutual Funds employ the services of
experienced and skilled professionals and dedicated investment research
team. The whole team analyses the performance and balance sheet of
companies and selects them to achieve the objectives of the scheme.
Potential Return: Mutual Funds have the potential to provide a higher return
to an investor than any other option over a reasonable period of time.
Diversification: Mutual Funds invest in a number of companies across a
wide cross section of industries and sectors.
Low Cost: Investment in Mutual Funds is a less expensive way in
comparison to a direct investment in capital market.
28
http://southerncapital.in/benefits_mutualfunds.php
34
Liquidity: The investor can get the money promptly at the net asset value
related prices from the Mutual Funds open-ended schemes. In close-ended
schemes, the units can be sold on a stock exchange at the prevailing market
price.
Transparency: Mutual Funds have to disclose their holdings, investment
pattern and the necessary information before all investors under a regulation
framework.
Flexibility: Investment in Mutual Funds offers a lot of flexibility with features
of schemes such as regular investment plan, regular withdrawal plans and
dividend reinvestment plans enabling systematic investment or withdrawal of
funds.
Affordability: Small investors with low investment fund are unable to high-
grade or blue chip stocks. An investor through Mutual Funds can be benefited
from a portfolio including of high priced stock.
Well regulated: All Mutual Funds are registered with SEBI, and SEBI acts a
watchdog, so the Mutual Funds are well regulated.
3.3 DISADVANTAGES OF MUTUAL FUND
29
Cost: Mutual funds provide investors with professional management, but it
comes at a cost. Funds will typically have a range of different fees that reduce
the overall payout. In mutual funds, the fees are classified into two categories:
shareholder fees and annual operating fees.
30
Misleading Advertisements: The misleading advertisements of different
funds can guide investors down the wrong path. Some funds may be
incorrectly labelled as growth funds, while others are classified as small cap
29
http://mutualfunds.about.com/od/mutualfundbasics/a/disadvmf.htm
30
http://www.investorguide.com/article/11139/disadvantages-of-investing-in-mutual-funds-igu/
35
or income funds. The Securities and Exchange Commission (SEC) requires
that funds have at least 80% of assets in the particular type of investment
implied in their names.
3.4 DIFFERENT PLANS THAT MUTUAL FUND OFFER
31
Growth Plan and Dividend Plan
A growth plan is a plan under a scheme wherein the returns from investments
are reinvested and very few income distributions, if any, are made. The
investor thus only realizes capital appreciation on the investment. This plan
appeals to investors in the high income bracket. Under the dividend plan,
income is distributed from time to time. This plan is ideal to those investors
requiring regular income.
Dividend Reinvestment Plan
Dividend plans of schemes carry an additional option for reinvestment of
income distribution. This is referred to as the dividend reinvestment plan.
Under this plan, dividends declared by a fund are reinvested on behalf of the
investor, thus increasing the number of units held by the investors.
Automatic Investment Plan
Under the Automatic Investment Plan (AIP) also called Systematic Investment
Plan (SIP), the investor is given the option for investing in a specified
frequency of months in a specified scheme of the Mutual Fund for a constant
sum of investment. AIP allows the investors to plan their savings through a
structured regular monthly savings program.
Automatic Withdrawal Plan
Under the Automatic Withdrawal Plan (AWP) also called Systematic
Withdrawal Plan(SWP), a facility is provided to the investor to withdraw a pre-
31
http://www.moneycontrol.com/investor-education/classroom/what-aredifferent-plans-that-
mutual-funds-offer-1022380.html
36
determined amount from his fund at a pre-determined interval.
3.5 FACTORS THAT INFLUENCE THE PERFORMANCE OF
MUTUAL FUND
32
The performances of Mutual funds are influenced by the performance of the
stock market as well as the economy as a whole. Equity Funds are influenced
to a large extent by the stock market. The stock market in turn is influenced by
the performance of the companies as well as the economy as a whole. The
performance of the sector funds depends to a large extent on the companies
within that sector. Bond-funds are influenced by interest rates and credit
quality. As interest rates rise, bond prices fall, and vice versa. Similarly, bond
funds with higher credit ratings are less influenced by changes in the
economy.
33
Expense Ratio
Mutual funds charge fees, sometimes high fees. A mutual fund's EXPENSE
RATIO is the most important fee to understand. And is made up of the
following: The investment advisory fee or management fee is the money used
to pay the manager(s) of the mutual fund. This is usually taken annually as a
percentage of the fund's assets.
Administrative costs are the costs of record keeping, mailings, maintaining a
customer service line, etc. These are all necessary costs, though they vary in
size from fund to fund. Distribution fee: This fee is spent on marketing,
advertising and distribution services.
Only one third of all equity, mutual funds provided returns greater than the
S&P 500, and that was before fees and expenses which range from 0.5% to
2.0% and 2.0%, respectively. After adjustments were made for the riskiness of
a fund, mutual funds were reported as being able to perform up to the market
32
http://www.slideshare.net/navnit1188/performance-evaluation-of-mutual-funds-4912211
33
http://financialplan.about.com/od/investing/a/MutualFundFees.htm
37
on gross returns, but were underperforming, as compared to the market, after
the various expenses were factored in. Many analysts suggested that the
average 1.3% expense ratio of mutual funds and the need for the retainment
of cash as the culprits of such underperformance.
34
Risk
Risk can be a great ally when trying to estimate the reward potential of a stock
investment. The greater the stock volatility, or risk, the greater also is the
reward. There are several new risk measurements that give guidance for
selecting mutual stocks that provide higher returns for lower risk.
35
Time Horizon
The time horizon of an individual will also influence the performance
measures he/she will look at more closely. If you are investing for less than
four years, you need a fund with consistent performance, so all your money
will be there when you need it. You also do not have time to earn back a large
commission charge on the front end.
Conversely, if you plan to invest your money for 30 years, neither consistency
nor load is very important: you have plenty of time for the market to recover.
With a long-term horizon, your biggest enemies are poor performance and
high annual expenses, both of which can erode that all-important
compounding.
34
http://pt.slideshare.net/navnit1188/performance-evaluation-of-mutual-funds-4912211
35
http://pt.slideshare.net/navnit1188/performance-evaluation-of-mutual-funds-4912211
38
PART – 2
PRIMARY STUDY
39
CHAPTER – 4
INTRODUCTION OF
THE STUDY
4.1 LITERATURE REVIEW
40
36
Performance evaluation of mutual funds is one of the preferred areas of
research where a good amount of study has been carried out. The area of
research provides diverse views of the same.
For instance one paper evaluated the performance of Indian Mutual Fund
Schemes in a bear market using relative performance index, risk-return
analysis, Treynor’s ratio, Sharpe’s ratio, Jensen’s measure, Fama’s measure.
The study finds that Medium Term Debt Funds were the best performing
funds during the bear period of September 98-April 2002 and 58 of 269 open
ended mutual funds provided better returns than the overall market returns.
37
Another paper used Return Based Style Analysis (RBSA) to evaluate equity
mutual funds in India using quadratic optimization of an asset class factor
model proposed by William Sharpe and analysis of the relative performance
of the funds with respect to their style benchmarks. Their study found that the
mutual funds generated positive monthly returns on the average, during the
study period of January 2000 through June 2005. The ELSS funds lagged the
Growth funds or all funds taken together, with respect to returns generated.
The mean returns of the growth funds or all funds were not only positive but
also significant. The ELSS funds also demonstrated marginally higher
volatility (standard deviation) than the Growth funds.
One study identified differences in characteristics of public-sector sponsored
& private-sector sponsored mutual funds find the extent of diversification in
the portfolio of securities of public-sector sponsored and private-sector
sponsored mutual funds and compare the performance of public-sector
sponsored and private-sector sponsored mutual funds using traditional
36
http://ebookily.net/pdf/performance-evaluation-of-mutual-funds-i
37
http://www.slideshare.net/subhodeepbandopadhyay/market-risk-and-investment-performance-of-
equity-mutual-funds-in-india
41
investment measures.
38
They primarily use Jensen’s alpha, Sharpe information ratio, excess
standard deviation adjusted return (ESDAR) and find out that portfolio risk
characteristics measured through private-sector Indian sponsored mutual
funds seems to have outperformed both Public- sector sponsored and
Private-sector foreign sponsored mutual funds and the general linear model of
analysis of covariance establishes differences in performance among the
three classes of mutual funds in terms of portfolio diversification.
Another paper examined the performance of equity and bond mutual funds
that invested primarily in the emerging markets using Treynor’s ratio,
Sharpe’s ratio, Jensen’s measure. With this research they found that on an
average the U.S. stock market outperformed emerging equity markets but the
emerging market bonds outperformed U.S. bonds. They also found that
overall emerging market stock funds under-performed the respective MSCI
indexes. These were evident by their lower return, higher risk, and thus lower
Sharpe ratios.
39
One more paper evaluated whether or not the selected mutual funds were
able to outperform the market on the average over the studied time period. In
addition to that by examining the strength of interrelationships of values of
PCMs for successive time periods , the study also tried to infer about the
extent to which the future values of fund performance were related to its past
by using single index model. The study revealed that there were positive
signals of information asymmetry in the market with mutual fund managers
having superior information about the returns of stocks as a whole. PCM also
indicated that on an average mutual funds provided excess (above-average)
return, but only when unit of time period was longer (1 qtr or 4 qtr). Therefore,
they concluded that for assessing the true performance of a particular mutual
fund, a longer time horizon is better.
38
http://pt.slideshare.net/subhodeepbandopadhyay/market-risk-and-investment-performance-of-
equity-mutual-funds-in-india
39
http://www.scribd.com/doc/63093846/Literature-Review-mutual-Funds
42
40
Another study aimed at analyzing performance of select open-ended equity
mutual fund using Sharpe Ratio, Hypothesis testing and return based on
yield. The most important finding of the study had been that only four Growth
plans and one Dividend plan (5 out of the 42 plans studied) could generate
higher returns than that of the market which is contrary to the general opinion
prevailing in the Indian mutual fund market.
41
Even the Sharpe ratios of Growth plans and the corresponding Dividend
plans stand testimony to the relatively better performance of Growth plans.
The statistical tests in terms of F-test and t-Test further corroborate the
significant performance differences between the Growth plans and Dividend
plans.
A similar study examined the empirical properties of performance measures
for mutual funds using Simulation procedures combined with random and
random-stratified samples of NYSE and AMEX securities and other
performance measurement tools employed are Sharpe measure, Jensen
alpha, Treynor measure, appraisal ratio, and Fama-French three-factor model
alpha. The study revealed that standard mutual fund performance was
unreliable and could result in false inferences. In particular, it was easy to
detect abnormal performance and market-timing ability when none exists. The
results also showed that the range of measured performance was quite large
even when true performance was ordinary. This provided a benchmark to
gauge mutual fund performance. Comparisons of their numerical results with
those reported in actual mutual fund studies raised the possibility that
reported results were due to misspecification, rather than abnormal
performance. Finally, the results indicated that procedures based on the
Fama-French 3-factor model were somewhat better than CAPM based
measures.
42
Another paper, analyzed the Indian Mutual Fund Industry pricing mechanism
with empirical studies on its valuation. It also analyzed data at both the fund-
40
http://www.scribd.com/doc/54073147/Research-Report-on-Performance-Evaluation-of-Indian-
Mutual-Funds
41
http://www.scribd.com/doc/57359662/MBA-Project-Work-Performance-Evaluation-of-Mutual-
Fund
42
http://www.edhec-risk.com/site_edhecrisk
43
manager and fund-investor levels. It stated that mispricing of the Mutual funds
could be evaluated by comparing the return on market and return on stock.
During the pricing period, if the return on stock is negative, then it indicates
overpricing and if are positive indicates under pricing. Relative performance
measurement was used to measure the performance of the MF with SENSEX
and it used Standard Deviation, Correlation analysis, Co-efficient of
Determination and Null Hypothesis. This study revealed that standard
deviations of the 3-month returns were significant with the increase in the
period.
4.2 BACKGROUND OF THE STUDY
43
Day by day as business is getting more competitive and so the
43
http://www.scribd.com/doc/84509919/Mutual-Funds
44
management is achieving its importance in every field to increase the
efficiency and to cut down the cost of production. The present day giant
organization is a specialized or expert in all spheres of management. The
importance of specialist from each has emerged, these specialist are often
called as professionals.
44
During last few years or so, financial management which was not
considered so much has now been recognize as an important area. This
change has created importance for the study of financial management which
has lead to various objectives-covered in this research methodology. The
methodology of the project reveals the step-by-step procedure done to carry
out the project study.
45
Mutual Fund is a topic which is of enormous interest not only to researchers
all over the world, but also to investors. Mutual funds as a medium-to-long
term investment option are preferred as a suitable investment option by
investors. However, with several market entrants the question is the choice of
mutual fund. The study focuses on this problem of mutual fund selection by
investors. Though the investment objectives define investor’s preference
among fund types (balanced, growth, dividend etc.) the choice of fund based
on a sponsor’s reputation remains to be probed. We focus on analyzing the
performance of mutual funds by using three models i.e. Sharpe, Treyner and
Jensen.
4.3 PROBLEM STATEMENT AND IMPORTANCE OF THE
STUDY
44
http://www.siescoms.edu/journals/siescoms/Journal4.pdf
45
http://www.ukessays.co.uk/essays/finance/history-of-mutual-funds.php
45
46
There are so many investment avenues. So that investors does not know
which avenues provides best return. As per the financial rule of “Do not put all
the eggs in one basket” investor’s portfolio are most diversified. So that risk
should be minimized. If the person do not have knowledge of how to get
maximum return with minimum risk or vice-versa then they should be invest in
mutual fund. There are so many funds and schemes are available in mutual
fund market. Investors know that how much risk they can take. Based on that
they have to choose schemes. Problem is that chosen scheme provides the
best return as compare to the market and other schemes. For that certain
model available Sharpe’s model, Treynor’s model and Jenson’s model. These
models are suggested that which schemes provide best return.
47
Importance of the study is that a fund’s performance can be judged with
respects to investors’ expectation. Investors have to define his expectations in
relation to certain indicators on what is possible to achieve or moderate this
with comparable investment alternatives available in the market. These
indicators of performance can acts against investors fund performance. It is
very important to select the right benchmark to evaluate a fund’s performance.
So the problem arises that in which scheme they should invest according to
their preferences.
4.4 OBJECTIVES OF THE STUDY
46
http://www.scribd.com/doc/84509919/Mutual-Funds
47
http://www.evelexa.com/resources/EGBS4_Kolchinsky.pdf
46
The primary object of the present project is to know about which mutual funds
gave highest performance in a short-term period.
 To know about types of mutual funds in detail. 

 To know, which schemes gives highest return within one-year. 

 To find the extent of diversification in the portfolio of securities of
sponsored mutual funds. 

 To compare the performance of sponsored mutual funds using
traditional investment measures. 
In general, Mutual Funds are not considered to be too risky because they
invest in dozens or even hundreds of stocks. But Mutual Funds being market-
linked are prime candidates for stock market related risks. The four aspects
that you should take into account while analyzing risk in Mutual Fund
investment are volatility of the fund as indicated by the Standard Deviation,
risk-adjusted returns as calculated by the Sharpe Ratio, Beta and Alpha.
Standard Deviation shows the degree of risk taken on by the fund, Sharpe
Ratio shows the return generated by the fund per unit of risk taken. Beta
shows how much a fund moves when compared to an appropriate index.
Alpha represents the difference between a Mutual Fund's actual performance
and the performance that would be expected based on the level of risk taken
by the manager.
A Fund with low risk is the one with the lowest Standard Deviation, the
highest Sharpe Ratio within its peer group, Beta closer to one and Alpha
above one. It is advisable for you to evaluate these measures on a historical
basis so as to identify the most consistent performers.
47
CHAPTER – 5
RESEARCH
METHODOLOGY
5.1 RESEARCH DESIGN
48
Research Design is the roadmap for carrying out the research activity in the
project. In our project of “Performance Evaluation of Mutual Fund” we have
carried out the research of which mutual fund is providing higher return by
comparing the returns of different mutual funds and we have also compared
whether the mutual fund can beat the market return or not.
For this research activity
 We have selected 10 mutual funds from Indian market. All funds are in
equity growth category. 

 Data has been collected from money control, value research online,
and mutual fund India web sites. 

 Funds selected are mostly preferable by investors. 


 Treasury bill rate of return is selected as risk free return, which is 8.5%
p.a. 

 Collected NAV of funds of each quarter for the year 2013 and define
return. 

 Defined standard deviation on the basis of Quarterly return. 

 Found out average return. 


 Defined beta of funds and market, S&P CNX Nifty index return is taken
as market return. 

 Found out Treynor, Sharpe and Jensen ratio and performance. 

 Finally we have given rank to mutual funds according to each ratio. 
5.2 SOURCES OF DATA
49
Here in this research project we have used Secondary source of data as the
return for different mutual funds and market cannot be established by
ourselves.
5.3 DATA COLLECTION METHOD
Here in this research project we have used data which were published on the
websites of Bombay stock exchange, Money control, value research online,
National stock exchange and mutual fund India.
5.4 POPULATION
Population is a collection of items of interest in research. The population
represents a group that you wish to generalize your research to.
Here in this research project we have taken the population of 46 mutual fund
house in India. Out of 46 we have selected 6 fund houses on the asset under
management basis. 10 Funds across 6 fund houses have been selected. This
population is based on the type of mutual fund i.e. “Equity Growth mutual
funds”
There are various schemes available in the mutual fund like debt, equity,
balanced, guilt etc. But out of these schemes we have selected Equity growth
scheme as a population.
5.5 SAMPLING METHOD
The random sample
50
Convenient sample is one of the main types of non probability sampling
method. A convenience sample is made up of people who are easy to reach.
Consider the following example. A pollster interviews shoppers at a local mall.
If the mall was chosen because it was a convenient site from which to solicit
survey participants and/or because it was close to the pollster's home or
business, this would be a convenience sample.
Here in this research project we have used convenient sample method for
sampling. We have taken the Sample of “10 Equity Growth mutual funds”
on the basis of their highest annual average return in the year 2013.
51
CHAPTER – 6
DATA ANALYSIS AND
INTERPRETATION
6.1 ANALYSIS OF MUTUAL FUND PERFORMANCE
52
Mutual fund performance can be analyzed through performance
measurement ratios which are use in portfolio analysis. We here are using
Treynor, Sharpe, and Jensen ratio to evaluate mutual funds and rank
accordingly. Composite portfolio performance measures have the flexibility of
combining risk and return performance into a single value. The most
commonly used composite measures are: Treynor, Sharpe and Jensen
measures. While Treynor measures only the systematic risk summarized by
beta, Sharpe concentrates on total risk of the mutual fund.
TREYNER’S PERFORMANCE INDEX
Treynor (1965) was the first researcher developing a composite measure of
portfolio performance. He measures portfolio risk with beta, and calculates
portfolio’s market risk premium relative to its beta:
Where:
Ti = Treynor’s Performance Index
Rp = Portfolio’s actual return during a specified time period
Rf = Risk-free rate of return during the same period
βp = beta of the portfolio
Whenever Rp> Rf and βp > 0 a larger T value means a better portfolio for all
investors Regardless of their individual risk preferences. In two cases we may
have a negative T value: when Rp < Rf or when βp < 0. If T is negative
because Rp < Rf we judge the portfolio performance as very poor. However, if
the negativity of T comes from a negative beta, fund’s performance is
superb. Finally when Rp- Rf, and βp are both negative, T will be positive.
53
Demonstration of Comparative Treynor Measures
Assume we have the following data for three mutual funds; ZBY, with their
respective annual rate of return and systematic risk, Beta. The risk free rate
is 8 %. The systematic risk for M (market) is 1.0 and the rate of return for M
is 14%.
Investment Manager Rate of Return Beta
Z 0.12 0.90
B 0.16 1.05
Y 0.18 1.2
M 0.14 1.0
Table 6.1
We can calculate the T values for each investment manager:
TM (0.14-0.08) / 1.00 = 0.06
TZ (0.12-0.08) / 0.90 = 0.044
TB (0.16-0.08) / 1.05 = 0.076
TY (0.18-0.08) / 1.20 =0.083
Table 6.2
These results show that Z did not even "beat-the-market." Y had the
best performance, and both B and Y beat the market
SAMPLE OF 10 MUTUAL FUNDS
54
Company Avg. return of 2013
ICICI prudential technology Reg 62.55 %
SBI IT 54.50 %
Franklin InfoTech 53.34 %
Birla sun life new millennium 50.25 %
ICICI prudential export & other services Reg 43.59 %
SBI Pharma 26.05 %
UTI transportation & logistics 24.69 %
Reliance Pharma 20.87 %
Franklin India smaller companies 13.22 %
SBI FMCG 9.29 %
TREYNER’S PERFORMANCE INDEX
55
Comapny Rp Rf Beta Treynor
Index
ICICI prudential technology Reg 62.55 % 8.5 % 0.35 154.428
SBI IT 54.50 % 8.5 % 0.81 56.790
Franklin InfoTech 53.34 % 8.5 % 0.93 48.215
Birla sun life new millennium 50.25 % 8.5 % 0.53 78.773
ICICI prudential export & other
services Reg
43.59 % 8.5 % 0.62 56.596
SBI Pharma 26.05 % 8.5 % 0.92 19.076
UTI transportation & logistics 24.69 % 8.5 % 3.17 5.107
Reliance Pharma 20.87 % 8.5 % 1.64 7.542
Franklin India smaller companies 13.22 % 8.5 % 2.34 2.017
SBI FMCG 9.29 % 8.5 % 0.11 7.181
RANKING ACCORDING TO TREYNER
56
Rank Particular
1 ICICI prudential technology Reg
2 Birla sun life new millennium
3 SBI IT
4 ICICI prudential export & other services Reg
5 Franklin InfoTech
6 SBI Pharma
7 Reliance Pharma
8 SBI FMCG
9 UTI transportation & logistics
10 Franklin India smaller companies
INTERPRETATION
In our analysis we have given ranks on the basis of higher Treyner’s index.
Higher Treyner’s index gets 1st
rank. Treyner’s performance index measures
(Beta) systematic risk of portfolio. This model does not consider total risk
(systematic risk + unsystematic risk).
In our analysis we have found out that SBI FMCG fund – growth has
lower beta i.e. 0.21 as compared to other nine funds. Same way UTI
transportation & logistic has higher beta i.e. 3.17.
This analysis represents that SBI FMCG fund – growth gets higher Treyner’s
performance index and it stands on eighth rank. Same way UTI transportation
& logistic – growth gets lower Treyner’s performance index and it stands on
9th
rank.
57
This analysis also represents that though ICICI prudential technology Reg
fund growth has higher return i.e. 62.55 % as compared to other nine funds, it
stands on third rank as it is having higher beta i.e. 0.35.
Thus at last we want to conclude that according to Treyner’s Performance
Index, it is not necessary that fund with higher return is always well performing
fund and stands on first rank because we also have to consider risk
associated with that fund.
SHARPE’S PERFORMANCE INDEX
Sharpe (1966) developed a composite index which is very similar to the
Treynor measure, the only difference being the use of standard deviation,
instead of beta, to measure the portfolio risk, in other words except it uses the
total risk of the portfolio rather than just the systematic risk.
Where:
Si = Sharpe performance index
= Portfolio standard deviation
Sharpe index, evaluates funds performance based on both rate of return and
diversification. For a completely diversified portfolio Treynor and Sharpe
indices would give identical rankings.
Demonstration of Comparative Sharpe Measures
Assume we have the following data for three portfolios; BOP, with their
respective annual rate of return and standard deviation of their return.
58
The risk free rate is 8 %. The standard deviation for M (market) is 0.20
and the rate of return for M is 14%.
Portfolio Annual rate of Return S.D of Return
B 0.13 0.18
O 0.17 0.22
P 0.16 0.23
M 0.14 0.20
Table 6.6
We can calculate the S values for each portfolio.
B (0.13-0.08) / 0.18 = 0.278
O (0.17-0.08) / 0.22 = 0.409
P (0.16-0.08) / 0.23 = 0.348
M (0.14-0.08) / 0.20 = 0.30
Table 6.7
Thus, portfolio O did the best, and B failed to beat the market.
The trouble with both Sharpe and Treynor techniques for evaluating "risk-
adjusted" returns is that they equate risk with short-term volatility.
Therefore these measures may not be applicable in evaluating the
relative merits of long-term investments
SHARPE’S PERFORMANCE INDEX
59
Company Rp Rf Standard
Deviation
Sharpe’s
Index
ICICI prudential technology Reg 62.55 % 8.5 % 12.50 4.324
SBI IT 54.50 % 8.5 % 11.31 4.067
Franklin InfoTech 53.34 % 8.5 % 11.38 3.940
Birla sun life new millennium 50.25 % 8.5 % 9.40 4.441
ICICI prudential export & other
services Reg
43.59 % 8.5 % 7.04 4.984
SBI Pharma 26.05 % 8.5 % 5.16 3.401
UTI transportation & logistics 24.69 % 8.5 % 15.07 1.074
Reliance Pharma 20.87 % 8.5 % 7.53 1.642
Franklin India smaller companies 13.22 % 8.5 % 10.84 0.435
SBI FMCG 9.29 % 8.5 % 2.84 0.278
RANKING ACCORDING TO SHARPE
60
Rank Particular
1 ICICI prudential export & other services Reg
2 Birla sun life new millennium
3 ICICI prudential technology Reg
4 SBI IT
5 Franklin InfoTech
6 SBI Pharma
7 Reliance Pharma
8 UTI transportation & logistics
9 Franklin India smaller companies
10 SBI FMCG
INTERPRETATION
In our analysis we have given ranks on the basis of higher Sharpe’s index.
Higher Sharpe’s index gets 1
st
rank. Sharpe’s performance index measures
standard deviation of portfolio. This model considers total risk i.e. both
systematic risk and unsystematic risk.
In our analysis we have found out that Reliance Pharma fund – growth has a
return of 9.29 % and on the basis of return it stands on seventh rank but its
standard deviation is 2.84 which is lower as compared to other nine funds.
This thing indicates that ICICI prudential export and other service Reg Fund
stands on first rank because it is providing good return with moderate risk.
61
We have analyzed that SBI FMCG Fund – growth plan also has lower
standard deviation and then also it stands on last rank according to Sharpe’s
performance index. The reason behind this is that this fund is providing lower
return as compared to other nine funds. This thing indicates that SBI FMCG
Fund stands on last rank because it is providing lower return with lower risk.
Thus at last we want to conclude that according to Sharpe’s Performance
Index, it is not necessary that fund with higher return is always well performing
fund and stands on first rank because we also have to consider risk
associated with that fund. Further return of fund should also be good enough;
it should not be so lower.
JENSEN’S ALPHA
Jensen (1968), on the other hand, writes the following formula in terms of
realized rates of return, assuming that CAPM is empirically valid.
Jensen uses α as his performance measure. A superior portfolio manager
would have a significant positive α value because of the consistent positive
residuals. Inferior managers, on the other hand, would have significant
negative α. Average portfolio managers having no forecasting ability but, still,
cannot be considered inferior would earn as much as one could expect on the
basis of the CAPM.
Jensen performance criterion, like the Treynor measure, does not evaluate
the ability of portfolio managers to diversify, since the risk premiums are
calculated in terms of β.
If the value is positive, and then the portfolio is earning excess returns. In
other words, a positive value for Jensen's alpha means a fund manager has
62
beat the market with his or her stock picking skills.
JENSEN’S PERFORMANCE INDEX
63
Particular Rp Rf Rm Beta Jensen’s
Index
ICICI prudential technology Reg 62.55 % 8.5 % 5.72 % 0.35 55.023
SBI IT 54.50 % 8.5 % 5.72 % 0.81 48.2518
Franklin InfoTech 53.34 % 8.5 % 5.72 % 0.93 47.4254
Birla sun life new millennium 50.25 % 8.5 % 5.72 % 0.53 43.2234
ICICI prudential export & other
services Reg
43.59 % 8.5 % 5.72 % 0.62 36.8136
SBI Pharma 26.05 % 8.5 % 5.72 % 0.92 20.0616
UTI transportation & logistics 24.69 % 8.5 % 5.72 % 3.17 25.0026
Reliance Pharma 20.87 % 8.5 % 5.72 % 1.64 16.9292
Franklin India smaller companies 13.22 % 8.5 % 5.72 % 2.34 11.2252
SBI FMCG 9.29 % 8.5 % 5.72 % 0.11 1.0958
64
RANKING ACCORDING TO JENSEN
Rank Particular
1 ICICI prudential technology Reg
2 SBI IT
3 Franklin InfoTech
4 Birla sun life new millennium
5 ICICI prudential export & other services Reg
6 UTI transportation & logistics
7 SBI Pharma
8 Reliance Pharma
9 Franklin India smaller companies
10 SBI FMCG
INTERPRETATION
In our analysis we have given ranks on the basis of higher Jensen’s index.
Higher Jensen’s index gets 1
st
rank. Jensen’s performance index measures
alpha of portfolio. This model indicates that higher the value of alpha, higher is
the ability of a fund manager to select good fund.
We have analyzed that alpha of ICICI prudential technology Reg– growth is
very high i.e. 62.55 % as compared to other nine funds and it stands on first
rank. This positive value of alpha indicates that fund manager is able to select
ICICI prudential technology Reg fund as a good fund.
We have also analyzed that alpha of SBI FMCG Fund is lower. This may be
due to its lower return. Thus though the risk associated with SBI FMCG Fund
is lower, its alpha value is lower because of its lower return.
Finally we want to conclude that according to Jensens’s alpha, the value of
65
alpha not only depends on the return of the fund but also on the risk
associated with that fund. Value of alpha should be always positive.
COMPARISION OF TREYNOR, SHARPE & JENSEN’S INDEX
Rank Treynor Rank Sharpe Rank Jensen
1 ICICI prudential
technology Reg
1 ICICI prudential
export & other
services Reg
1 ICICI prudential
technology Reg
2 Birla sun life new
millennium
2 Birla sun
lifenew
millennium
2 SBI IT
3 SBI IT 3 ICICI prudential
technology Reg
3 Franklin InfoTech
4 ICICI prudential
export & other
services Reg
4 SBI IT 4 Birla sun life new
millennium
5 Franklin InfoTech 5 Franklin
InfoTech
5 ICICI prudential
export & other
services Reg
6 SBI Pharma 6 SBI
Pharma
6 UTI transportation &
logistics
7 Reliance Pharma 7 Reliance
Pharma
7 SBI Pharma
8 SBI FMCG 8 UTI transportation
& logistics
8 Reliance Pharma
9 UTI
transportation &
logistics
9 Franklin India
smaller companies
9 Franklin India smaller
companies
10 Franklin India
smaller
companies
10 SBI FMCG 10 SBI FMCG
ANALYSIS
66
The fact that Sharpe uses Standard deviation as a measurement of risk
which is the total risk and Treynor uses Beta or systematic risk, but yet it is
claimed that, if we are examining a well-diversified portfolio, the rankings
should be similar for all three methods. Due to this interesting theory we
have decided to analyze the performance of the portfolios and they will be
ranked identically according to all three; Sharpe’s, Treynor’s and Jensen’s
performance measurement. ICICI prudential technology Reg fund – growth
get 1
st
rank from all three method.
From this analysis we have found out similarity in Sharpe and Jensen’s
model because more schemes are on similar positions in these two
models. Another reason behind this is that Sharpe measures total risk and
Jensen measures the predictive ability of manager, where manager always
consider total risk while selecting the security. Due to this reason both
models indicate similar positions for more schemes.
67
CHAPTER – 7
RESULT AND
FINDING
The study done on the performance evaluation of Indian mutual funds was
fruitful as all the objectives of the study were successfully achieved. The
68
following are the findings from this study.
 The schemes selected for the study gave returns in coordination with
the markets. When there was boom in the stock market the funds gave
positive returns a little more than what the market had given. During
the recessionary phase the markets declined steadily and so did the
fund returns. Overall the fund returns and the market returns, for the
period of 1 year taken into consideration for this study. 


 Mostly all the mutual fund schemes are able to beat the market. That
means the schemes are well diversified. 


 From the entire 10 schemes best scheme is ICICI prudential
technology Reg fund growth because in all the two models it stands on
1
st
rank and also it provides good return. 
From this analysis we have found out similarity in Sharpe and Jensen’s model
because more schemes are on similar positions in these two models. Another
reason behind this is that Sharpe measures total risk and Jensen measures
the predictive ability of manager, where manager always consider total risk
while selecting the security. Due to this reason both models indicate similar
positions for more schemes.
69
CHAPTER – 8
LIMITATION OF THE
STUDY

70
 We have selected 6 fund houses out of 46 fund houses due to time
constrains. We have not studied all types of mutual fund of 46 fund
houses. We have studied only equity growth fund. We also have not
studied all schemes of 6 mutual fund houses. These schemes we have
selected randomly. 


 Since the funds selected for this study were open ended equity based
growth mutual funds the fund composition kept on changing over the time
period, so it became difficult to understand the fund properties as historical
data pertaining to the fund structure was not available. 


 Because of unavailability of historical data and fund composition it was
difficult to ascertain the performance of the fund properties and a simple
evaluation was done against the market performance. 
71
CHAPTER – 9
CONCLUSION AND
SUGGESTON
Mutual funds are one of the most highly growing products in financial services
market. Mutual funds are suitable for all types of investors from risk adverse
to risk bearer. Mutual funds have many options of return, risk free return,
72
constant return, market associated returned. Mutual funds are suitable to all
age of investors, businessmen, salary person, etc. Investors need not to be
expert in equity market; mutual funds can satisfy their need. Fund managers
are expert in this area and invest fund in well diversified portfolio, high return
with low risk is possible inn mutual fund.
In today’s world, investors are showing more trust in mutual fund than any
other financial product. There is no need of a financial consultant, if you have
good knowledge of mutual funds and their type to invest.
Mutual fund is subject to market risk, despite of that it have low risk than stock
market. This is proved in performance evaluation section of this report.
Performance evaluation measurement ratios i.e. Treynor’s, Sharpe’s and
Jensen’s are used by fund managers to take decision of investment and to
diversify portfolio.
 Mutual Fund is subject to market risk, analyzing particular fund before
investing. 


 Study historical return of funds, risk measurement ratios to evaluate
fund. 


 There should be similarity in your and fund’s objective. 



 For high return invest in diversified funds, for tax saving invest in ELSS
equity funds, for moderate risk and return invest in balance funds, for
assure return invest in debt and liquid funds. 


 As per our opinion, investor should invest around 30% in mutual fund. 
73
ANNEXURE
Appendix-1
74
1.1 RETURNS OF MUTUAL FUNDS FOR THE YEAR 2013
ICICI prudential technology Reg
Quarter Mutual Fund Return
Q1 10.18
Q2 -5.34
Q3 24.12
Q4 25.58
SBI IT
Quarter Mutual Fund Return
Q1 17.41
Q2 -7.24
Q3 21.45
Q4 16.81
Franklin InfoTech
Quarter Mutual Fund Return
Q1 16.70
Q2 -7.18
Q3 22.89
Q4 15.19
Birla sun life new millennium
75
Quarter Mutual Fund Return
Q1 11.73
Q2 -4.31
Q3 20.03
Q4 17.08
ICICI prudential export and other service Reg
Quarter Mutual Fund Return
Q1 2.59
Q2 2.73
Q3 17.03
Q4 16.43
SBI Pharma
Quarter Mutual Fund Return
Q1 -2.69
Q2 10.43
Q3 7.57
Q4 9.04
UTI Transportation and logistic
76
Quarter Mutual Fund Return
Q1 -10.76
Q2 4.09
Q3 2.63
Q4 30.79
Reliance Pharma
Quarter Mutual Fund Return
Q1 -6.04
Q2 7.12
Q3 4.40
Q4 15.02
Franklin India smaller companies
Quarter Mutual Fund Return
Q1 -7.79
Q2 3.07
Q3 -1.75
Q4 21.25
SBI FMCG
77
Quarter Mutual Fund Return
Q1 -0.88
Q2 5.71
Q3 4.45
Q4 -0.13
1.2 RETURN OF INDEX FOR THE YEAR 2013
Quarter Index
Q1 -5.1967
Q2 2.4156
Q3 -2.0870
Q4 6.4537
Appendix 2
78
2.1 CALCULATION OF BETA
Beta is the measure of volatility of a stock, fund, portfolio, etc with respect
to the market. If the beta is positive then the fund returns are directly
proportional to the market returns and if the beta is negative then the fund
returns are inversely proportional to the market.
Formula:
Where,
βa = fund beta
Cov (ra,rp) = covariance of the returns of the fund and the
market, Var rp = variance of the market returns.
ICICI prudential technology Reg
Quarter Mutual Fund Return Index Beta
Q1 10.18 -5.1967
Q2 -5.34 2.4156 0.35
Q3 24.12 -2.0870
Q4 25.58 6.4537
SBI IT
79
Quarter Mutual Fund Return Index Beta
Q1 17.41 -5.1967
Q2 -7.24 2.4156 0.81
Q3 21.45 -2.0870
Q4 16.81 6.4537
Franklin InfoTech
Quarter Mutual Fund Return Index Beta
Q1 16.70 -5.1967
Q2 -7.18 2.4156 0.93
Q3 22.89 -2.0870
Q4 15.19 6.4537
Birla sun life new millennium
Quarter Mutual Fund Return Index Beta
Q1 11.73 -5.1967
Q2 -4.31 2.4156 0.53
Q3 20.03 -2.0870
Q4 17.08 6.4537
ICICI prudential export and other service Reg
80
Quarter Mutual Fund Return Index Beta
Q1 2.59 -5.1967
Q2 2.73 2.4156 0.62
Q3 17.03 -2.0870
Q4 16.43 6.4537
SBI Pharma
Quarter Mutual Fund Return Index Beta
Q1 -2.69 -5.1967
Q2 10.43 2.4156 0.92
Q3 7.57 -2.0870
Q4 9.04 6.4537
UTI Transportation and logistic
Quarter Mutual Fund Return Index Beta
Q1 -10.76 -5.1967
Q2 4.09 2.4156 3.17
Q3 2.63 -2.0870
Q4 30.79 6.4537
Reliance Pharma
81
Quarter Mutual Fund Return Index Beta
Q1 -6.04 -5.1967
Q2 7.12 2.4156 1.64
Q3 4.40 -2.0870
Q4 15.02 6.4537
Franklin India smaller companies
Quarter Mutual Fund Return Index Beta
Q1 -7.79 -5.1967
Q2 3.07 2.4156 2.34
Q3 -1.75 -2.0870
Q4 21.25 6.4537
SBI FMCG
Quarter Mutual Fund Return Index Beta
Q1 -0.88 -5.1967
Q2 5.71 2.4156 0.11
Q3 4.45 -2.0870
Q4 -0.13 6.4537
2.1 CALCULATION OF STANDARD DEVIATION
82
Standard Deviation is a tool which measures the variability of data the set. It is
calculated to measure the riskiness of a fund, stock or portfolio. Higher the
standard deviation means higher the risk and higher the returns of the asset and a
low standard deviation mans that the asset is less risky and will generate less
returns.
The standard deviation of the fund returns are calculated with the following formula:
Where,
S = Standard Deviation
N = number of quarters in the period
X = mean of the period’s return
Xi = return of the corresponding week.
ICICI prudential technology Reg
Quarter x x ( x - x ) ( x - x )² Standard
deviation
Q1 10.18 13.635 -3.455 11.9370
Q2 -5.34 13.635 -18.975 360.0506
Q3 24.12 13.635 10.485 109.9352
Q4 25.58 13.635 11.945 142.6830
Total Σ x =54.54 Σ( x - x )² =
624.6058
12.50
SBI IT
83
Quarter x x ( x - x ) ( x - x )² Standard
deviation
Q1 17.41 12.1075 5.3025 28.1165
Q2 -7.24 12.1075 -19.3475 374.3257
Q3 21.45 12.1075 9.3425 87.2823
Q4 16.81 12.1075 4.7025 22.1135
Total Σ x = 48.43 Σ( x - x )² =
511.8380
11.31
Franklin InfoTech
Quarter x x ( x - x ) ( x - x )² Standard
deviation
Q1 16.70 11.9 4.8 23.04
Q2 -7.18 11.9 -19.08 364.0464
Q3 22.89 11.9 10.99 120.7801
Q4 15.19 11.9 3.29 10.8241
Total Σ x = 47.6 Σ( x - x )² =
518.6906
11.38
Birla sun life new millennium
Quarter x x ( x - x ) ( x - x )² Standard
deviation
Q1 11.73 11.1325 0.5975 0.3570
Q2 -4.31 11.1325 -15.4425 238.4708
Q3 20.03 11.1325 8.8975 79.1655
Q4 17.08 11.1325 5.9475 35.3727
Total Σ x = 44.53 Σ( x - x )² =
353.3660
9.40
84
ICICI prudential export and other service Reg
Quarter x x ( x - x ) ( x - x )² Standard
deviation
Q1 2.59 9.695 -7.105 50.4810
Q2 2.73 9.695 -6.965 48.5112
Q3 17.03 9.695 7.335 53.8022
Q4 16.43 9.695 6.735 45.3602
Total Σ x = 38.78 Σ( x - x )² =
198.1547
7.0383
SBI Pharma
Quarter x x ( x - x ) ( x - x )² Standard
deviation
Q1 -2.69 6.0875 -8.7775 77.0445
Q2 10.43 6.0875 4.3425 18.8573
Q3 7.57 6.0875 1.4825 2.1978
Q4 9.04 6.0875 2.9525 8.7172
Total Σ x = 24.35 Σ( x - x )² =
106.8168
5.1676
UTI Transportation and logistic
Quarter x x ( x - x ) ( x - x )² Standard
deviation
Q1 -10.76 6.6875 -17.4475 304.4152
Q2 4.09 6.6875 -2.5975 6.7470
Q3 2.63 6.6875 -4.0575 16.4633
Q4 30.79 6.6875 24.1025 580.9305
Total Σ x = 26.75 Σ( x - x )² =
908.5560
15.0711
85
Reliance Pharma
Quarter x x ( x - x ) ( x - x )² Standard
deviation
Q1 -6.04 5.125 -11.165 124.6572
Q2 7.12 5.125 1.995 3.9800
Q3 4.40 5.125 -0.725 0.5256
Q4 15.02 5.125 9.895 97.9110
Total Σ x = 20.5 Σ( x - x )² =
227.0739
7.5344
Franklin India smaller companies
Quarter x x ( x - x ) ( x - x )² Standard
deviation
Q1 -7.79 3.695 -11.485 131.9052
Q2 3.07 3.695 -0.625 0.3906
Q3 -1.75 3.695 -5.445 29.6480
Q4 21.25 3.695 17.555 308.1780
Total Σ x = 14.78 Σ( x - x )² =
470.1219
10.8411
SBI FMCG
Quarter x x ( x - x ) ( x - x )² Standard
deviation
Q1 -0.88 2.2875 -3.1675 10.0330
Q2 5.71 2.2875 3.4225 11.7135
Q3 4.45 2.2875 2.1625 4.6764
Q4 -0.13 2.2875 -2.4175 5.8443
Total Σ x = 9.15 Σ( x - x )² =
32.2672
2.8402
86
BIBLIOGRAPHY
BOOKS AND PAPERS
Reilly / Brown “Investments Analysis and Portfolio Management”, Ch 25
“Evaluation of Portfolio Performance” Page No: - 1040 – 1051
Fisher and Jordan “Security analysis and portfolio management”, Ch 20
“Managed portfolio and performance measurements” Page No: - 663 - 677
S. Kevin “Portfolio Management”, Ch 14 “Portfolio Evaluation” Page No: -
197 - 212
Dr. Rao, Narayan “Performance Evaluation of Indian Mutual Funds”,
www.ssrn.com, paper no.433100 and PP.1-24
Prof. Banerjee, Ashok et. Al (2007),”Performance Evaluation of Indian
Mutual Funds vis-à-vis their style benchmarks”, www.ssrn.com, paper
no.962827 and PP.1-18
c
Bhattacharjee,Kaushik and Prof. Roy,Bijan (2006), “Fund Performance
Measurement Without Benchmark - A Case Of Select Indian
Mutual Funds”, www.ssrn.com, paper no.962035 and PP. 1-10
Ahmed,Parvez; Gangopadhyay, Partha & Nanda, Sudhir (2001),
“Performance of Emerging Market Mutual Funds”, www.ssrn.com, paper
no.289278 and PP. 1-41
87
Rao,D.N. (2006), “4 Step model to evaluate performance of Mutual Funds
in Saudi Arabia” www.ssrn.com, paper no.946937 and PP. 1-16
Kothari,S.P. and Warner,Jerold (1997), “Evaluating Mutual Fund
Performance”, www.ssrn.com, paper no.75871 and PP. 1-46
Agrawal,Deepak (2007), “Measuring Performance of Indian Mutual funds”,
www.ssrn.com, paper no.1311761 and PP. 1-17
Websites
www.articlebase.com
www.amfiindia.com
www.financeresearch.net
www.finance.indiamart.com
www.bseindia.com
www.nseindia.com
www.karvy.com
www.moneycontrol.com
www.mutualfundsindia.com
www.amfiindia.com
www.ssrn.com
1
http://goldentalk.com/archive/index.html/t-41439.html
2
http://indianresearchjournals.com/pdf/IJMFSMR/2012/February/ijm-6.pdf
3
http://www.studymode.com/essays/Mutual-Funds-883302.html
4
http://www.mergersandinquisitions.com/hedge-funds-institutional-asset-management
5
http://www.moneycontrol.com/investor-education/classroom/knowhistory-
structureadvantagesmutual-funds-724370.html
6
http://www.moneycontrol.com/investor-education/classroom/knowhistory-
structureadvantagesmutual-funds-724370.html
7
http://www.getcited.org/pub/103509466
88
8
http://pt.slideshare.net/subhodeepbandopadhyay/market-risk-and-investment-performance-of-
equity-mutual-funds-in-india
9
http://www.scribd.com/doc/27550490/Dissertation-on-Past-Performance-of-Mutual-Funds
10
http://www.slideshare.net/hemanthcrpatna/finance-project-on-performance-evaluation-of-indian-
mutual-funds
11http://www.capitalmarket.com/mutual/mf-faqa.htm
12
http://www.ashishbusiness.in/mutual-funds
13
https://www.sec.gov/about/offices/oia/oia_investman/rplaze-042012.pdf
14
http://www.capitalmarket.com/mutual/mf-faqa.htm
15
http://my-people.net/mutual-fund-industry/
16
http://my-people.net/mutual-fund-industry/
17
http://businesstoday.intoday.in/story/mutual-fund-schemes-and-offers-in-coming-
months/1/19520.html
18
http://indianresearchjournals.com/pdf/APJMMR/2012/October/19.pdf
19
http://indianresearchjournals.com/pdf/APJMMR/2012/October/19.pdf
20
http://www.rncos.com/Report/IM142.htm
21
http://www.amfiindia.com/research-information/mf-history
22
http://finance.indiamart.com/india_business_information/mutual_funds_industry.html
23
http://finance.indiamart.com/india_business_information/mutual_funds_industry.html
24
http://smallbusiness.chron.com/factors-affecting-economic-development-growth-1517.html
25
http://timesofindia.indiatimes.com/articles/Different-Types-and-Kinds-of-Mutual-
Funds/articleshowhsbc/22624820.cms
26
http://www.assetmanagement.hsbc.com/in/mutual-funds/learning-
centre/faqs/mut_funds_faqs.html
27
http://www.assetmanagement.hsbc.com/in/mutual-funds/learning-
centre/faqs/mut_funds_faqs.html
28
http://southerncapital.in/benefits_mutualfunds.php
29
http://mutualfunds.about.com/od/mutualfundbasics/a/disadvmf.htm
30
http://www.investorguide.com/article/11139/disadvantages-of-investing-in-mutual-funds-igu/
31
http://www.moneycontrol.com/investor-education/classroom/what-aredifferent-plans-that-
mutual-funds-offer-1022380.html
32
http://www.slideshare.net/navnit1188/performance-evaluation-of-mutual-funds-4912211
33
http://financialplan.about.com/od/investing/a/MutualFundFees.htm
34
http://pt.slideshare.net/navnit1188/performance-evaluation-of-mutual-funds-4912211
35
http://pt.slideshare.net/navnit1188/performance-evaluation-of-mutual-funds-4912211
36
http://ebookily.net/pdf/performance-evaluation-of-mutual-funds-i
38
http://www.slideshare.net/subhodeepbandopadhyay/market-risk-and-investment-performance-of-
equity-mutual-funds-in-india
39
http://pt.slideshare.net/subhodeepbandopadhyay/market-risk-and-investment-performance-of-
equity-mutual-funds-in-india
40
http://www.scribd.com/doc/54073147/Research-Report-on-Performance-Evaluation-of-Indian-
Mutual-Funds
41
http://www.scribd.com/doc/57359662/MBA-Project-Work-Performance-Evaluation-of-Mutual-Fund
42
http://www.edhec-risk.com/site_edhecrisk
43
http://www.scribd.com/doc/84509919/Mutual-Funds
44
http://www.siescoms.edu/journals/siescoms/Journal4.pdf
45
http://www.ukessays.co.uk/essays/finance/history-of-mutual-funds.php
46
http://www.scribd.com/doc/84509919/Mutual-Funds
47
http://www.evelexa.com/resources/EGBS4_Kolchinsky.pdf

More Related Content

What's hot

project report on mutual fund
project report on mutual fundproject report on mutual fund
project report on mutual fund
nitesh tandon
 
Project on mutual funds study and survey
Project on mutual funds study and surveyProject on mutual funds study and survey
Project on mutual funds study and survey
Projects Kart
 
PERFORMANCE ANALYSIS OF MUTUAL FUNDS IN INDIA
PERFORMANCE ANALYSIS OF MUTUAL FUNDS IN INDIAPERFORMANCE ANALYSIS OF MUTUAL FUNDS IN INDIA
PERFORMANCE ANALYSIS OF MUTUAL FUNDS IN INDIA
DAWOODANAS
 
A comparative analysis of mutual fund schemes in various banks
A comparative analysis of mutual fund schemes in various banksA comparative analysis of mutual fund schemes in various banks
A comparative analysis of mutual fund schemes in various banks
Maya Singh
 
A study on investors’ awareness level on mutual fund & promotion of sip plan
A study on investors’ awareness level on mutual fund & promotion of sip planA study on investors’ awareness level on mutual fund & promotion of sip plan
A study on investors’ awareness level on mutual fund & promotion of sip plan
Projects Kart
 
Project Report On Mutual fund
Project Report On Mutual fund Project Report On Mutual fund
Project Report On Mutual fund Amit Dazz
 
mutual fund summer internship project
mutual fund summer internship projectmutual fund summer internship project
mutual fund summer internship project
Nitish Nair
 
comparative study on mutual fund
comparative study on mutual fundcomparative study on mutual fund
comparative study on mutual fund
nitesh tandon
 
Rahul Gupta MBA Finance IVth SEMESTER Project
Rahul Gupta MBA Finance IVth SEMESTER ProjectRahul Gupta MBA Finance IVth SEMESTER Project
Rahul Gupta MBA Finance IVth SEMESTER Project
Rahul Gupta
 
Hdfc mutual fund
Hdfc mutual fundHdfc mutual fund
Hdfc mutual fund
jitharadharmesh
 
Investor's perception about mutual funds
Investor's perception about mutual fundsInvestor's perception about mutual funds
Investor's perception about mutual funds
aditya kashyap
 
Performance evaluation of mutual funds
Performance evaluation of mutual fundsPerformance evaluation of mutual funds
Performance evaluation of mutual funds
navnit1188
 
Internship report of share khan
Internship report of share khanInternship report of share khan
Internship report of share khan
Harshita Bansal
 
A project report on comparative study of mutual funds in india
A project report on comparative study of mutual funds in indiaA project report on comparative study of mutual funds in india
A project report on comparative study of mutual funds in india
Projects Kart
 
Performance and Analysis of Mutual Funds in India
Performance and Analysis of Mutual Funds in IndiaPerformance and Analysis of Mutual Funds in India
Performance and Analysis of Mutual Funds in India
Aditya Mahindrakar
 
Comparaitive analysis of mutual funds
Comparaitive analysis of mutual fundsComparaitive analysis of mutual funds
Comparaitive analysis of mutual funds
Srujan Kumar
 
Full Project Report on SBI mutual funds.
Full Project Report on SBI mutual funds.Full Project Report on SBI mutual funds.
Full Project Report on SBI mutual funds.
AKSHAY TYAGI
 
Study on Mutual Fund
Study on Mutual FundStudy on Mutual Fund
Study on Mutual Fund
Vivek Saha
 
Finance project on performance evaluation of indian mutual funds
Finance project on performance evaluation of indian mutual fundsFinance project on performance evaluation of indian mutual funds
Finance project on performance evaluation of indian mutual funds
Projects Kart
 
PROJECT REPORT ON MUTUAL FUNDS
PROJECT REPORT ON MUTUAL FUNDS PROJECT REPORT ON MUTUAL FUNDS
PROJECT REPORT ON MUTUAL FUNDS
Ramneet Singh Bhangu
 

What's hot (20)

project report on mutual fund
project report on mutual fundproject report on mutual fund
project report on mutual fund
 
Project on mutual funds study and survey
Project on mutual funds study and surveyProject on mutual funds study and survey
Project on mutual funds study and survey
 
PERFORMANCE ANALYSIS OF MUTUAL FUNDS IN INDIA
PERFORMANCE ANALYSIS OF MUTUAL FUNDS IN INDIAPERFORMANCE ANALYSIS OF MUTUAL FUNDS IN INDIA
PERFORMANCE ANALYSIS OF MUTUAL FUNDS IN INDIA
 
A comparative analysis of mutual fund schemes in various banks
A comparative analysis of mutual fund schemes in various banksA comparative analysis of mutual fund schemes in various banks
A comparative analysis of mutual fund schemes in various banks
 
A study on investors’ awareness level on mutual fund & promotion of sip plan
A study on investors’ awareness level on mutual fund & promotion of sip planA study on investors’ awareness level on mutual fund & promotion of sip plan
A study on investors’ awareness level on mutual fund & promotion of sip plan
 
Project Report On Mutual fund
Project Report On Mutual fund Project Report On Mutual fund
Project Report On Mutual fund
 
mutual fund summer internship project
mutual fund summer internship projectmutual fund summer internship project
mutual fund summer internship project
 
comparative study on mutual fund
comparative study on mutual fundcomparative study on mutual fund
comparative study on mutual fund
 
Rahul Gupta MBA Finance IVth SEMESTER Project
Rahul Gupta MBA Finance IVth SEMESTER ProjectRahul Gupta MBA Finance IVth SEMESTER Project
Rahul Gupta MBA Finance IVth SEMESTER Project
 
Hdfc mutual fund
Hdfc mutual fundHdfc mutual fund
Hdfc mutual fund
 
Investor's perception about mutual funds
Investor's perception about mutual fundsInvestor's perception about mutual funds
Investor's perception about mutual funds
 
Performance evaluation of mutual funds
Performance evaluation of mutual fundsPerformance evaluation of mutual funds
Performance evaluation of mutual funds
 
Internship report of share khan
Internship report of share khanInternship report of share khan
Internship report of share khan
 
A project report on comparative study of mutual funds in india
A project report on comparative study of mutual funds in indiaA project report on comparative study of mutual funds in india
A project report on comparative study of mutual funds in india
 
Performance and Analysis of Mutual Funds in India
Performance and Analysis of Mutual Funds in IndiaPerformance and Analysis of Mutual Funds in India
Performance and Analysis of Mutual Funds in India
 
Comparaitive analysis of mutual funds
Comparaitive analysis of mutual fundsComparaitive analysis of mutual funds
Comparaitive analysis of mutual funds
 
Full Project Report on SBI mutual funds.
Full Project Report on SBI mutual funds.Full Project Report on SBI mutual funds.
Full Project Report on SBI mutual funds.
 
Study on Mutual Fund
Study on Mutual FundStudy on Mutual Fund
Study on Mutual Fund
 
Finance project on performance evaluation of indian mutual funds
Finance project on performance evaluation of indian mutual fundsFinance project on performance evaluation of indian mutual funds
Finance project on performance evaluation of indian mutual funds
 
PROJECT REPORT ON MUTUAL FUNDS
PROJECT REPORT ON MUTUAL FUNDS PROJECT REPORT ON MUTUAL FUNDS
PROJECT REPORT ON MUTUAL FUNDS
 

Similar to A PERFORMANCE EVALUATION OF MUTUAL FUND

COMPARISON OF SIP OF DIFFERENT MUTUAL FUND COMPANIES & RECURRING DEPOSITS OF ...
COMPARISON OF SIP OF DIFFERENT MUTUAL FUND COMPANIES & RECURRING DEPOSITS OF ...COMPARISON OF SIP OF DIFFERENT MUTUAL FUND COMPANIES & RECURRING DEPOSITS OF ...
COMPARISON OF SIP OF DIFFERENT MUTUAL FUND COMPANIES & RECURRING DEPOSITS OF ...
Deepak Lohar
 
Scope for mutual fund advisory business in Jamnagar
Scope for mutual fund advisory business in JamnagarScope for mutual fund advisory business in Jamnagar
Scope for mutual fund advisory business in Jamnagar
Pritesh Radadiya
 
Individual behavior regarding mutual fund investment
Individual behavior regarding mutual fund investmentIndividual behavior regarding mutual fund investment
Individual behavior regarding mutual fund investment
Pritesh Radadiya
 
project-on-hdfc-mutual-fund
 project-on-hdfc-mutual-fund project-on-hdfc-mutual-fund
project-on-hdfc-mutual-fundHARISH NEGI
 
34980370 project-on-hdfc-mutual-fund
34980370 project-on-hdfc-mutual-fund34980370 project-on-hdfc-mutual-fund
34980370 project-on-hdfc-mutual-fundHARISH NEGI
 
Adityakashyap 140620064428-phpapp01
Adityakashyap 140620064428-phpapp01Adityakashyap 140620064428-phpapp01
Adityakashyap 140620064428-phpapp01Nagpur home
 
Performance evaluation of mutual fund
Performance evaluation of mutual fundPerformance evaluation of mutual fund
Performance evaluation of mutual fund
mmakani
 
NJ india summer training report
NJ india summer training reportNJ india summer training report
NJ india summer training report
pravinks1610
 
Research report on affect of investment style on mutual fund performance
Research report on affect of investment style on mutual fund performanceResearch report on affect of investment style on mutual fund performance
Research report on affect of investment style on mutual fund performance
Pratap Kumar
 
Return and risk, systematic investment plan of mutual fund
Return and risk, systematic investment plan of mutual fundReturn and risk, systematic investment plan of mutual fund
Return and risk, systematic investment plan of mutual fund
amulya bachu
 
a project report on need of financial advisor for mutual fund
a project report on need of financial advisor for mutual funda project report on need of financial advisor for mutual fund
a project report on need of financial advisor for mutual fund
habib1990rehman
 
A Comparative Study of Equity Mutual Funds between Reliance and Birla SunLife
A Comparative Study of Equity Mutual Funds between Reliance and Birla SunLifeA Comparative Study of Equity Mutual Funds between Reliance and Birla SunLife
A Comparative Study of Equity Mutual Funds between Reliance and Birla SunLife
Priyank Agarwal
 
Projectonequityanalysisonbankingsector 131209101944-phpapp01
Projectonequityanalysisonbankingsector 131209101944-phpapp01Projectonequityanalysisonbankingsector 131209101944-phpapp01
Projectonequityanalysisonbankingsector 131209101944-phpapp01
2002199115
 
Summer Internship Project Report
Summer Internship Project ReportSummer Internship Project Report
Summer Internship Project Reportdhaval patel
 
final Presentation
final Presentationfinal Presentation
final Presentationsukhadiajay
 
Performence of mutual fund by. karan gujrati
Performence of mutual fund by. karan gujratiPerformence of mutual fund by. karan gujrati
Performence of mutual fund by. karan gujrati
Karan Gujrati
 
A COMPARATIVE ANALYSIS OF SELECTED MUTUAL FUNDS IN INDIA DURING PERIOD 2009-1...
A COMPARATIVE ANALYSIS OF SELECTED MUTUAL FUNDS IN INDIA DURING PERIOD 2009-1...A COMPARATIVE ANALYSIS OF SELECTED MUTUAL FUNDS IN INDIA DURING PERIOD 2009-1...
A COMPARATIVE ANALYSIS OF SELECTED MUTUAL FUNDS IN INDIA DURING PERIOD 2009-1...
Andrew Parish
 
EVALUATING PERCEPTION OF INVESTORS TOWARDS MUTUAL FUNDS & PERFORMANCE OF THE ...
EVALUATING PERCEPTION OF INVESTORS TOWARDS MUTUAL FUNDS & PERFORMANCE OF THE ...EVALUATING PERCEPTION OF INVESTORS TOWARDS MUTUAL FUNDS & PERFORMANCE OF THE ...
EVALUATING PERCEPTION OF INVESTORS TOWARDS MUTUAL FUNDS & PERFORMANCE OF THE ...
Nishant Kumar
 
sulabha arun ithape
sulabha arun ithapesulabha arun ithape
sulabha arun ithape9664337315
 

Similar to A PERFORMANCE EVALUATION OF MUTUAL FUND (20)

COMPARISON OF SIP OF DIFFERENT MUTUAL FUND COMPANIES & RECURRING DEPOSITS OF ...
COMPARISON OF SIP OF DIFFERENT MUTUAL FUND COMPANIES & RECURRING DEPOSITS OF ...COMPARISON OF SIP OF DIFFERENT MUTUAL FUND COMPANIES & RECURRING DEPOSITS OF ...
COMPARISON OF SIP OF DIFFERENT MUTUAL FUND COMPANIES & RECURRING DEPOSITS OF ...
 
Scope for mutual fund advisory business in Jamnagar
Scope for mutual fund advisory business in JamnagarScope for mutual fund advisory business in Jamnagar
Scope for mutual fund advisory business in Jamnagar
 
Individual behavior regarding mutual fund investment
Individual behavior regarding mutual fund investmentIndividual behavior regarding mutual fund investment
Individual behavior regarding mutual fund investment
 
project-on-hdfc-mutual-fund
 project-on-hdfc-mutual-fund project-on-hdfc-mutual-fund
project-on-hdfc-mutual-fund
 
34980370 project-on-hdfc-mutual-fund
34980370 project-on-hdfc-mutual-fund34980370 project-on-hdfc-mutual-fund
34980370 project-on-hdfc-mutual-fund
 
Adityakashyap 140620064428-phpapp01
Adityakashyap 140620064428-phpapp01Adityakashyap 140620064428-phpapp01
Adityakashyap 140620064428-phpapp01
 
Performance evaluation of mutual fund
Performance evaluation of mutual fundPerformance evaluation of mutual fund
Performance evaluation of mutual fund
 
NJ india summer training report
NJ india summer training reportNJ india summer training report
NJ india summer training report
 
Research report on affect of investment style on mutual fund performance
Research report on affect of investment style on mutual fund performanceResearch report on affect of investment style on mutual fund performance
Research report on affect of investment style on mutual fund performance
 
Return and risk, systematic investment plan of mutual fund
Return and risk, systematic investment plan of mutual fundReturn and risk, systematic investment plan of mutual fund
Return and risk, systematic investment plan of mutual fund
 
a project report on need of financial advisor for mutual fund
a project report on need of financial advisor for mutual funda project report on need of financial advisor for mutual fund
a project report on need of financial advisor for mutual fund
 
A Comparative Study of Equity Mutual Funds between Reliance and Birla SunLife
A Comparative Study of Equity Mutual Funds between Reliance and Birla SunLifeA Comparative Study of Equity Mutual Funds between Reliance and Birla SunLife
A Comparative Study of Equity Mutual Funds between Reliance and Birla SunLife
 
Projectonequityanalysisonbankingsector 131209101944-phpapp01
Projectonequityanalysisonbankingsector 131209101944-phpapp01Projectonequityanalysisonbankingsector 131209101944-phpapp01
Projectonequityanalysisonbankingsector 131209101944-phpapp01
 
Summer Internship Project Report
Summer Internship Project ReportSummer Internship Project Report
Summer Internship Project Report
 
merged_document
merged_documentmerged_document
merged_document
 
final Presentation
final Presentationfinal Presentation
final Presentation
 
Performence of mutual fund by. karan gujrati
Performence of mutual fund by. karan gujratiPerformence of mutual fund by. karan gujrati
Performence of mutual fund by. karan gujrati
 
A COMPARATIVE ANALYSIS OF SELECTED MUTUAL FUNDS IN INDIA DURING PERIOD 2009-1...
A COMPARATIVE ANALYSIS OF SELECTED MUTUAL FUNDS IN INDIA DURING PERIOD 2009-1...A COMPARATIVE ANALYSIS OF SELECTED MUTUAL FUNDS IN INDIA DURING PERIOD 2009-1...
A COMPARATIVE ANALYSIS OF SELECTED MUTUAL FUNDS IN INDIA DURING PERIOD 2009-1...
 
EVALUATING PERCEPTION OF INVESTORS TOWARDS MUTUAL FUNDS & PERFORMANCE OF THE ...
EVALUATING PERCEPTION OF INVESTORS TOWARDS MUTUAL FUNDS & PERFORMANCE OF THE ...EVALUATING PERCEPTION OF INVESTORS TOWARDS MUTUAL FUNDS & PERFORMANCE OF THE ...
EVALUATING PERCEPTION OF INVESTORS TOWARDS MUTUAL FUNDS & PERFORMANCE OF THE ...
 
sulabha arun ithape
sulabha arun ithapesulabha arun ithape
sulabha arun ithape
 

Recently uploaded

what is the best method to sell pi coins in 2024
what is the best method to sell pi coins in 2024what is the best method to sell pi coins in 2024
what is the best method to sell pi coins in 2024
DOT TECH
 
NO1 Uk Black Magic Specialist Expert In Sahiwal, Okara, Hafizabad, Mandi Bah...
NO1 Uk Black Magic Specialist Expert In Sahiwal, Okara, Hafizabad,  Mandi Bah...NO1 Uk Black Magic Specialist Expert In Sahiwal, Okara, Hafizabad,  Mandi Bah...
NO1 Uk Black Magic Specialist Expert In Sahiwal, Okara, Hafizabad, Mandi Bah...
Amil Baba Dawood bangali
 
The secret way to sell pi coins effortlessly.
The secret way to sell pi coins effortlessly.The secret way to sell pi coins effortlessly.
The secret way to sell pi coins effortlessly.
DOT TECH
 
what is the future of Pi Network currency.
what is the future of Pi Network currency.what is the future of Pi Network currency.
what is the future of Pi Network currency.
DOT TECH
 
how can i use my minded pi coins I need some funds.
how can i use my minded pi coins I need some funds.how can i use my minded pi coins I need some funds.
how can i use my minded pi coins I need some funds.
DOT TECH
 
一比一原版BCU毕业证伯明翰城市大学毕业证成绩单如何办理
一比一原版BCU毕业证伯明翰城市大学毕业证成绩单如何办理一比一原版BCU毕业证伯明翰城市大学毕业证成绩单如何办理
一比一原版BCU毕业证伯明翰城市大学毕业证成绩单如何办理
ydubwyt
 
Summary of financial results for 1Q2024
Summary of financial  results for 1Q2024Summary of financial  results for 1Q2024
Summary of financial results for 1Q2024
InterCars
 
how to sell pi coins at high rate quickly.
how to sell pi coins at high rate quickly.how to sell pi coins at high rate quickly.
how to sell pi coins at high rate quickly.
DOT TECH
 
Turin Startup Ecosystem 2024 - Ricerca sulle Startup e il Sistema dell'Innov...
Turin Startup Ecosystem 2024  - Ricerca sulle Startup e il Sistema dell'Innov...Turin Startup Ecosystem 2024  - Ricerca sulle Startup e il Sistema dell'Innov...
Turin Startup Ecosystem 2024 - Ricerca sulle Startup e il Sistema dell'Innov...
Quotidiano Piemontese
 
Isios-2024-Professional-Independent-Trustee-Survey.pdf
Isios-2024-Professional-Independent-Trustee-Survey.pdfIsios-2024-Professional-Independent-Trustee-Survey.pdf
Isios-2024-Professional-Independent-Trustee-Survey.pdf
Henry Tapper
 
USDA Loans in California: A Comprehensive Overview.pptx
USDA Loans in California: A Comprehensive Overview.pptxUSDA Loans in California: A Comprehensive Overview.pptx
USDA Loans in California: A Comprehensive Overview.pptx
marketing367770
 
What price will pi network be listed on exchanges
What price will pi network be listed on exchangesWhat price will pi network be listed on exchanges
What price will pi network be listed on exchanges
DOT TECH
 
Intro_Economics_ GPresentation Week 4.pptx
Intro_Economics_ GPresentation Week 4.pptxIntro_Economics_ GPresentation Week 4.pptx
Intro_Economics_ GPresentation Week 4.pptx
shetivia
 
how can I sell my pi coins for cash in a pi APP
how can I sell my pi coins for cash in a pi APPhow can I sell my pi coins for cash in a pi APP
how can I sell my pi coins for cash in a pi APP
DOT TECH
 
Empowering the Unbanked: The Vital Role of NBFCs in Promoting Financial Inclu...
Empowering the Unbanked: The Vital Role of NBFCs in Promoting Financial Inclu...Empowering the Unbanked: The Vital Role of NBFCs in Promoting Financial Inclu...
Empowering the Unbanked: The Vital Role of NBFCs in Promoting Financial Inclu...
Vighnesh Shashtri
 
how to sell pi coins effectively (from 50 - 100k pi)
how to sell pi coins effectively (from 50 - 100k  pi)how to sell pi coins effectively (from 50 - 100k  pi)
how to sell pi coins effectively (from 50 - 100k pi)
DOT TECH
 
MERCHANTBANKING-PDF complete picture.pdf
MERCHANTBANKING-PDF complete picture.pdfMERCHANTBANKING-PDF complete picture.pdf
MERCHANTBANKING-PDF complete picture.pdf
Sudarshan Dakuru
 
一比一原版UOL毕业证利物浦大学毕业证成绩单如何办理
一比一原版UOL毕业证利物浦大学毕业证成绩单如何办理一比一原版UOL毕业证利物浦大学毕业证成绩单如何办理
一比一原版UOL毕业证利物浦大学毕业证成绩单如何办理
ydubwyt
 
Chương 6. Ancol - phenol - ether (1).pdf
Chương 6. Ancol - phenol - ether (1).pdfChương 6. Ancol - phenol - ether (1).pdf
Chương 6. Ancol - phenol - ether (1).pdf
va2132004
 
how to sell pi coins in all Africa Countries.
how to sell pi coins in all Africa Countries.how to sell pi coins in all Africa Countries.
how to sell pi coins in all Africa Countries.
DOT TECH
 

Recently uploaded (20)

what is the best method to sell pi coins in 2024
what is the best method to sell pi coins in 2024what is the best method to sell pi coins in 2024
what is the best method to sell pi coins in 2024
 
NO1 Uk Black Magic Specialist Expert In Sahiwal, Okara, Hafizabad, Mandi Bah...
NO1 Uk Black Magic Specialist Expert In Sahiwal, Okara, Hafizabad,  Mandi Bah...NO1 Uk Black Magic Specialist Expert In Sahiwal, Okara, Hafizabad,  Mandi Bah...
NO1 Uk Black Magic Specialist Expert In Sahiwal, Okara, Hafizabad, Mandi Bah...
 
The secret way to sell pi coins effortlessly.
The secret way to sell pi coins effortlessly.The secret way to sell pi coins effortlessly.
The secret way to sell pi coins effortlessly.
 
what is the future of Pi Network currency.
what is the future of Pi Network currency.what is the future of Pi Network currency.
what is the future of Pi Network currency.
 
how can i use my minded pi coins I need some funds.
how can i use my minded pi coins I need some funds.how can i use my minded pi coins I need some funds.
how can i use my minded pi coins I need some funds.
 
一比一原版BCU毕业证伯明翰城市大学毕业证成绩单如何办理
一比一原版BCU毕业证伯明翰城市大学毕业证成绩单如何办理一比一原版BCU毕业证伯明翰城市大学毕业证成绩单如何办理
一比一原版BCU毕业证伯明翰城市大学毕业证成绩单如何办理
 
Summary of financial results for 1Q2024
Summary of financial  results for 1Q2024Summary of financial  results for 1Q2024
Summary of financial results for 1Q2024
 
how to sell pi coins at high rate quickly.
how to sell pi coins at high rate quickly.how to sell pi coins at high rate quickly.
how to sell pi coins at high rate quickly.
 
Turin Startup Ecosystem 2024 - Ricerca sulle Startup e il Sistema dell'Innov...
Turin Startup Ecosystem 2024  - Ricerca sulle Startup e il Sistema dell'Innov...Turin Startup Ecosystem 2024  - Ricerca sulle Startup e il Sistema dell'Innov...
Turin Startup Ecosystem 2024 - Ricerca sulle Startup e il Sistema dell'Innov...
 
Isios-2024-Professional-Independent-Trustee-Survey.pdf
Isios-2024-Professional-Independent-Trustee-Survey.pdfIsios-2024-Professional-Independent-Trustee-Survey.pdf
Isios-2024-Professional-Independent-Trustee-Survey.pdf
 
USDA Loans in California: A Comprehensive Overview.pptx
USDA Loans in California: A Comprehensive Overview.pptxUSDA Loans in California: A Comprehensive Overview.pptx
USDA Loans in California: A Comprehensive Overview.pptx
 
What price will pi network be listed on exchanges
What price will pi network be listed on exchangesWhat price will pi network be listed on exchanges
What price will pi network be listed on exchanges
 
Intro_Economics_ GPresentation Week 4.pptx
Intro_Economics_ GPresentation Week 4.pptxIntro_Economics_ GPresentation Week 4.pptx
Intro_Economics_ GPresentation Week 4.pptx
 
how can I sell my pi coins for cash in a pi APP
how can I sell my pi coins for cash in a pi APPhow can I sell my pi coins for cash in a pi APP
how can I sell my pi coins for cash in a pi APP
 
Empowering the Unbanked: The Vital Role of NBFCs in Promoting Financial Inclu...
Empowering the Unbanked: The Vital Role of NBFCs in Promoting Financial Inclu...Empowering the Unbanked: The Vital Role of NBFCs in Promoting Financial Inclu...
Empowering the Unbanked: The Vital Role of NBFCs in Promoting Financial Inclu...
 
how to sell pi coins effectively (from 50 - 100k pi)
how to sell pi coins effectively (from 50 - 100k  pi)how to sell pi coins effectively (from 50 - 100k  pi)
how to sell pi coins effectively (from 50 - 100k pi)
 
MERCHANTBANKING-PDF complete picture.pdf
MERCHANTBANKING-PDF complete picture.pdfMERCHANTBANKING-PDF complete picture.pdf
MERCHANTBANKING-PDF complete picture.pdf
 
一比一原版UOL毕业证利物浦大学毕业证成绩单如何办理
一比一原版UOL毕业证利物浦大学毕业证成绩单如何办理一比一原版UOL毕业证利物浦大学毕业证成绩单如何办理
一比一原版UOL毕业证利物浦大学毕业证成绩单如何办理
 
Chương 6. Ancol - phenol - ether (1).pdf
Chương 6. Ancol - phenol - ether (1).pdfChương 6. Ancol - phenol - ether (1).pdf
Chương 6. Ancol - phenol - ether (1).pdf
 
how to sell pi coins in all Africa Countries.
how to sell pi coins in all Africa Countries.how to sell pi coins in all Africa Countries.
how to sell pi coins in all Africa Countries.
 

A PERFORMANCE EVALUATION OF MUTUAL FUND

  • 1. A COMPREHENSIVE PROJECT REAPORT ON “PERFORMANCE EVALUATIN OF MUTUAL FUND” SUBMITTED TO SOM – LALIT INSTITUTE BUSINESS MANAGEMENT IN PARTIAL FULLFILLMENT OF THE REQUIREMENT OF THE AWARD FOR THE DEGREE OF MASTER OF BUSINESS ADMINISTRATION UNDER Gujarat Technological University UNDER THE GUIDENCE OF Mr. KARAN SHASTRI SUBMITTED BY NIRAV THANKI – 127780592111 DARSHITA RUPARELIA – 127780592074 M.B.A – SEMESTER III SOM – LALIT INSTITUTE OF BUSINESS MANAGEMENT M.B.A PROGRAMME Affiliated to Gujarat Technological University Ahmadabad Jan – 2014
  • 2. PREFACE This project provides an opportunity to demonstrate application of our knowledge, skill and competencies required during the financial session. This project helps us to devote our skill to analyze the problem to suggest alternative solutions and to evaluate them. We have worked on the topic is “PERFORMANCE EVALUATION OF MUTUAL FUND” We have put our level best to prepare our project an error free project every effort has been made to offer the most authenticate position with accuracy.
  • 3. ACKNOWLEDGEMENT We would like to express our profound gratitude to all those who have been instrumental in the preparation of this report which has been prepared in partial fulfillment of Comprehensive Project in the Semester IV of an MBA programme. We wish to thank Mr. Jagdish Joshipura, director of Som – Lalit Institute of Management and all the Faculty members of SLIBM for their support and vision. This project could only be completed with the assistance of Mr. Karan Shastri having being a valued guide. Finally we would like to thank our Parents, Family, Friends and God almighty for their unending inspiration and encouragement. Place: Ahmadabad Nirav Thanki Date: 10-01-2014 Darshita Ruparelia
  • 4. DECLARATION We, Nirav Thanki and Darshita Ruparelia, hereby declare that the report for “Comprehensive Project” entitled “Performance Evaluation of Mutual Funds” is the result of our own work and our indebtness to other work publications, references, if any, have been duly acknowledged. Place: Ahmadabad Nirav Thanki Date: 10-01-2014 Darshita Ruparelia
  • 5. Institute’s Certificate Certified that this Comprehensive Project Report Titled “Performance Evaluation of Mutual Fund” is the bonafide work of Mr. Nirav Thanki, and Ms. Darshita Ruparelia (Enrollment No. 127780592111, 127780592074), who carried out the research under my supervision. I also certify further, that to the best of my knowledge the work reported herein does not form part of any other project report or dissertation on the basis of which a degree or award was conferred on an earlier occasion on this or any other candidate. Prof. Mr. Karan Shastri. Director. Mr. Jagdish Joshipura.
  • 6. TABLE OF CONTENTS CHAPTER PARTICULARS PAGE NO NO. EXECUTIVE SUMMARY 1 PART – 1 GENERAL INFORMATION 1 MUTUAL FUND INDUSTRY 1.1 About The Industry 5 1.2 World Market 9 1.3 Indian Market 11 1.4 Growth Of The Industry 14 2 MAJOR COMPANIES IN THE MUTUAL FUND INDUSTRY 2.1 Companies on the basis of return 21 3 Product Profile 3.1 Types of mutual fund 23 3.2 Benefits of mutual fund 25 3.3 Disadvantage of mutual fund 26 3.4 Different plans that mutual fund offer 27 3.5 Factors influencing the performance of mutual 28 Fund
  • 7. PART – 2 PRIMARY STUDY 4 INTRODUCTION OF THE STUDY 4.1 literature Review 32 4.2 Background of the study 36 4.3 Problem statement and importance of the 37 Study 4.4 Objectives of the study 38 5 Research Methodology 5.1 Research Design 40 5.2 Sources of Data 41 5.3 Data collection Method 41 5.4 Population 41 5.5 Sampling method 42 6 Data Analysis and Interpretation 6.1 Analysis of mutual fund performance 44 7 Results and Findings 59 8 Limitations of the study 61 9 Conclusion/Suggestion 63
  • 8. 8 10 ANNEXURE Appendix – 1 1.1 Returns of mutual fund for the year 2013 66 1.2 Return of index for the year 2013 69 Appendix – 2 2.1 Calculation of beta 70 2.2 Calculation of standard deviation 74 11 Bibliography 78
  • 9. 9 EXECUTIVE SUMMERY There are so many investment avenues. So that investors does not know which avenues provides best return. As per the financial rule of “Do not put all the eggs in one basket” investor’s portfolio are most diversified. So that risk should be minimized. If the person do not have knowledge of how to get maximum return with minimum risk or vice-versa then they should invest in mutual fund. There are so many funds and schemes are available in mutual fund market. Investors know that how much risk they can take and based on that they have to choose schemes. The primary object of the present project is to know about which mutual funds gave highest performance within one- year. This study has been undertaken to evaluate the performance of the Indian Mutual Funds vis-à-vis the Indian stock market. For the purpose of this study, 10 open ended equity based growth mutual funds were selected as the Sample. The data, which is the quarterly NAV’s of the funds and the closing of the S & P NIFTY Index, were collected for a period of 1 year starting 01/01/2013. to 31/12/2013. Different statistical tools were used on the data obtained to calculate the Average returns, Standard deviation, Fund Beta, Treynor’s Performance Index, Sharpe’s Performance Index and Jensen’s Alpha. These variables of the funds were compared with the same variables of the market to assess how the different funds have performed against the market. Data we have used to calculate average returns are 10 fund’s quarterly returns and S & P NIFTY’s quarterly returns for the year 2013. Data we have used to calculate standard deviation of portfolio (σp) is the average return of mutual fund and market. Data we have used to calculate beta of portfolio (βp) is the covariance of the returns of the fund and market and variance of the market.
  • 10. 10 We have used return of portfolio (mutual fund) i.e. Rp, return of risk free securities i.e. Rf and beta of portfolio to calculate Treynor’s Performance Index. We have used return of portfolio i.e. Rp, return of risk free securities i.e. Rf and standard deviation of portfolio to calculate Sharpe’s Performance Index. We have used Rp, Rf, βp and Rm i.e. return of market to calculate Jensen’s alpha. Sharpe and Treynor model are used to compare the performance of mutual funds and rank them according to their performance. Jensen model is used to calculate the fund manager’s stock selection capability. In this project we have calculated Sharpe, Treynor and Jensen’s performance index of 10 mutual funds and rank them according to that. We have also calculated the same for market to compare the performance of mutual funds with the market and to check whether the mutual funds can beat the market or not.
  • 12. 12 CHAPTER – I MUTUAL FUND INDUSTRY 1.1 ABOUT THE INDUSTRY Financial Institutions comprises following services
  • 13. 13 Definition 1 Mutual funds are investment companies that pool money from investors at large and offer to sell and buy back its shares on a continuous basis and use the capital thus raised to invest in securities of different companies. The stocks these mutual funds have are very fluid and are used for buying or redeeming and/or selling shares at a net asset value. Mutual funds posses shares of several companies and receive dividends in lieu of them and the earnings are distributed among the share holders. 2 Mutual funds are conceived as institutions for providing small investors with avenues of investments in the capital market. .Since small investors generally do not have adequate time, knowledge, experience and resources for directly accessing the capital market, they have to rely on an intermediary, which undertakes informed investment decisions and provides consequential benefits of professional expertise. 3 Mutual funds have diversified investments spread in calculated proportions amongst securities of various economic sectors. Mutual funds get their 1 http://goldentalk.com/archive/index.html/t-41439.html 2 http://indianresearchjournals.com/pdf/IJMFSMR/2012/February/ijm-6.pdf 3 http://www.studymode.com/essays/Mutual-Funds-883302.html Financial Institution Commerci al Bank Insurance Compnies Mutual Fund Providend Fund Non- Banking Financial Institution
  • 14. 14 earnings in two ways. First, is the most organic way, which is the dividend they get on the securities they hold? Second, is by the redemption of their shares by investors will be at a discount to the current NAVs (net asset values). 4 Below cycle shows the process of investing in Mutual Fund  Investors pull their money with Fund Manager    Fund Manager invest in different securities    Securities generate Returns    Returns are passed back to investors    5 The mutual fund industry has been in India for a long time. This came into existence in 1963 with the establishment of Unit Trust of India, a joint effort by the Government of India and the Reserve Bank of India. The next two decades from 1986 to 1993 can be termed as the period of public sector funds with entry of new public sector players into the mutual fund industry namely, Life Insurance Corporation of India and General Insurance 4 http://www.mergersandinquisitions.com/hedge-funds-institutional-asset-management 5 http://www.moneycontrol.com/investor-education/classroom/knowhistory- structureadvantagesmutual-funds-724370.html Mutual Fund Process Investor Pool their money with Fund Manager Invest inSecurities Generate Returns Passed back to
  • 15. 15 Corporation of India. 6 The year of 1993 marked the beginning of a new era in the Indian mutual fund industry with the entry of private players like Morgan Stanley, J.P Morgan, and Capital International. This was the first time when the mutual fund regulations came into existence. SEBI (Security Exchange Board of India) was established under which all the mutual funds in India were required to be registered. SEBI was set up as a governing body to protect the interest of investor. By the end of 2008, the number of players in the industry grew enormously with 46 fund houses functioning in the country. With the rise of the mutual fund industry, establishing a mutual fund association became a prerequisite. This is when AMFI (Association of Mutual Funds India) was set up in 1995 as a non-profit organization. Today AMFI ensures mutual funds function in a professional and healthy manner thereby protecting the interest of the mutual funds as well as its investors. The mutual fund industry is considered as one of the most dominant players in the world economy and is an important constituent of the financial sector and India is no exception. The industry has witnessed startling growth in terms of the products and services offered, returns churned, volumes generated and the international players who have contributed to this growth. Today the industry offers different schemes ranging from equity and debt to fixed income and money market. 7 The market has graduated from offering plain vanilla and equity debt products to an array of diverse products such as gold funds, exchange traded funds (ETF’s), and capital protection oriented funds and even thematic funds. In addition investments in overseas markets have also been a significant step. Due credit for this evolution can be given to the regulators for building an appropriate framework and to the fund houses for launching such different 6 http://www.moneycontrol.com/investor-education/classroom/knowhistory- structureadvantagesmutual-funds-724370.html 7 http://www.getcited.org/pub/103509466
  • 16. 16 products. All these reasons have encouraged the traditional conservative investor, from parking fund in fixed deposits and government schemes to investing in other products giving higher returns. 8 It is interesting to note that the major benefits of investing in a mutual funds is to capitalize on the opportunity of a professionally managed fund by a set of fund managers who apply their expertise in investment. This is beneficial to the investors who may not have the relevant knowledge and skill in investing. Besides investors have an opportunity to invest in a diversified basket of stocks at a relatively low price. Each investor owns a portion of the fund and hence shares the rise and fall in the value of the fund. A mutual fund may invest in stocks, cash, bonds or a combination of these. 9 Mutual funds are considered as one of the best available investment options as compare to others alternatives. They are very cost efficient and also easy to invest in. The biggest advantage of mutual funds is they provide diversification, by reducing risk & maximizing returns. 10 India is ranked one of the fastest growing economies in the world. Despite this huge progression in the industry, there still lies huge potential and room for growth. India has a saving rate of more than 35% of GDP, with 80% of the population who save. These savings could be channelized in the mutual funds sector as it offers a wide investment option. In addition, focusing on the rapidly growing tier II and tier III cities within India will provide a huge scope for this sector. Further tapping rural markets in India will benefit mutual fund companies from the growth in agriculture and allied sectors. With subsequent easing of regulations, it is estimated that the mutual fund industry will grow at a rate of 30% - 35% in the next 3 to 5 years and reach US 300 billion by 2015. 1.2 MUTUAL FUND INDUSTRY IN WORLD MARKET 8 http://pt.slideshare.net/subhodeepbandopadhyay/market-risk-and-investment-performance-of- equity-mutual-funds-in-india 9 http://www.scribd.com/doc/27550490/Dissertation-on-Past-Performance-of-Mutual-Funds 10 http://www.slideshare.net/hemanthcrpatna/finance-project-on-performance-evaluation-of-indian- mutual-funds
  • 17. 17 Mutual Fund – A Globally Proven Investment 11 Worldwide, the Mutual Fund has a long and successful history. The popularity of the Mutual Fund has increased manifold. In developed financial markets, like the United States, Mutual Funds have almost overtaken bank deposits and total assets of insurance funds. 12 Internationally, on-line investing continues its meteoric rise. Many have debated about the success of e-commerce and its breakthroughs, but it is true that this aspect of technology could and will change the way financial sectors function. However advanced countries like US, mutual funds buy-sell transactions have already begun on the net, while in India the net is used as a source of information. Such changes could facilitate easy access, lower intermediation costs and better services for all. Since the creation of the first mutual fund in 1929, the mutual fund industry has enjoyed the fastest growth rate of the financial investment industry. In 1949, all mutual fund companies combined controlled $2 billion; fund assets soared to $6.5 trillion at the outset of 2003, and more than $12 trillion in 2007, making the funds America’s largest financial investment vehicles. 13 The mutual fund industry consists of investment companies that sell shares in one or more portfolios of financial assets. Fund managers determine the composition of the portfolio, which may include stocks, bonds, government securities, shares in precious metals, and other financial assets. As open-end funds, they are sold publicly, and their shares must be redeemed by the investment company on request of the shareholder. Mutual funds are categorized by their general investment objectives. Equity funds consist of common stocks and are organized to achieve capital growth. Bond funds are composed of corporate, U.S. government or municipal bonds and emphasize regular income. 11 http://www.capitalmarket.com/mutual/mf-faqa.htm 12 http://www.ashishbusiness.in/mutual-funds 13 https://www.sec.gov/about/offices/oia/oia_investman/rplaze-042012.pdf
  • 18. 18 14 Income funds have the same objective as bond funds but include Government National Mortgage Association securities, government securities, and common and preferred stocks as well as bonds. Money market mutual funds consist of short-term instruments, such as U.S. government securities, bank certificates of deposit and commercial paper. 15 The mutual fund industry is regulated by the Securities and Exchange Commission (SEC) and by state regulations and securities laws. The first mutual fund was developed on March 21, 1924, when three Boston securities executives pooled their money to establish the Massachusetts Investors Trust. In just one year, the mutual fund grew from $50,000 to $392,000 in assets. Investors welcomed the innovation and invested in this new vehicle heavily; however, the stock market crash of 1929 slowed its growth. To instill investors with confidence, the U.S. Congress passed the Securities Act of 1933, the Securities Exchange Act of 1934, and the Investment Company Act of 1940, which set standards with which mutual funds must comply. 16 By the end of the 1960’s, there were approximately 270 funds with $48 billion in assets. One of the largest contributors to the mutual funds’ growth was the provision added to the Internal Revenue Code in 1975 that allowed individuals already in a corporate pension fund to contribute up to $2,000 per year to an individual retirement account (IRA). Mutual funds became popular in employer sponsored 401(k) retirement plans, IRAs, and Roth IRAs. In 1976, John Bogle founded the first retail index fund (a passively managed fund that tries to mirror the performance of a specific index, such as the S&P 500), named First Index Investment Trust. Later renamed Vanguard 500 Index Fund, it revolutionized investing, becoming one of the world’s largest mutual funds, with more than $115 billion in assets. Mutual fund assets first reached the trillion dollar mark in January, 1990. By the end of 1990, the industry had also posted new records, both in the number of funds (3,108) and in the number of individual accounts (62.6 million). By 1996, total mutual fund assets reached $3 trillion. The industry blossomed in the dawn of the 14 http://www.capitalmarket.com/mutual/mf-faqa.htm 15 http://my-people.net/mutual-fund-industry/ 16 http://my-people.net/mutual-fund-industry/
  • 19. 19 new millennium, and in 2007, there were 8,015 mutual funds, with a combined worth of $12.4 trillion. 1.3 MUTUAL FUND INDUSTRY IN INDIAN MARKET 17 The Indian mutual funds industry is witnessing a rapid growth as a result of infrastructural development, increase in personal financial assets, and rise in foreign participation. With the growing risk appetite, rising income, and increasing awareness, mutual funds in India are becoming a preferred investment option compared to other investment vehicles like Fixed Deposits (FDs) and postal savings that are considered safe but give comparatively low returns, according to “Indian Mutual Fund Industry”. 18 Market capitalization Individual investors make up for 96.86% of the total number of investor accounts and contribute 36.9% of the net assets under management. 17 http://businesstoday.intoday.in/story/mutual-fund-schemes-and-offers-in-coming- months/1/19520.html 18 http://indianresearchjournals.com/pdf/APJMMR/2012/October/19.pdf 0 5 10 15 20 25 30 35 40 45 Equity Bond Money Market Mixed Others Asset Allocation in % INDIA WORLD
  • 20. 20 Size of industry The size of Indian Mutual Fund Industry has grown and now has the boast of having dominance in this industry. In April 2008 the total Asset Under Management popularly known as AUM has increased from Rs.1, 01, 565 crores in January 2000 to Rs.5, 67, 601.98 crores According to the Association of Mutual Funds in India, the growth of mutual fund industry has been exceptional. This industry has indeed come a very long way with only 34 players in the market and more than 480 schemes. Domestic and Export Share Despite the growth of Mutual Fund Industry, penetration levels in India are low as compared to other global economies. Assets under management as a percentage of GDP is less than 5% in India as compared to 70% in the US, 67% in France and 37% in Brazil. The industry has grown in size and manages total assets of more than $30351 million. Of the various sectors, the private sector accounts for nearly 91% of the resources mobilized showing their overwhelming dominance in the market. Individuals constitute 98.04% of the total number of investors and contribute US $12062 million, which is 55.16% of the net assets under management. 19 Employment opportunities Indian Mutual Fund Industry is playing an active role in the capital market today and is one of the fastest growing industries in the country. The industry offers multiple career options to the youths irrespective of their academic subjects. Graduates from arts, science and commerce can easily find a job in this promising and growing sector. Due to the participation of private players and many financial institutions into the mutual funds markets, they have further widened the scope of employment in this sector. Career in Mutual 19 http://indianresearchjournals.com/pdf/APJMMR/2012/October/19.pdf
  • 21. 21 funds require the minimum qualification of a certification (Advisor Module) and a registration number from the Associations of Mutual Funds in India (AMFI). SEBI has made mandatory for any entity or person engaged in marketing and selling of mutual fund products to pass AMFI certification test (Advisors Module) and obtain registration number from. This certification remains valid for 5 years from the date of the test. Latest developments  20 The Indian mutual funds retail market, growing at a CAGR of about 30%, is forecasted to reach US$ 300 Billion by 2015.    Income and growth schemes made up for majority of Assets under Management (AUM) in the country. At about 84% (as on March 31, 2008), private sector Asset Management Companies account for majority of mutual fund sales in India.    Individual investors make up for 96.86% of the total number of investor accounts and contribute 36.9% of the net assets under management.    The Rs.7.2 trillion Indian Mutual Fund Industry is revisiting its business model to be in sync with the new norms put in place by the capital market regulator, the Securities and Exchange Board of India, or SEBI.    India has 36 asset management companies (AMCs) and at least some of them are planning to start their own distribution business instead of selling funds through third-party distributors. Among other things, they plan to cut distributors’ commission by 25-30 basis points (bps) and shift their focus from frequent churning of funds to managing money for the longer term. One basis point is one-hundredth of a percentage point.    Out of the 32 Crore employed Indians, only 2.5% are investors. Many investors, particularly youth mostly having the dispensable income opt for mutual funds to enter into the securities market indirectly. Hence, potential investors in mutual funds need evaluation not only by financial institutions but also by academicians so that they can make a right 20 http://www.rncos.com/Report/IM142.htm
  • 22. 22 choice in their investment decisions.  . 1.4 GROWTH OF MUTUAL FUND INDUSTRY 21 The mutual fund industry in India started in 1963 with the formation of Unit Trust of India, at the initiative of the Government of India and Reserve Bank of India. The history of mutual funds in India can be broadly divided into four distinct phases. 22 Phase I - Establishment and Growth of Unit Trust of India 1964-87 Unit Trust of India (UTI) was established on 1963 by an Act of Parliament. It was set up by the Reserve Bank of India and functioned under the Regulatory and administrative control of the Reserve Bank of India. In 1978 UTI was de- linked from the RBI and the Industrial Development Bank of India (IDBI) took over the regulatory and administrative control in place of RBI. The first scheme launched by UTI was Unit Scheme 1964. At the end of 1988 UTI had Rs. 6,700 crores of assets under management. Phase II – Entry of Public Sector Funds 1987-93 1987 marked the entry of non- UTI, public sector mutual funds set up by public sector banks and Life Insurance Corporation of India (LIC) and General Insurance Corporation of India (GIC). SBI Mutual Fund was the first non- UTI Mutual Fund in June 1987 followed by Can bank Mutual Fund (Dec 87), Punjab National Bank Mutual Fund (Aug 89), Indian Bank Mutual Fund (Nov 89), Bank of India (Jun 90), Bank of Baroda Mutual Fund (Oct 92). LIC established its mutual fund in June 1989 while GIC had set up its mutual fund 21 http://www.amfiindia.com/research-information/mf-history 22 http://finance.indiamart.com/india_business_information/mutual_funds_industry.html
  • 23. 23 in December 1990. At the end of 1993, the mutual fund industry had assets under management of Rs. 47,004 crores. Phase III – Entry of Private Sector Funds 1993-96 With the entry of private sector funds in 1993, a new era started in the Indian mutual fund industry, giving the Indian investors a wider choice of fund families. Also, 1993 was the year in which the first Mutual Fund Regulations came into being, under which all mutual funds, except UTI were to be registered and governed. The erstwhile Kothari Pioneer (now merged with Franklin Templeton) was the first private sector mutual fund registered in July 1993. Phase IV - Growth and SEBI Regulation 1996-04 The number of mutual fund houses went on increasing, with many foreign mutual funds setting up funds in India and also the industry has witnessed several mergers and acquisitions. As at the end of January 2003, there were 33 mutual funds with total assets of Rs. 1,21,805 crores. The Unit Trust of India with Rs. 44,541 crores of assets under management was way ahead of other mutual funds. In February 2003, the UTI Act was repealed and UTI was stripped of its Special legal status as a trust formed by an Act of Parliament. The primary objective behind this was to bring all mutal fund players on the same level. UTI was re-organized into two parts: 1. The Specified Undertaking, 2. The UTI Mutual Fund. UTI Mutual Fund is still the largest player in the industry. In 1999, there was a significant growth in mobilization of funds from investors and assets under management which is supported by the following data: TABLE 1.1 GROSS FUND MOBILISATION
  • 24. 24 GROSS FUND MOBILISATION (RS. CRORES) FROM TO UTI PUBLIC PRIVATE TOTAL SECTOR SECTOR 1-4-98 31-3-99 11,679 1,732 7,966 21,377 1-4-99 31-3-00 13,536 4,039 42,173 59,748 1-4-00 74,35231-3-01 12,413 6,192 92,957 1-4-01 31-3-02 4,643 13,613 1,46,267 1,64,523 1-4-02 31-3-03 5,505 22,923 2,20,551 2,48,979 1-4-03 31-3-03 * 7,259* 58,435 65,694 1-4-03 31-3-04 - 68,558 5,21,632 5,90,190 1-4-04 31-3-05 - 1,03,246 7,36,416 8,39,662 1-4-05 31-3-06 - 1,83,446 9,14,712 10,98,158 TABLE 1.2 ASSETS UNDER MANAGEMENT ASSETS UNDER MANAGEMENT (RS. CRORES) AS ON UTI PUBLIC SECTOR PRIVATE TOTAL SECTOR 31-March-99 53,320 8,292 6,860 68,472
  • 25. 25 23 Phase V – Growth &Consolidation 2004 onwards The industry has also witnessed several mergers and acquisitions recently, examples of which are acquisition of schemes of Alliance Mutual Fund by Birla Sun Life, Sun F&C Mutual Fund and PNB Mutual Fund by Principal Mutual Fund. Simultaneously, more international mutual fund players have entered India like Fidelity, Franklin Templeton Mutual Fund etc. There were 29 funds as at the end of March 2006. This is a continuing phase of growth of the industry through consolidation and entry of new international and private sector players. TABLE 1.3 EVOLUTION OF THE INDIAN MF INDUSTRY Year No of AMCs No of schemes AUM US $(mn) Mar 98 31 235 17451 Mar 98 32 277 16111 23 http://finance.indiamart.com/india_business_information/mutual_funds_industry.html
  • 26. 26 Mar 00 32 337 25889 Mar 01 35 393 19336 Mar 02 35 417 20601 Mar 03 33 382 16719 Mar 04 31 403 32170 Mar 05 29 451 34289 Mar 07 30 756 75728 Mar 08 33 956 126225 0 5 10 15 20 25 30 35 40 No. of AMC No. of AMC 0 500 1000 1500 No. of Scheme No. of Scheme
  • 27. 27 24 Factor contributing to the growth of the industry  Large market potential – high saving rate  Comprehensive Regulatory framework  Favorable tax policies  Introduction of new products  Role of distributors  Investor’s education campaign  Performance record 24 http://smallbusiness.chron.com/factors-affecting-economic-development-growth-1517.html 17451 16111 25889 19336 20601 16719 32170 34289 52127 75728 126225 0 20000 40000 60000 80000 100000 120000 140000 Growth in AUM US $ (mn.) Grow th in AUM US $ (mn.)
  • 28. 28 CHAPTER – 2 MAJOR COMPANIES IN MUTUAL FUND INDUSTRY 2.1 COMPANIES ON THE BASIS OF RETURN Company NAV Return % IDFC Premier Equity-A 1376.30 83.2 ING Dividend Yield 36.53 76.8 Reliance RSF – Equity 2722.37 74.2 Birla SL Dividend Yield ( G ) 384.83 69.8 Sundaram S.M.I.L.E Fund 663.86 66.1
  • 29. 29 ICICI Prudential Discovery Fund 1083.58 63.7 HDFC Top 200 Fund 7490.21 63.4 Can Robeco Equity Diversified 323.88 57.8 Quantum Long-Term Equity 53.45 57.1 Baroda Pioneer Growth 52.17 55.7 83.2 76.8 74.2 69.8 66.1 63.7 63.4 57.8 57.1 55.7 Series 1
  • 30. 30 CHAPTER – 3 PRODUCT PROFILE 3.1 TYPES OF MUTUAL FUND
  • 31. 31 25 A Mutual Fund may float several schemes which may be classified on the basis of its structure, its investment objectives and other objectives. A) MUTUAL FUND SCHEMES BY STRUCTURE Open-Ended Funds: Open-Ended fund scheme is open for subscription all through year. An investor can buy or sell the units at "NAV" (Net Asset Value) related price at any time. Close-Ended Funds: A Close-Ended fund is open for subscription only during a specified period, generally at the time of initial public issue. The Close-Ended fund scheme is listed on the some stock exchanges where an investor can buy or sell the units of this type of scheme. Interval Funds: Interval Funds combines both the features of Open-Ended funds and Close-Ended funds. B) MUTUAL FUND SCHEMES BY INVESTMENT OBJECTIVES 25 http://timesofindia.indiatimes.com/articles/Different-Types-and-Kinds-of-Mutual- Funds/articleshowhsbc/22624820.cms Type of Mutual Fund According to Structure According to Investment Objective According to Other Objective
  • 32. 32 26 Growth Funds: The objective of Growth Fund scheme is to provide capital appreciation over the medium to long term. This type of scheme is an ideal scheme for the investors seeking capital appreciation for a long period. Income Funds: The Income Fund schemes objective is to provide regular and steady income to investors. Balanced Funds: The objective of Balanced Fund schemes is to provide both growth and regular income to investors. Money Market Funds: The objectives of Money market funds are to provide easy liquidity, regular income and preservation of income. C) OTHER FUNDS 27 Tax Saving Schemes: The objective of Tax Saving schemes is to offer tax rebates to the investors under specific provisions of the Indian Income Tax Laws. Investments made under some schemes are allowed as deduction u/s 88 of the Income Tax Act. Industry specific Schemes: Industry specific schemes invest only in the industries specified in the offer document of the schemes. Sectorial Schemes: The scheme invest particularly in a specified industries or initial public offering. Index schemes: Such schemes links with the performance of BSE sensex or NSE. Loan Funds: Loan Funds charges a commission each time when you buy or sale units in the fund. 26 http://www.assetmanagement.hsbc.com/in/mutual-funds/learning- centre/faqs/mut_funds_faqs.html 27 http://www.assetmanagement.hsbc.com/in/mutual-funds/learning- centre/faqs/mut_funds_faqs.html
  • 33. 33 3.2 BENEFITS OF MUTUAL FUNDS 28 Mutual Funds offer several benefits to an investor such as potential return, liquidity, transparency, income growth, good post tax return and reasonable safety. There are number of options available for an investor offered by a mutual fund. Before investing in a Mutual Fund an investor must identify his needs and preferences. While selecting a Mutual Fund's schemes he should consider the effect of inflation rate, diversification of investment, the time period of investment and the risk factors. There are various types of risk factors as:  Market Risk    Credit Risk    Interest Rate Risk    Inflation Risk    Political Environment  The major benefits are good post-tax returns and reasonable safety, the other benefits in investing in Mutual Funds are Professional Management: Mutual Funds employ the services of experienced and skilled professionals and dedicated investment research team. The whole team analyses the performance and balance sheet of companies and selects them to achieve the objectives of the scheme. Potential Return: Mutual Funds have the potential to provide a higher return to an investor than any other option over a reasonable period of time. Diversification: Mutual Funds invest in a number of companies across a wide cross section of industries and sectors. Low Cost: Investment in Mutual Funds is a less expensive way in comparison to a direct investment in capital market. 28 http://southerncapital.in/benefits_mutualfunds.php
  • 34. 34 Liquidity: The investor can get the money promptly at the net asset value related prices from the Mutual Funds open-ended schemes. In close-ended schemes, the units can be sold on a stock exchange at the prevailing market price. Transparency: Mutual Funds have to disclose their holdings, investment pattern and the necessary information before all investors under a regulation framework. Flexibility: Investment in Mutual Funds offers a lot of flexibility with features of schemes such as regular investment plan, regular withdrawal plans and dividend reinvestment plans enabling systematic investment or withdrawal of funds. Affordability: Small investors with low investment fund are unable to high- grade or blue chip stocks. An investor through Mutual Funds can be benefited from a portfolio including of high priced stock. Well regulated: All Mutual Funds are registered with SEBI, and SEBI acts a watchdog, so the Mutual Funds are well regulated. 3.3 DISADVANTAGES OF MUTUAL FUND 29 Cost: Mutual funds provide investors with professional management, but it comes at a cost. Funds will typically have a range of different fees that reduce the overall payout. In mutual funds, the fees are classified into two categories: shareholder fees and annual operating fees. 30 Misleading Advertisements: The misleading advertisements of different funds can guide investors down the wrong path. Some funds may be incorrectly labelled as growth funds, while others are classified as small cap 29 http://mutualfunds.about.com/od/mutualfundbasics/a/disadvmf.htm 30 http://www.investorguide.com/article/11139/disadvantages-of-investing-in-mutual-funds-igu/
  • 35. 35 or income funds. The Securities and Exchange Commission (SEC) requires that funds have at least 80% of assets in the particular type of investment implied in their names. 3.4 DIFFERENT PLANS THAT MUTUAL FUND OFFER 31 Growth Plan and Dividend Plan A growth plan is a plan under a scheme wherein the returns from investments are reinvested and very few income distributions, if any, are made. The investor thus only realizes capital appreciation on the investment. This plan appeals to investors in the high income bracket. Under the dividend plan, income is distributed from time to time. This plan is ideal to those investors requiring regular income. Dividend Reinvestment Plan Dividend plans of schemes carry an additional option for reinvestment of income distribution. This is referred to as the dividend reinvestment plan. Under this plan, dividends declared by a fund are reinvested on behalf of the investor, thus increasing the number of units held by the investors. Automatic Investment Plan Under the Automatic Investment Plan (AIP) also called Systematic Investment Plan (SIP), the investor is given the option for investing in a specified frequency of months in a specified scheme of the Mutual Fund for a constant sum of investment. AIP allows the investors to plan their savings through a structured regular monthly savings program. Automatic Withdrawal Plan Under the Automatic Withdrawal Plan (AWP) also called Systematic Withdrawal Plan(SWP), a facility is provided to the investor to withdraw a pre- 31 http://www.moneycontrol.com/investor-education/classroom/what-aredifferent-plans-that- mutual-funds-offer-1022380.html
  • 36. 36 determined amount from his fund at a pre-determined interval. 3.5 FACTORS THAT INFLUENCE THE PERFORMANCE OF MUTUAL FUND 32 The performances of Mutual funds are influenced by the performance of the stock market as well as the economy as a whole. Equity Funds are influenced to a large extent by the stock market. The stock market in turn is influenced by the performance of the companies as well as the economy as a whole. The performance of the sector funds depends to a large extent on the companies within that sector. Bond-funds are influenced by interest rates and credit quality. As interest rates rise, bond prices fall, and vice versa. Similarly, bond funds with higher credit ratings are less influenced by changes in the economy. 33 Expense Ratio Mutual funds charge fees, sometimes high fees. A mutual fund's EXPENSE RATIO is the most important fee to understand. And is made up of the following: The investment advisory fee or management fee is the money used to pay the manager(s) of the mutual fund. This is usually taken annually as a percentage of the fund's assets. Administrative costs are the costs of record keeping, mailings, maintaining a customer service line, etc. These are all necessary costs, though they vary in size from fund to fund. Distribution fee: This fee is spent on marketing, advertising and distribution services. Only one third of all equity, mutual funds provided returns greater than the S&P 500, and that was before fees and expenses which range from 0.5% to 2.0% and 2.0%, respectively. After adjustments were made for the riskiness of a fund, mutual funds were reported as being able to perform up to the market 32 http://www.slideshare.net/navnit1188/performance-evaluation-of-mutual-funds-4912211 33 http://financialplan.about.com/od/investing/a/MutualFundFees.htm
  • 37. 37 on gross returns, but were underperforming, as compared to the market, after the various expenses were factored in. Many analysts suggested that the average 1.3% expense ratio of mutual funds and the need for the retainment of cash as the culprits of such underperformance. 34 Risk Risk can be a great ally when trying to estimate the reward potential of a stock investment. The greater the stock volatility, or risk, the greater also is the reward. There are several new risk measurements that give guidance for selecting mutual stocks that provide higher returns for lower risk. 35 Time Horizon The time horizon of an individual will also influence the performance measures he/she will look at more closely. If you are investing for less than four years, you need a fund with consistent performance, so all your money will be there when you need it. You also do not have time to earn back a large commission charge on the front end. Conversely, if you plan to invest your money for 30 years, neither consistency nor load is very important: you have plenty of time for the market to recover. With a long-term horizon, your biggest enemies are poor performance and high annual expenses, both of which can erode that all-important compounding. 34 http://pt.slideshare.net/navnit1188/performance-evaluation-of-mutual-funds-4912211 35 http://pt.slideshare.net/navnit1188/performance-evaluation-of-mutual-funds-4912211
  • 39. 39 CHAPTER – 4 INTRODUCTION OF THE STUDY 4.1 LITERATURE REVIEW
  • 40. 40 36 Performance evaluation of mutual funds is one of the preferred areas of research where a good amount of study has been carried out. The area of research provides diverse views of the same. For instance one paper evaluated the performance of Indian Mutual Fund Schemes in a bear market using relative performance index, risk-return analysis, Treynor’s ratio, Sharpe’s ratio, Jensen’s measure, Fama’s measure. The study finds that Medium Term Debt Funds were the best performing funds during the bear period of September 98-April 2002 and 58 of 269 open ended mutual funds provided better returns than the overall market returns. 37 Another paper used Return Based Style Analysis (RBSA) to evaluate equity mutual funds in India using quadratic optimization of an asset class factor model proposed by William Sharpe and analysis of the relative performance of the funds with respect to their style benchmarks. Their study found that the mutual funds generated positive monthly returns on the average, during the study period of January 2000 through June 2005. The ELSS funds lagged the Growth funds or all funds taken together, with respect to returns generated. The mean returns of the growth funds or all funds were not only positive but also significant. The ELSS funds also demonstrated marginally higher volatility (standard deviation) than the Growth funds. One study identified differences in characteristics of public-sector sponsored & private-sector sponsored mutual funds find the extent of diversification in the portfolio of securities of public-sector sponsored and private-sector sponsored mutual funds and compare the performance of public-sector sponsored and private-sector sponsored mutual funds using traditional 36 http://ebookily.net/pdf/performance-evaluation-of-mutual-funds-i 37 http://www.slideshare.net/subhodeepbandopadhyay/market-risk-and-investment-performance-of- equity-mutual-funds-in-india
  • 41. 41 investment measures. 38 They primarily use Jensen’s alpha, Sharpe information ratio, excess standard deviation adjusted return (ESDAR) and find out that portfolio risk characteristics measured through private-sector Indian sponsored mutual funds seems to have outperformed both Public- sector sponsored and Private-sector foreign sponsored mutual funds and the general linear model of analysis of covariance establishes differences in performance among the three classes of mutual funds in terms of portfolio diversification. Another paper examined the performance of equity and bond mutual funds that invested primarily in the emerging markets using Treynor’s ratio, Sharpe’s ratio, Jensen’s measure. With this research they found that on an average the U.S. stock market outperformed emerging equity markets but the emerging market bonds outperformed U.S. bonds. They also found that overall emerging market stock funds under-performed the respective MSCI indexes. These were evident by their lower return, higher risk, and thus lower Sharpe ratios. 39 One more paper evaluated whether or not the selected mutual funds were able to outperform the market on the average over the studied time period. In addition to that by examining the strength of interrelationships of values of PCMs for successive time periods , the study also tried to infer about the extent to which the future values of fund performance were related to its past by using single index model. The study revealed that there were positive signals of information asymmetry in the market with mutual fund managers having superior information about the returns of stocks as a whole. PCM also indicated that on an average mutual funds provided excess (above-average) return, but only when unit of time period was longer (1 qtr or 4 qtr). Therefore, they concluded that for assessing the true performance of a particular mutual fund, a longer time horizon is better. 38 http://pt.slideshare.net/subhodeepbandopadhyay/market-risk-and-investment-performance-of- equity-mutual-funds-in-india 39 http://www.scribd.com/doc/63093846/Literature-Review-mutual-Funds
  • 42. 42 40 Another study aimed at analyzing performance of select open-ended equity mutual fund using Sharpe Ratio, Hypothesis testing and return based on yield. The most important finding of the study had been that only four Growth plans and one Dividend plan (5 out of the 42 plans studied) could generate higher returns than that of the market which is contrary to the general opinion prevailing in the Indian mutual fund market. 41 Even the Sharpe ratios of Growth plans and the corresponding Dividend plans stand testimony to the relatively better performance of Growth plans. The statistical tests in terms of F-test and t-Test further corroborate the significant performance differences between the Growth plans and Dividend plans. A similar study examined the empirical properties of performance measures for mutual funds using Simulation procedures combined with random and random-stratified samples of NYSE and AMEX securities and other performance measurement tools employed are Sharpe measure, Jensen alpha, Treynor measure, appraisal ratio, and Fama-French three-factor model alpha. The study revealed that standard mutual fund performance was unreliable and could result in false inferences. In particular, it was easy to detect abnormal performance and market-timing ability when none exists. The results also showed that the range of measured performance was quite large even when true performance was ordinary. This provided a benchmark to gauge mutual fund performance. Comparisons of their numerical results with those reported in actual mutual fund studies raised the possibility that reported results were due to misspecification, rather than abnormal performance. Finally, the results indicated that procedures based on the Fama-French 3-factor model were somewhat better than CAPM based measures. 42 Another paper, analyzed the Indian Mutual Fund Industry pricing mechanism with empirical studies on its valuation. It also analyzed data at both the fund- 40 http://www.scribd.com/doc/54073147/Research-Report-on-Performance-Evaluation-of-Indian- Mutual-Funds 41 http://www.scribd.com/doc/57359662/MBA-Project-Work-Performance-Evaluation-of-Mutual- Fund 42 http://www.edhec-risk.com/site_edhecrisk
  • 43. 43 manager and fund-investor levels. It stated that mispricing of the Mutual funds could be evaluated by comparing the return on market and return on stock. During the pricing period, if the return on stock is negative, then it indicates overpricing and if are positive indicates under pricing. Relative performance measurement was used to measure the performance of the MF with SENSEX and it used Standard Deviation, Correlation analysis, Co-efficient of Determination and Null Hypothesis. This study revealed that standard deviations of the 3-month returns were significant with the increase in the period. 4.2 BACKGROUND OF THE STUDY 43 Day by day as business is getting more competitive and so the 43 http://www.scribd.com/doc/84509919/Mutual-Funds
  • 44. 44 management is achieving its importance in every field to increase the efficiency and to cut down the cost of production. The present day giant organization is a specialized or expert in all spheres of management. The importance of specialist from each has emerged, these specialist are often called as professionals. 44 During last few years or so, financial management which was not considered so much has now been recognize as an important area. This change has created importance for the study of financial management which has lead to various objectives-covered in this research methodology. The methodology of the project reveals the step-by-step procedure done to carry out the project study. 45 Mutual Fund is a topic which is of enormous interest not only to researchers all over the world, but also to investors. Mutual funds as a medium-to-long term investment option are preferred as a suitable investment option by investors. However, with several market entrants the question is the choice of mutual fund. The study focuses on this problem of mutual fund selection by investors. Though the investment objectives define investor’s preference among fund types (balanced, growth, dividend etc.) the choice of fund based on a sponsor’s reputation remains to be probed. We focus on analyzing the performance of mutual funds by using three models i.e. Sharpe, Treyner and Jensen. 4.3 PROBLEM STATEMENT AND IMPORTANCE OF THE STUDY 44 http://www.siescoms.edu/journals/siescoms/Journal4.pdf 45 http://www.ukessays.co.uk/essays/finance/history-of-mutual-funds.php
  • 45. 45 46 There are so many investment avenues. So that investors does not know which avenues provides best return. As per the financial rule of “Do not put all the eggs in one basket” investor’s portfolio are most diversified. So that risk should be minimized. If the person do not have knowledge of how to get maximum return with minimum risk or vice-versa then they should be invest in mutual fund. There are so many funds and schemes are available in mutual fund market. Investors know that how much risk they can take. Based on that they have to choose schemes. Problem is that chosen scheme provides the best return as compare to the market and other schemes. For that certain model available Sharpe’s model, Treynor’s model and Jenson’s model. These models are suggested that which schemes provide best return. 47 Importance of the study is that a fund’s performance can be judged with respects to investors’ expectation. Investors have to define his expectations in relation to certain indicators on what is possible to achieve or moderate this with comparable investment alternatives available in the market. These indicators of performance can acts against investors fund performance. It is very important to select the right benchmark to evaluate a fund’s performance. So the problem arises that in which scheme they should invest according to their preferences. 4.4 OBJECTIVES OF THE STUDY 46 http://www.scribd.com/doc/84509919/Mutual-Funds 47 http://www.evelexa.com/resources/EGBS4_Kolchinsky.pdf
  • 46. 46 The primary object of the present project is to know about which mutual funds gave highest performance in a short-term period.  To know about types of mutual funds in detail.    To know, which schemes gives highest return within one-year.    To find the extent of diversification in the portfolio of securities of sponsored mutual funds.    To compare the performance of sponsored mutual funds using traditional investment measures.  In general, Mutual Funds are not considered to be too risky because they invest in dozens or even hundreds of stocks. But Mutual Funds being market- linked are prime candidates for stock market related risks. The four aspects that you should take into account while analyzing risk in Mutual Fund investment are volatility of the fund as indicated by the Standard Deviation, risk-adjusted returns as calculated by the Sharpe Ratio, Beta and Alpha. Standard Deviation shows the degree of risk taken on by the fund, Sharpe Ratio shows the return generated by the fund per unit of risk taken. Beta shows how much a fund moves when compared to an appropriate index. Alpha represents the difference between a Mutual Fund's actual performance and the performance that would be expected based on the level of risk taken by the manager. A Fund with low risk is the one with the lowest Standard Deviation, the highest Sharpe Ratio within its peer group, Beta closer to one and Alpha above one. It is advisable for you to evaluate these measures on a historical basis so as to identify the most consistent performers.
  • 48. 48 Research Design is the roadmap for carrying out the research activity in the project. In our project of “Performance Evaluation of Mutual Fund” we have carried out the research of which mutual fund is providing higher return by comparing the returns of different mutual funds and we have also compared whether the mutual fund can beat the market return or not. For this research activity  We have selected 10 mutual funds from Indian market. All funds are in equity growth category.    Data has been collected from money control, value research online, and mutual fund India web sites.    Funds selected are mostly preferable by investors.     Treasury bill rate of return is selected as risk free return, which is 8.5% p.a.    Collected NAV of funds of each quarter for the year 2013 and define return.    Defined standard deviation on the basis of Quarterly return.    Found out average return.     Defined beta of funds and market, S&P CNX Nifty index return is taken as market return.    Found out Treynor, Sharpe and Jensen ratio and performance.    Finally we have given rank to mutual funds according to each ratio.  5.2 SOURCES OF DATA
  • 49. 49 Here in this research project we have used Secondary source of data as the return for different mutual funds and market cannot be established by ourselves. 5.3 DATA COLLECTION METHOD Here in this research project we have used data which were published on the websites of Bombay stock exchange, Money control, value research online, National stock exchange and mutual fund India. 5.4 POPULATION Population is a collection of items of interest in research. The population represents a group that you wish to generalize your research to. Here in this research project we have taken the population of 46 mutual fund house in India. Out of 46 we have selected 6 fund houses on the asset under management basis. 10 Funds across 6 fund houses have been selected. This population is based on the type of mutual fund i.e. “Equity Growth mutual funds” There are various schemes available in the mutual fund like debt, equity, balanced, guilt etc. But out of these schemes we have selected Equity growth scheme as a population. 5.5 SAMPLING METHOD The random sample
  • 50. 50 Convenient sample is one of the main types of non probability sampling method. A convenience sample is made up of people who are easy to reach. Consider the following example. A pollster interviews shoppers at a local mall. If the mall was chosen because it was a convenient site from which to solicit survey participants and/or because it was close to the pollster's home or business, this would be a convenience sample. Here in this research project we have used convenient sample method for sampling. We have taken the Sample of “10 Equity Growth mutual funds” on the basis of their highest annual average return in the year 2013.
  • 51. 51 CHAPTER – 6 DATA ANALYSIS AND INTERPRETATION 6.1 ANALYSIS OF MUTUAL FUND PERFORMANCE
  • 52. 52 Mutual fund performance can be analyzed through performance measurement ratios which are use in portfolio analysis. We here are using Treynor, Sharpe, and Jensen ratio to evaluate mutual funds and rank accordingly. Composite portfolio performance measures have the flexibility of combining risk and return performance into a single value. The most commonly used composite measures are: Treynor, Sharpe and Jensen measures. While Treynor measures only the systematic risk summarized by beta, Sharpe concentrates on total risk of the mutual fund. TREYNER’S PERFORMANCE INDEX Treynor (1965) was the first researcher developing a composite measure of portfolio performance. He measures portfolio risk with beta, and calculates portfolio’s market risk premium relative to its beta: Where: Ti = Treynor’s Performance Index Rp = Portfolio’s actual return during a specified time period Rf = Risk-free rate of return during the same period βp = beta of the portfolio Whenever Rp> Rf and βp > 0 a larger T value means a better portfolio for all investors Regardless of their individual risk preferences. In two cases we may have a negative T value: when Rp < Rf or when βp < 0. If T is negative because Rp < Rf we judge the portfolio performance as very poor. However, if the negativity of T comes from a negative beta, fund’s performance is superb. Finally when Rp- Rf, and βp are both negative, T will be positive.
  • 53. 53 Demonstration of Comparative Treynor Measures Assume we have the following data for three mutual funds; ZBY, with their respective annual rate of return and systematic risk, Beta. The risk free rate is 8 %. The systematic risk for M (market) is 1.0 and the rate of return for M is 14%. Investment Manager Rate of Return Beta Z 0.12 0.90 B 0.16 1.05 Y 0.18 1.2 M 0.14 1.0 Table 6.1 We can calculate the T values for each investment manager: TM (0.14-0.08) / 1.00 = 0.06 TZ (0.12-0.08) / 0.90 = 0.044 TB (0.16-0.08) / 1.05 = 0.076 TY (0.18-0.08) / 1.20 =0.083 Table 6.2 These results show that Z did not even "beat-the-market." Y had the best performance, and both B and Y beat the market SAMPLE OF 10 MUTUAL FUNDS
  • 54. 54 Company Avg. return of 2013 ICICI prudential technology Reg 62.55 % SBI IT 54.50 % Franklin InfoTech 53.34 % Birla sun life new millennium 50.25 % ICICI prudential export & other services Reg 43.59 % SBI Pharma 26.05 % UTI transportation & logistics 24.69 % Reliance Pharma 20.87 % Franklin India smaller companies 13.22 % SBI FMCG 9.29 % TREYNER’S PERFORMANCE INDEX
  • 55. 55 Comapny Rp Rf Beta Treynor Index ICICI prudential technology Reg 62.55 % 8.5 % 0.35 154.428 SBI IT 54.50 % 8.5 % 0.81 56.790 Franklin InfoTech 53.34 % 8.5 % 0.93 48.215 Birla sun life new millennium 50.25 % 8.5 % 0.53 78.773 ICICI prudential export & other services Reg 43.59 % 8.5 % 0.62 56.596 SBI Pharma 26.05 % 8.5 % 0.92 19.076 UTI transportation & logistics 24.69 % 8.5 % 3.17 5.107 Reliance Pharma 20.87 % 8.5 % 1.64 7.542 Franklin India smaller companies 13.22 % 8.5 % 2.34 2.017 SBI FMCG 9.29 % 8.5 % 0.11 7.181 RANKING ACCORDING TO TREYNER
  • 56. 56 Rank Particular 1 ICICI prudential technology Reg 2 Birla sun life new millennium 3 SBI IT 4 ICICI prudential export & other services Reg 5 Franklin InfoTech 6 SBI Pharma 7 Reliance Pharma 8 SBI FMCG 9 UTI transportation & logistics 10 Franklin India smaller companies INTERPRETATION In our analysis we have given ranks on the basis of higher Treyner’s index. Higher Treyner’s index gets 1st rank. Treyner’s performance index measures (Beta) systematic risk of portfolio. This model does not consider total risk (systematic risk + unsystematic risk). In our analysis we have found out that SBI FMCG fund – growth has lower beta i.e. 0.21 as compared to other nine funds. Same way UTI transportation & logistic has higher beta i.e. 3.17. This analysis represents that SBI FMCG fund – growth gets higher Treyner’s performance index and it stands on eighth rank. Same way UTI transportation & logistic – growth gets lower Treyner’s performance index and it stands on 9th rank.
  • 57. 57 This analysis also represents that though ICICI prudential technology Reg fund growth has higher return i.e. 62.55 % as compared to other nine funds, it stands on third rank as it is having higher beta i.e. 0.35. Thus at last we want to conclude that according to Treyner’s Performance Index, it is not necessary that fund with higher return is always well performing fund and stands on first rank because we also have to consider risk associated with that fund. SHARPE’S PERFORMANCE INDEX Sharpe (1966) developed a composite index which is very similar to the Treynor measure, the only difference being the use of standard deviation, instead of beta, to measure the portfolio risk, in other words except it uses the total risk of the portfolio rather than just the systematic risk. Where: Si = Sharpe performance index = Portfolio standard deviation Sharpe index, evaluates funds performance based on both rate of return and diversification. For a completely diversified portfolio Treynor and Sharpe indices would give identical rankings. Demonstration of Comparative Sharpe Measures Assume we have the following data for three portfolios; BOP, with their respective annual rate of return and standard deviation of their return.
  • 58. 58 The risk free rate is 8 %. The standard deviation for M (market) is 0.20 and the rate of return for M is 14%. Portfolio Annual rate of Return S.D of Return B 0.13 0.18 O 0.17 0.22 P 0.16 0.23 M 0.14 0.20 Table 6.6 We can calculate the S values for each portfolio. B (0.13-0.08) / 0.18 = 0.278 O (0.17-0.08) / 0.22 = 0.409 P (0.16-0.08) / 0.23 = 0.348 M (0.14-0.08) / 0.20 = 0.30 Table 6.7 Thus, portfolio O did the best, and B failed to beat the market. The trouble with both Sharpe and Treynor techniques for evaluating "risk- adjusted" returns is that they equate risk with short-term volatility. Therefore these measures may not be applicable in evaluating the relative merits of long-term investments SHARPE’S PERFORMANCE INDEX
  • 59. 59 Company Rp Rf Standard Deviation Sharpe’s Index ICICI prudential technology Reg 62.55 % 8.5 % 12.50 4.324 SBI IT 54.50 % 8.5 % 11.31 4.067 Franklin InfoTech 53.34 % 8.5 % 11.38 3.940 Birla sun life new millennium 50.25 % 8.5 % 9.40 4.441 ICICI prudential export & other services Reg 43.59 % 8.5 % 7.04 4.984 SBI Pharma 26.05 % 8.5 % 5.16 3.401 UTI transportation & logistics 24.69 % 8.5 % 15.07 1.074 Reliance Pharma 20.87 % 8.5 % 7.53 1.642 Franklin India smaller companies 13.22 % 8.5 % 10.84 0.435 SBI FMCG 9.29 % 8.5 % 2.84 0.278 RANKING ACCORDING TO SHARPE
  • 60. 60 Rank Particular 1 ICICI prudential export & other services Reg 2 Birla sun life new millennium 3 ICICI prudential technology Reg 4 SBI IT 5 Franklin InfoTech 6 SBI Pharma 7 Reliance Pharma 8 UTI transportation & logistics 9 Franklin India smaller companies 10 SBI FMCG INTERPRETATION In our analysis we have given ranks on the basis of higher Sharpe’s index. Higher Sharpe’s index gets 1 st rank. Sharpe’s performance index measures standard deviation of portfolio. This model considers total risk i.e. both systematic risk and unsystematic risk. In our analysis we have found out that Reliance Pharma fund – growth has a return of 9.29 % and on the basis of return it stands on seventh rank but its standard deviation is 2.84 which is lower as compared to other nine funds. This thing indicates that ICICI prudential export and other service Reg Fund stands on first rank because it is providing good return with moderate risk.
  • 61. 61 We have analyzed that SBI FMCG Fund – growth plan also has lower standard deviation and then also it stands on last rank according to Sharpe’s performance index. The reason behind this is that this fund is providing lower return as compared to other nine funds. This thing indicates that SBI FMCG Fund stands on last rank because it is providing lower return with lower risk. Thus at last we want to conclude that according to Sharpe’s Performance Index, it is not necessary that fund with higher return is always well performing fund and stands on first rank because we also have to consider risk associated with that fund. Further return of fund should also be good enough; it should not be so lower. JENSEN’S ALPHA Jensen (1968), on the other hand, writes the following formula in terms of realized rates of return, assuming that CAPM is empirically valid. Jensen uses α as his performance measure. A superior portfolio manager would have a significant positive α value because of the consistent positive residuals. Inferior managers, on the other hand, would have significant negative α. Average portfolio managers having no forecasting ability but, still, cannot be considered inferior would earn as much as one could expect on the basis of the CAPM. Jensen performance criterion, like the Treynor measure, does not evaluate the ability of portfolio managers to diversify, since the risk premiums are calculated in terms of β. If the value is positive, and then the portfolio is earning excess returns. In other words, a positive value for Jensen's alpha means a fund manager has
  • 62. 62 beat the market with his or her stock picking skills. JENSEN’S PERFORMANCE INDEX
  • 63. 63 Particular Rp Rf Rm Beta Jensen’s Index ICICI prudential technology Reg 62.55 % 8.5 % 5.72 % 0.35 55.023 SBI IT 54.50 % 8.5 % 5.72 % 0.81 48.2518 Franklin InfoTech 53.34 % 8.5 % 5.72 % 0.93 47.4254 Birla sun life new millennium 50.25 % 8.5 % 5.72 % 0.53 43.2234 ICICI prudential export & other services Reg 43.59 % 8.5 % 5.72 % 0.62 36.8136 SBI Pharma 26.05 % 8.5 % 5.72 % 0.92 20.0616 UTI transportation & logistics 24.69 % 8.5 % 5.72 % 3.17 25.0026 Reliance Pharma 20.87 % 8.5 % 5.72 % 1.64 16.9292 Franklin India smaller companies 13.22 % 8.5 % 5.72 % 2.34 11.2252 SBI FMCG 9.29 % 8.5 % 5.72 % 0.11 1.0958
  • 64. 64 RANKING ACCORDING TO JENSEN Rank Particular 1 ICICI prudential technology Reg 2 SBI IT 3 Franklin InfoTech 4 Birla sun life new millennium 5 ICICI prudential export & other services Reg 6 UTI transportation & logistics 7 SBI Pharma 8 Reliance Pharma 9 Franklin India smaller companies 10 SBI FMCG INTERPRETATION In our analysis we have given ranks on the basis of higher Jensen’s index. Higher Jensen’s index gets 1 st rank. Jensen’s performance index measures alpha of portfolio. This model indicates that higher the value of alpha, higher is the ability of a fund manager to select good fund. We have analyzed that alpha of ICICI prudential technology Reg– growth is very high i.e. 62.55 % as compared to other nine funds and it stands on first rank. This positive value of alpha indicates that fund manager is able to select ICICI prudential technology Reg fund as a good fund. We have also analyzed that alpha of SBI FMCG Fund is lower. This may be due to its lower return. Thus though the risk associated with SBI FMCG Fund is lower, its alpha value is lower because of its lower return. Finally we want to conclude that according to Jensens’s alpha, the value of
  • 65. 65 alpha not only depends on the return of the fund but also on the risk associated with that fund. Value of alpha should be always positive. COMPARISION OF TREYNOR, SHARPE & JENSEN’S INDEX Rank Treynor Rank Sharpe Rank Jensen 1 ICICI prudential technology Reg 1 ICICI prudential export & other services Reg 1 ICICI prudential technology Reg 2 Birla sun life new millennium 2 Birla sun lifenew millennium 2 SBI IT 3 SBI IT 3 ICICI prudential technology Reg 3 Franklin InfoTech 4 ICICI prudential export & other services Reg 4 SBI IT 4 Birla sun life new millennium 5 Franklin InfoTech 5 Franklin InfoTech 5 ICICI prudential export & other services Reg 6 SBI Pharma 6 SBI Pharma 6 UTI transportation & logistics 7 Reliance Pharma 7 Reliance Pharma 7 SBI Pharma 8 SBI FMCG 8 UTI transportation & logistics 8 Reliance Pharma 9 UTI transportation & logistics 9 Franklin India smaller companies 9 Franklin India smaller companies 10 Franklin India smaller companies 10 SBI FMCG 10 SBI FMCG ANALYSIS
  • 66. 66 The fact that Sharpe uses Standard deviation as a measurement of risk which is the total risk and Treynor uses Beta or systematic risk, but yet it is claimed that, if we are examining a well-diversified portfolio, the rankings should be similar for all three methods. Due to this interesting theory we have decided to analyze the performance of the portfolios and they will be ranked identically according to all three; Sharpe’s, Treynor’s and Jensen’s performance measurement. ICICI prudential technology Reg fund – growth get 1 st rank from all three method. From this analysis we have found out similarity in Sharpe and Jensen’s model because more schemes are on similar positions in these two models. Another reason behind this is that Sharpe measures total risk and Jensen measures the predictive ability of manager, where manager always consider total risk while selecting the security. Due to this reason both models indicate similar positions for more schemes.
  • 67. 67 CHAPTER – 7 RESULT AND FINDING The study done on the performance evaluation of Indian mutual funds was fruitful as all the objectives of the study were successfully achieved. The
  • 68. 68 following are the findings from this study.  The schemes selected for the study gave returns in coordination with the markets. When there was boom in the stock market the funds gave positive returns a little more than what the market had given. During the recessionary phase the markets declined steadily and so did the fund returns. Overall the fund returns and the market returns, for the period of 1 year taken into consideration for this study.     Mostly all the mutual fund schemes are able to beat the market. That means the schemes are well diversified.     From the entire 10 schemes best scheme is ICICI prudential technology Reg fund growth because in all the two models it stands on 1 st rank and also it provides good return.  From this analysis we have found out similarity in Sharpe and Jensen’s model because more schemes are on similar positions in these two models. Another reason behind this is that Sharpe measures total risk and Jensen measures the predictive ability of manager, where manager always consider total risk while selecting the security. Due to this reason both models indicate similar positions for more schemes.
  • 69. 69 CHAPTER – 8 LIMITATION OF THE STUDY 
  • 70. 70  We have selected 6 fund houses out of 46 fund houses due to time constrains. We have not studied all types of mutual fund of 46 fund houses. We have studied only equity growth fund. We also have not studied all schemes of 6 mutual fund houses. These schemes we have selected randomly.     Since the funds selected for this study were open ended equity based growth mutual funds the fund composition kept on changing over the time period, so it became difficult to understand the fund properties as historical data pertaining to the fund structure was not available.     Because of unavailability of historical data and fund composition it was difficult to ascertain the performance of the fund properties and a simple evaluation was done against the market performance. 
  • 71. 71 CHAPTER – 9 CONCLUSION AND SUGGESTON Mutual funds are one of the most highly growing products in financial services market. Mutual funds are suitable for all types of investors from risk adverse to risk bearer. Mutual funds have many options of return, risk free return,
  • 72. 72 constant return, market associated returned. Mutual funds are suitable to all age of investors, businessmen, salary person, etc. Investors need not to be expert in equity market; mutual funds can satisfy their need. Fund managers are expert in this area and invest fund in well diversified portfolio, high return with low risk is possible inn mutual fund. In today’s world, investors are showing more trust in mutual fund than any other financial product. There is no need of a financial consultant, if you have good knowledge of mutual funds and their type to invest. Mutual fund is subject to market risk, despite of that it have low risk than stock market. This is proved in performance evaluation section of this report. Performance evaluation measurement ratios i.e. Treynor’s, Sharpe’s and Jensen’s are used by fund managers to take decision of investment and to diversify portfolio.  Mutual Fund is subject to market risk, analyzing particular fund before investing.     Study historical return of funds, risk measurement ratios to evaluate fund.     There should be similarity in your and fund’s objective.      For high return invest in diversified funds, for tax saving invest in ELSS equity funds, for moderate risk and return invest in balance funds, for assure return invest in debt and liquid funds.     As per our opinion, investor should invest around 30% in mutual fund. 
  • 74. 74 1.1 RETURNS OF MUTUAL FUNDS FOR THE YEAR 2013 ICICI prudential technology Reg Quarter Mutual Fund Return Q1 10.18 Q2 -5.34 Q3 24.12 Q4 25.58 SBI IT Quarter Mutual Fund Return Q1 17.41 Q2 -7.24 Q3 21.45 Q4 16.81 Franklin InfoTech Quarter Mutual Fund Return Q1 16.70 Q2 -7.18 Q3 22.89 Q4 15.19 Birla sun life new millennium
  • 75. 75 Quarter Mutual Fund Return Q1 11.73 Q2 -4.31 Q3 20.03 Q4 17.08 ICICI prudential export and other service Reg Quarter Mutual Fund Return Q1 2.59 Q2 2.73 Q3 17.03 Q4 16.43 SBI Pharma Quarter Mutual Fund Return Q1 -2.69 Q2 10.43 Q3 7.57 Q4 9.04 UTI Transportation and logistic
  • 76. 76 Quarter Mutual Fund Return Q1 -10.76 Q2 4.09 Q3 2.63 Q4 30.79 Reliance Pharma Quarter Mutual Fund Return Q1 -6.04 Q2 7.12 Q3 4.40 Q4 15.02 Franklin India smaller companies Quarter Mutual Fund Return Q1 -7.79 Q2 3.07 Q3 -1.75 Q4 21.25 SBI FMCG
  • 77. 77 Quarter Mutual Fund Return Q1 -0.88 Q2 5.71 Q3 4.45 Q4 -0.13 1.2 RETURN OF INDEX FOR THE YEAR 2013 Quarter Index Q1 -5.1967 Q2 2.4156 Q3 -2.0870 Q4 6.4537 Appendix 2
  • 78. 78 2.1 CALCULATION OF BETA Beta is the measure of volatility of a stock, fund, portfolio, etc with respect to the market. If the beta is positive then the fund returns are directly proportional to the market returns and if the beta is negative then the fund returns are inversely proportional to the market. Formula: Where, βa = fund beta Cov (ra,rp) = covariance of the returns of the fund and the market, Var rp = variance of the market returns. ICICI prudential technology Reg Quarter Mutual Fund Return Index Beta Q1 10.18 -5.1967 Q2 -5.34 2.4156 0.35 Q3 24.12 -2.0870 Q4 25.58 6.4537 SBI IT
  • 79. 79 Quarter Mutual Fund Return Index Beta Q1 17.41 -5.1967 Q2 -7.24 2.4156 0.81 Q3 21.45 -2.0870 Q4 16.81 6.4537 Franklin InfoTech Quarter Mutual Fund Return Index Beta Q1 16.70 -5.1967 Q2 -7.18 2.4156 0.93 Q3 22.89 -2.0870 Q4 15.19 6.4537 Birla sun life new millennium Quarter Mutual Fund Return Index Beta Q1 11.73 -5.1967 Q2 -4.31 2.4156 0.53 Q3 20.03 -2.0870 Q4 17.08 6.4537 ICICI prudential export and other service Reg
  • 80. 80 Quarter Mutual Fund Return Index Beta Q1 2.59 -5.1967 Q2 2.73 2.4156 0.62 Q3 17.03 -2.0870 Q4 16.43 6.4537 SBI Pharma Quarter Mutual Fund Return Index Beta Q1 -2.69 -5.1967 Q2 10.43 2.4156 0.92 Q3 7.57 -2.0870 Q4 9.04 6.4537 UTI Transportation and logistic Quarter Mutual Fund Return Index Beta Q1 -10.76 -5.1967 Q2 4.09 2.4156 3.17 Q3 2.63 -2.0870 Q4 30.79 6.4537 Reliance Pharma
  • 81. 81 Quarter Mutual Fund Return Index Beta Q1 -6.04 -5.1967 Q2 7.12 2.4156 1.64 Q3 4.40 -2.0870 Q4 15.02 6.4537 Franklin India smaller companies Quarter Mutual Fund Return Index Beta Q1 -7.79 -5.1967 Q2 3.07 2.4156 2.34 Q3 -1.75 -2.0870 Q4 21.25 6.4537 SBI FMCG Quarter Mutual Fund Return Index Beta Q1 -0.88 -5.1967 Q2 5.71 2.4156 0.11 Q3 4.45 -2.0870 Q4 -0.13 6.4537 2.1 CALCULATION OF STANDARD DEVIATION
  • 82. 82 Standard Deviation is a tool which measures the variability of data the set. It is calculated to measure the riskiness of a fund, stock or portfolio. Higher the standard deviation means higher the risk and higher the returns of the asset and a low standard deviation mans that the asset is less risky and will generate less returns. The standard deviation of the fund returns are calculated with the following formula: Where, S = Standard Deviation N = number of quarters in the period X = mean of the period’s return Xi = return of the corresponding week. ICICI prudential technology Reg Quarter x x ( x - x ) ( x - x )² Standard deviation Q1 10.18 13.635 -3.455 11.9370 Q2 -5.34 13.635 -18.975 360.0506 Q3 24.12 13.635 10.485 109.9352 Q4 25.58 13.635 11.945 142.6830 Total Σ x =54.54 Σ( x - x )² = 624.6058 12.50 SBI IT
  • 83. 83 Quarter x x ( x - x ) ( x - x )² Standard deviation Q1 17.41 12.1075 5.3025 28.1165 Q2 -7.24 12.1075 -19.3475 374.3257 Q3 21.45 12.1075 9.3425 87.2823 Q4 16.81 12.1075 4.7025 22.1135 Total Σ x = 48.43 Σ( x - x )² = 511.8380 11.31 Franklin InfoTech Quarter x x ( x - x ) ( x - x )² Standard deviation Q1 16.70 11.9 4.8 23.04 Q2 -7.18 11.9 -19.08 364.0464 Q3 22.89 11.9 10.99 120.7801 Q4 15.19 11.9 3.29 10.8241 Total Σ x = 47.6 Σ( x - x )² = 518.6906 11.38 Birla sun life new millennium Quarter x x ( x - x ) ( x - x )² Standard deviation Q1 11.73 11.1325 0.5975 0.3570 Q2 -4.31 11.1325 -15.4425 238.4708 Q3 20.03 11.1325 8.8975 79.1655 Q4 17.08 11.1325 5.9475 35.3727 Total Σ x = 44.53 Σ( x - x )² = 353.3660 9.40
  • 84. 84 ICICI prudential export and other service Reg Quarter x x ( x - x ) ( x - x )² Standard deviation Q1 2.59 9.695 -7.105 50.4810 Q2 2.73 9.695 -6.965 48.5112 Q3 17.03 9.695 7.335 53.8022 Q4 16.43 9.695 6.735 45.3602 Total Σ x = 38.78 Σ( x - x )² = 198.1547 7.0383 SBI Pharma Quarter x x ( x - x ) ( x - x )² Standard deviation Q1 -2.69 6.0875 -8.7775 77.0445 Q2 10.43 6.0875 4.3425 18.8573 Q3 7.57 6.0875 1.4825 2.1978 Q4 9.04 6.0875 2.9525 8.7172 Total Σ x = 24.35 Σ( x - x )² = 106.8168 5.1676 UTI Transportation and logistic Quarter x x ( x - x ) ( x - x )² Standard deviation Q1 -10.76 6.6875 -17.4475 304.4152 Q2 4.09 6.6875 -2.5975 6.7470 Q3 2.63 6.6875 -4.0575 16.4633 Q4 30.79 6.6875 24.1025 580.9305 Total Σ x = 26.75 Σ( x - x )² = 908.5560 15.0711
  • 85. 85 Reliance Pharma Quarter x x ( x - x ) ( x - x )² Standard deviation Q1 -6.04 5.125 -11.165 124.6572 Q2 7.12 5.125 1.995 3.9800 Q3 4.40 5.125 -0.725 0.5256 Q4 15.02 5.125 9.895 97.9110 Total Σ x = 20.5 Σ( x - x )² = 227.0739 7.5344 Franklin India smaller companies Quarter x x ( x - x ) ( x - x )² Standard deviation Q1 -7.79 3.695 -11.485 131.9052 Q2 3.07 3.695 -0.625 0.3906 Q3 -1.75 3.695 -5.445 29.6480 Q4 21.25 3.695 17.555 308.1780 Total Σ x = 14.78 Σ( x - x )² = 470.1219 10.8411 SBI FMCG Quarter x x ( x - x ) ( x - x )² Standard deviation Q1 -0.88 2.2875 -3.1675 10.0330 Q2 5.71 2.2875 3.4225 11.7135 Q3 4.45 2.2875 2.1625 4.6764 Q4 -0.13 2.2875 -2.4175 5.8443 Total Σ x = 9.15 Σ( x - x )² = 32.2672 2.8402
  • 86. 86 BIBLIOGRAPHY BOOKS AND PAPERS Reilly / Brown “Investments Analysis and Portfolio Management”, Ch 25 “Evaluation of Portfolio Performance” Page No: - 1040 – 1051 Fisher and Jordan “Security analysis and portfolio management”, Ch 20 “Managed portfolio and performance measurements” Page No: - 663 - 677 S. Kevin “Portfolio Management”, Ch 14 “Portfolio Evaluation” Page No: - 197 - 212 Dr. Rao, Narayan “Performance Evaluation of Indian Mutual Funds”, www.ssrn.com, paper no.433100 and PP.1-24 Prof. Banerjee, Ashok et. Al (2007),”Performance Evaluation of Indian Mutual Funds vis-à-vis their style benchmarks”, www.ssrn.com, paper no.962827 and PP.1-18 c Bhattacharjee,Kaushik and Prof. Roy,Bijan (2006), “Fund Performance Measurement Without Benchmark - A Case Of Select Indian Mutual Funds”, www.ssrn.com, paper no.962035 and PP. 1-10 Ahmed,Parvez; Gangopadhyay, Partha & Nanda, Sudhir (2001), “Performance of Emerging Market Mutual Funds”, www.ssrn.com, paper no.289278 and PP. 1-41
  • 87. 87 Rao,D.N. (2006), “4 Step model to evaluate performance of Mutual Funds in Saudi Arabia” www.ssrn.com, paper no.946937 and PP. 1-16 Kothari,S.P. and Warner,Jerold (1997), “Evaluating Mutual Fund Performance”, www.ssrn.com, paper no.75871 and PP. 1-46 Agrawal,Deepak (2007), “Measuring Performance of Indian Mutual funds”, www.ssrn.com, paper no.1311761 and PP. 1-17 Websites www.articlebase.com www.amfiindia.com www.financeresearch.net www.finance.indiamart.com www.bseindia.com www.nseindia.com www.karvy.com www.moneycontrol.com www.mutualfundsindia.com www.amfiindia.com www.ssrn.com 1 http://goldentalk.com/archive/index.html/t-41439.html 2 http://indianresearchjournals.com/pdf/IJMFSMR/2012/February/ijm-6.pdf 3 http://www.studymode.com/essays/Mutual-Funds-883302.html 4 http://www.mergersandinquisitions.com/hedge-funds-institutional-asset-management 5 http://www.moneycontrol.com/investor-education/classroom/knowhistory- structureadvantagesmutual-funds-724370.html 6 http://www.moneycontrol.com/investor-education/classroom/knowhistory- structureadvantagesmutual-funds-724370.html 7 http://www.getcited.org/pub/103509466
  • 88. 88 8 http://pt.slideshare.net/subhodeepbandopadhyay/market-risk-and-investment-performance-of- equity-mutual-funds-in-india 9 http://www.scribd.com/doc/27550490/Dissertation-on-Past-Performance-of-Mutual-Funds 10 http://www.slideshare.net/hemanthcrpatna/finance-project-on-performance-evaluation-of-indian- mutual-funds 11http://www.capitalmarket.com/mutual/mf-faqa.htm 12 http://www.ashishbusiness.in/mutual-funds 13 https://www.sec.gov/about/offices/oia/oia_investman/rplaze-042012.pdf 14 http://www.capitalmarket.com/mutual/mf-faqa.htm 15 http://my-people.net/mutual-fund-industry/ 16 http://my-people.net/mutual-fund-industry/ 17 http://businesstoday.intoday.in/story/mutual-fund-schemes-and-offers-in-coming- months/1/19520.html 18 http://indianresearchjournals.com/pdf/APJMMR/2012/October/19.pdf 19 http://indianresearchjournals.com/pdf/APJMMR/2012/October/19.pdf 20 http://www.rncos.com/Report/IM142.htm 21 http://www.amfiindia.com/research-information/mf-history 22 http://finance.indiamart.com/india_business_information/mutual_funds_industry.html 23 http://finance.indiamart.com/india_business_information/mutual_funds_industry.html 24 http://smallbusiness.chron.com/factors-affecting-economic-development-growth-1517.html 25 http://timesofindia.indiatimes.com/articles/Different-Types-and-Kinds-of-Mutual- Funds/articleshowhsbc/22624820.cms 26 http://www.assetmanagement.hsbc.com/in/mutual-funds/learning- centre/faqs/mut_funds_faqs.html 27 http://www.assetmanagement.hsbc.com/in/mutual-funds/learning- centre/faqs/mut_funds_faqs.html 28 http://southerncapital.in/benefits_mutualfunds.php 29 http://mutualfunds.about.com/od/mutualfundbasics/a/disadvmf.htm 30 http://www.investorguide.com/article/11139/disadvantages-of-investing-in-mutual-funds-igu/ 31 http://www.moneycontrol.com/investor-education/classroom/what-aredifferent-plans-that- mutual-funds-offer-1022380.html 32 http://www.slideshare.net/navnit1188/performance-evaluation-of-mutual-funds-4912211 33 http://financialplan.about.com/od/investing/a/MutualFundFees.htm 34 http://pt.slideshare.net/navnit1188/performance-evaluation-of-mutual-funds-4912211 35 http://pt.slideshare.net/navnit1188/performance-evaluation-of-mutual-funds-4912211 36 http://ebookily.net/pdf/performance-evaluation-of-mutual-funds-i 38 http://www.slideshare.net/subhodeepbandopadhyay/market-risk-and-investment-performance-of- equity-mutual-funds-in-india 39 http://pt.slideshare.net/subhodeepbandopadhyay/market-risk-and-investment-performance-of- equity-mutual-funds-in-india 40 http://www.scribd.com/doc/54073147/Research-Report-on-Performance-Evaluation-of-Indian- Mutual-Funds 41 http://www.scribd.com/doc/57359662/MBA-Project-Work-Performance-Evaluation-of-Mutual-Fund 42 http://www.edhec-risk.com/site_edhecrisk 43 http://www.scribd.com/doc/84509919/Mutual-Funds 44 http://www.siescoms.edu/journals/siescoms/Journal4.pdf 45 http://www.ukessays.co.uk/essays/finance/history-of-mutual-funds.php 46 http://www.scribd.com/doc/84509919/Mutual-Funds 47 http://www.evelexa.com/resources/EGBS4_Kolchinsky.pdf