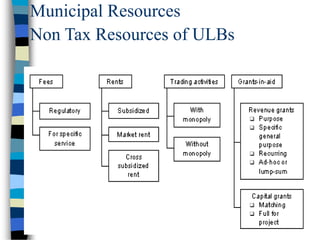
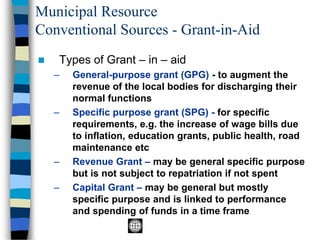
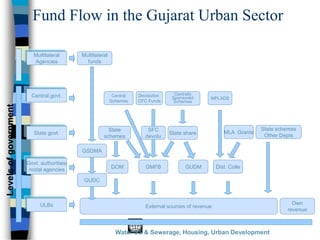
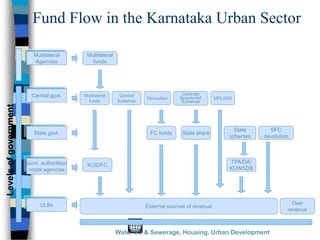
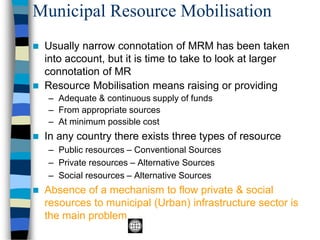
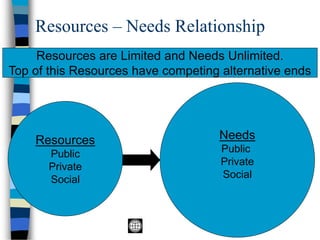
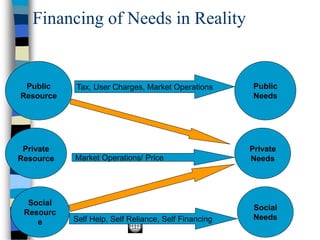
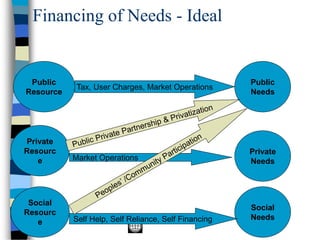
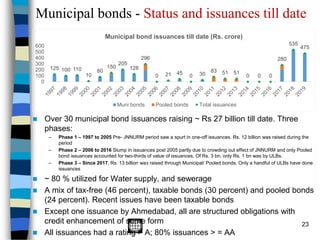
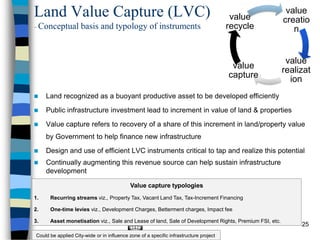
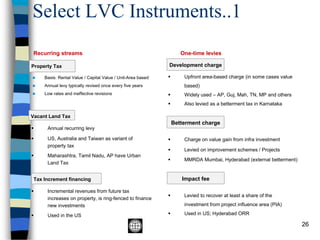
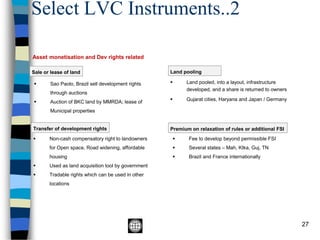
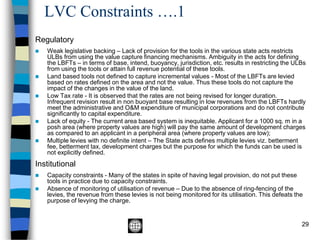
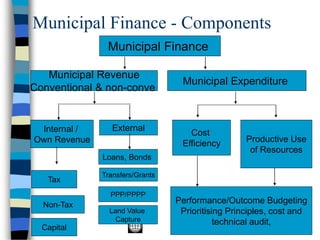
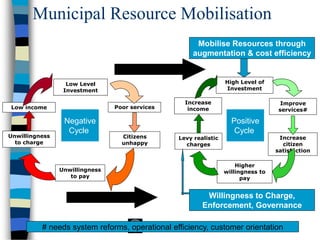
Municipal Resource
Mobilisation
Presentation for Webinar to E&Y Team
10th April, 2020
Ravikant Joshi
Municipal Resources-Typology
Conventional
Internal /
Own Revenue
External
Tax
Non-Tax
Capital
Govt. Loans
Transfers
Grants
Non-Conventional
Commercial
Loans
Public- Private
Partnership
Municipal Resources
Pricing
Mechanism
Accessing
Capital Market
• Equity
• Debt
Land as
Resource
Social Capital
through
community
participation
Municipal Resources - Conventional
Tax Transfers/Grants
Non-Tax Govt. Loans
•Tax on entry/
consumption of
goods(now
abolished)
•Property Tax
•Professional Tax
•Local Income Tax
•Tax on animals
•Tax on vehicles
•Sp. benefit tax
•Local Excise
•User charges for
urban services
•Income from sale
of goods/services
•Rents
•Returns on
investments
•Profits
•Licence Fees
•Fines
•Sale of Assets
•From central
government
•From state or
provincial govt
•Government
Agency
•Municipal
development
funds
•Formulae based
devolution or
share in some
resources of
higher govts.
•Formulae based
Grants
•Untied Grants
•Adhoc Grants
•Special purpose
Grants
Conventional Resources
Municipal Resource in India
Conventional Sources - Tax Revenues
◼ Major Municipal Taxes are as follows
– Tax on property including service levy for water
supply, conservancy, drainage, lighting, fire and
garbage disposal etc.
– Octroi; (abolished)
– Tax on Professions (appropriated by State
Governments – constitutional limit Rs. 2400
– Tax on vehicles (other than motor vehicles).
– Toll
– Advertisement
Due to Some Weakening Factors…
◼ Inappropriate property tax policy
◼ Freezing of tax base due to rent control
mechanism to protect tenants
◼ Widespread under-reporting of actual
rents for tax purposes
◼ Subjective and non-transparent
practices of tax assessment
◼ Generous exemptions
And…
Weakening Factors (continued)
◼ Lack of indexation with inflation
◼ Absence of transparent, organised real estate
market leads to high taxes on property
◼ Inefficient tax administration
– Failure to bring all properties under tax net
– Failure to demand and recover tax from properties under
the net
– Absence of trained professional staff
– Weak enforcement mechanism, recovery and penalty
provisions
Reforming Property Tax - Steps
◼ Thorough analysis of existing system
◼ Identifying constraints and opportunities
◼ Appropriate reform strategy
◼ Any reform strategy will have to be holistic and
address:
– Tax Base
– Tax Rate
– Tax Coverage
– Tax Collections
◼ Political and social buy-in important
Policy and Legal Structural
Reforms
Administrative Reforms
Municipal Resources in India
Conventional Sources - Non Tax
◼ The own resources other than tax
– Municipal Act provides for issuance of licenses and
collection of fees for it
– Fee is a charge made in return for a benefit allowed or
conferred.
– When the service is extensively used, becomes a
public utility, then the fee charged is called a user
charge or user fee.
– It is charged for public utilities, parking, entry fees for
play ground, swimming pools etc.
Municipal Resources
Non Tax Resources of ULBs
Municipal Resource
Conventional Sources - Grant-in-Aid
◼ Types of Grant – in – aid
– General-purpose grant (GPG) - to augment the
revenue of the local bodies for discharging their
normal functions
– Specific purpose grant (SPG) - for specific
requirements, e.g. the increase of wage bills due
to inflation, education grants, public health, road
maintenance etc
– Revenue Grant – may be general specific purpose
but is not subject to repatriation if not spent
– Capital Grant – may be general but mostly
specific purpose and is linked to performance
and spending of funds in a time frame
Grants – Matrix Structure
Revenue Capital
Untide
(General
Purpose)
Tide
(Specific
Purpose
Adhoc
Grant
Formulae
Based
Grant
Fund Flow in the Gujarat Urban Sector
Multilateral
Agencies
Central govt.
State govt.
Govt. authorities/
nodal agencies
ULBs
Multilateral
funds
State share
State
schemes
Own
revenue
GUDM
Central
Schemes
Devolution
CFC Funds
Centrally
Sponsored
Schemes
GSDMA
MPLADS
GUDC
Water SS & Sewerage, Housing, Urban Development
MLA Grants
Levels
of
government
External sources of revenue
SFC
devolu
Dist. Colle
GMFB
DOM
State schemes
Other Depts
Fund Flow in the Karnataka Urban Sector
Multilateral
Agencies
Central govt.
State govt.
Govt. authorities/
nodal agencies
ULBs
Multilateral
funds
State share
State
schemes
Own
revenue
FC funds
Central
Schemes
Devolution
Centrally
Sponsored
Schemes
Multilateral
funds
MPLADS
KUIDFC
Water SS & Sewerage, Housing, Urban Development
TPA/DA/
KUWSDB
Levels
of
government
External sources of revenue
SFC
devolution
Municipal Resources
Conventional Sources - Borrowings
◼ The borrowing power of a local government is
regulated under Local Authorities Loans Act
(1914).
◼ This act provides that Municipal Corporations
can borrow for development activities and for
payment of debt charges
◼ State Municipal Acts put lot of adhoc, non-
performance based curbs rather than prudential
norms on borrowing powers of the municipal
bodies
◼ However forced lending happens to ULBs which
are not borrowing worthy.
Municipal Finance - Components
Municipal Resource Mobilisation
Alternative Sources
Alternative Sources
Loan
Financing
Private Sector
Participation
Pricing
Accessing
Capital Market
Commercial
Banks
Infrastructure
Banks
Municipal
Development
Fund
Specialised
Intermediaries
Leasing Contracting Franchising BOO, BOOT,
BOLT
Concession
Service
Management
User Charges
Tariff Reforms
Equity Market
Debt Market
Municipal
Bond
Infrastructure
Bond
Pooled Finance
Community
Participation
Municipal Resource Mobilisation – Why?
◼ Financing urban infrastructure is besieged with
several problems
◼ Post 2005 devolving more and more funds to
Municipal Bodies to finance urban infrastructure is
resorted by Central and State Governments.
◼ Unfortunately initiatives addressing municipal
finance issues have not been taken up by Central,
State and by municipal bodies
◼ But in rest of the world across the cities and
countries Municipal Resource Mobilisation is most
commonly resorted initiative
◼ Share of MORR has reduced from 63% to 43%
during 2002-2018
◼ Funding of CAPEX by Grants increased from 73%
to 84% during 2011-18
Municipal Resource Mobilisation
◼ Usually narrow connotation of MRM has been taken
into account, but it is time to take to look at larger
connotation of MR
◼ Resource Mobilisation means raising or providing
– Adequate & continuous supply of funds
– From appropriate sources
– At minimum possible cost
◼ In any country there exists three types of resource
– Public resources – Conventional Sources
– Private resources – Alternative Sources
– Social resources – Alternative Sources
◼ Absence of a mechanism to flow private & social
resources to municipal (Urban) infrastructure sector is
the main problem
Resources – Needs Relationship
Resources
Public
Private
Social
Needs
Public
Private
Social
Resources are Limited and Needs Unlimited.
Top of this Resources have competing alternative ends
Financing of Needs in Reality
Public
Resource
Private
Resource
Social
Resourc
e
Public
Needs
Private
Needs
Social
Needs
Market Operations/ Price
Tax, User Charges, Market Operations
Self Help, Self Reliance, Self Financing
Financing of Needs - Ideal
Public
Resource
Private
Resourc
e
Social
Resourc
e
Public
Needs
Private
Needs
Social
Needs
Tax, User Charges, Market Operations
Market Operations
Self Help, Self Reliance, Self Financing
Municipal Resource Mobilisation
Alternative Sources
◼ Why alternative sources of financing?
– Inadequacy of conventional sources.
– Bridging of resource gap.
– Improving the financial and project
management capabilities.
– Inculcating financial discipline.
– Attaining objectives of accountability,
transparency and efficiency.
Municipal bonds - Status and issuances till date
23
◼ Over 30 municipal bond issuances raising ~ Rs 27 billion till date. Three
phases:
– Phase 1 – 1997 to 2005 Pre- JNNURM period saw a spurt in one-off issuances. Rs. 12 billion was raised during the
period
– Phase 2 – 2006 to 2016 Slump in issuances post 2005 partly due to crowding out effect of JNNURM and only Pooled
bond issuances accounted for two-thirds of value of issuances. Of Rs. 3 bn, only Rs. 1 bn was by ULBs.
– Phase 3 – Since 2017, Rs. 13 billion was raised through Municipal/ Pooled bonds. Only a handful of ULBs have done
issuances
◼ ~ 80 % utilized for Water supply, and sewerage
◼ A mix of tax-free (46 percent), taxable bonds (30 percent) and pooled bonds
(24 percent). Recent issues have been taxable bonds
◼ Except one issuance by Ahmedabad, all are structured obligations with
credit enhancement of some form
◼ All issuances had a rating > A; 80% issuances > = AA
125 100 110
10
80
150
205
128
296
0 21 45
0 30
83 51 51
0 0 0
280
535
475
0
100
200
300
400
500
600
Municipal bond issuances till date (Rs. crore)
Muni bonds Pooled bonds Total issuances
Role of PPP is still negligible
◼ 174 awarded projects involving an outlay of Rs. 41,258 crore
awarded during the last 15 years - more than 100 of these were
awarded during 2007-13, with project awards peaking in 2010.
◼ Recently, under the Smart Cities Mission, 82 projects worth Rs.
3704 crore were awarded (out of 195 projects worth Rs. 15,972
crore that have been proposed)
◼ PPPs in urban sector barring exception, have been developed as
one-off initiatives (often champion-led) without backing these
with programmatic scale-up efforts and hence remain consigned
to piloting and proof-of-concept efforts nearly every time.
◼ Second, weak counterparty capacity, in project development,
regulation and monitoring, and associate risks of contract
sanctity adversely impacts risk profile of projects.
◼ Third, given lack of visible opportunities and adverse risk profile,
the developer-bidder ecosystem is weak as there is little
incentive to invest in creating requisite capacity in the first place.
◼ Urban PPPs are thus stymied by lack of program-scale initiatives
beyond one-off projects, policy ambivalence on reforms,
counterparty risks & contract sanctity concerns.
Land Value Capture (LVC)
– Conceptual basis and typology of instruments
25
◼ Land recognized as a buoyant productive asset to be developed efficiently
◼ Public infrastructure investment lead to increment in value of land & properties
◼ Value capture refers to recovery of a share of this increment in land/property value
by Government to help finance new infrastructure
◼ Design and use of efficient LVC instruments critical to tap and realize this potential
◼ Continually augmenting this revenue source can help sustain infrastructure
development
value
creatio
n
value
realizat
ion
value
capture
value
recycle
Value capture typologies
1. Recurring streams viz., Property Tax, Vacant Land Tax, Tax-Increment Financing
2. One-time levies viz., Development Charges, Betterment charges, Impact fee
3. Asset monetisation viz., Sale and Lease of land, Sale of Development Rights, Premium FSI, etc.
Could be applied City-wide or in influence zone of a specific infrastructure project
Select LVC Instruments..1
26
Property Tax
◼ Basis: Rental Value / Capital Value / Unit-Area based
◼ Annual levy typically revised once every five years
◼ Low rates and ineffective revisions
Vacant Land Tax
▪ Annual recurring levy
▪ US, Australia and Taiwan as variant of
property tax
▪ Maharashtra, Tamil Nadu, AP have Urban
Land Tax
Tax Increment financing
▪ Incremental revenues from future tax
increases on property, is ring-fenced to finance
new investments
▪ Used in the US
Recurring streams One-time levies
Development charge
Betterment charge
Impact fee
▪ Charge on value gain from infra investment
▪ Levied on improvement schemes / Projects
▪ MMRDA Mumbai, Hyderabad (external betterment)
▪ Upfront area-based charge (in some cases value
based)
▪ Widely used – AP, Guj, Mah, TN, MP and others
▪ Also levied as a betterment tax in Karnataka
▪ Levied to recover at least a share of the
investment from project influence area (PIA)
▪ Used in US; Hyderabad ORR
Select LVC Instruments..2
27
Asset monetisation and Dev rights related
Sale or lease of land
Transfer of development rights
▪ Non-cash compensatory right to landowners
for Open space, Road widening, affordable
housing
▪ Used as land acquisition tool by government
▪ Tradable rights which can be used in other
locations
Land pooling
▪ Land pooled, into a layout, infrastructure
developed, and a share is returned to owners
▪ Gujarat cities, Haryana and Japan / Germany
▪ Sao Paolo, Brazil sell development rights
through auctions
▪ Auction of BKC land by MMRDA; lease of
Municipal properties
Premium on relaxation of rules or additional FSI
▪ Fee to develop beyond permissible FSI
▪ Several states – Mah, Ktka, Guj, TN
▪ Brazil and France internationally
LVC - Constraints….1
Land based tools not being designed to capture incremental value
28
Demand Side
◼ Lack of planning for city investment needs –Thus the levies collected by the
ULBs are not based on any scientific calculation and do not reflect the cities’
investment requirement. These revenues are not even adequate to meet the
administrative and O&M costs in the cities.
◼ Revenue losses due to existence of multiple stakeholders such as State
Government, Central organizations, ULBs, Development Organisations etc.
◼ LVC are susceptible to cycles of volatility in real estate market
Supply side
◼ Lack of techniques to capture true capital value: Capturing the value of land
and/or property requires data on land and property sales as well as
data on land and property attributes. Guideline values determined by
the state governments provides the database, but values generally do
not reflect the open market prices
◼ Tools such as TDR, premium FSI, etc. have potential in cities with high
demand for real estate.
LVC Constraints ….1
29
Regulatory
◼ Weak legislative backing – Lack of provision for the tools in the various state acts restricts
ULBs from using the value capture financing mechanisms. Ambiguity in the acts for defining
the LBFTs – in terms of base, intend, buoyancy, jurisdiction, etc. results in restricting the ULBs
from using the tools or attain full revenue potential of these tools.
◼ Land based tools not defined to capture incremental values - Most of the LBFTs are levied
based on rates defined on the area and not the value. Thus these tools do not capture the
impact of the changes in the value of the land.
◼ Low Tax rate - It is observed that the rates are not being revised for longer duration.
Infrequent revision result in non buoyant base resulting in low revenues from the LBFTs hardly
meet the administrative and O&M expenditure of municipal corporations and do not contribute
significantly to capital expenditure.
◼ Lack of equity - The current area based system is inequitable. Applicant for a 1000 sq. m in a
posh area (where property values are high) will pay the same amount of development charges
as compared to an applicant in a peripheral area (where property values are low);
◼ Multiple levies with no definite intent – The State acts defines multiple levies viz. betterment
fee, betterment tax, development charges but the purpose for which the funds can be used is
not explicitly defined.
Institutional
◼ Capacity constraints - Many of the states in spite of having legal provision, do not put these
tools in practice due to capacity constraints.
◼ Absence of monitoring of utilisation of revenue – Due to the absence of ring-fencing of the
levies, the revenue from these levies is not being monitored for its utilisation. This defeats the
purpose of levying the charge.
Municipal Finance - Components
Municipal Revenue
Conventional & non-conve
Internal /
Own Revenue
External
Tax
Non-Tax
Capital
Loans, Bonds
Transfers/Grants
Municipal Expenditure
Cost
Efficiency Productive Use
of Resources
Municipal Finance
Performance/Outcome Budgeting
Prioritising Principles, cost and
technical audit,
PPP/PPPP
Land Value
Capture
Vicious Cycle of Low Level of Performance
and Finances
Poor
Organizational
Capacity
Poor Quality of
Services
Low Fiscal
Capacity
Poor
Organizational
Capacity
Poor
Quality of
Services
Low Fiscal
Capacity
Low
Productivity
Low
Expectation
Low Willingness to Pay
Lack of Investment
Lack of System for
Resource Mobilization
Low Level of
Resources
Lack of Willingness to Pay - The negative cycle
Low investment
Poor services
Citizens
unhappy
Unwillingness
to pay
Unwillingness
to charge
Low income
The Crux of
Financing
Urban
Infrastructure
Known as Low Equilibrium Trap
Need to Create - A Positive Cycle
Higher Investment
Improve
services
Increase citizen
satisfaction
Higher willingness
to pay
Levy realistic
charges
Increase
income
A Way Out/
Solution to
Financing
Urban
Infrastructure
Breaking Vicious Cycle of the low
level of performance and finance
◼ Outcomes rather than outputs based management,
provisioning than producing
◼ Customer- focused management
◼ Cost- Effective Management - Improving
management control systems to drive down costs
and improve cost recovery.
◼ Quality Management - Improving quality of
services- benchmarking with international
practices.
◼ Improving employee productivity through capacity
building and professionalisation of cadre
Municipal Resource Mobilisation
Low Level
Investment
Poor services
Citizens
unhappy
Unwillingness
to pay
Unwillingness
to charge
Low income
High Level of
Investment
Improve
services#
Increase
citizen
satisfaction
Higher
willingness to
pay
Levy realistic
charges
Increase
income
Mobilise Resources through
augmentation & cost efficiency
Negative
Cycle
Positive
Cycle
Willingness to Charge,
Enforcement, Governance
# needs system reforms, operational efficiency, customer orientation
Municipal Resource Mobilisation
– Way Forward
◼ Increase ULBs Income from all sources
– Rationalise taxes, make them broad base
– Charge wherever it possible, must recover O&M and CAPEX to
possible extent – not only 20 percent as it is at present
– Earn through market-based operations
◼ Control expenditure in maximum possible ways
– Adopt prioritisation principles, outcome budgeting
◼ Improve cost efficiency (productivity) continuously
– System and HR reforms
– Harnessing alternative sources of financing
◼ Create mechanism to flow private and social resources
for financing urban infrastructure that is harnessing
alternative resources
◼ In sum improve creditworthiness of ULB
Municipal Resource Mobilisation –
Way Forward
◼ Must leverage funds but through right mode of borrowing
◼ Ensure that the new systems are:
– Broad based, Holistic and Scalable
– Integrates with other important components of reforms to ensure
benefits
◼ Create buy-in through
– Opinion building by disseminating benefits of management
(financial and general) reforms
– Change management
– Peoples’/Community Participation in Governance
◼ Address human resource constraints
– Capacity building of all actors and stakeholders
◼ Create adequate support systems
Municipal Resource
Mobilisation
Thank You

Municipal Resource Mobilisation

  • 1.
    Municipal Resource Mobilisation Presentation forWebinar to E&Y Team 10th April, 2020 Ravikant Joshi
  • 2.
    Municipal Resources-Typology Conventional Internal / OwnRevenue External Tax Non-Tax Capital Govt. Loans Transfers Grants Non-Conventional Commercial Loans Public- Private Partnership Municipal Resources Pricing Mechanism Accessing Capital Market • Equity • Debt Land as Resource Social Capital through community participation
  • 3.
    Municipal Resources -Conventional Tax Transfers/Grants Non-Tax Govt. Loans •Tax on entry/ consumption of goods(now abolished) •Property Tax •Professional Tax •Local Income Tax •Tax on animals •Tax on vehicles •Sp. benefit tax •Local Excise •User charges for urban services •Income from sale of goods/services •Rents •Returns on investments •Profits •Licence Fees •Fines •Sale of Assets •From central government •From state or provincial govt •Government Agency •Municipal development funds •Formulae based devolution or share in some resources of higher govts. •Formulae based Grants •Untied Grants •Adhoc Grants •Special purpose Grants Conventional Resources
  • 4.
    Municipal Resource inIndia Conventional Sources - Tax Revenues ◼ Major Municipal Taxes are as follows – Tax on property including service levy for water supply, conservancy, drainage, lighting, fire and garbage disposal etc. – Octroi; (abolished) – Tax on Professions (appropriated by State Governments – constitutional limit Rs. 2400 – Tax on vehicles (other than motor vehicles). – Toll – Advertisement
  • 5.
    Due to SomeWeakening Factors… ◼ Inappropriate property tax policy ◼ Freezing of tax base due to rent control mechanism to protect tenants ◼ Widespread under-reporting of actual rents for tax purposes ◼ Subjective and non-transparent practices of tax assessment ◼ Generous exemptions And…
  • 6.
    Weakening Factors (continued) ◼Lack of indexation with inflation ◼ Absence of transparent, organised real estate market leads to high taxes on property ◼ Inefficient tax administration – Failure to bring all properties under tax net – Failure to demand and recover tax from properties under the net – Absence of trained professional staff – Weak enforcement mechanism, recovery and penalty provisions
  • 7.
    Reforming Property Tax- Steps ◼ Thorough analysis of existing system ◼ Identifying constraints and opportunities ◼ Appropriate reform strategy ◼ Any reform strategy will have to be holistic and address: – Tax Base – Tax Rate – Tax Coverage – Tax Collections ◼ Political and social buy-in important Policy and Legal Structural Reforms Administrative Reforms
  • 8.
    Municipal Resources inIndia Conventional Sources - Non Tax ◼ The own resources other than tax – Municipal Act provides for issuance of licenses and collection of fees for it – Fee is a charge made in return for a benefit allowed or conferred. – When the service is extensively used, becomes a public utility, then the fee charged is called a user charge or user fee. – It is charged for public utilities, parking, entry fees for play ground, swimming pools etc.
  • 9.
    Municipal Resources Non TaxResources of ULBs
  • 10.
    Municipal Resource Conventional Sources- Grant-in-Aid ◼ Types of Grant – in – aid – General-purpose grant (GPG) - to augment the revenue of the local bodies for discharging their normal functions – Specific purpose grant (SPG) - for specific requirements, e.g. the increase of wage bills due to inflation, education grants, public health, road maintenance etc – Revenue Grant – may be general specific purpose but is not subject to repatriation if not spent – Capital Grant – may be general but mostly specific purpose and is linked to performance and spending of funds in a time frame
  • 11.
    Grants – MatrixStructure Revenue Capital Untide (General Purpose) Tide (Specific Purpose Adhoc Grant Formulae Based Grant
  • 12.
    Fund Flow inthe Gujarat Urban Sector Multilateral Agencies Central govt. State govt. Govt. authorities/ nodal agencies ULBs Multilateral funds State share State schemes Own revenue GUDM Central Schemes Devolution CFC Funds Centrally Sponsored Schemes GSDMA MPLADS GUDC Water SS & Sewerage, Housing, Urban Development MLA Grants Levels of government External sources of revenue SFC devolu Dist. Colle GMFB DOM State schemes Other Depts
  • 13.
    Fund Flow inthe Karnataka Urban Sector Multilateral Agencies Central govt. State govt. Govt. authorities/ nodal agencies ULBs Multilateral funds State share State schemes Own revenue FC funds Central Schemes Devolution Centrally Sponsored Schemes Multilateral funds MPLADS KUIDFC Water SS & Sewerage, Housing, Urban Development TPA/DA/ KUWSDB Levels of government External sources of revenue SFC devolution
  • 14.
    Municipal Resources Conventional Sources- Borrowings ◼ The borrowing power of a local government is regulated under Local Authorities Loans Act (1914). ◼ This act provides that Municipal Corporations can borrow for development activities and for payment of debt charges ◼ State Municipal Acts put lot of adhoc, non- performance based curbs rather than prudential norms on borrowing powers of the municipal bodies ◼ However forced lending happens to ULBs which are not borrowing worthy.
  • 15.
  • 16.
    Municipal Resource Mobilisation AlternativeSources Alternative Sources Loan Financing Private Sector Participation Pricing Accessing Capital Market Commercial Banks Infrastructure Banks Municipal Development Fund Specialised Intermediaries Leasing Contracting Franchising BOO, BOOT, BOLT Concession Service Management User Charges Tariff Reforms Equity Market Debt Market Municipal Bond Infrastructure Bond Pooled Finance Community Participation
  • 17.
    Municipal Resource Mobilisation– Why? ◼ Financing urban infrastructure is besieged with several problems ◼ Post 2005 devolving more and more funds to Municipal Bodies to finance urban infrastructure is resorted by Central and State Governments. ◼ Unfortunately initiatives addressing municipal finance issues have not been taken up by Central, State and by municipal bodies ◼ But in rest of the world across the cities and countries Municipal Resource Mobilisation is most commonly resorted initiative ◼ Share of MORR has reduced from 63% to 43% during 2002-2018 ◼ Funding of CAPEX by Grants increased from 73% to 84% during 2011-18
  • 18.
    Municipal Resource Mobilisation ◼Usually narrow connotation of MRM has been taken into account, but it is time to take to look at larger connotation of MR ◼ Resource Mobilisation means raising or providing – Adequate & continuous supply of funds – From appropriate sources – At minimum possible cost ◼ In any country there exists three types of resource – Public resources – Conventional Sources – Private resources – Alternative Sources – Social resources – Alternative Sources ◼ Absence of a mechanism to flow private & social resources to municipal (Urban) infrastructure sector is the main problem
  • 19.
    Resources – NeedsRelationship Resources Public Private Social Needs Public Private Social Resources are Limited and Needs Unlimited. Top of this Resources have competing alternative ends
  • 20.
    Financing of Needsin Reality Public Resource Private Resource Social Resourc e Public Needs Private Needs Social Needs Market Operations/ Price Tax, User Charges, Market Operations Self Help, Self Reliance, Self Financing
  • 21.
    Financing of Needs- Ideal Public Resource Private Resourc e Social Resourc e Public Needs Private Needs Social Needs Tax, User Charges, Market Operations Market Operations Self Help, Self Reliance, Self Financing
  • 22.
    Municipal Resource Mobilisation AlternativeSources ◼ Why alternative sources of financing? – Inadequacy of conventional sources. – Bridging of resource gap. – Improving the financial and project management capabilities. – Inculcating financial discipline. – Attaining objectives of accountability, transparency and efficiency.
  • 23.
    Municipal bonds -Status and issuances till date 23 ◼ Over 30 municipal bond issuances raising ~ Rs 27 billion till date. Three phases: – Phase 1 – 1997 to 2005 Pre- JNNURM period saw a spurt in one-off issuances. Rs. 12 billion was raised during the period – Phase 2 – 2006 to 2016 Slump in issuances post 2005 partly due to crowding out effect of JNNURM and only Pooled bond issuances accounted for two-thirds of value of issuances. Of Rs. 3 bn, only Rs. 1 bn was by ULBs. – Phase 3 – Since 2017, Rs. 13 billion was raised through Municipal/ Pooled bonds. Only a handful of ULBs have done issuances ◼ ~ 80 % utilized for Water supply, and sewerage ◼ A mix of tax-free (46 percent), taxable bonds (30 percent) and pooled bonds (24 percent). Recent issues have been taxable bonds ◼ Except one issuance by Ahmedabad, all are structured obligations with credit enhancement of some form ◼ All issuances had a rating > A; 80% issuances > = AA 125 100 110 10 80 150 205 128 296 0 21 45 0 30 83 51 51 0 0 0 280 535 475 0 100 200 300 400 500 600 Municipal bond issuances till date (Rs. crore) Muni bonds Pooled bonds Total issuances
  • 24.
    Role of PPPis still negligible ◼ 174 awarded projects involving an outlay of Rs. 41,258 crore awarded during the last 15 years - more than 100 of these were awarded during 2007-13, with project awards peaking in 2010. ◼ Recently, under the Smart Cities Mission, 82 projects worth Rs. 3704 crore were awarded (out of 195 projects worth Rs. 15,972 crore that have been proposed) ◼ PPPs in urban sector barring exception, have been developed as one-off initiatives (often champion-led) without backing these with programmatic scale-up efforts and hence remain consigned to piloting and proof-of-concept efforts nearly every time. ◼ Second, weak counterparty capacity, in project development, regulation and monitoring, and associate risks of contract sanctity adversely impacts risk profile of projects. ◼ Third, given lack of visible opportunities and adverse risk profile, the developer-bidder ecosystem is weak as there is little incentive to invest in creating requisite capacity in the first place. ◼ Urban PPPs are thus stymied by lack of program-scale initiatives beyond one-off projects, policy ambivalence on reforms, counterparty risks & contract sanctity concerns.
  • 25.
    Land Value Capture(LVC) – Conceptual basis and typology of instruments 25 ◼ Land recognized as a buoyant productive asset to be developed efficiently ◼ Public infrastructure investment lead to increment in value of land & properties ◼ Value capture refers to recovery of a share of this increment in land/property value by Government to help finance new infrastructure ◼ Design and use of efficient LVC instruments critical to tap and realize this potential ◼ Continually augmenting this revenue source can help sustain infrastructure development value creatio n value realizat ion value capture value recycle Value capture typologies 1. Recurring streams viz., Property Tax, Vacant Land Tax, Tax-Increment Financing 2. One-time levies viz., Development Charges, Betterment charges, Impact fee 3. Asset monetisation viz., Sale and Lease of land, Sale of Development Rights, Premium FSI, etc. Could be applied City-wide or in influence zone of a specific infrastructure project
  • 26.
    Select LVC Instruments..1 26 PropertyTax ◼ Basis: Rental Value / Capital Value / Unit-Area based ◼ Annual levy typically revised once every five years ◼ Low rates and ineffective revisions Vacant Land Tax ▪ Annual recurring levy ▪ US, Australia and Taiwan as variant of property tax ▪ Maharashtra, Tamil Nadu, AP have Urban Land Tax Tax Increment financing ▪ Incremental revenues from future tax increases on property, is ring-fenced to finance new investments ▪ Used in the US Recurring streams One-time levies Development charge Betterment charge Impact fee ▪ Charge on value gain from infra investment ▪ Levied on improvement schemes / Projects ▪ MMRDA Mumbai, Hyderabad (external betterment) ▪ Upfront area-based charge (in some cases value based) ▪ Widely used – AP, Guj, Mah, TN, MP and others ▪ Also levied as a betterment tax in Karnataka ▪ Levied to recover at least a share of the investment from project influence area (PIA) ▪ Used in US; Hyderabad ORR
  • 27.
    Select LVC Instruments..2 27 Assetmonetisation and Dev rights related Sale or lease of land Transfer of development rights ▪ Non-cash compensatory right to landowners for Open space, Road widening, affordable housing ▪ Used as land acquisition tool by government ▪ Tradable rights which can be used in other locations Land pooling ▪ Land pooled, into a layout, infrastructure developed, and a share is returned to owners ▪ Gujarat cities, Haryana and Japan / Germany ▪ Sao Paolo, Brazil sell development rights through auctions ▪ Auction of BKC land by MMRDA; lease of Municipal properties Premium on relaxation of rules or additional FSI ▪ Fee to develop beyond permissible FSI ▪ Several states – Mah, Ktka, Guj, TN ▪ Brazil and France internationally
  • 28.
    LVC - Constraints….1 Landbased tools not being designed to capture incremental value 28 Demand Side ◼ Lack of planning for city investment needs –Thus the levies collected by the ULBs are not based on any scientific calculation and do not reflect the cities’ investment requirement. These revenues are not even adequate to meet the administrative and O&M costs in the cities. ◼ Revenue losses due to existence of multiple stakeholders such as State Government, Central organizations, ULBs, Development Organisations etc. ◼ LVC are susceptible to cycles of volatility in real estate market Supply side ◼ Lack of techniques to capture true capital value: Capturing the value of land and/or property requires data on land and property sales as well as data on land and property attributes. Guideline values determined by the state governments provides the database, but values generally do not reflect the open market prices ◼ Tools such as TDR, premium FSI, etc. have potential in cities with high demand for real estate.
  • 29.
    LVC Constraints ….1 29 Regulatory ◼Weak legislative backing – Lack of provision for the tools in the various state acts restricts ULBs from using the value capture financing mechanisms. Ambiguity in the acts for defining the LBFTs – in terms of base, intend, buoyancy, jurisdiction, etc. results in restricting the ULBs from using the tools or attain full revenue potential of these tools. ◼ Land based tools not defined to capture incremental values - Most of the LBFTs are levied based on rates defined on the area and not the value. Thus these tools do not capture the impact of the changes in the value of the land. ◼ Low Tax rate - It is observed that the rates are not being revised for longer duration. Infrequent revision result in non buoyant base resulting in low revenues from the LBFTs hardly meet the administrative and O&M expenditure of municipal corporations and do not contribute significantly to capital expenditure. ◼ Lack of equity - The current area based system is inequitable. Applicant for a 1000 sq. m in a posh area (where property values are high) will pay the same amount of development charges as compared to an applicant in a peripheral area (where property values are low); ◼ Multiple levies with no definite intent – The State acts defines multiple levies viz. betterment fee, betterment tax, development charges but the purpose for which the funds can be used is not explicitly defined. Institutional ◼ Capacity constraints - Many of the states in spite of having legal provision, do not put these tools in practice due to capacity constraints. ◼ Absence of monitoring of utilisation of revenue – Due to the absence of ring-fencing of the levies, the revenue from these levies is not being monitored for its utilisation. This defeats the purpose of levying the charge.
  • 30.
    Municipal Finance -Components Municipal Revenue Conventional & non-conve Internal / Own Revenue External Tax Non-Tax Capital Loans, Bonds Transfers/Grants Municipal Expenditure Cost Efficiency Productive Use of Resources Municipal Finance Performance/Outcome Budgeting Prioritising Principles, cost and technical audit, PPP/PPPP Land Value Capture
  • 31.
    Vicious Cycle ofLow Level of Performance and Finances Poor Organizational Capacity Poor Quality of Services Low Fiscal Capacity Poor Organizational Capacity Poor Quality of Services Low Fiscal Capacity Low Productivity Low Expectation Low Willingness to Pay Lack of Investment Lack of System for Resource Mobilization Low Level of Resources
  • 32.
    Lack of Willingnessto Pay - The negative cycle Low investment Poor services Citizens unhappy Unwillingness to pay Unwillingness to charge Low income The Crux of Financing Urban Infrastructure Known as Low Equilibrium Trap
  • 33.
    Need to Create- A Positive Cycle Higher Investment Improve services Increase citizen satisfaction Higher willingness to pay Levy realistic charges Increase income A Way Out/ Solution to Financing Urban Infrastructure
  • 34.
    Breaking Vicious Cycleof the low level of performance and finance ◼ Outcomes rather than outputs based management, provisioning than producing ◼ Customer- focused management ◼ Cost- Effective Management - Improving management control systems to drive down costs and improve cost recovery. ◼ Quality Management - Improving quality of services- benchmarking with international practices. ◼ Improving employee productivity through capacity building and professionalisation of cadre
  • 35.
    Municipal Resource Mobilisation LowLevel Investment Poor services Citizens unhappy Unwillingness to pay Unwillingness to charge Low income High Level of Investment Improve services# Increase citizen satisfaction Higher willingness to pay Levy realistic charges Increase income Mobilise Resources through augmentation & cost efficiency Negative Cycle Positive Cycle Willingness to Charge, Enforcement, Governance # needs system reforms, operational efficiency, customer orientation
  • 36.
    Municipal Resource Mobilisation –Way Forward ◼ Increase ULBs Income from all sources – Rationalise taxes, make them broad base – Charge wherever it possible, must recover O&M and CAPEX to possible extent – not only 20 percent as it is at present – Earn through market-based operations ◼ Control expenditure in maximum possible ways – Adopt prioritisation principles, outcome budgeting ◼ Improve cost efficiency (productivity) continuously – System and HR reforms – Harnessing alternative sources of financing ◼ Create mechanism to flow private and social resources for financing urban infrastructure that is harnessing alternative resources ◼ In sum improve creditworthiness of ULB
  • 37.
    Municipal Resource Mobilisation– Way Forward ◼ Must leverage funds but through right mode of borrowing ◼ Ensure that the new systems are: – Broad based, Holistic and Scalable – Integrates with other important components of reforms to ensure benefits ◼ Create buy-in through – Opinion building by disseminating benefits of management (financial and general) reforms – Change management – Peoples’/Community Participation in Governance ◼ Address human resource constraints – Capacity building of all actors and stakeholders ◼ Create adequate support systems
  • 38.