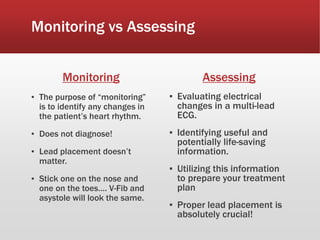
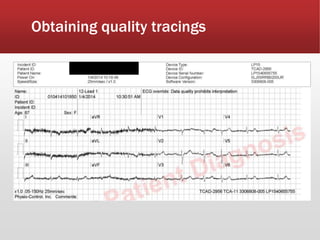
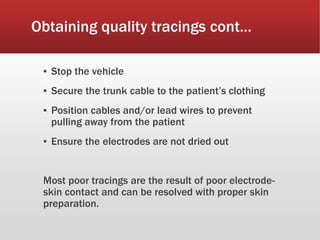
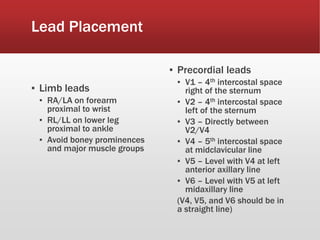
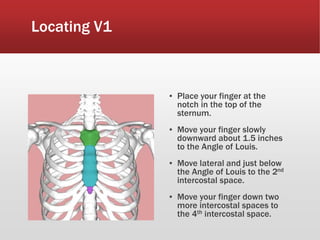
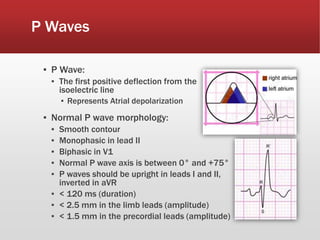
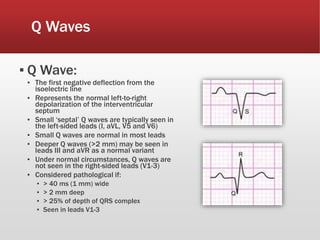
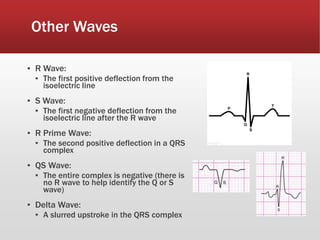
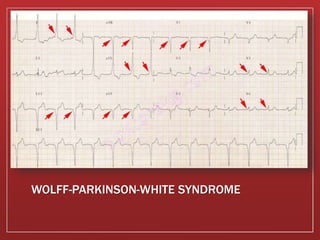
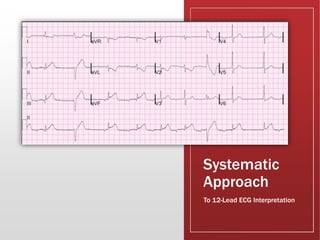
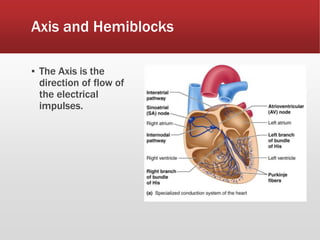
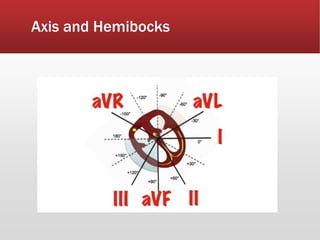
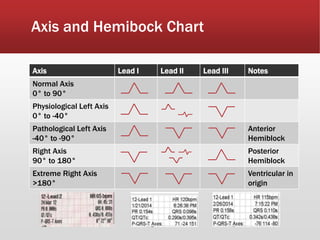
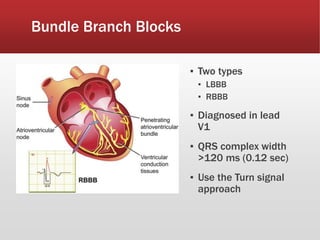
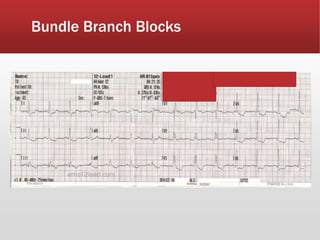
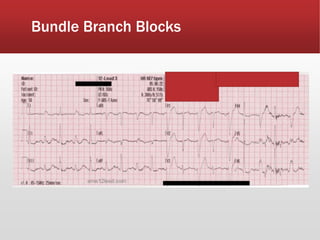
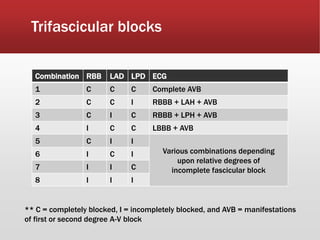
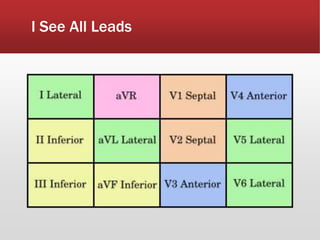
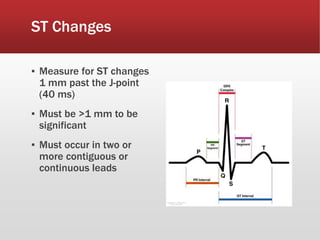
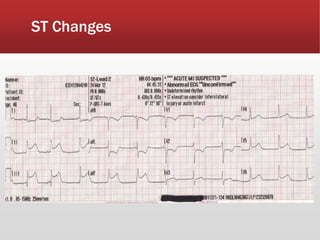
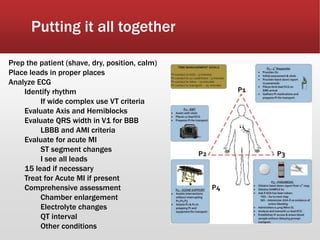
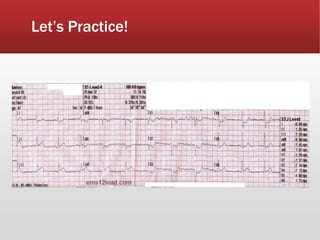
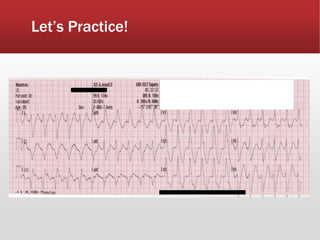
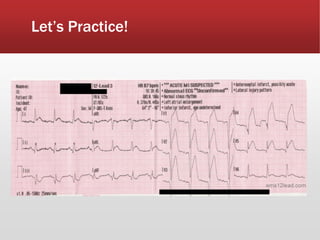
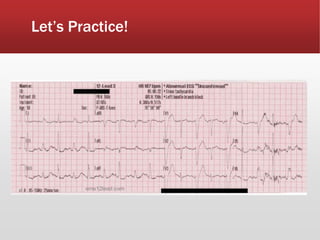
This document provides guidance on performing and interpreting multi-lead electrocardiograms (ECGs). It aims to improve patient outcomes by reducing time to percutaneous coronary intervention through early ECG acquisition and transmission. Proper lead placement is emphasized for 12- and 15-lead ECGs. A systematic approach to ECG interpretation is outlined, including identifying the underlying rhythm, assessing the axis and potential hemiblocks or bundle branch blocks, using the ISAL method to determine infarct location, and evaluating for atrial abnormalities. Key waves, intervals, and criteria for identifying ventricular tachycardia, ischemia, injury, and infarction are defined.
This document provides an introduction to hemodynamic monitoring, which involves measuring factors that influence blood flow and pressure. It defines hemodynamic monitoring and outlines its purposes, which include diagnosing and managing shock states, determining fluid status, and measuring cardiac output. The document discusses indications for hemodynamic monitoring as well as contraindications for invasive pulmonary artery catheters. It also reviews important hemodynamic values and concepts, pulmonary artery catheter insertion and positioning, waveform analysis, and removal of pulmonary artery catheters.
This document provides guidance on the differential diagnosis and treatment of narrow complex tachycardia. It discusses the acute and ongoing management of various types of supraventricular tachycardia, including atrioventricular nodal reentrant tachycardia, atrial tachycardia, multifocal atrial tachycardia, inappropriate sinus tachycardia, and atrioventricular reentrant tachycardia. Treatment recommendations include the use of vagal maneuvers, adenosine, beta blockers, calcium channel blockers, antiarrhythmic drugs, and catheter ablation based on the specific arrhythmia and hemodynamic stability of the patient.
This document provides an overview of electrocardiogram (ECG or EKG) basics including:
- The 12 leads of a standard ECG and what each views of the heart
- Components of the ECG tracing including the P, Q, R, S, and T waves
- Methods for calculating heart rate from the ECG
- Identification and classification of common cardiac rhythms, arrhythmias, conduction abnormalities, chamber enlargements, and other ECG findings
- Interpretation of ECG findings in the context of underlying cardiac conditions, structures, or pathologies
"PAOP" or "Wedge" pressure approximates LVEDP
Used to estimate preload on left side of heart
65
PAOP Waveform
66
PAOP Waveform
67
Components of the PAOP
Waveform
Systole
measured at the peak of the wave
Diastole
measured just prior to the upstroke of systole
(end of QRS)
No dichrotic notch
Balloon occludes pulmonic valve closure
68
Reading the PAOP Waveform
69
This document discusses various abnormalities that can be seen on electrocardiograms (ECGs). It covers rate abnormalities like tachycardia and bradycardia. It also discusses atrial and ventricular enlargements and the patterns they produce. Various rhythm abnormalities are outlined like junctional rhythm, idioventricular rhythm, and atrioventricular blocks. Bundle branch blocks and fascicular blocks are also described. The document then covers electrolyte disturbances and various arrhythmias including supraventricular arrhythmias, ventricular tachycardias, ventricular fibrillation, and patterns seen in myocardial infarction. It concludes by emphasizing the importance of ECG in identifying many heart conditions and changes.
1. An electrocardiogram (ECG) records and measures the electrical activity of the heart over time using skin electrodes.
2. The ECG detects tiny electrical changes on the skin caused by the heart muscle depolarizing with each heartbeat. The recording produced is called an electrocardiogram.
3. An ECG is interpreted by examining features such as the rate, rhythm, amplitudes of the P, QRS, and T waves, intervals between waves, and any abnormalities present. This provides information about the heart's structure and function.
This document provides an overview of EKG interpretation. It discusses the normal conduction system, EKG leads, waveforms and intervals. It covers determining heart rate, axis, and common rhythms such as sinus, atrial, junctional and ventricular. It also summarizes chamber enlargements, bundle branch blocks, ischemia, infarction patterns and other EKG abnormalities. The goal is to equip the reader with the basics needed for a systematic approach to EKG interpretation.
This document provides an overview of how to systematically interpret an electrocardiogram (EKG or ECG). It describes evaluating the rhythm, rate, axis, intervals, waves, and arriving at a final diagnosis by considering abnormalities in relationship to clinical data. Key aspects include assessing the P wave, QRS complex, ST segment, T wave, and U wave in each lead in a specified order. Factors that can affect the ST segment, T wave, and U wave are also discussed.
The document discusses electrocardiogram (ECG) patterns associated with cardiac chamber enlargement, specifically right atrial enlargement (RAE) and left atrial enlargement (LAE). RAE is suggested by a tall, peaked P wave in leads II, III, AVF and a positive P wave in V1. LAE results in prolongation of the left atrial component of the P wave, increased posterior deviation of the left atrial vector, and left axis deviation of the P wave. The diagnostic accuracy of ECG findings for chamber enlargement is limited but can provide clues when correlated with imaging studies.
This document discusses right bundle branch block (RBBB) in the electrocardiogram (ECG). It begins by explaining normal ventricular conduction, then describes RBBB. Key points of RBBB include a QRS duration of over 110ms, an rSR' pattern or notched R wave in lead V1, and a wide and slurred S wave in leads I and V6. The document contrasts RBBB and left bundle branch block (LBBB) and provides illustrations of complete RBBB, incomplete RBBB, intermittent RBBB, and RBBB with left anterior fascicular block. It emphasizes using lead V1 and the direction of the terminal QRS force (upward for RBBB, downward for LBBB)
This document provides an overview of basics of ECG, including:
- A brief history of ECG development from 1842 to present day.
- An explanation of what an ECG measures and how it can be used to identify arrhythmias, ischemia, infarction and other cardiac conditions.
- A breakdown of the components of a normal ECG waveform including the P wave, PR interval, QRS complex, ST segment, and T wave.
- Descriptions of the 12-lead ECG system and how each lead views electrical activity from different angles in the heart.
- Explanations of how to analyze an ECG, including determining heart rate and cardiac axis. Bradyarrhythm
The document discusses the blood supply of the heart. It begins by describing the origins of the coronary arteries from the aortic sinuses and their major branches. The right coronary artery generally supplies the right atrium and ventricle as well as part of the interventricular septum. The left coronary artery gives rise to the left anterior descending artery and circumflex artery. Variations in coronary artery dominance and anomalies are also covered. Diagnostic tests for coronary artery disease include angiography, CT angiography, stress echocardiography, and intravascular ultrasound. Treatments mentioned include medications, angioplasty, stenting, and coronary artery bypass grafting.
This document provides an overview of the anatomy and assessment of the mitral valve using transesophageal echocardiography (TEE). It describes the components of the mitral valve complex including the annulus, leaflets, chordae tendineae, and papillary muscles. It outlines different TEE views used to evaluate the mitral valve and provides details on quantifying mitral stenosis and regurgitation. Causes of mitral valve dysfunction like rheumatic heart disease and ischemic mitral regurgitation are summarized. Assessment of mitral valve repair is also discussed, including complications like paravalvular leaks and systolic anterior motion.
Biatrial enlargement is diagnosed when criteria for both right and left atrial enlargement are present on the same ECG.
The diagnosis of biatrial enlargement requires criteria for LAE and RAE to be met in either lead II, lead V1 or a combination of leads.
This document discusses various types of tachyarrhythmias categorized by their anatomical location and electrophysiological mechanisms. It describes atrial arrhythmias including sinus tachycardia, atrial fibrillation, atrial flutter, and atrial tachycardia. It also discusses atrioventricular node reentrant tachycardia, atrioventricular reentrant tachycardia, junctional tachycardia, and ventricular arrhythmias including monomorphic ventricular tachycardia, polymorphic ventricular tachycardia, and ventricular fibrillation. Key features and mechanisms of each type are outlined to aid in diagnosis and classification.
This document provides an overview of electrocardiography (ECG) and ECG interpretation. It discusses the conduction system of the heart and how ECG works to record and display the heart's electrical activity. A systematic 8-step approach to ECG interpretation is outlined, examining rate, rhythm, intervals, waves, segments, and arriving at an overall interpretation. Common ECG patterns for myocardial ischemia, injury, and infarction are reviewed.
This document discusses several types of supraventricular tachycardia (SVT), including their definitions, pathophysiology, diagnosis, and treatment. It covers sinus tachycardia, sinus node reentry, atrial flutter, and atrial tachycardia. For each type, it describes the characteristic heart rate, P wave morphology, and mechanisms involving automaticity, reentry, or triggered activity. Treatment options discussed include medications, cardioversion, ablation, and stroke prophylaxis.
This document provides an overview of evaluating and treating different types of tachycardia, including:
1) It discusses evaluating the patient's hemodynamic stability, history, and ECG to determine the characteristics and cause of the tachycardia.
2) It describes differentiating between narrow and wide complex tachycardias, and the differential diagnoses for each, including sinus tachycardia, atrial fibrillation, AV nodal reentrant tachycardia, and ventricular tachycardia.
3) It provides guidance on therapies for different tachycardias, such as electrical or chemical cardioversion, rate control, and ablation. The importance of correctly diagnosing wide complex tachycard
ECG Rhythm Interpretation
ST Elevation and non-ST Elevation MIs
ECG Changes
ECG Changes & the Evolving MI
Left Ventricular Hypertrophy
Normal Impulse Conduction
Bundle Branch Blocks
The document provides information about electrocardiograms (ECGs):
1) It defines an ECG as the physical translation of the electrical phenomena created in the heart muscles and produced as a graph by an ECG machine.
2) It describes how ECGs can be used to identify arrhythmias, ischemia, chamber hypertrophy, and other cardiac conditions.
3) It explains the basics of heart anatomy including the four chambers and valves, and how the electrical conduction system generates and transmits electrical impulses to trigger contractions.
Basic EKG and Rhythm Interpretation Symposia - The CRUDEM FoundationThe CRUDEM Foundation
Basic EKG and Rhythm Interpretation Symposia presented in Milot, Haiti at Hôpital Sacré Coeur.
CRUDEM’s Education Committee (a subcommittee of the Board of Directors) sponsors one-week medical symposia on specific medical topics, i.e. diabetes, infectious disease. The classes are held at Hôpital Sacré Coeur and doctors and nurses come from all over Haiti to attend.
The Fontan procedure is a palliative surgery used to treat children born with complex congenital heart defects affecting one of the heart's ventricles. It involves redirecting blood flow from the upper and lower body directly to the lungs, bypassing the morphologic right ventricle. The procedure is performed in stages, with the first redirecting blood flow from the upper body and the second from the lower body as well. While palliative, it can improve quality of life by allowing for normal growth and development in many cases.
This document provides an overview of electrocardiography (ECG), including how an ECG works, the basics of recording an ECG, ECG leads, normal ECG waveforms and intervals, interpreting an ECG, common abnormalities, and how to report an ECG. It discusses topics such as the cardiac conduction system, Einthoven's triangle, the 12-lead ECG, determining heart rate and axis, normal sinus rhythm, P waves, QRS complex, ST segment, T waves, and the QT interval.
Cardiac catheterization is useful for assessing left-to-right shunts through three main techniques: oximetry runs to detect oxygen saturation step-ups, indicator dye dilution to detect early recirculation of dye injected into the proximal chamber, and angiocardiography to directly visualize the anatomic site of the shunt. While oximetry is best to localize the shunt, dye dilution can detect smaller shunts and angiography confirms anatomy. Together these techniques allow diagnosis and quantification of left-to-right intracardiac shunts.
This document discusses various non-coronary causes of ST-elevation on electrocardiograms (ECGs) including ventricular aneurysms, pericarditis, early repolarization patterns, left ventricular hypertrophy, left bundle branch block, hypothermia, cardioversion, intraventricular hemorrhage, hyperkalemia, Brugada pattern, type 1C antiarrhythmic drugs, hypercalcemia, pulmonary embolism, hypothermia, myocarditis, and tumor invasion of the left ventricle. It then discusses left ventricular aneurysms, early repolarization, acute pericarditis, hyperkalemia, hypothermia, increased intracranial pressure, Brugada syndrome, Tak
The document discusses constrictive pericarditis, providing details on:
1) The pathology of constrictive pericarditis which involves thickening and scarring of the pericardium leading to loss of elasticity.
2) The pathophysiology of constrictive pericarditis where the inelastic pericardium constrains cardiac filling and prevents adaptation to volume changes.
3) Key diagnostic features of constrictive pericarditis seen on echocardiogram include septal bounce, rapid early diastolic mitral inflow, and increased mitral annular velocities that rise with inspiration.
The document provides an overview of how to read and interpret electrocardiograms (ECGs). It discusses the normal conduction system including the sinoatrial node, atrioventricular node, and bundle of His. It describes lead placement and what different leads represent. It outlines the 10 rules for a normal ECG, including details on intervals, wave directions, and segment morphologies. It also discusses axis determination and provides examples of calculating heart rate from the ECG tracing.
The document discusses how to obtain and interpret a 12-lead electrocardiogram (ECG) to diagnose acute myocardial infarction (AMI), explaining the anatomy, waveform components, localization of ST elevations, and reciprocal changes seen with different types of AMI such as inferior, anterior, lateral, and posterior infarcts. It emphasizes that ST elevation is the most important indicator of AMI and timely treatment is critical, as AMI appears within 1-2 hours on ECG and delays increase damage. Bundle branch blocks and other conditions can obscure ECG findings, so new or presumed new bundle branch blocks are treated as potential AMI.
This document provides an overview of QRS complexes and abnormalities seen on electrocardiograms (ECGs). It defines the components of the QRS complex and discusses causes of low or high voltage QRS complexes. Specific conditions that can cause left or right ventricular hypertrophy are described. Various conduction abnormalities are also summarized, including right and left bundle branch blocks, fascicular blocks, and bifascicular blocks. Causes of wide QRS complexes like hyperkalemia and certain drugs are mentioned. The document aims to educate on interpreting and analyzing QRS complexes on ECGs.
This presentation covers few basic things about ECG, especially for UG Medical students like ECG leads, normal ECG waves, axis of ECG and how to look for common ECG misplacements.
This document provides an overview of EKG interpretation including:
- The normal conduction system and lead placements
- Identifying rate, rhythm, intervals, axis, and abnormalities such as ischemia, hypertrophy, and electrolyte imbalances
- A systematic approach is recommended: rate, rhythm, axis, hypertrophy, intervals, P wave, QRS complex, and ST-T waves
- Examples of various arrhythmias, blocks, and conditions are shown including MI, WPW, Brugada, atrial flutter, torsades de pointes, SVT, VT, and bundle branch blocks.
The document discusses the basics of electrocardiography (ECG), including the 12-lead ECG system and cardiac rhythms. It explains that a standard ECG uses 6 limb leads (I, II, III, aVR, aVL, aVF) and 6 precordial/chest leads (V1-V6). It describes Einthoven's triangle and law. It discusses normal sinus rhythm, cardiac intervals, axis determination, hypertrophy, ischemia, blocks, arrhythmias, and bundle branch blocks. Key points are made about rate, regularity, P waves, PR interval, and QRS duration for interpreting rhythms.
How to read ECG systematically with practice strips Khaled AlKhodari
This lecture simplifies the steps of reading ECG systematically. It starts with a simple heart anatomy and the logical steps that should be followed to perfect ECG reading without missing any abnormality. Finally, there are some practice ECG strips that include but not only MI, STEMI, Wellens syndrome, Pulmonary embolism, LVH, arrhythmias... and others
This document provides an overview of the electrocardiogram (EKG/ECG). It describes what an EKG is and how it represents the electrical events of the cardiac cycle. Each electrical event produces a distinctive waveform that can provide insight into a patient's cardiac pathophysiology when studied. The document also discusses the normal components of the EKG waveform, including the P wave, PR interval, QRS complex, ST segment, T wave, and QT interval. It provides the normal values for each component and examples of abnormalities.
The document provides an overview of basics of electrocardiography (ECG/EKG), including a brief history, the components of a normal ECG, and how to interpret common abnormalities. It discusses the waves that make up the ECG, such as the P, QRS, and T waves, and how to determine heart rate. The document also covers arrhythmias like atrial flutter, supraventricular tachycardia, ventricular tachycardia, and myocardial infarction locations based on ECG findings.
- The document describes normal ECG values and intervals. It then discusses abnormalities seen in right and left atrial and ventricular enlargement, right and left bundle branch blocks, and myocardial infarction. Specific ECG patterns are provided for each condition. For example, right atrial enlargement shows tall, narrow P waves in certain leads, while left bundle branch block results in a wide QS complex in lead V1 and tall R wave without Q wave in lead V6. The document serves as a guide for interpreting ECG findings in various cardiopulmonary conditions.
This document discusses the analysis of a 12-lead EKG. It begins by describing the components that should be assessed, including rhythm, rate, axis, and grouped lead analysis. Specific abnormalities are then discussed in detail such as ST segment changes, bundle branch blocks, Q waves, and more. The overall goal is to systematically analyze all aspects of the 12-lead EKG to evaluate for any cardiac abnormalities.
This document contains an ECG report that summarizes various cardiac conditions including:
1) Ischemic heart diseases such as ST elevation myocardial infarction (STEMI) and non-ST elevation myocardial infarction (NSTEMI).
2) Tachyarrhythmias such as sinus tachycardia, supraventricular tachycardia, atrial fibrillation, and atrial flutter.
3) Bradyarrhythmias including junctional escape rhythm and sinus arrest.
4) Ventricular hypertrophy of the left and right ventricles.
5) Bundle branch blocks including left and right bundle branch blocks.
6) Premature complexes including premature atrial, junctional, and
This document provides information about ECG diagnosis and interpretation. It discusses lead placement and what each lead represents. It then covers normal sinus rhythm and various cardiac conditions like WPW syndrome, AF, and RBBB. Next, it discusses waveforms and intervals seen on ECGs. Finally, it details the 10 rules for a normal ECG, characteristics of AMI, axis determination, and other diagnostic criteria.
An electrocardiogram (ECG or EKG) records the electrical signal from your heart to check for different heart conditions. Electrodes are placed on your chest to record your heart's electrical signals, which cause your heart to beat. The signals are shown as waves on an attached computer monitor or printer
The document describes an electrocardiogram (ECG) including the leads used to record the ECG, how the leads are attached, standard measurements, the components of the cardiac cycle that are measured on ECG, and how to interpret various rhythms, intervals, waves and complexes that may appear on an ECG. It provides guidance on assessing rate, rhythm, axis, hypertrophy, ischemia/infarction, and other abnormalities and includes diagrams to demonstrate common arrhythmias and conduction abnormalities.
This document provides an overview of electrocardiography (ECG/EKG) including:
1. A definition of ECG as a medical device that detects and records the electrical signals of the heart to help doctors interpret cardiac conditions.
2. A brief history of the ECG machine from its invention in 1903 to modern computerized systems.
3. Descriptions of the placement of electrodes and principles of recording, including potential issues like artifacts.
4. Explanations of ECG waves including the P, QRS, and T waves and how they relate to the electrical conduction system and depolarization/repolarization of the heart.
it describes the bony anatomy including the femoral head , acetabulum, labrum . also discusses the capsule , ligaments . muscle that act on the hip joint and the range of motion are outlined. factors affecting hip joint stability and weight transmission through the joint are summarized.
Walmart Business+ and Spark Good for Nonprofits.pdfTechSoup
"Learn about all the ways Walmart supports nonprofit organizations.
You will hear from Liz Willett, the Head of Nonprofits, and hear about what Walmart is doing to help nonprofits, including Walmart Business and Spark Good. Walmart Business+ is a new offer for nonprofits that offers discounts and also streamlines nonprofits order and expense tracking, saving time and money.
The webinar may also give some examples on how nonprofits can best leverage Walmart Business+.
The event will cover the following::
Walmart Business + (https://business.walmart.com/plus) is a new shopping experience for nonprofits, schools, and local business customers that connects an exclusive online shopping experience to stores. Benefits include free delivery and shipping, a 'Spend Analytics” feature, special discounts, deals and tax-exempt shopping.
Special TechSoup offer for a free 180 days membership, and up to $150 in discounts on eligible orders.
Spark Good (walmart.com/sparkgood) is a charitable platform that enables nonprofits to receive donations directly from customers and associates.
Answers about how you can do more with Walmart!"
This document provides an overview of wound healing, its functions, stages, mechanisms, factors affecting it, and complications.
A wound is a break in the integrity of the skin or tissues, which may be associated with disruption of the structure and function.
Healing is the body’s response to injury in an attempt to restore normal structure and functions.
Healing can occur in two ways: Regeneration and Repair
There are 4 phases of wound healing: hemostasis, inflammation, proliferation, and remodeling. This document also describes the mechanism of wound healing. Factors that affect healing include infection, uncontrolled diabetes, poor nutrition, age, anemia, the presence of foreign bodies, etc.
Complications of wound healing like infection, hyperpigmentation of scar, contractures, and keloid formation.
LAND USE LAND COVER AND NDVI OF MIRZAPUR DISTRICT, UPRAHUL
This Dissertation explores the particular circumstances of Mirzapur, a region located in the
core of India. Mirzapur, with its varied terrains and abundant biodiversity, offers an optimal
environment for investigating the changes in vegetation cover dynamics. Our study utilizes
advanced technologies such as GIS (Geographic Information Systems) and Remote sensing to
analyze the transformations that have taken place over the course of a decade.
The complex relationship between human activities and the environment has been the focus
of extensive research and worry. As the global community grapples with swift urbanization,
population expansion, and economic progress, the effects on natural ecosystems are becoming
more evident. A crucial element of this impact is the alteration of vegetation cover, which plays a
significant role in maintaining the ecological equilibrium of our planet.Land serves as the foundation for all human activities and provides the necessary materials for
these activities. As the most crucial natural resource, its utilization by humans results in different
'Land uses,' which are determined by both human activities and the physical characteristics of the
land.
The utilization of land is impacted by human needs and environmental factors. In countries
like India, rapid population growth and the emphasis on extensive resource exploitation can lead
to significant land degradation, adversely affecting the region's land cover.
Therefore, human intervention has significantly influenced land use patterns over many
centuries, evolving its structure over time and space. In the present era, these changes have
accelerated due to factors such as agriculture and urbanization. Information regarding land use and
cover is essential for various planning and management tasks related to the Earth's surface,
providing crucial environmental data for scientific, resource management, policy purposes, and
diverse human activities.
Accurate understanding of land use and cover is imperative for the development planning
of any area. Consequently, a wide range of professionals, including earth system scientists, land
and water managers, and urban planners, are interested in obtaining data on land use and cover
changes, conversion trends, and other related patterns. The spatial dimensions of land use and
cover support policymakers and scientists in making well-informed decisions, as alterations in
these patterns indicate shifts in economic and social conditions. Monitoring such changes with the
help of Advanced technologies like Remote Sensing and Geographic Information Systems is
crucial for coordinated efforts across different administrative levels. Advanced technologies like
Remote Sensing and Geographic Information Systems
9
Changes in vegetation cover refer to variations in the distribution, composition, and overall
structure of plant communities across different temporal and spatial scales. These changes can
occur natural.
How to Setup Warehouse & Location in Odoo 17 InventoryCeline George
In this slide, we'll explore how to set up warehouses and locations in Odoo 17 Inventory. This will help us manage our stock effectively, track inventory levels, and streamline warehouse operations.
Leveraging Generative AI to Drive Nonprofit InnovationTechSoup
In this webinar, participants learned how to utilize Generative AI to streamline operations and elevate member engagement. Amazon Web Service experts provided a customer specific use cases and dived into low/no-code tools that are quick and easy to deploy through Amazon Web Service (AWS.)
How to Manage Your Lost Opportunities in Odoo 17 CRMCeline George
Odoo 17 CRM allows us to track why we lose sales opportunities with "Lost Reasons." This helps analyze our sales process and identify areas for improvement. Here's how to configure lost reasons in Odoo 17 CRM
বাংলাদেশের অর্থনৈতিক সমীক্ষা ২০২৪ [Bangladesh Economic Review 2024 Bangla.pdf] কম্পিউটার , ট্যাব ও স্মার্ট ফোন ভার্সন সহ সম্পূর্ণ বাংলা ই-বুক বা pdf বই " সুচিপত্র ...বুকমার্ক মেনু 🔖 ও হাইপার লিংক মেনু 📝👆 যুক্ত ..
আমাদের সবার জন্য খুব খুব গুরুত্বপূর্ণ একটি বই ..বিসিএস, ব্যাংক, ইউনিভার্সিটি ভর্তি ও যে কোন প্রতিযোগিতা মূলক পরীক্ষার জন্য এর খুব ইম্পরট্যান্ট একটি বিষয় ...তাছাড়া বাংলাদেশের সাম্প্রতিক যে কোন ডাটা বা তথ্য এই বইতে পাবেন ...
তাই একজন নাগরিক হিসাবে এই তথ্য গুলো আপনার জানা প্রয়োজন ...।
বিসিএস ও ব্যাংক এর লিখিত পরীক্ষা ...+এছাড়া মাধ্যমিক ও উচ্চমাধ্যমিকের স্টুডেন্টদের জন্য অনেক কাজে আসবে ...
This presentation was provided by Steph Pollock of The American Psychological Association’s Journals Program, and Damita Snow, of The American Society of Civil Engineers (ASCE), for the initial session of NISO's 2024 Training Series "DEIA in the Scholarly Landscape." Session One: 'Setting Expectations: a DEIA Primer,' was held June 6, 2024.
2. Goals
▪ Improve patient outcomes by reducing time from
first medical contact to PCI.
▪ Improve protocol compliance.
▪ Improve ECG interpretation skills of ALS
providers.
3. Objectives
▪ Describe the difference between monitoring and
assessing.
▪ Describe the importance of early ECG acquisition
and transmission.
▪ Demonstrate proper lead placement for a 12-
and 15-lead ECG.
▪ Describe a systematic approach of 12-lead
interpretation.
4. Monitoring vs Assessing
Monitoring
▪ The purpose of “monitoring”
is to identify any changes in
the patient’s heart rhythm.
▪ Does not diagnose!
▪ Lead placement doesn’t
matter.
▪ Stick one on the nose and
one on the toes…. V-Fib and
asystole will look the same.
Assessing
▪ Evaluating electrical
changes in a multi-lead
ECG.
▪ Identifying useful and
potentially life-saving
information.
▪ Utilizing this information
to prepare your treatment
plan
▪ Proper lead placement is
absolutely crucial!
6. Obtaining quality tracings
▪ Prepare the skin
▪ Clean and dry the skin
▪ Shave any excessive hair
▪ Gently scrape skin to remove surface layer of dead
cells
▪ Position the patient
▪ Supine is best. Fowler’s or semi-fowlers is
acceptable.
▪ Serial ECG’s should be in same position.
▪ Place limbs on supportive surfaces
▪ Patient should be comfortable and relaxed.
7. Obtaining quality tracings cont…
▪ Stop the vehicle
▪ Secure the trunk cable to the patient’s clothing
▪ Position cables and/or lead wires to prevent
pulling away from the patient
▪ Ensure the electrodes are not dried out
Most poor tracings are the result of poor electrode-
skin contact and can be resolved with proper skin
preparation.
9. Lead Placement
▪ Limb leads
▪ RA/LA on forearm
proximal to wrist
▪ RL/LL on lower leg
proximal to ankle
▪ Avoid boney prominences
and major muscle groups
▪ Precordial leads
▪ V1 – 4th intercostal space
right of the sternum
▪ V2 – 4th intercostal space
left of the sternum
▪ V3 – Directly between
V2/V4
▪ V4 – 5th intercostal space
at midclavicular line
▪ V5 – Level with V4 at left
anterior axillary line
▪ V6 – Level with V5 at left
midaxillary line
(V4, V5, and V6 should be in
a straight line)
10. Locating V1
▪ Place your finger at the
notch in the top of the
sternum.
▪ Move your finger slowly
downward about 1.5 inches
to the Angle of Louis.
▪ Move lateral and just below
the Angle of Louis to the 2nd
intercostal space.
▪ Move your finger down two
more intercostal spaces to
the 4th intercostal space.
12. P Waves
▪ P Wave:
▪ The first positive deflection from the
isoelectric line
▪ Represents Atrial depolarization
▪ Normal P wave morphology:
▪ Smooth contour
▪ Monophasic in lead II
▪ Biphasic in V1
▪ Normal P wave axis is between 0° and +75°
▪ P waves should be upright in leads I and II,
inverted in aVR
▪ < 120 ms (duration)
▪ < 2.5 mm in the limb leads (amplitude)
▪ < 1.5 mm in the precordial leads (amplitude)
13. Q Waves
▪ Q Wave:
▪ The first negative deflection from the
isoelectric line
▪ Represents the normal left-to-right
depolarization of the interventricular
septum
▪ Small ‘septal’ Q waves are typically seen in
the left-sided leads (I, aVL, V5 and V6)
▪ Small Q waves are normal in most leads
▪ Deeper Q waves (>2 mm) may be seen in
leads III and aVR as a normal variant
▪ Under normal circumstances, Q waves are
not seen in the right-sided leads (V1-3)
▪ Considered pathological if:
▪ > 40 ms (1 mm) wide
▪ > 2 mm deep
▪ > 25% of depth of QRS complex
▪ Seen in leads V1-3
14. Other Waves
▪ R Wave:
▪ The first positive deflection from the
isoelectric line
▪ S Wave:
▪ The first negative deflection from the
isoelectric line after the R wave
▪ R Prime Wave:
▪ The second positive deflection in a QRS
complex
▪ QS Wave:
▪ The entire complex is negative (there is
no R wave to help identify the Q or S
wave)
▪ Delta Wave:
▪ A slurred upstroke in the QRS complex
17. Systematic Approach
▪ Identify the underlying Rhythm (Lead II)
▪ In wide-complex tachycardia use the VT criteria
▪ Evaluate the Axis for deviation and hemiblocks
▪ Determine the presence of a Bundle Branch
Block (BBB)
▪ Using ISAL, determine infract location.
▪ Secondary Survey
18. Identifying VT
▪ 12-lead ECG is 96% diagnostic for VT
identification.
▪ Lead II is only 34% accurate for diagnosing VT.
▪ A-fib with WPW and SVT with BBB are often
misdiagnosed as VT.
19. VT using axis criteria
▪ ERAD w/positive
deflection in V1 = VT
▪ Upright V1 is one of three
criteria
▪ Big mountain, little
mountain
▪ Steep peek (“steeple”)
▪ Slurred downstroke
(fireman’s hat)
▪ RAD w/negative
deflection in V1 = VT
▪ Fat R wave (>40ms)
▪ Notched or slurred
downstroke
▪ Pathological LAD
w/positive V1
▪ In patients with previous
MI
20. Other VT indicators/criteria
▪ Concordance in precordial leads.
▪ Negative concordance suggests VT. Be sure to
determine if the rhythm is atrial in origin. A LBBB
can be negative concordance.
▪ Positive concordance may indicate either VT or
WPW. Must rule out WPW before determining VT.
▪ AV dissociation
▪ Cannon A waves
▪ P waves out of place
▪ Different S1 heart sound
25. Axis Deviation Causes
▪ Left Axis Deviation
▪ Normal variation
▪ Mechanical shifts from
expiration, ascites,
abdominal tumors, high
diaphragm from
pregnancy, obesity, etc.
▪ Left anterior hemiblock
▪ LBBB
▪ WPW syndrome
▪ Hyperkalemia
▪ Right Axis Deviation
▪ Mechanical shifts from
inspiration, emphysema
▪ RVH
▪ RBBB
▪ Left posterior hemiblock
▪ WPW syndrome
▪ Pulmonary embolism
▪ Arrhythmias
26. Axis and Hemibock Chart
Axis Lead I Lead II Lead III Notes
Normal Axis
0° to 90°
Physiological Left Axis
0° to -40°
Pathological Left Axis
-40° to -90°
Anterior
Hemiblock
Right Axis
90° to 180°
Posterior
Hemiblock
Extreme Right Axis
>180°
Ventricular in
origin
27. Bundle Branch Blocks
▪ Two types
▪ LBBB
▪ RBBB
▪ Diagnosed in lead
V1
▪ QRS complex width
>120 ms (0.12 sec)
▪ Use the Turn signal
approach
30. Bifascicular blocks
▪ A bifascicular block is a
blockage of two of the
three pathways to
contract the ventricles in
an organized fashion.
▪ A LBBB is always a
bifascicular block.
▪ An anterior or posterior
hemiblock with a RBBB is
also a bifascicular block
31. Trifascicular blocks
Combination RBB LAD LPD ECG
1 C C C Complete AVB
2 C C I RBBB + LAH + AVB
3 C I C RBBB + LPH + AVB
4 I C C LBBB + AVB
5 C I I
Various combinations depending
upon relative degrees of
incomplete fascicular block
6 I C I
7 I I C
8 I I I
** C = completely blocked, I = incompletely blocked, and AVB = manifestations
of first or second degree A-V block
33. ST Changes
▪ Measure for ST changes
1 mm past the J-point
(40 ms)
▪ Must be >1 mm to be
significant
▪ Must occur in two or
more contiguous or
continuous leads
38. What to expect
▪ Anterior MI – LAD
▪ Most lethal, highest mortality. “Widow Maker”
▪ Can develop Complete Heart Block, VF, or VT
▪ If presents with hemiblocks or BBB; apply combo
pads and prepare for the worst
▪ Can extend into the septum and/or lateral walls
▪ Nitrates are great!
▪ Spare the fluids
39. What to expect
▪ Inferior MI - RCA
▪ Most common seen
▪ Can be very lethal
▪ 50% have posterior and/or right ventricle
involvement and hypotension
▪ Could also have 1st degree AV block or 2nd degree
type 1 AV block
▪ Nausea is common
▪ Look for RVI with V4R
▪ Nitrates with caution
▪ Fluids may be needed to support BP
40. 15-lead ECG
▪ Can locate isolated posterior MI
▪ ST segment depression in V1 is good indicator
(reciprocal changes)
▪ Use V8 and V9 and V4R
▪ Should be done on all Inferior MI to look for Right
Ventricular infarction.
▪ 50% of Inferior MI have posterior and/or right
ventricle involvement
▪ RVI is a preload problem and could cause dramatic
hypotension with nitrates.
▪ Clinical signs of RVI include JVD, dry lungs, and
hypotension
41. 15-Lead ECG
• V4R – 5th intercostal space
midclavicular line (same as V4
but on the other side)
• V8 – On the back, 5th
intercostal space midscapular
line.
• V9 – On the back, 5th
intercostal space between V8
and the spine.
• Move V4 to V4R
• Move V5 to V8
• Move V6 to V9
• Run a second ECG
• Label the different leads.
43. LBBB…now what? Think QRS
▪ Q waves seen in at least two lateral leads (I, aVL, V5, V6)
▪ R wave regression seen from leads V1-V4
▪ Late notching of the S wave in at least 2 of leads V3-V5
I aVL V5 V6
V1 V2 V3 V4
44. AMI in LBBB
▪ Gusto-1 trial
▪ Look for three things
▪ Is there ST-segment elevation >=1mm and is concordant
with QRS axis?
▪ Is there ST-segment depression >=1mm in V1, V2, or V3?
45. AMI in LBBB cont…
▪ Is there ST-segment elevation >=5mm discordant from the
QRS axis?
▪ Yes to two or more of these questions shows a greater than 90%
chance the patient is having an AMI.
46. Atrial Abnormalities
▪ Right Atrial Enlargement (RAE)
▪ Tall, Pointed P waves in Inferior leads >2.5mm
▪ Think 3 P’s… Pointed, Prominent, Pulmonary
▪ Causes of RAE
▪ Congenital heart disease
▪ Tricuspid or pulmonary valve disease
▪ Pulmonary hypertension
▪ Implications:
▪ Generally not an acute problem
▪ Frequently seen with Right Ventricular Hypertophy
▪ Can be seen with other criteria indicating more severe
problems, i.e. pulmonary embolism
47. Atrial Abnormalities
▪ Left Atrial Enlargement (LAE)
▪ Lead II: widened P wave with a
notched or “m” shaped appearance
▪ Lead V1: broad, terminal negative P
deflection of more than 1 mm.
▪ Causes of LAE
▪ Hypertension
▪ Pulmonary edema
▪ LVH
▪ AMI
▪ Mitral or aortic valve stenosis
▪ Implications
▪ See causes… no treatment of the
specific problem.
48. Ventricular Hypertrophy
▪ Right Ventricular Hypertophy
▪ Caused by increased pressure in the right ventricle
▪ ECG findings:
▪ RAE
▪ Narrow QRS
▪ Right Axis Deviation
▪ R wave height in V1 >7mm
▪ Asymmetrical downsloping ST segment in inferior
leads. “Strain”
▪ Implications:
▪ Not an acute problem
▪ Similar causes as RAE
50. Ventricular Hypertrophy
▪ Left Ventricular Hypertrophy (LVH)
▪ Caused by increased pressure or volume in the left
ventricle.
▪ Often found in:
▪ HTN
▪ AMI
▪ Ischemic heart disease
▪ Cardiomyopathy
▪ ECG Criteria:
▪ LAE (this plus any other QRS voltage criteria is diagnostic)
▪ QRS is generally narrow or slightly widened with “strain”
▪ Axis is usually normal
51. Ventricular Hypertrophy
▪ Left Ventricular Hypertrophy (LVH) cont…
▪ Voltage Criteria:
▪ Rule of 35
▪ Measure the deepest S wave from either V1 or V2; add this
number to the tallest R wave of lead V5 or V6. If this
number is greater than 35, and the patient is at least 35
years old, then criteria is met.
▪ R wave in Lead aVL is >11mm
▪ R wave >20 mm in inferior leads
▪ R wave >20 mm in V6
▪ R wave >25 mm in V5
▪ S wave > 25 mm in V1 or V2
▪ If complexes look large, assume hypertrophy. Look
for evidence of “strain”
52. “Strain”
▪ Strain is the hallmark presentation of
hypertrophy.
▪ A strain pattern is to hypertrophy what reciprocal
changes are to ST elevation; they clinch the
diagnosis.
▪ Strain is evidenced by asymmetrical ST
depression and T wave inversion that almost
looks biphasic.
▪ Best seen in lateral or inferior leads. (II, III, aVF,
V5, or V6)
54. Ventricular Hypertrophy
▪ Concerns with LVH
▪ Patients with LVH have a higher incidence of
sudden death and ischemic arrhythmias
▪ It can mimic the ST depression or elevation seen
with myocardial ischemia
▪ It may be caused by AMI
▪ In the presence of LBBB, LVH criteria are not
determined
▪ May be a useful clue as to hemodynamic condition
55. Electrolyte Disturbances
▪ Potassium (K+)
▪ Hypokalemia
▪ Serum levels below 3.5-5 mEq/L
▪ Common causes include vomiting, diarrhea, and diuretics
▪ Common signs and symptoms include
▪ Muscle weakness
▪ Polyuria
▪ Atrial flutter, heart blocks and bradycardia
▪ ECG findings
▪ ST segment depression
▪ T waves flattened or joined with U waves
▪ U waves get larger than T wave as potassium drops
▪ QT interval appears to lengthen
▪ PR interval increases
57. Electrolyte Disturbances
▪ Potassium (K+)
▪ Hypokalemia treatment
▪ Monitor ECG
▪ Increase dietary intake of potassium
▪ In severe cases, IV KCL
58. Electrolyte Disturbances
▪ Potassium (K+)
▪ Hyperkalemia
▪ Serum levels above the normal range (3.5 – 5.0
mEq/L)
▪ Most commonly caused by renal failure
▪ SA node can quit at 7.5 mEq/L
▪ VF or asystole at 10-12 mEq/L
59. Electrolyte Disturbances
▪ Potassium (K+)
▪ Hyperkalemia ECG findings
▪ Mild cases (<6.5 mEq/L)
▪ Tall tented “peaked” T waves with narrow base
▪ Normal P waves
▪ Best seen in leads II, III, V2 and V4
▪ Moderate cases (<8 mEq/L)
▪ QRS widens
▪ Broad S waves in V leads
▪ LAD
▪ ST segment is gone, contiguous with the peaked T waves
▪ P waves start to go away
▪ Severe cases (>8 mEq/L)
▪ P waves disappear
▪ Sine waves
61. Electrolyte Disturbances
▪ Potassium (K+)
▪ Hyperkalemia Treatment
▪ Sodium Bicarb 100-150 mEq added to 1 Liter bag of NS
▪ Consider IV Calcium Gluconate 10% 10-30 ml IV over 1-5
minutes
▪ Consider Glucose 10% 200-500 ml in 30 minutes and
500-1000 ml over the next several hours
62. QT Interval
▪ QT interval represents the time from start of
depolarization of the ventricles to the end of
repolarization.
▪ Measured from the start of the QRS complex to the
end of the T wave.
▪ Causes of Prolonged QT interval include:
▪ Hypokalemia, Hypocalcemia
▪ Drugs: quinidine, amiodarone, tricyclics, disopyramide,
phenothiazines
▪ Liquid protein diets, myocarditis, AMI, LVH, hypothermia
▪ Causes of Shortened QT interval include;
▪ Hypercalcemia, Digitalis therapy
64. Pericarditis
▪ S/S of Pericarditis
▪ Chest pain, dyspnea, tachycardia, FEVER, weakness
▪ CP can be sharp and severe
▪ Made worse by LYING Flat, better by SITTING UP
▪ Pain for hours or days
▪ 90% have ECG evidence
▪ ECG findings include:
▪ ST segment elevation
▪ Concave (curved up) in all leads except V1 and aVR
▪ T wave elevation (starts above the isoelectric line)
▪ ST segment depression or T wave inversion
▪ Almost all leads down (later stage)
65. Pericarditis
▪ Pericarditis diagnosis
▪ Chest pain, pleuritic, relieving factors
▪ No response to NTG
▪ Pericardial rub
▪ ECG changes do not localize an artery (everything up)
66. Putting it all together
Prep the patient (shave, dry, position, calm)
Place leads in proper places
Analyze ECG
Identify rhythm
If wide complex use VT criteria
Evaluate Axis and Hemiblocks
Evaluate QRS width in V1 for BBB
LBBB and AMI criteria
Evaluate for acute MI
ST segment changes
I see all leads
15 lead if necessary
Treat for Acute MI if present
Comprehensive assessment
Chamber enlargement
Electrolyte changes
QT interval
Other conditions
67. Transmitting
▪ Two types of transmitting
▪ From Archives
▪ From Home screen
▪ Two types of connections
▪ Direct Connect
▪ Bluetooth
▪ Two types of destinations
▪ To a receiving facility
▪ To a PCR
68. Transmitting
▪ To a Receiving Facility
▪ All 12-leads should be transmitted
▪ Generally done from the home screen
▪ Uses the Titan Gateway
▪ Procedure
▪ Obtain a quality ECG
▪ Ensure the Titan Gateway is plugged in
▪ Press Transmit button
▪ Select Report (ie. 12-Lead 1)
▪ Select Site (ie. SRMC Branson)
▪ Send
69. Titan Gateway
▪ Titan II Wireless Gateway
▪ Transmits data from the LP15 to
the LifeNet system
▪ Connects to the TCADMobile wifi
▪ Only works when plugged in
▪ Only works when in range of the
ambulance
▪ Is not a modem
▪ LifeNet system
81. References
▪ Conover, M. B. (1992). Understanding
Electrocardiography Arrhythmias and the 12-lead
ECG. St. Louis: Mosby Year Book.
▪ Marriott, H. J. (1988). Practical
Electrocardiography. Baltimore: Williams &
Wilkins.
▪ Page, R. (2005). 12-lead ECG for Acute and
Critical Care Providers. Upper Saddle River:
Pearson Education, Inc.
▪ Wellens, H. J., & Conover, M. B. (1992). The ECG
in Emergency Decision Making. Philadelphia:
W.B. Saunders Company.
Editor's Notes
The STEMI committee at CMCB has worked hard to develop and implement the Code Stemi protocol which is designed to reduce the door to PCI time of patients having an acute MI. Part of the algorithm allows for the ED physician to activate the Cath lab based on the report of the paramedic providing pre-hospital care. It is vital, for two reasons, that we are able to accurately interpret the ECG’s we are running. First, we do not want to misdiagnose a patient and provide inappropriate care, and second we want to limit false activations of the cath lab.
Through call review and CQI, it has also been determined that as a general rule, we do a poor job of obtaining quality ECG’s. Poor ECG’s are difficult if not impossible to diagnose and cause delays in patient care.
For these reasons, we are going to spend some time learning how to obtain quality ECG’s through proper lead placement and patient prep. We will also review the basics of ECG interpretation and dive into some non-acute ECG findings that could benefit you and the patient in proper diagnosing and treatment plans.
The Angle of Louis is where the manubrium joins the body of the sternum. (Manubrium is in green and the Body of the sternum is in blue) When moving your finger down the manubrium from the sternal notch, you should feel a slight horizontal ridge or elevation. This is the Angle of Louis. Just below and lateral is the 2nd intercostal space.
When we evaluate an ECG, it is important that we utilize a systematic approach. This way we evaluate the same aspects of the ECG each time and nothing is overlooked.
If you stopped an just one of the leads and don’t look at the big picture you will misdiagnose the findings.
These 4 steps will provide you with the important information for the acute management of the cardiac patient.
We will spend a little time on each of these items.
Then we will address the non-acute aspects of the 12-lead in the secondary survey
2000 AHA Guidelines put an end to “unknown origin wide complex tachycardia.” They now call for a 12-lead ECG to attempt to diagnose the specific rhythm. This is to discourage the “give a drug and see what happens approach.”
Dr. Marriott had a compelling study that demonstrated that Lead II’s diagnostic accuracy for VT as being 34%. That means when faced with a decision about a wide complex rhythm in Lead II, you would guess wrong 66% of the time.
After identifying the rhythm, we look at the axis. So what is an axis?
Axis can be defined as the general direction of electrical impulses as they travel through the heart. Normally this electrical path is from upper right to lower left.
The axis may be “normal” or may have a left or right “axis deviation”.
The QRS axis is calculated by taking the sum of all the currents generated within the ventricles during electrical systole. These measurements are the positive or negative amperage generated by the electrical impulse of the heart as measured by each limb lead. As the impulse move toward the positive electrode it makes a positive deflection on the ECG, and a negative or downward deflection as it moves away.
Assessing the direction, or axis, of these impulses provides clues about the severity of a patient’s condition.
To calculate the numerical axis, one must know the “hexaxial reference system.” By taking the three sides of Einthoven’s triangle each of which represents one of the standard limb leads and rearranging them so that they bisect each other, we obtain a “triaxial reference system.” If we add to this three further lines to represent the unipolar limb leads (avl, avr, avf), the final figure consists of six bisecting lines, each representing one of the six limb leads.
As an electrical impulse travels through the heart, it will write the largest deflection (positive or upward) on the lead whose line of derivation is parallel to the impulse’s path, and it writes the smallest deflection on the lead perpendicular to it.
Remember that we are evaluating the QRS complex, which represents the electrical impulses in the ventricals.
Now that we know the rhythm, the axis, and whether or not there is a hemiblock, let’s evaluate to see if there is a Bundle Branch Block
A BBB is an electrical phenomenon characterized by a widened QRS complex of at least 0.12 seconds (120 ms). A BBB is diagnosed from an ECG and differential diagnosis is most easily made in V1.
The bundle branch system is an important part of the ventricular depolarization syncytium, the feature of the ventricles (or atrium) that produces simultaneous depolarization. The result being an organized contraction.
The bundle branch system is made up of two branches. The right bundle branch and the left bundle branch. The right bundle branch is a single branch, while the left bundle branch divides into anterior and posterior hemifascicles. Blood supply for the bundle branches usually comes from the Left Anterior Descending artery, but can also be from the AV nodal artery of the right coronary artery.
Compromised oxygenated blood supply to the cardiac conduction system can slow or even stop the conduction of impulses.
This is what is often referred to as the secondary survey of a 12-lead. Accomplished by using the phrase “I See All Leads.” The first letter of each word representing the order of the lead groups. Inferior, Septal, Anterior, Lateral. Looking for the ST changes related to acute MI.
This also reminds us to look at ALL leads, and not stop at the first sign of trouble.
The Right Coronary Artery (RCA) supplies the inferior wall of the left ventricle. Supplies oxygenated blood to the SA node in 50% of people, the AV node in 90% of people and the Right ventricle.
The Posterior Descending Artery (a branch of the RCA) supplies the posterior fascicle of the left bundle branch, and the posterior wall of the left ventricle.
The Left Anterior Descending Artery (LAD) known as the “Widow Maker” supplies the anterior wall of the left ventricle, the intraventricular septum, the Right bundle branch, and the Left bundle branch.
The Left Circumflex Artery (LCA) supplies the lateral wall of the left ventricel, the SA node in 50% of patients, the AV node in 10% of patients, and the posterior wall of the left ventricle.
What happens after you hit send?
The LP is connected to the Titan II Gateway via a serial cable. The Titan is connected to the ambulance router via wifi (specifically TCAMobile). The router is connected to the modem (airlink) via LAN network cable. Modem connects to the internet via cell signal. Data is transmitted from the LP through these connections over the internet to the LifeNet system, basically a cloud server, that then directs the data to a receiving target (site). The target then directs the data to where it wants it to go.
For example: If you select SRMC Branson (Cox Branson), once the data hits the receiving target, it is directed to the ward clerk, the charge nurse, and the cath lab (depending on criteria set).
This is also how the data is received by Clinical Department through the LifeNet Connect.
Sinus Rhythm
Normal Axis
No BBB
ST elevation II, III, aVF
ST depression V2, V3, V4,
Inferior MI
Do a 15-lead
VT
Sinus rhythm with bigeminy unifocal pvc’s
Normal Axis
LBBB
No Q waves in lateral leads
No R wave regression
No S wave notching in V3-5
No indication of acute MI
Sinus rhythm with 1st degree AV block
Right axis deviation (posterior hemiblock)
LBBB
No indication of Acute MI
Sinus rhythm
Normal axis
No BBB
ST elevation V2, V3, V4, V5
Sinus rhythm
Physiologic LAD (no hemiblock)
No BBB
T wave elevation, with U shaped st-segments in V2, V3, V4, V5, V6, I, II, aVL
Pericarditis