Recommended
PPTX
MS_Excel_PowerPoint_Enhanced_Presentation.pptx
PPTX
MS_Excel_PowerPoint_Basics information power point Presentation.pptx
PDF
PPTX
PPTX
PDF
New 5 Minute A Day Microsoft Excel 2023.pdf
PPTX
MS excel and their functions keys and their usage
PPTX
PPTX
PPTX
Excel_for_Beginners_Webinar SELF REVIEW.pptx
PPTX
Basics-of-microsoft-office-and-nudi-presentation-at-ATI-Mysore-by-Mohan-Kumar-G
PPTX
Learning_Microsoft_Excel_for_BBA_BCom.pptx
PPTX
UNIT 1 (3).pptx....................................
PDF
Financial Analysis course curriculum for students
PDF
PPTX
Teaching_Microsoft_Excel_for_BBA_BCom.pptx
PPTX
PPTX
UNIT 1-Introduction to Data Science.pptx
PPTX
Microsoft excel features and function.pptx
PPTX
Introduction to Microsoft office Excel.pptx
PDF
A excel analysis toolpack -best
PPTX
MS Excel training (Vidushi Khera)
PPTX
PPTX
Data Analysis with MS Excel.pptx
PPT
Tech training workshop 3 final 090810
PPTX
Introduction to MS Excel.pptx meaningful insight about ms excel
PDF
PPTX
Mastering Microsoft Excel — From Basics to Brilliance.pptx
PPTX
How to Track a Link Using Odoo 18 SMS Marketing
PPTX
PARENTAL ROUTES OF DRUGS ADMINISTRATION .pptx
More Related Content
PPTX
MS_Excel_PowerPoint_Enhanced_Presentation.pptx
PPTX
MS_Excel_PowerPoint_Basics information power point Presentation.pptx
PDF
PPTX
PPTX
PDF
New 5 Minute A Day Microsoft Excel 2023.pdf
PPTX
MS excel and their functions keys and their usage
PPTX
Similar to MS_Excel_PowerPoint_Basics_Slides powerpoint.pptx
PPTX
PPTX
Excel_for_Beginners_Webinar SELF REVIEW.pptx
PPTX
Basics-of-microsoft-office-and-nudi-presentation-at-ATI-Mysore-by-Mohan-Kumar-G
PPTX
Learning_Microsoft_Excel_for_BBA_BCom.pptx
PPTX
UNIT 1 (3).pptx....................................
PDF
Financial Analysis course curriculum for students
PDF
PPTX
Teaching_Microsoft_Excel_for_BBA_BCom.pptx
PPTX
PPTX
UNIT 1-Introduction to Data Science.pptx
PPTX
Microsoft excel features and function.pptx
PPTX
Introduction to Microsoft office Excel.pptx
PDF
A excel analysis toolpack -best
PPTX
MS Excel training (Vidushi Khera)
PPTX
PPTX
Data Analysis with MS Excel.pptx
PPT
Tech training workshop 3 final 090810
PPTX
Introduction to MS Excel.pptx meaningful insight about ms excel
PDF
PPTX
Mastering Microsoft Excel — From Basics to Brilliance.pptx
Recently uploaded
PPTX
How to Track a Link Using Odoo 18 SMS Marketing
PPTX
PARENTAL ROUTES OF DRUGS ADMINISTRATION .pptx
PPTX
Expected Revenue Report In Odoo 18 CRM
PPTX
How to Manage Package Reservation in Odoo 18 Inventory
PPTX
TAMIS & TEMS - HOW, WHY and THE STEPS IN PROCTOLOGY
PPTX
Partial Correlation - Values of r₁₂.₃, r₂₃.₁ & r₁₃.₂ r₁₂, r₁₃ and r₂₃
PPTX
AN EXTREMELY BORING GENERAL QUIZ FOR UG.pptx
PPTX
Details of Epithelial and Connective Tissue.pptx
PPTX
META-ANALYSIS INTERPRETATION, PUBLICATION BIAS AND GRADE ASSESSMENT.pptx
PDF
Types of eggs and Egg membranes (Developmental Zoology)
PPTX
Accounting Skills Paper-II (Registers of PACs and Credit Co-operative Societies)
PPTX
Overview of how to Create a Model in Odoo 18
PDF
Using Charts and Tables in Presenting Data
PPTX
10-12-2025 Francois Staring How can Researchers and Initial Teacher Educators...
PPTX
Basics in Phytochemistry, Extraction, Isolation methods, Characterisation etc.
PDF
International Men's Day Event: Breaking the Silence: Embracing Vulnerability ...
PDF
M.Sc. Nonchordates Complete Syllabus PPT | All Important Topics Covered
PPTX
4 G8_Q3_L4 (Evaluating opinion editorials for textual evidence and quality).pptx
PDF
The Tale of Melon City poem ppt by Sahasra
PDF
Biology Practical Class 12th 2025 PDF(2)-2-52.pdf
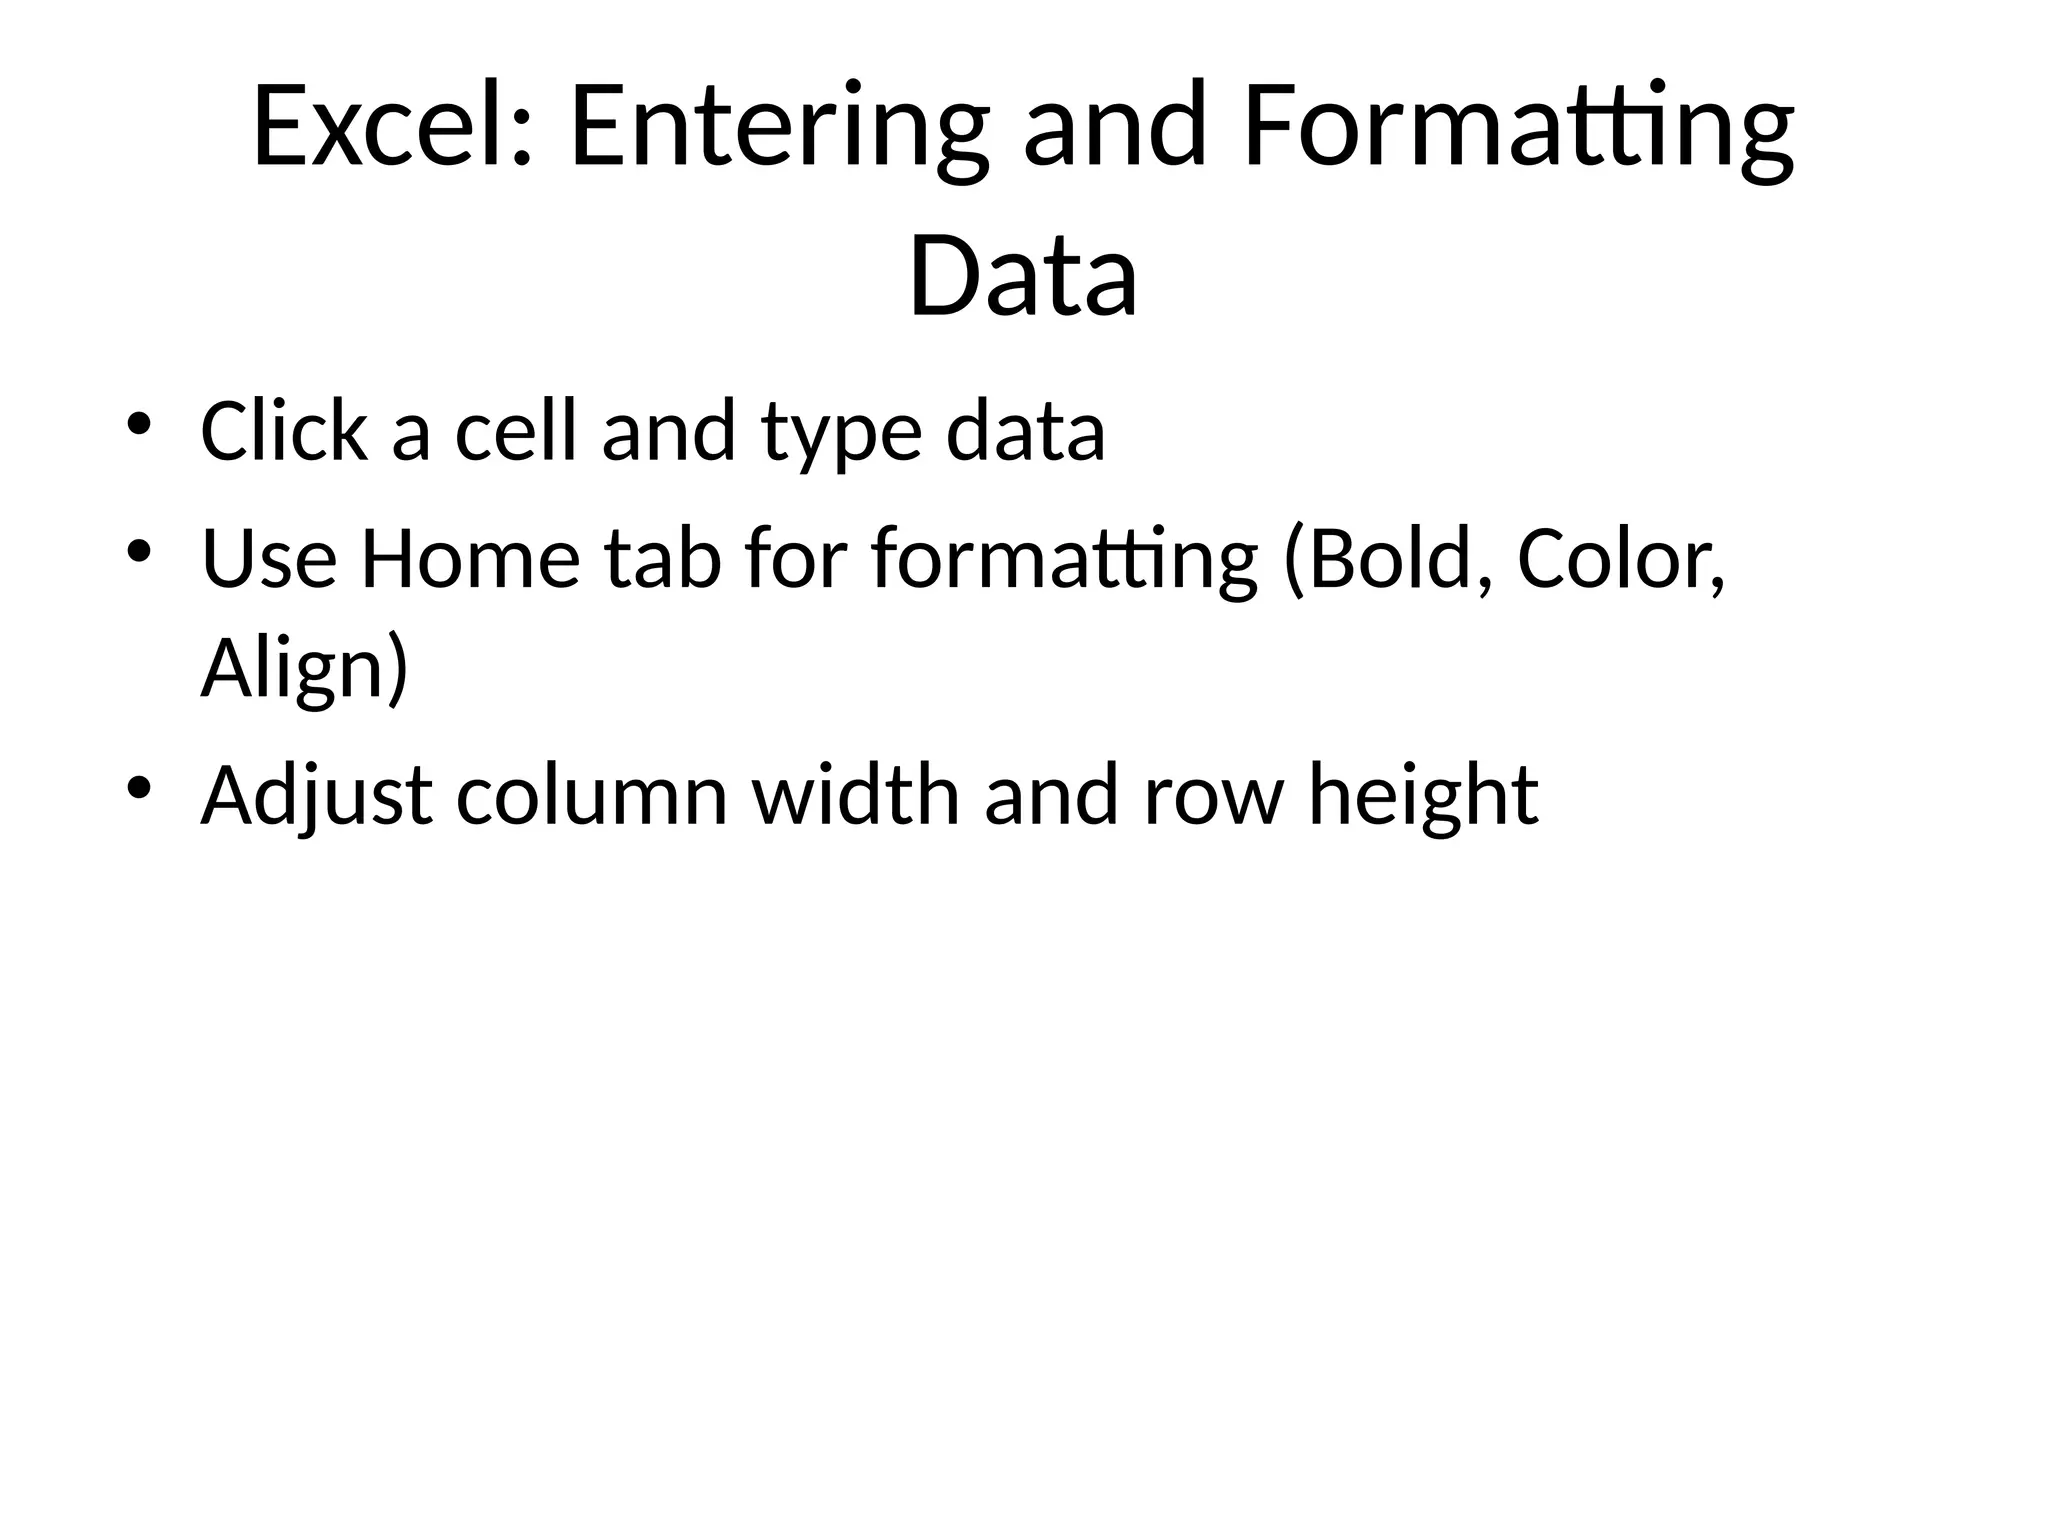
MS_Excel_PowerPoint_Basics_Slides powerpoint.pptx 1. 2. 3. Excel: Entering and Formatting
Data
• Click a cell and type data
• Use Home tab for formatting (Bold, Color,
Align)
• Adjust column width and row height
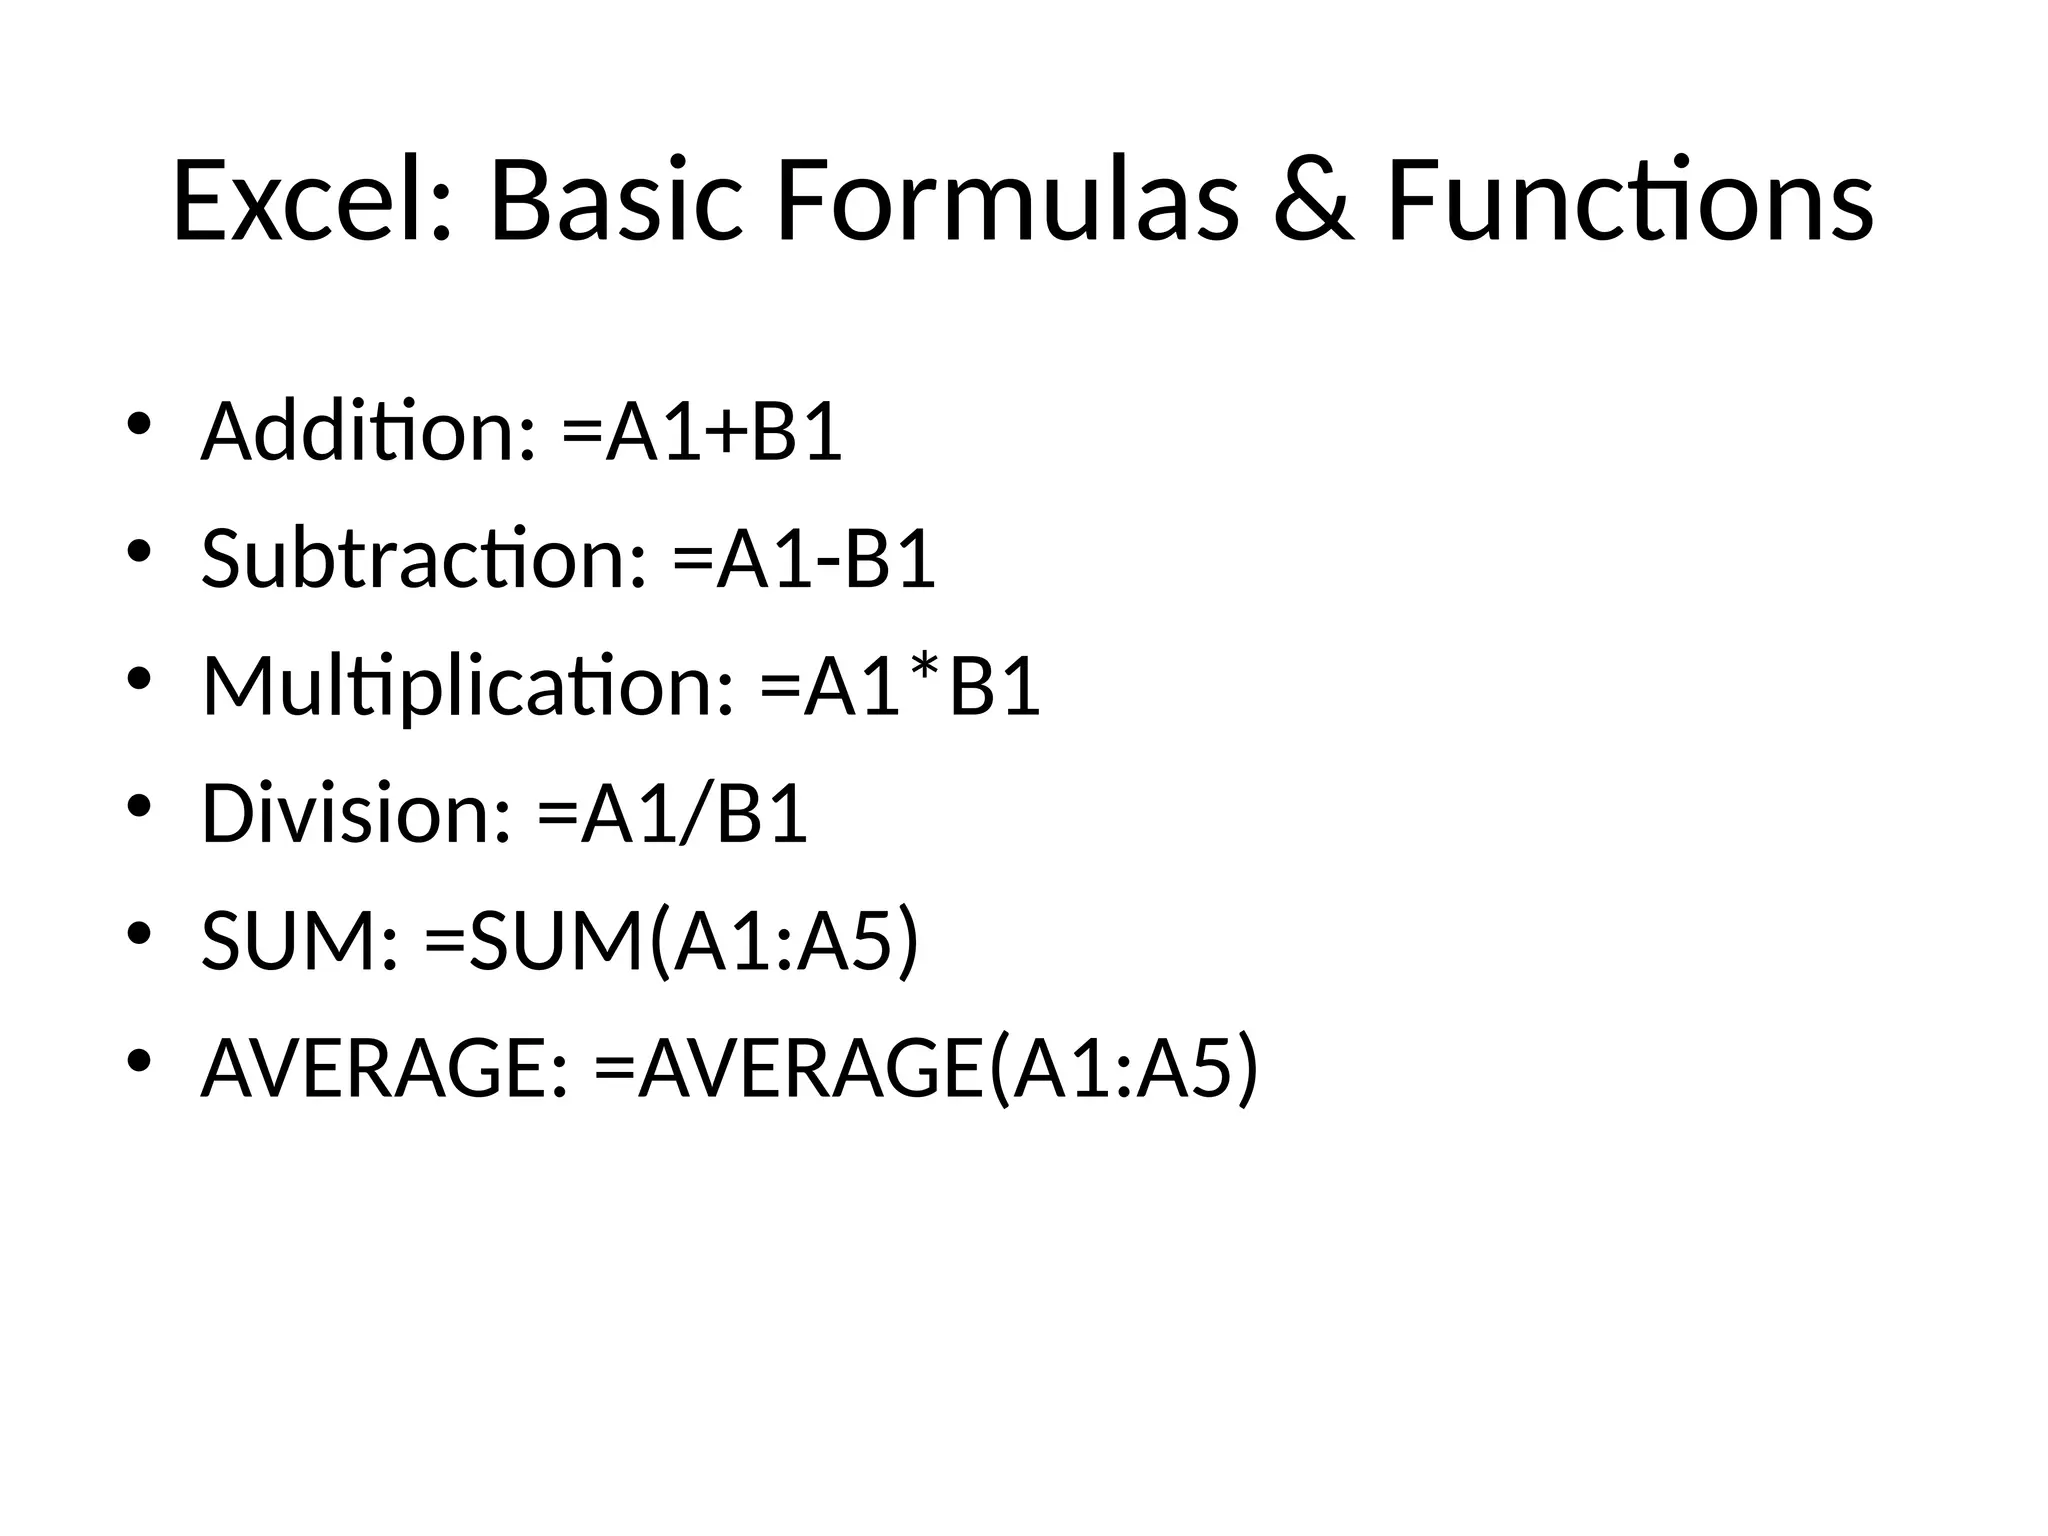
4. Excel: Basic Formulas & Functions
• Addition: =A1+B1
• Subtraction: =A1-B1
• Multiplication: =A1*B1
• Division: =A1/B1
• SUM: =SUM(A1:A5)
• AVERAGE: =AVERAGE(A1:A5)
5. Excel: Sorting & Filtering Data
• Sort Data: Use Sort A-Z or Z-A
• Filter Data: Use Data > Filter to display specific
values
6. 7. Excel: Saving & Exporting
• File > Save As
• Choose .xlsx, .csv, or .pdf format
8. 9. 10. 11. 12. 13. 14.