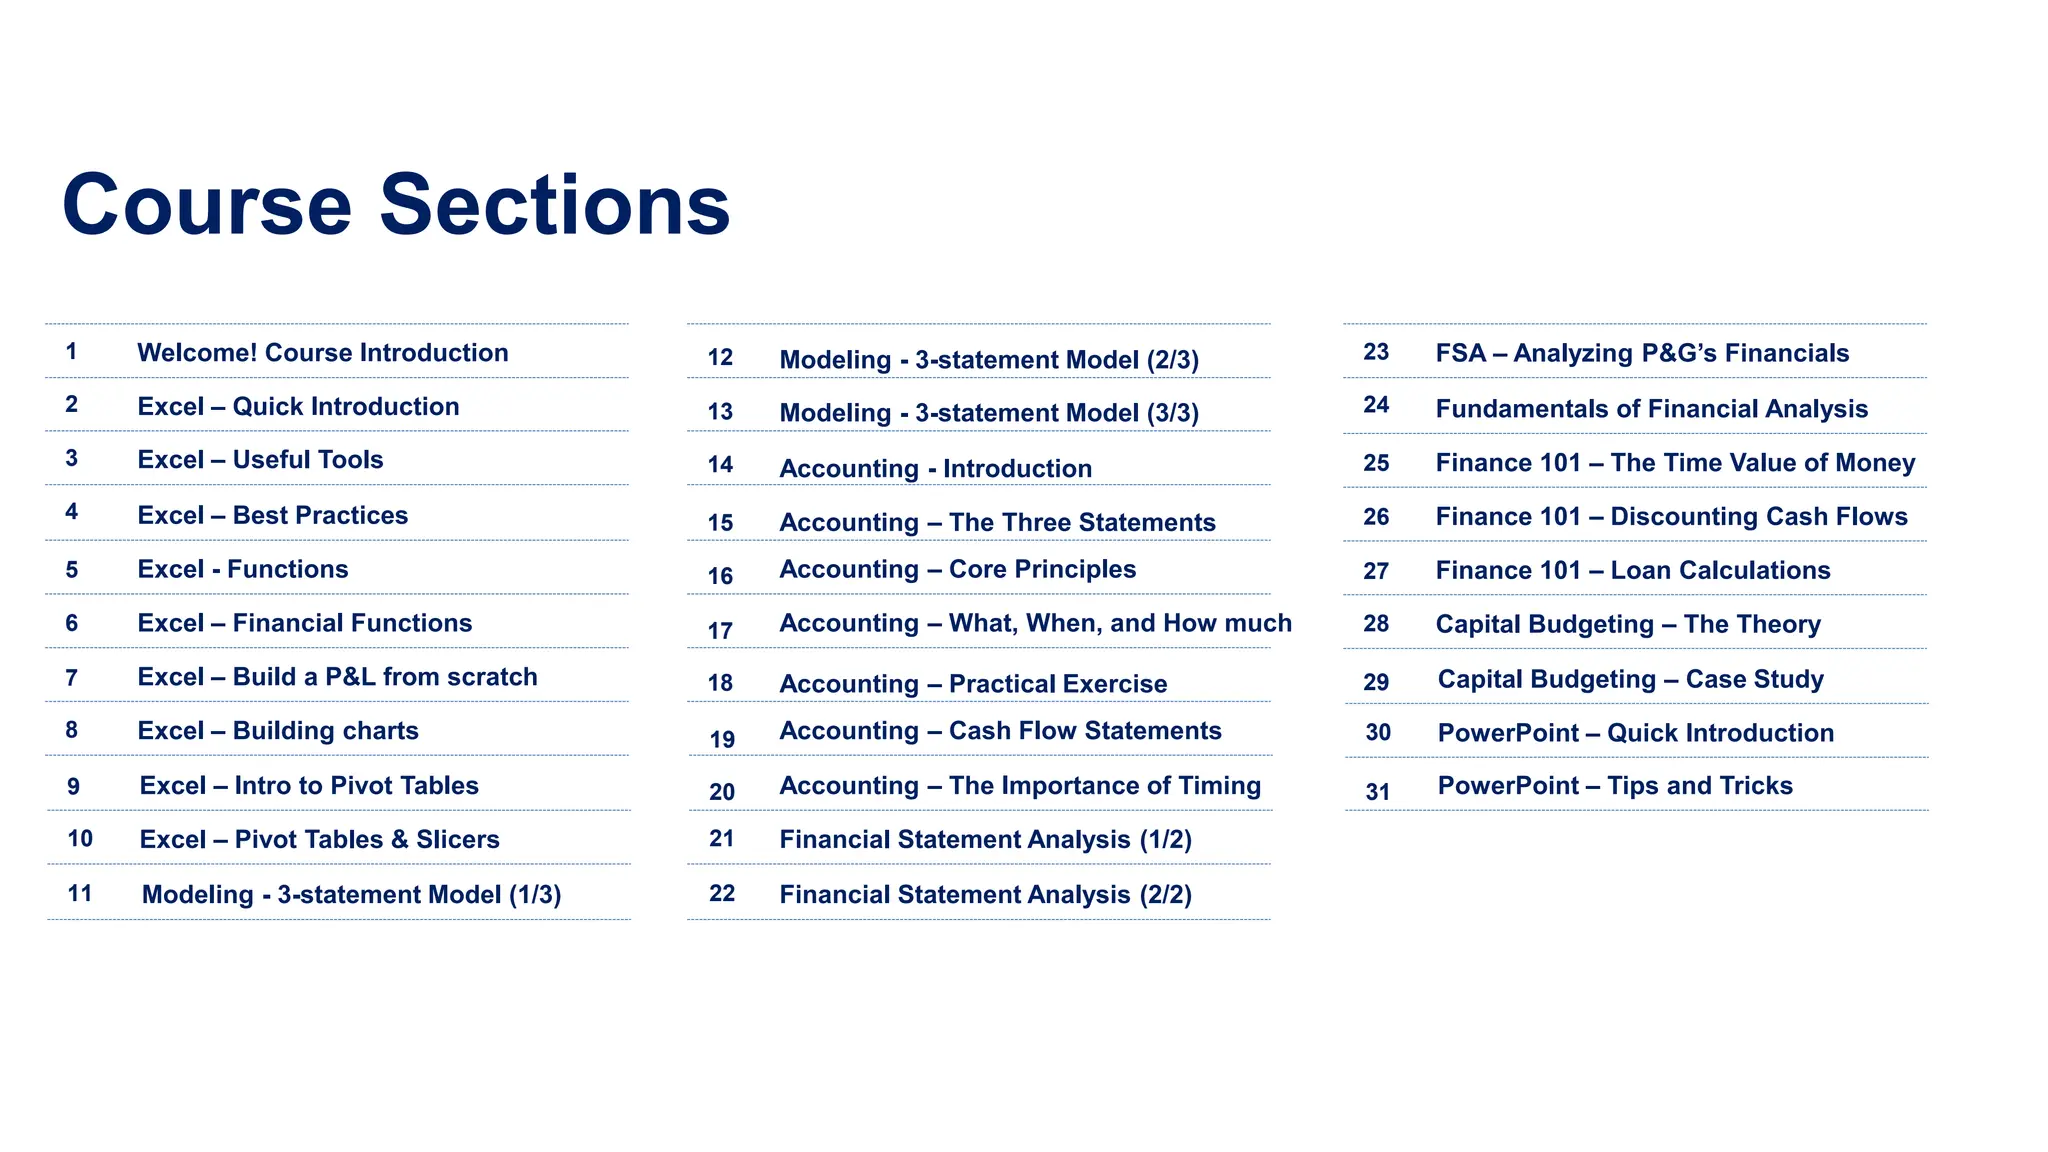
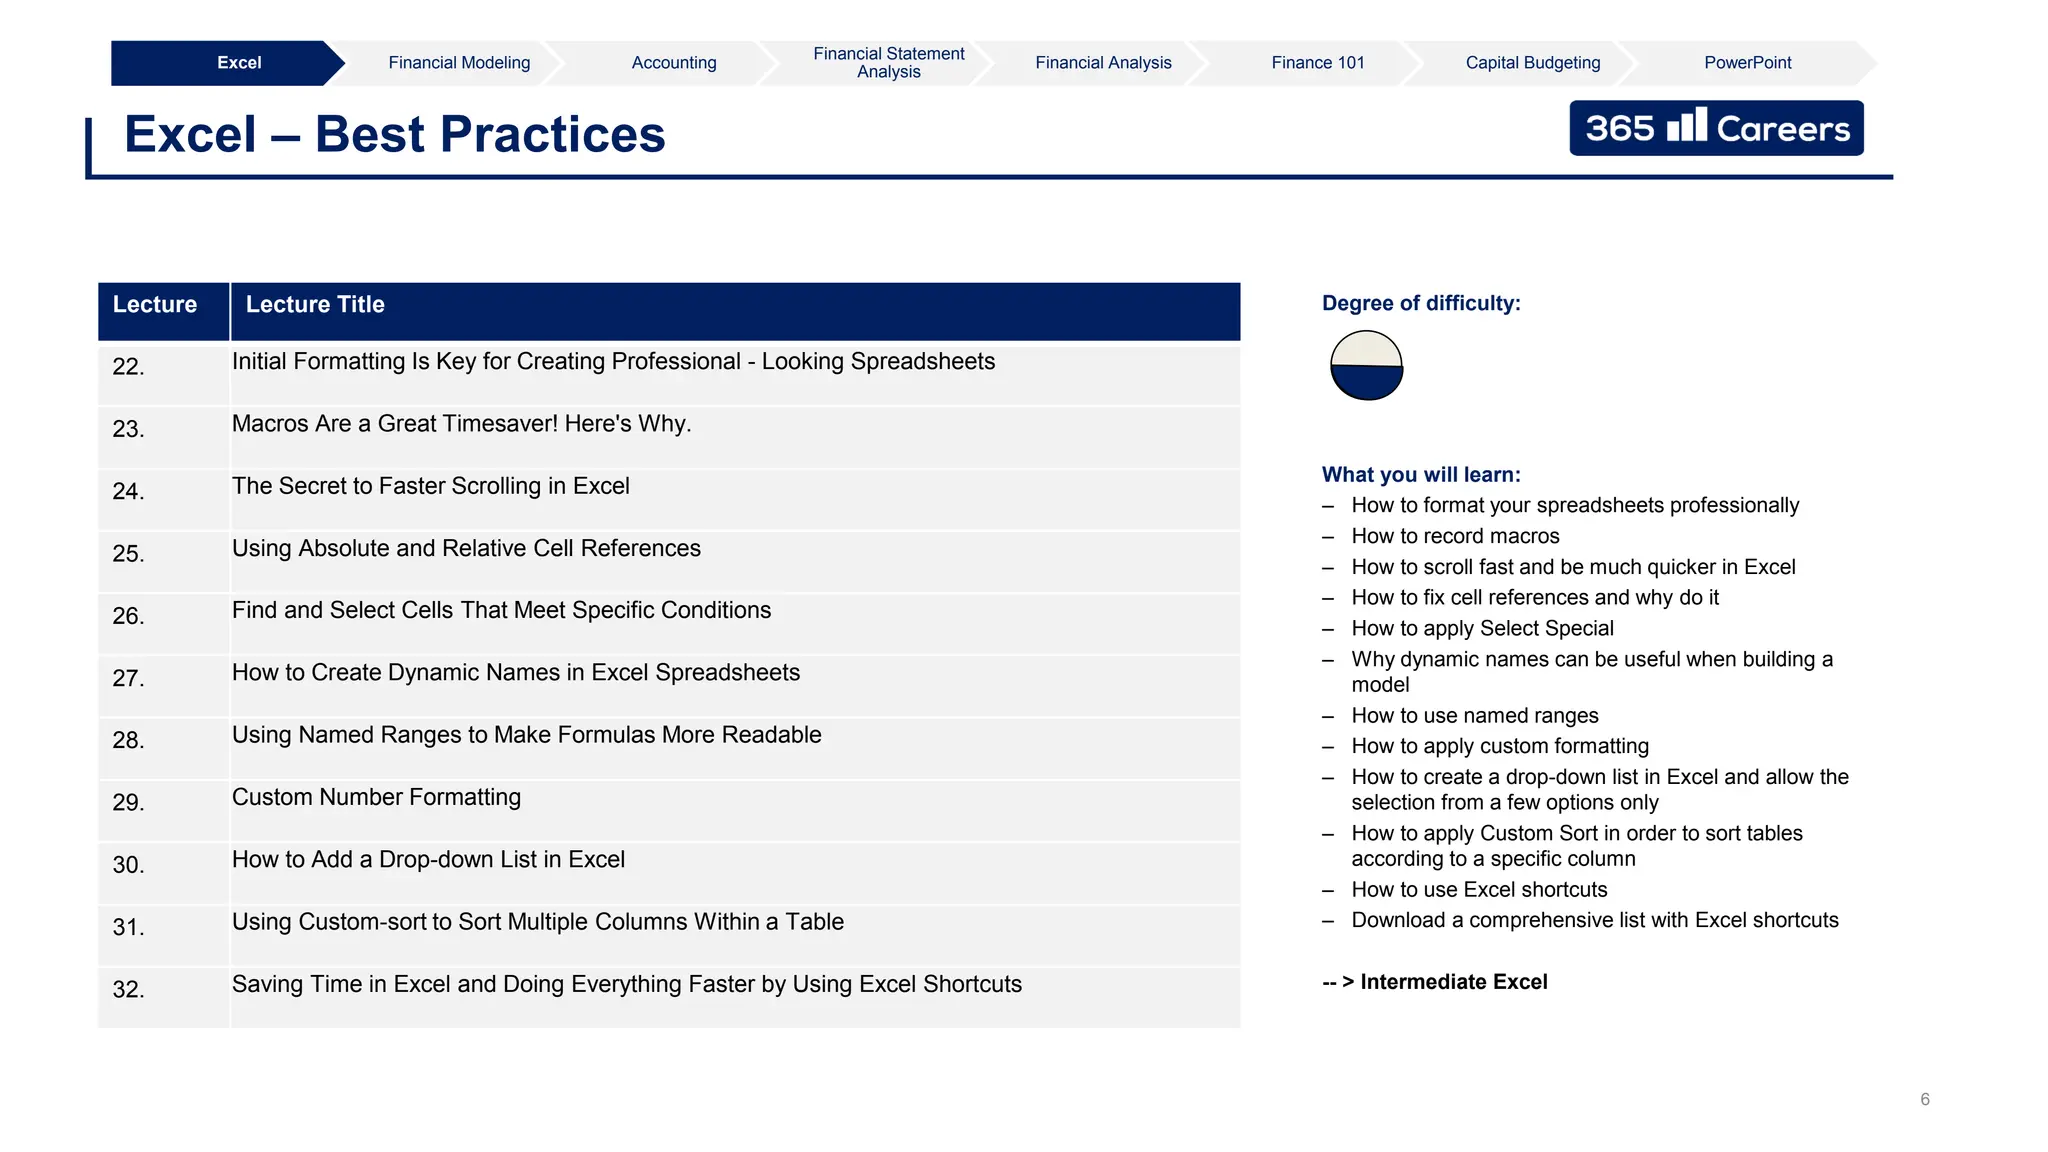
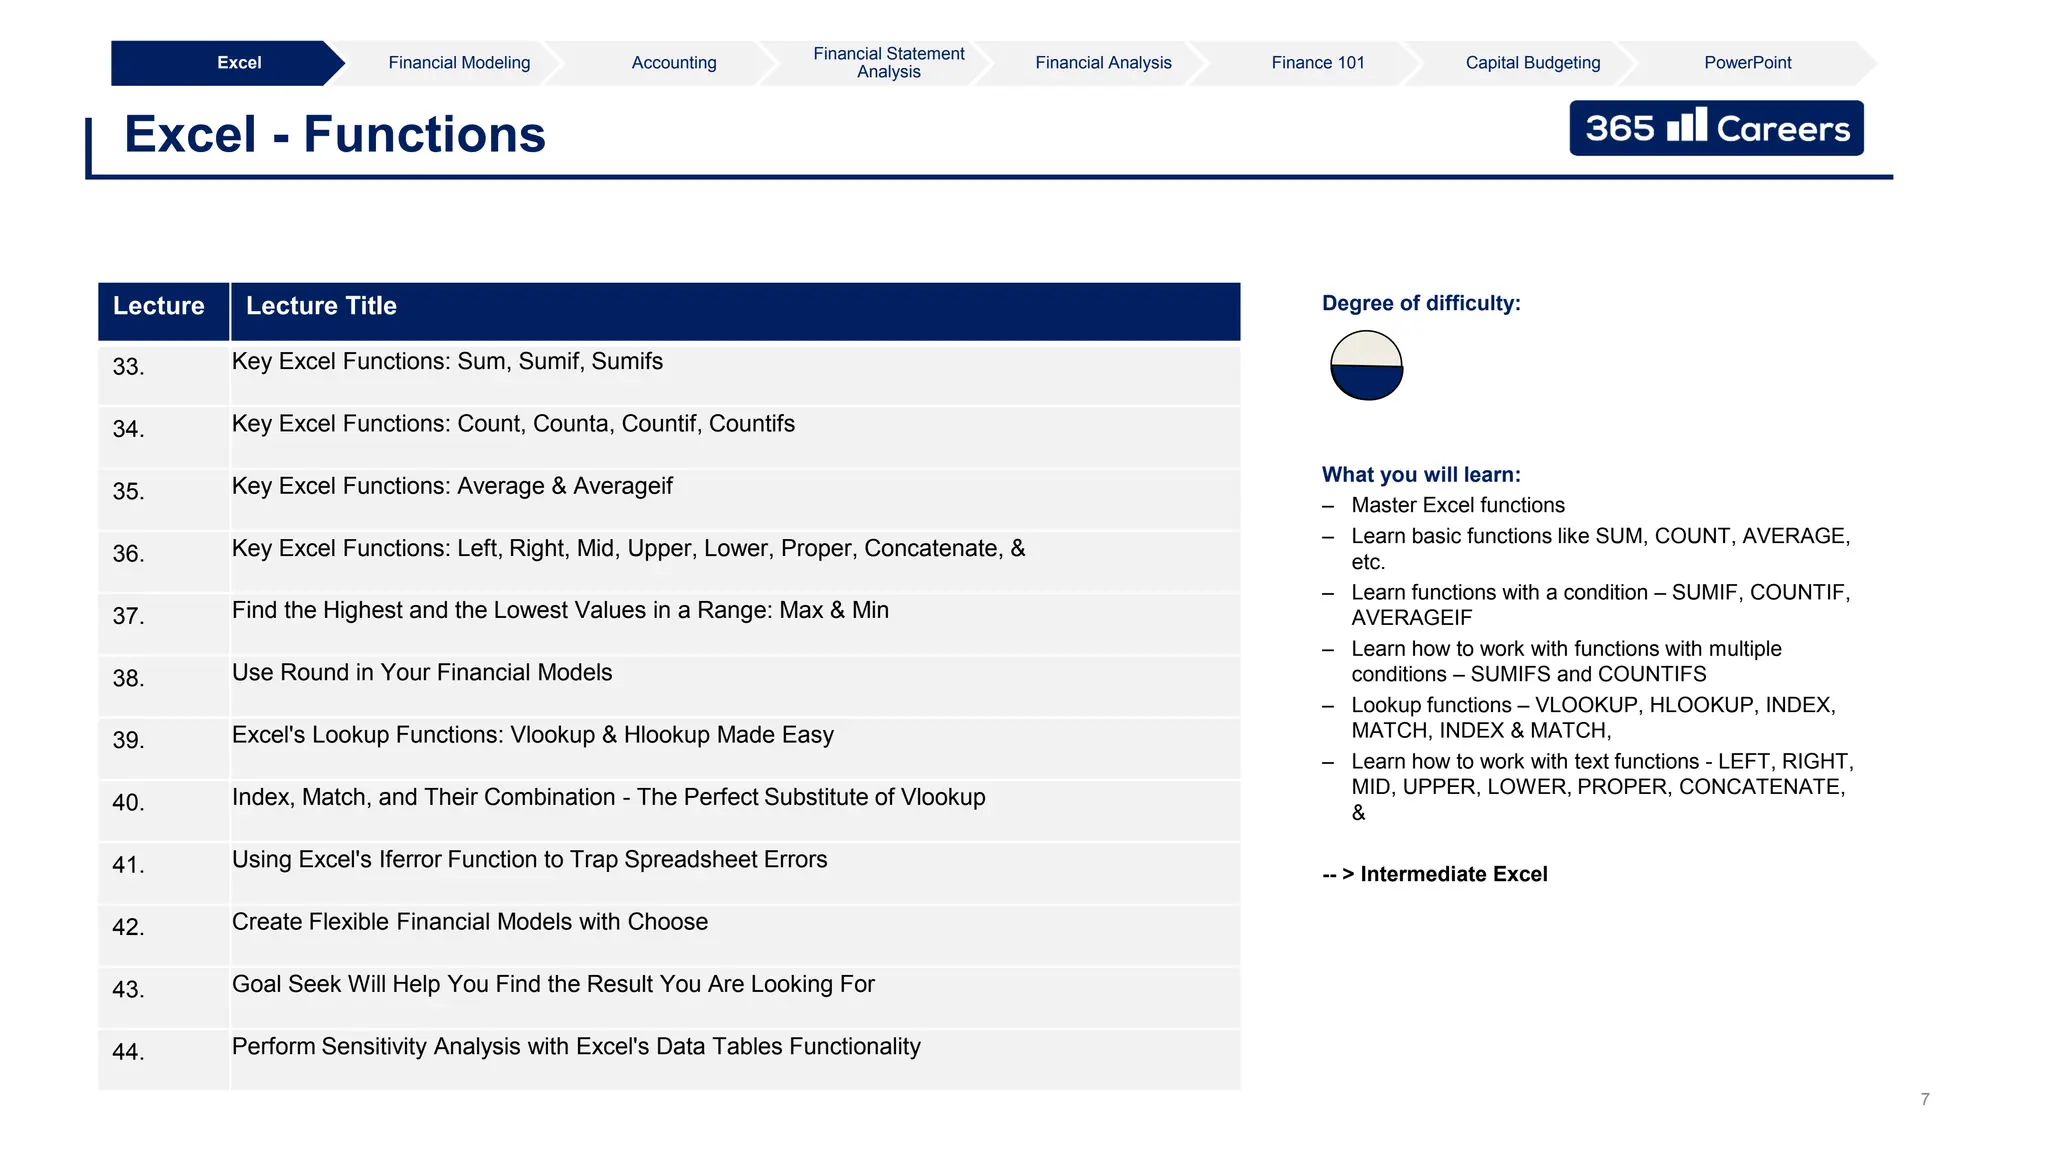
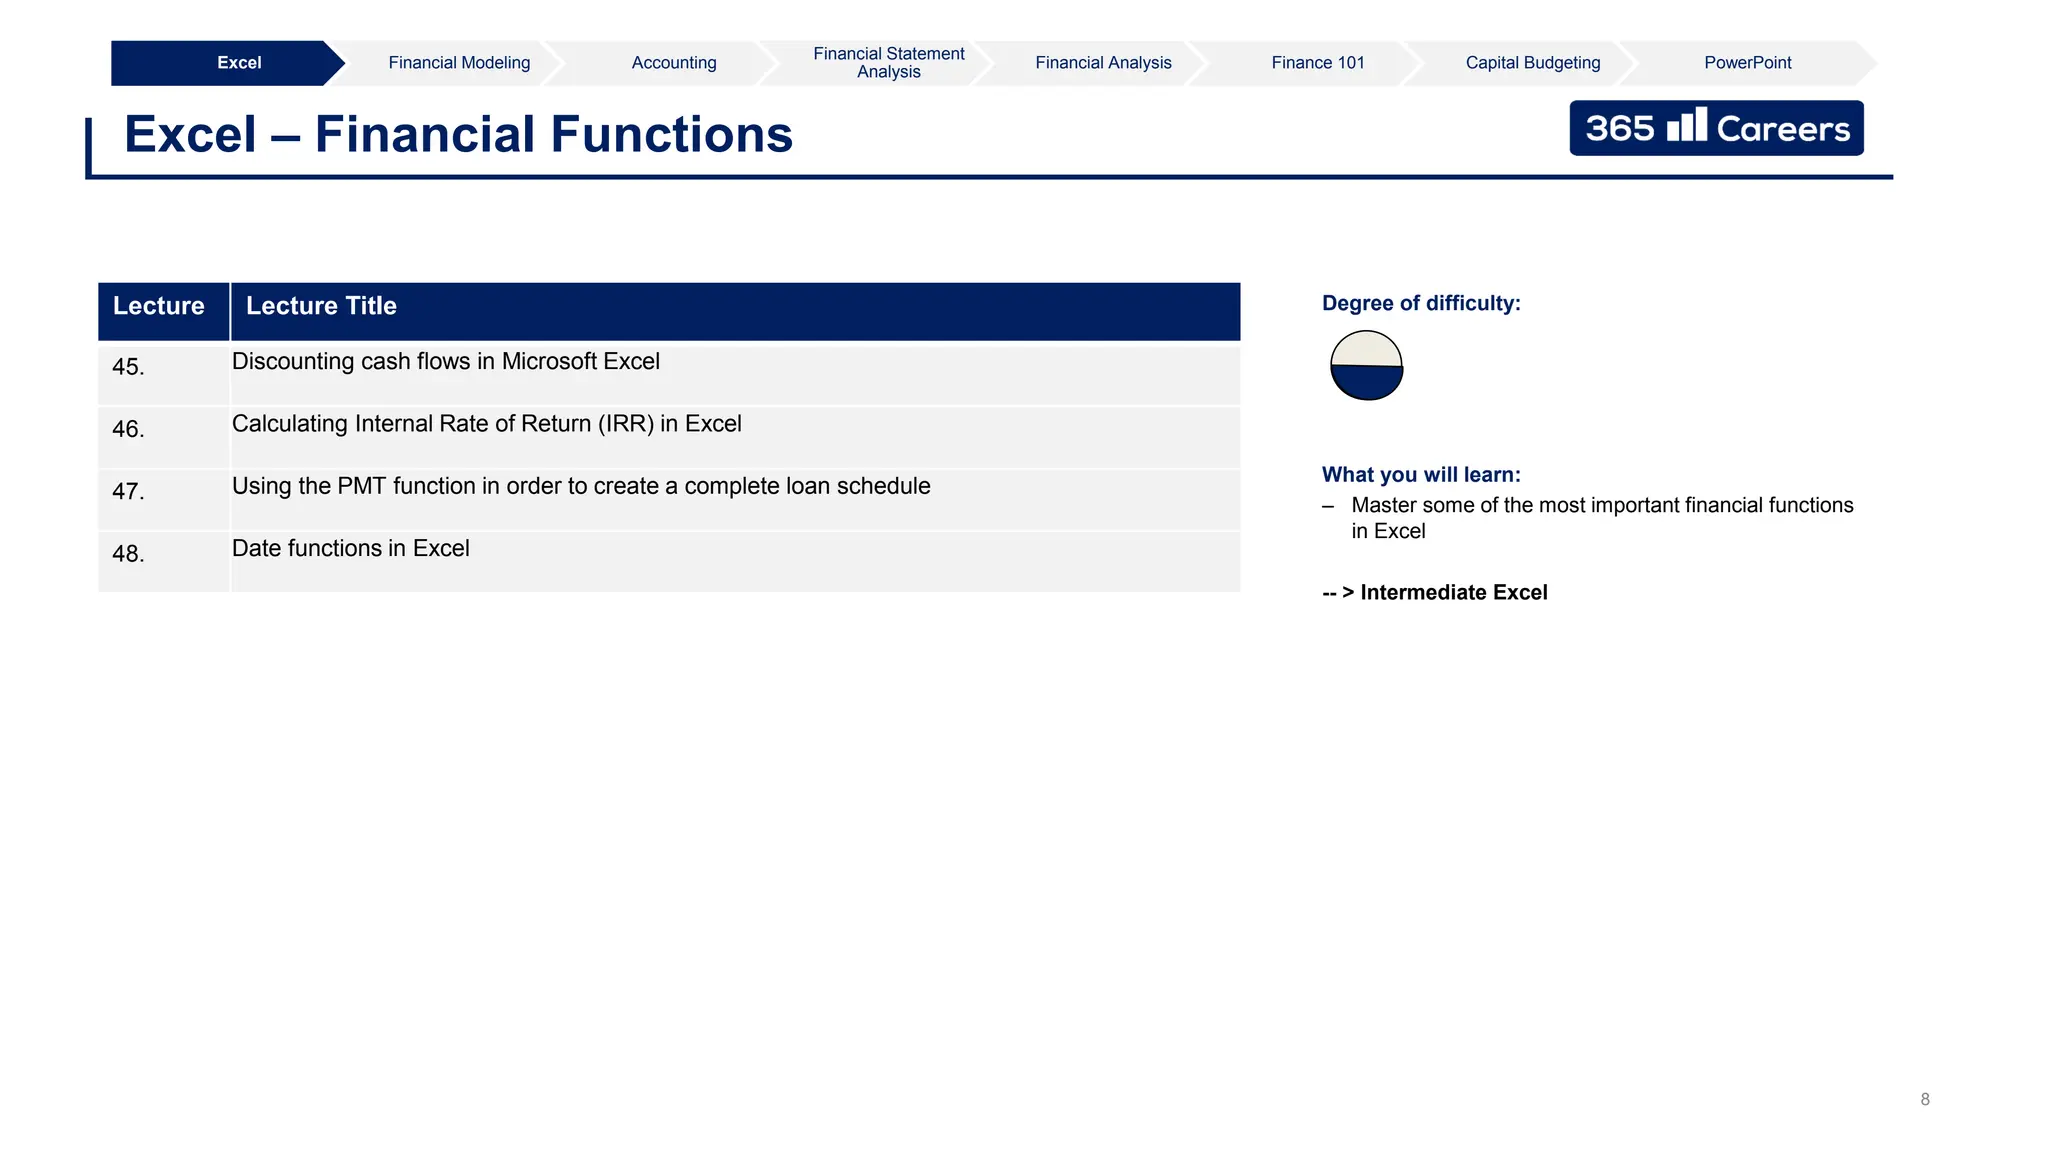
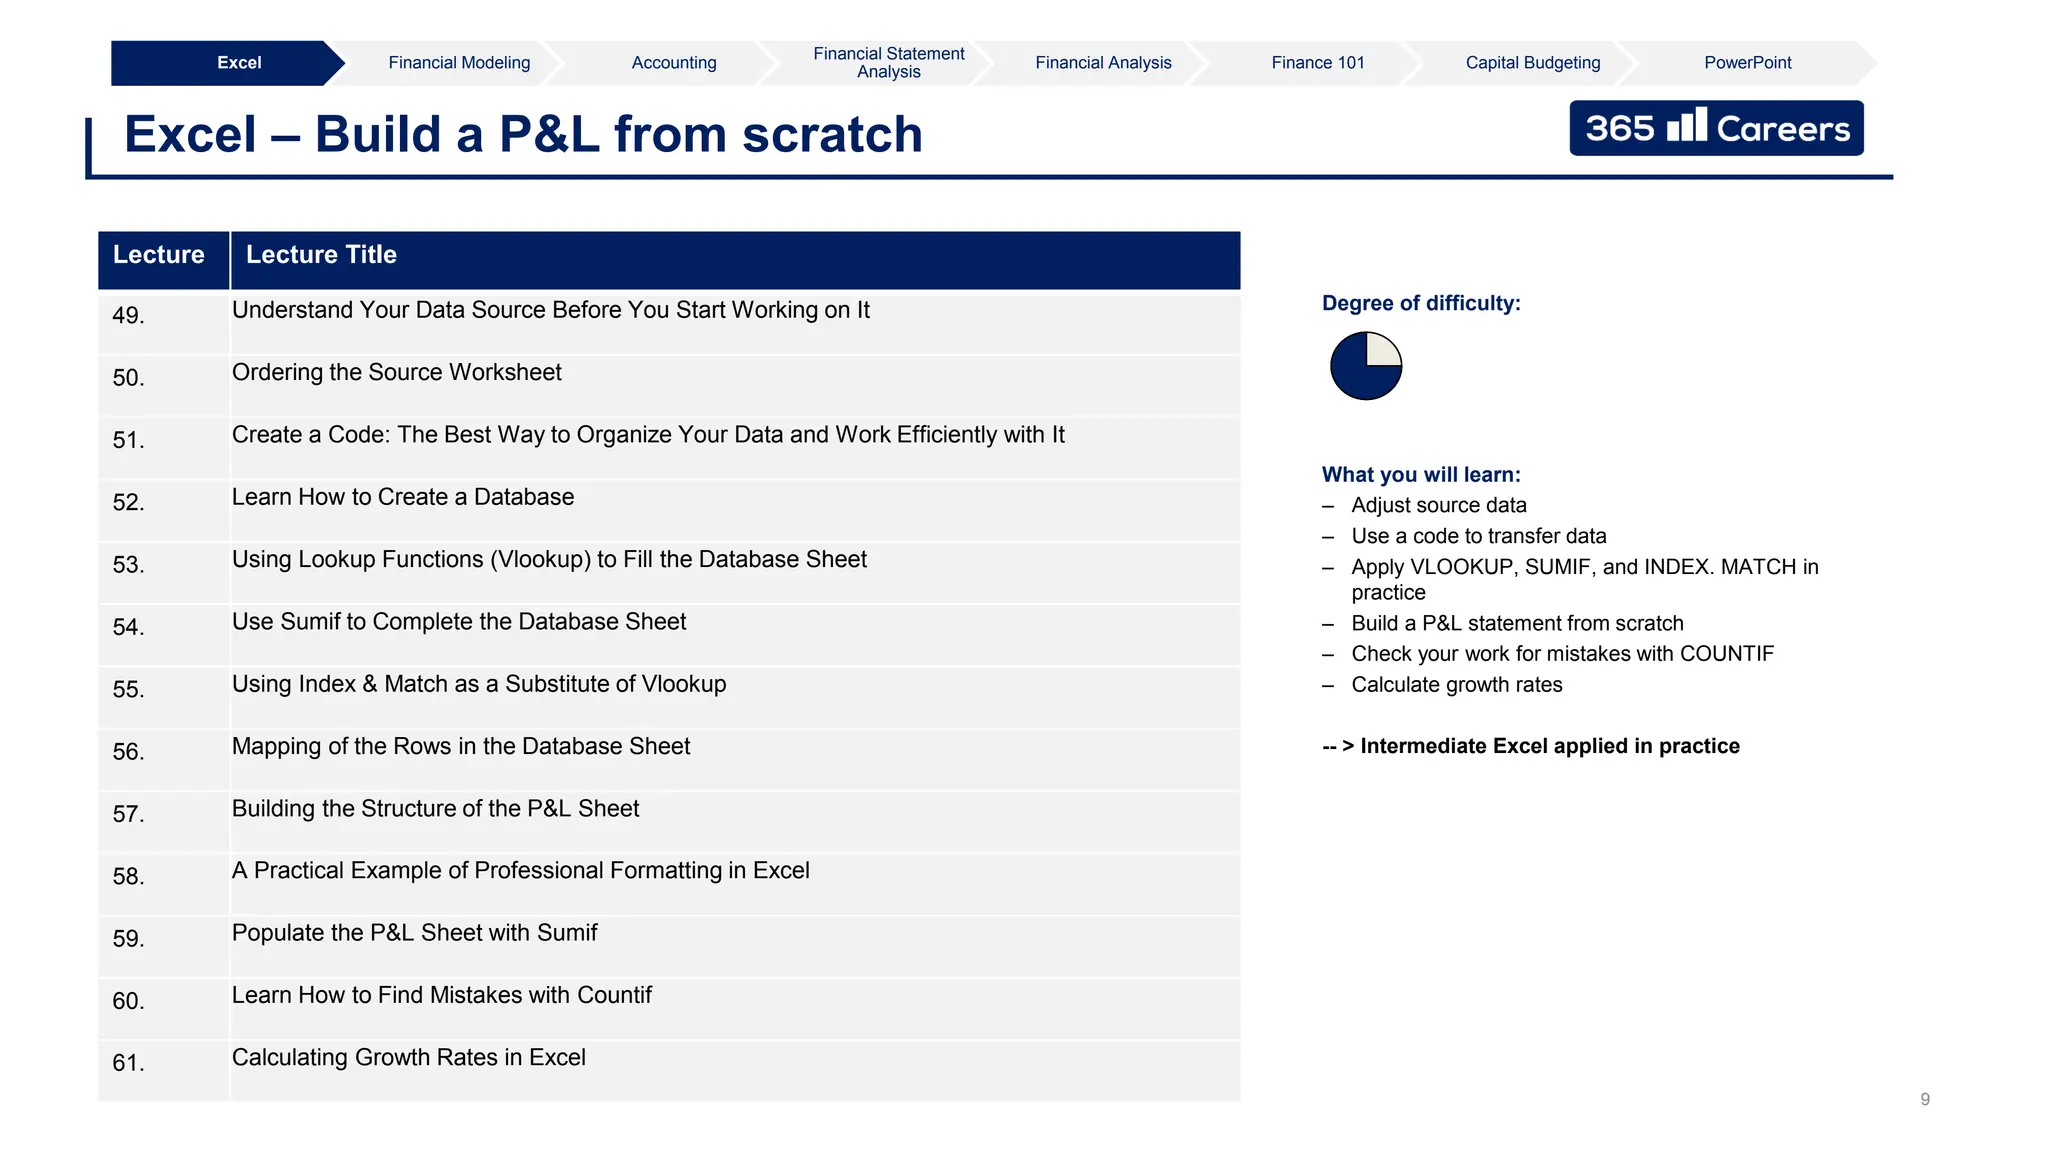
Course Curriculum
Course Sections
Fundamentals of Financial Analysis
Finance 101 – Loan Calculations
PowerPoint – Tips and Tricks
1
2
4
5
6
Welcome! Course Introduction
Excel – Quick Introduction
Excel – Best Practices
Excel - Functions
Excel – Financial Functions
7
8
Excel – Build a P&L from scratch
Excel – Building charts
3 Excel – Useful Tools
9
10
Excel – Intro to Pivot Tables
Excel – Pivot Tables & Slicers
11 Modeling - 3-statement Model (1/3)
Accounting – What, When, and How much
12
14
15
16
Modeling - 3-statement Model (2/3)
Accounting - Introduction
Accounting – The Three Statements
17
18
Accounting – Core Principles
Accounting – Practical Exercise
13 Modeling - 3-statement Model (3/3)
19
20
Accounting – Cash Flow Statements
Accounting – The Importance of Timing
21
22
Financial Statement Analysis (1/2)
Financial Statement Analysis (2/2)
24
25
26
Finance 101 – The Time Value of Money
Finance 101 – Discounting Cash Flows
27
28 Capital Budgeting – The Theory
23 FSA – Analyzing P&G’s Financials
29
30
Capital Budgeting – Case Study
PowerPoint – Quick Introduction
31
3
Welcome! Course Introduction
Excel Financial Modeling Accounting
Financial Statement
Analysis
Financial Analysis Finance 101 Capital Budgeting PowerPoint
What you will learn:
– What is inside the course
– How to take the course
– How to download all course materials
– How to calculate a complete loan schedule
-- > How to take the course
Degree of difficulty:
Lecture Lecture Title
1. What Does the Course Cover?
2. Everything We Will Learn Has a Practical Application
3. The Best Way to Take This Course
4. Download all course materials
4
Excel – Quick Introduction
Excel Financial Modeling Accounting
Financial Statement
Analysis
Financial Analysis Finance 101 Capital Budgeting PowerPoint
What you will learn:
– Understand why you need Microsoft Excel when
working as a financial analyst
– Learn about the Excel interface
– How to perform data entry in Excel
– How to format sheets professionally
– How to work with Excel rows and columns
– How to create an Excel formula
– How to create an Excel function
– How to Cut, Copy, and Paste cells
– How to use Paste and Paste special
-- > Excel Basics
Degree of difficulty:
Lecture Lecture Title
5. Microsoft Excel: The World's #1 Software for the Office
6. Excel Made Easy: A Beginner's Guide to Excel Spreadsheets
7. Data Entry Techniques in Excel
8. How to Make Your Spreadsheets Look Professional
9. Inserting, Deleting, and Modifying Rows & Columns
10. Excel Formulas for Beginners
11. A Beginner's Introduction to Excel Functions
12. Work Efficiently by Using Cut, Copy, and Paste
13. Pasting Values, Formulas and Formats with Paste Special
5
Excel – Useful Tools
Excel Financial Modeling Accounting
Financial Statement
Analysis
Financial Analysis Finance 101 Capital Budgeting PowerPoint
What you will learn:
– How to insert a line break in Excel cells
– How to separate the contents of one Excel cell into
separate columns
– How to prepare Excel files for printing
– How to wrap text into a cell
– How to insert hyperlinks
– How to freeze the title row of your Excel table
– How to use the “Tell me what you want to do”
functionality
– How to create a Pivot table
-- > Excel Basics
Degree of difficulty:
Lecture Lecture Title
14. Inserting a Line Break with Alt + Enter
15. Do More with Your Sales Data with Excel's Text to Columns Feature
16. Create Easily Printable Excel Documents
17. How to Wrap Text in Excel and Adjust a Cell's Size
18. Insert Hyperlinks in Excel Spreadsheets
19. Using Excel's Freeze Panes to Handle Large Datasets
20 Find Excel Functionalities in a Quicker Way - Tell Me What You Want to Do
21. A Quick Introduction to Excel's Pivot Tables
6
Excel – Best Practices
Excel Financial Modeling Accounting
Financial Statement
Analysis
Financial Analysis Finance 101 Capital Budgeting PowerPoint
What you will learn:
– How to format your spreadsheets professionally
– How to record macros
– How to scroll fast and be much quicker in Excel
– How to fix cell references and why do it
– How to apply Select Special
– Why dynamic names can be useful when building a
model
– How to use named ranges
– How to apply custom formatting
– How to create a drop-down list in Excel and allow the
selection from a few options only
– How to apply Custom Sort in order to sort tables
according to a specific column
– How to use Excel shortcuts
– Download a comprehensive list with Excel shortcuts
-- > Intermediate Excel
Degree of difficulty:
Lecture Lecture Title
22. Initial Formatting Is Key for Creating Professional - Looking Spreadsheets
23. Macros Are a Great Timesaver! Here's Why.
24. The Secret to Faster Scrolling in Excel
25. Using Absolute and Relative Cell References
26. Find and Select Cells That Meet Specific Conditions
27. How to Create Dynamic Names in Excel Spreadsheets
28. Using Named Ranges to Make Formulas More Readable
29. Custom Number Formatting
30. How to Add a Drop-down List in Excel
31. Using Custom-sort to Sort Multiple Columns Within a Table
32. Saving Time in Excel and Doing Everything Faster by Using Excel Shortcuts
7
Excel - Functions
Excel Financial Modeling Accounting
Financial Statement
Analysis
Financial Analysis Finance 101 Capital Budgeting PowerPoint
What you will learn:
– Master Excel functions
– Learn basic functions like SUM, COUNT, AVERAGE,
etc.
– Learn functions with a condition – SUMIF, COUNTIF,
AVERAGEIF
– Learn how to work with functions with multiple
conditions – SUMIFS and COUNTIFS
– Lookup functions – VLOOKUP, HLOOKUP, INDEX,
MATCH, INDEX & MATCH,
– Learn how to work with text functions - LEFT, RIGHT,
MID, UPPER, LOWER, PROPER, CONCATENATE,
&
-- > Intermediate Excel
Degree of difficulty:
Lecture Lecture Title
33. Key Excel Functions: Sum, Sumif, Sumifs
34. Key Excel Functions: Count, Counta, Countif, Countifs
35. Key Excel Functions: Average & Averageif
36. Key Excel Functions: Left, Right, Mid, Upper, Lower, Proper, Concatenate, &
37. Find the Highest and the Lowest Values in a Range: Max & Min
38. Use Round in Your Financial Models
39. Excel's Lookup Functions: Vlookup & Hlookup Made Easy
40. Index, Match, and Their Combination - The Perfect Substitute of Vlookup
41. Using Excel's Iferror Function to Trap Spreadsheet Errors
42. Create Flexible Financial Models with Choose
43. Goal Seek Will Help You Find the Result You Are Looking For
44. Perform Sensitivity Analysis with Excel's Data Tables Functionality
8
Excel – Financial Functions
Excel Financial Modeling Accounting
Financial Statement
Analysis
Financial Analysis Finance 101 Capital Budgeting PowerPoint
What you will learn:
– Master some of the most important financial functions
in Excel
-- > Intermediate Excel
Degree of difficulty:
Lecture Lecture Title
45. Discounting cash flows in Microsoft Excel
46. Calculating Internal Rate of Return (IRR) in Excel
47. Using the PMT function in order to create a complete loan schedule
48. Date functions in Excel
9
Excel – Build a P&L from scratch
Excel Financial Modeling Accounting
Financial Statement
Analysis
Financial Analysis Finance 101 Capital Budgeting PowerPoint
What you will learn:
– Adjust source data
– Use a code to transfer data
– Apply VLOOKUP, SUMIF, and INDEX. MATCH in
practice
– Build a P&L statement from scratch
– Check your work for mistakes with COUNTIF
– Calculate growth rates
-- > Intermediate Excel applied in practice
Degree of difficulty:
Lecture Lecture Title
49. Understand Your Data Source Before You Start Working on It
50. Ordering the Source Worksheet
51. Create a Code: The Best Way to Organize Your Data and Work Efficiently with It
52. Learn How to Create a Database
53. Using Lookup Functions (Vlookup) to Fill the Database Sheet
54. Use Sumif to Complete the Database Sheet
55. Using Index & Match as a Substitute of Vlookup
56. Mapping of the Rows in the Database Sheet
57. Building the Structure of the P&L Sheet
58. A Practical Example of Professional Formatting in Excel
59. Populate the P&L Sheet with Sumif
60. Learn How to Find Mistakes with Countif
61. Calculating Growth Rates in Excel
10
Excel – Building charts
Excel Financial Modeling Accounting
Financial Statement
Analysis
Financial Analysis Finance 101 Capital Budgeting PowerPoint
What you will learn:
– Learn how to create charts in Excel 2016
-- > Intermediate Excel
Degree of difficulty:
Lecture Lecture Title
62. Introduction to Excel Charts
63. Beginner's Guide to Inserting Charts in Excel
64. Modifying Excel Charts - The Easy Way to Do It
65. Make Your Excel Charts Look Sexier - Proven Tips
66. Creating a Bridge Chart in Excel 2016 - As Easy as It Gets
67. New Ways to Visualize Your Data - Treemap Charts
68. How to Represent Trends with Sparklines
11
Excel – Intro to Pivot Tables
Excel Financial Modeling Accounting
Financial Statement
Analysis
Financial Analysis Finance 101 Capital Budgeting PowerPoint
What you will learn:
– Introduction to Excel Pivot Tables
– Learn how to work with GETPIVOTDATA
– Learn how to work with slicers
-- > Excel Basics and Intermediate Excel
Degree of difficulty:
Lecture Lecture Title
69. Pivot Tables - Excel's Dynamic and Interactive Tables
70. Creating a Pivot Table: Choosing Row and Column Parameters
71. Design the Layout and Format of Your Pivot Tables
72. Additional Techniques That Will Ease Your Work with Pivot Tables
73. One of the Most Useful Excel Functions – GetPivotData
74. Welcome to the Future - Pivot Table Slicers
75. Introduction to the Course Challenge
Course Challenge 1
12
Excel – Pivot Tables & Slicers
Excel Financial Modeling Accounting
Financial Statement
Analysis
Financial Analysis Finance 101 Capital Budgeting PowerPoint
What you will learn:
– How to create world-class financial reporting using
GETPIVOTDATA and slicers
– Automate calculations
– Format slicers
-- > Advanced Excel
Degree of difficulty:
Lecture Lecture Title
77. Introduction to the Case Study
78. Working with an SAP data extraction
79. Preliminary mapping of the data extraction
80. Creating an output structure of the FMCG model
81. Improving the layout and appearance of the FMCG report
82. Inserting formulas and automating calculations
83. Creating a Master Pivot Table: The main data source for the FMCG report
84. GetPivotData is great! Extracting data from the Master Pivot Table
85. Combining Slicers and GetPivotData: The key to our success
86. Getting fancy with Excel slicers - Good-looking Excel slicers
87. This is how the report can be used in practice by high-level executives
13
Modeling - 3-statement Model (1/3)
Excel Financial Modeling Accounting
Financial Statement
Analysis
Financial Analysis Finance 101 Capital Budgeting PowerPoint
What you will learn:
– How to map financials
– Build a P&L sheet
– Use historical figures to complete the P&L sheet
– Calculate percentage variances
– Build a Balance Sheet
– Apply INDEX, MATCH, MATCH
– Add a forecast period
-- > Financial modeling in practice
Degree of difficulty:
Lecture Lecture Title
88. Introduction to the Exercise
89. Let's create a mapping of financials
90. Building an output P&L sheet
91. Filling in the output P&L sheet with historical financials
92. Calculating percentage variances and applying conditional formatting
93. Building an output Balance sheet
94. Using Index, Match, Match to fill in the output Balance sheet
95. Adding the forecast period
14
Modeling - 3-statement Model (2/3)
What you will learn:
– Apply INDEX and MATCH in practice
– Build a flexible financial model with CHOOSE and
MATCH
– Build a flexible financial model with VLOOKUP and
COLUMNS
– Forecast Balance sheet items
-- > Financial modeling in practice
Degree of difficulty:
Lecture Lecture Title
96. Calculating historical percentage ratios and use Index and Match for scenarios
97. Building a flexible model with Choose & Match
98. Building a flexible model with Vlookup & Columns
99. Calculating historical DSO, DPO, DIO, Other assets %, and Other liabilities %
100. Forecasting DSO, DPO, DIO, Other assets and Other liabilities
Excel Financial Modeling Accounting
Financial Statement
Analysis
Financial Analysis Finance 101 Capital Budgeting PowerPoint
15
Modeling - 3-statement Model (3/3)
What you will learn:
– Build a fixed asset roll forward
– Prepare a financial liabilities schedule
– Prepare an equity schedule
– Build a cash flow statement
– Complete the cash flow statement
-- > Financial modeling in practice
Degree of difficulty:
Lecture Lecture Title
101. Building a Fixed asset roll forward
102. Building a Financial liabilities schedule
103. Building an Equity schedule
104. Preparing a Cash flow structure
105. Calculating Cash flows and completing the model
Excel Financial Modeling Accounting
Financial Statement
Analysis
Financial Analysis Finance 101 Capital Budgeting PowerPoint
16
Accounting - Introduction
Excel Financial Modeling Accounting
Financial Statement
Analysis
Financial Analysis Finance 101 Capital Budgeting PowerPoint
What you will learn:
– Why companies need accounting
– What is bookkeeping
– What is the difference between financial and
managerial accounting
-- > Introduction to Accounting
Degree of difficulty:
Lecture Lecture Title
106. Accounting: The Science Behind Financial Figures
107. What is Accounting and Why Do You Need It
108. The Importance of Bookkeeping - Good Accounting Records Are Essential
109. An Introduction to Financial Accounting
17
Accounting – The Three Statements
What you will learn:
– Which are the three main financial statements
– What you will find in a P&L
– What you will find in a Balance sheet
-- > Introduction to Accounting
Degree of difficulty:
Lecture Lecture Title
110. The Three Core Financial Statements: P&L, Balance Sheet and Cash Flow
111. The Key Accounts You Will Find in a P&L
112. The Main Balance Sheet Items
Excel Financial Modeling Accounting
Financial Statement
Analysis
Financial Analysis Finance 101 Capital Budgeting PowerPoint
18
Accounting – What, When, and How much
What you will learn:
– Why is it important when a company recognizes
revenues and expenses
– What is the difference between historical and fair value
accounting
-- > Introduction to Accounting
Degree of difficulty:
Lecture Lecture Title
113. The Revenue Recognition Principle - Why Is it so Important?
114. The Expense Recognition Principle - When to Recognize Expenses
115. Historical Cost vs. Fair Value Accounting
Excel Financial Modeling Accounting
Financial Statement
Analysis
Financial Analysis Finance 101 Capital Budgeting PowerPoint
19
Accounting – Core Principles
What you will learn:
– The main accounting equation
– What is a general ledger
– How to prepare a T-account
– Why debits and credits are the fundamental pillar of
any Accounting system
– How to calculate Depreciation
– What is the double-entry principle
-- > Intermediate Accounting
Degree of difficulty:
Lecture Lecture Title
116. The Accounting Equation and Its Importance
117. Elements of the Accounting System: General Ledger
118. T-Accounts: The Best Way to Understand Debits and Credits
119. P&L T-Accounts
120. How to Calculate Depreciation Expense
121. The Double-Entry Principle - The Core Principle of Bookkeeping
Excel Financial Modeling Accounting
Financial Statement
Analysis
Financial Analysis Finance 101 Capital Budgeting PowerPoint
20
Accounting – Practical Exercise
What you will learn:
– How to register accounting transactions in practice
-- > Intermediate Accounting
Degree of difficulty:
Lecture Lecture Title
122. Case Study - The Accounting Transactions of a Lemonade Stand (1/4)
123. Case Study - The Accounting Transactions of a Lemonade Stand (2/4)
124. Case Study - The Accounting Transactions of a Lemonade Stand (3/4)
125. Case Study - The Accounting Transactions of a Lemonade Stand (4/4)
Excel Financial Modeling Accounting
Financial Statement
Analysis
Financial Analysis Finance 101 Capital Budgeting PowerPoint
21
Accounting – Cash Flow Statements
What you will learn:
– How to calculate cash flows
– How to prepare a cash flow statement
– What is the difference between the direct and indirect
methods
-- > Intermediate Accounting
Degree of difficulty:
Lecture Lecture Title
126. Calculating Cash Flows - Understand if a business makes or burns cash
127. The three parts of Cash Flow statements explained
128. Cash Flow computations - The Direct method
129. Cash Flow computations - The Indirect method
130. Calculating Cash Flow in practice: A complete example
Excel Financial Modeling Accounting
Financial Statement
Analysis
Financial Analysis Finance 101 Capital Budgeting PowerPoint
22
Accounting – The Importance of Timing
What you will learn:
– When to recognize revenue
– When to recognize costs
– How to work with accruals
-- > Intermediate Accounting
Lecture Lecture Title
131. Timing of Cash Flows and Why It Plays an Important Role for a Business
132. Timing of Income: Principles of Revenue Recognition
133. Timing of Expenses: Principles of Cost Recognition
134. The Four Type of Accruals Arising in Accounting Transactions
Excel Financial Modeling Accounting
Financial Statement
Analysis
Financial Analysis Finance 101 Capital Budgeting PowerPoint
23
Financial Statement Analysis (1/2)
Excel Financial Modeling Accounting
Financial Statement
Analysis
Financial Analysis Finance 101 Capital Budgeting PowerPoint
What you will learn:
– Introduction to financial statement analysis
– How to download a company’s annual report
– Why auditors are important
– How to perform financial statement analysis
-- > Introduction to Financial statement analysis
Degree of difficulty:
Lecture Lecture Title
135. What is a 10-K Report and Why Is It important for Investors?
136. Finding, Downloading and Going Through the Annual Report of P&G
137. What is the Role of Auditing Firms and What Are the Benefits of an Audit?
138. Indispensable Tools for Financial Statement Analysis
24
Financial Statement Analysis (2/2)
What you will learn:
– Horizontal analysis
– Vertical analysis
– Use accounting ratios
-- > Introduction to Financial statement analysis
Degree of difficulty:
Lecture Lecture Title
139. Financial Statement Analysis - A Natural Continuation of Financial Accounting
140. First Steps in Financial Statement Analysis
141. Horizontal vs. Vertical Financial Statement Analysis
142. Calculating Days Payable (DPO), Days Receivable (DSO) and Days Inventory (DIO)
143. Using Accounting Ratios to Assess Business Performance
Excel Financial Modeling Accounting
Financial Statement
Analysis
Financial Analysis Finance 101 Capital Budgeting PowerPoint
25
FSA – Analyzing P&G’s Financials
What you will learn:
– Perform financial statement analysis in practice
-- > Financial statement analysis in practice
Degree of difficulty:
Lecture Lecture Title
144. Case Study - Calculating Ratios and Analyzing P&G's Financials (1/2)
145. Case Study - Calculating Ratios and Analyzing P&G's Financials (2/2)
Course Challenge 2
Excel Financial Modeling Accounting
Financial Statement
Analysis
Financial Analysis Finance 101 Capital Budgeting PowerPoint
26
Fundamentals of Financial Analysis
Excel Financial Modeling Accounting
Financial Statement
Analysis
Financial Analysis Finance 101 Capital Budgeting PowerPoint
What you will learn:
– Why investors invest in companies
– What drives company value
– What are the different positioning strategies
– What factors influence the growth of sales
– How to analyse a company’s growth potential
– What factors influence profitability
– How to analyse a company’s past performance
– How to perform peer comparison
– Analysing revenues, gross profit, EBITDA, net income,
leverage, interest expenses, working capital, operating
cash flows, etc.
– Perform SWOT analysis
-- > Fundamentals of financial analysis
Degree of difficulty:
Lecture Lecture Title
147. Fundamentals of Business & Financial Analysis
27
Finance 101 – The Time Value of Money
Excel Financial Modeling Accounting
Financial Statement
Analysis
Financial Analysis Finance 101 Capital Budgeting PowerPoint
What you will learn:
– The time value of money
– The importance of interest rates
– Fixed vs. variable interest rates
– How to deal with default risk
-- > Finance and financial math basics
Degree of difficulty:
Lecture Lecture Title
148. 148. Finance 101: Important Financial Principles That You Will Need
149. 149. Understanding the Time Value of Money
150. 150. Why Interest Rates Play an Important Role in the Economy?
151. 151. The Components Forming Interest Rates in Real Life
152. 152. What Is Libor and What Does It Serve For?
153. 153. The Difference Between Fixed and Variable Interest Rates
154. What Is Default Risk and How Does a Bank Account For It?
155. Corporate Loan Specifics
28
Finance 101 – Discounting Cash Flows
What you will learn:
– Calculate the present value of future cash flows
– Calculate net present value
-- > Finance and financial math basics
Degree of difficulty:
Lecture Lecture Title
156. Calculating the Present Value of Future Cash Flows
157. A Tool That Helps Us Decide Whether a Project Is Feasible: Net Present Value
Excel Financial Modeling Accounting
Financial Statement
Analysis
Financial Analysis Finance 101 Capital Budgeting PowerPoint
29
Finance 101 – Loan Calculations
What you will learn:
– Use annuities
– Calculate a complete loan schedule
-- > Finance and financial math basics
Degree of difficulty:
Lecture Lecture Title
158. Using Annuities
159. Calculating a Complete Loan Schedule
Course Challenge 3
Excel Financial Modeling Accounting
Financial Statement
Analysis
Financial Analysis Finance 101 Capital Budgeting PowerPoint
30
Capital Budgeting – The Theory
Excel Financial Modeling Accounting
Financial Statement
Analysis
Financial Analysis Finance 101 Capital Budgeting PowerPoint
What you will learn:
– Why companies use capital budgeting
– How to calculate cost of equity
– How to calculate a project-specific beta
– How to calculate the weighted average cost of capital
(WACC)
– What are the different cash flow types in capital
budgeting
– How to model future cash flows
-- > Introduction to Capital budgeting
Degree of difficulty:
Lecture Lecture Title
161. What is Capital Budgeting?
162. When Do We Use Capital Budgeting?
163. The Time Value of Money in a Capital Budgeting Setting
164. Calculating Present and Future Value
165. Cost of Equity
166. Project-specific Beta
167. The Weighted Average Cost of Capital (WACC)
168. The Different Cash Flow Types in a Capital Budgeting Exercise
169. Modeling Future Cash Flows
31
Capital Budgeting – Case Study
What you will learn:
– How to create a complete capital budgeting exercise
from scratch
-- > Capital budgeting in practice
Degree of difficulty:
Lecture Lecture Title
170. An introduction to the Case Study
171. Organizing inputs in the "Drivers" sheet
172. Modeling expected savings - Building cars in Italy vs. Building cars in Vietnam
173. Preparing a fixed asset roll forward schedule
174. Calculating the cash impact of extra working capital required
175. Debt repayment and interest expenses calculation
176. The project's P&L sheet
177. The project's cash flow calculation
178. Calculating WACC (Weighted Average Cost of Capital)
179. Estimating cost of equity
180. Discounting project cash flows
181. Performing sensitivity analysis and wrapping up the Case Study
Excel Financial Modeling Accounting
Financial Statement
Analysis
Financial Analysis Finance 101 Capital Budgeting PowerPoint
32
PowerPoint – Quick Introduction
Excel Financial Modeling Accounting
Financial Statement
Analysis
Financial Analysis Finance 101 Capital Budgeting PowerPoint
What you will learn:
– Learn how to work with different PowerPoint tools
-- > PowerPoint basics
Degree of difficulty:
Lecture Lecture Title
182. Microsoft PowerPoint: The Most Popular Presentation Software for the Office
183. The Structure of the PowerPoint Ribbon
184. General Considerations About Slide Structure
185. Learn How to Insert Objects in PowerPoint
186. Shortcuts Allow Us To Be Much Faster When Working in PowerPoint
187. Add Frequently Used Buttons to the Quick Access Toolbar
188. How to Easily Align Objects in PowerPoint
189. Editing Shapes in Your Presentation - The Format Shape Menu
190. How to Format Text Boxes in a PowerPoint Presentation
191. Changing an Object's Size and Learning About Rotation Options
192. Work Efficiently By Using Slide Masters
33
PowerPoint – Tips and Tricks
What you will learn:
– Learn how to work with different PowerPoint tools
-- > Intermediate PowerPoint
Degree of difficulty:
Lecture Lecture Title
193. Modifying the Beginning and Ending of a Line Object
194. Join Shapes Together By Using Connector Lines
195. Group or Ungroup Shapes, Pictures or Other Objects
196. This is How You Can Fit Text When It Is Larger than a Shape
197. PowerPoint's Smart Art Feature Offers Great Return for Your Time
198. Creating Eye-Catching Text Effects in PowerPoint
199. Practical Exercise - Creating an Organizational Chart
Course Challenge 4
Excel Financial Modeling Accounting
Financial Statement
Analysis
Financial Analysis Finance 101 Capital Budgeting PowerPoint

Financial Analysis course curriculum for students

  • 1.
  • 2.
    Course Sections Fundamentals ofFinancial Analysis Finance 101 – Loan Calculations PowerPoint – Tips and Tricks 1 2 4 5 6 Welcome! Course Introduction Excel – Quick Introduction Excel – Best Practices Excel - Functions Excel – Financial Functions 7 8 Excel – Build a P&L from scratch Excel – Building charts 3 Excel – Useful Tools 9 10 Excel – Intro to Pivot Tables Excel – Pivot Tables & Slicers 11 Modeling - 3-statement Model (1/3) Accounting – What, When, and How much 12 14 15 16 Modeling - 3-statement Model (2/3) Accounting - Introduction Accounting – The Three Statements 17 18 Accounting – Core Principles Accounting – Practical Exercise 13 Modeling - 3-statement Model (3/3) 19 20 Accounting – Cash Flow Statements Accounting – The Importance of Timing 21 22 Financial Statement Analysis (1/2) Financial Statement Analysis (2/2) 24 25 26 Finance 101 – The Time Value of Money Finance 101 – Discounting Cash Flows 27 28 Capital Budgeting – The Theory 23 FSA – Analyzing P&G’s Financials 29 30 Capital Budgeting – Case Study PowerPoint – Quick Introduction 31
  • 3.
    3 Welcome! Course Introduction ExcelFinancial Modeling Accounting Financial Statement Analysis Financial Analysis Finance 101 Capital Budgeting PowerPoint What you will learn: – What is inside the course – How to take the course – How to download all course materials – How to calculate a complete loan schedule -- > How to take the course Degree of difficulty: Lecture Lecture Title 1. What Does the Course Cover? 2. Everything We Will Learn Has a Practical Application 3. The Best Way to Take This Course 4. Download all course materials
  • 4.
    4 Excel – QuickIntroduction Excel Financial Modeling Accounting Financial Statement Analysis Financial Analysis Finance 101 Capital Budgeting PowerPoint What you will learn: – Understand why you need Microsoft Excel when working as a financial analyst – Learn about the Excel interface – How to perform data entry in Excel – How to format sheets professionally – How to work with Excel rows and columns – How to create an Excel formula – How to create an Excel function – How to Cut, Copy, and Paste cells – How to use Paste and Paste special -- > Excel Basics Degree of difficulty: Lecture Lecture Title 5. Microsoft Excel: The World's #1 Software for the Office 6. Excel Made Easy: A Beginner's Guide to Excel Spreadsheets 7. Data Entry Techniques in Excel 8. How to Make Your Spreadsheets Look Professional 9. Inserting, Deleting, and Modifying Rows & Columns 10. Excel Formulas for Beginners 11. A Beginner's Introduction to Excel Functions 12. Work Efficiently by Using Cut, Copy, and Paste 13. Pasting Values, Formulas and Formats with Paste Special
  • 5.
    5 Excel – UsefulTools Excel Financial Modeling Accounting Financial Statement Analysis Financial Analysis Finance 101 Capital Budgeting PowerPoint What you will learn: – How to insert a line break in Excel cells – How to separate the contents of one Excel cell into separate columns – How to prepare Excel files for printing – How to wrap text into a cell – How to insert hyperlinks – How to freeze the title row of your Excel table – How to use the “Tell me what you want to do” functionality – How to create a Pivot table -- > Excel Basics Degree of difficulty: Lecture Lecture Title 14. Inserting a Line Break with Alt + Enter 15. Do More with Your Sales Data with Excel's Text to Columns Feature 16. Create Easily Printable Excel Documents 17. How to Wrap Text in Excel and Adjust a Cell's Size 18. Insert Hyperlinks in Excel Spreadsheets 19. Using Excel's Freeze Panes to Handle Large Datasets 20 Find Excel Functionalities in a Quicker Way - Tell Me What You Want to Do 21. A Quick Introduction to Excel's Pivot Tables
  • 6.
    6 Excel – BestPractices Excel Financial Modeling Accounting Financial Statement Analysis Financial Analysis Finance 101 Capital Budgeting PowerPoint What you will learn: – How to format your spreadsheets professionally – How to record macros – How to scroll fast and be much quicker in Excel – How to fix cell references and why do it – How to apply Select Special – Why dynamic names can be useful when building a model – How to use named ranges – How to apply custom formatting – How to create a drop-down list in Excel and allow the selection from a few options only – How to apply Custom Sort in order to sort tables according to a specific column – How to use Excel shortcuts – Download a comprehensive list with Excel shortcuts -- > Intermediate Excel Degree of difficulty: Lecture Lecture Title 22. Initial Formatting Is Key for Creating Professional - Looking Spreadsheets 23. Macros Are a Great Timesaver! Here's Why. 24. The Secret to Faster Scrolling in Excel 25. Using Absolute and Relative Cell References 26. Find and Select Cells That Meet Specific Conditions 27. How to Create Dynamic Names in Excel Spreadsheets 28. Using Named Ranges to Make Formulas More Readable 29. Custom Number Formatting 30. How to Add a Drop-down List in Excel 31. Using Custom-sort to Sort Multiple Columns Within a Table 32. Saving Time in Excel and Doing Everything Faster by Using Excel Shortcuts
  • 7.
    7 Excel - Functions ExcelFinancial Modeling Accounting Financial Statement Analysis Financial Analysis Finance 101 Capital Budgeting PowerPoint What you will learn: – Master Excel functions – Learn basic functions like SUM, COUNT, AVERAGE, etc. – Learn functions with a condition – SUMIF, COUNTIF, AVERAGEIF – Learn how to work with functions with multiple conditions – SUMIFS and COUNTIFS – Lookup functions – VLOOKUP, HLOOKUP, INDEX, MATCH, INDEX & MATCH, – Learn how to work with text functions - LEFT, RIGHT, MID, UPPER, LOWER, PROPER, CONCATENATE, & -- > Intermediate Excel Degree of difficulty: Lecture Lecture Title 33. Key Excel Functions: Sum, Sumif, Sumifs 34. Key Excel Functions: Count, Counta, Countif, Countifs 35. Key Excel Functions: Average & Averageif 36. Key Excel Functions: Left, Right, Mid, Upper, Lower, Proper, Concatenate, & 37. Find the Highest and the Lowest Values in a Range: Max & Min 38. Use Round in Your Financial Models 39. Excel's Lookup Functions: Vlookup & Hlookup Made Easy 40. Index, Match, and Their Combination - The Perfect Substitute of Vlookup 41. Using Excel's Iferror Function to Trap Spreadsheet Errors 42. Create Flexible Financial Models with Choose 43. Goal Seek Will Help You Find the Result You Are Looking For 44. Perform Sensitivity Analysis with Excel's Data Tables Functionality
  • 8.
    8 Excel – FinancialFunctions Excel Financial Modeling Accounting Financial Statement Analysis Financial Analysis Finance 101 Capital Budgeting PowerPoint What you will learn: – Master some of the most important financial functions in Excel -- > Intermediate Excel Degree of difficulty: Lecture Lecture Title 45. Discounting cash flows in Microsoft Excel 46. Calculating Internal Rate of Return (IRR) in Excel 47. Using the PMT function in order to create a complete loan schedule 48. Date functions in Excel
  • 9.
    9 Excel – Builda P&L from scratch Excel Financial Modeling Accounting Financial Statement Analysis Financial Analysis Finance 101 Capital Budgeting PowerPoint What you will learn: – Adjust source data – Use a code to transfer data – Apply VLOOKUP, SUMIF, and INDEX. MATCH in practice – Build a P&L statement from scratch – Check your work for mistakes with COUNTIF – Calculate growth rates -- > Intermediate Excel applied in practice Degree of difficulty: Lecture Lecture Title 49. Understand Your Data Source Before You Start Working on It 50. Ordering the Source Worksheet 51. Create a Code: The Best Way to Organize Your Data and Work Efficiently with It 52. Learn How to Create a Database 53. Using Lookup Functions (Vlookup) to Fill the Database Sheet 54. Use Sumif to Complete the Database Sheet 55. Using Index & Match as a Substitute of Vlookup 56. Mapping of the Rows in the Database Sheet 57. Building the Structure of the P&L Sheet 58. A Practical Example of Professional Formatting in Excel 59. Populate the P&L Sheet with Sumif 60. Learn How to Find Mistakes with Countif 61. Calculating Growth Rates in Excel
  • 10.
    10 Excel – Buildingcharts Excel Financial Modeling Accounting Financial Statement Analysis Financial Analysis Finance 101 Capital Budgeting PowerPoint What you will learn: – Learn how to create charts in Excel 2016 -- > Intermediate Excel Degree of difficulty: Lecture Lecture Title 62. Introduction to Excel Charts 63. Beginner's Guide to Inserting Charts in Excel 64. Modifying Excel Charts - The Easy Way to Do It 65. Make Your Excel Charts Look Sexier - Proven Tips 66. Creating a Bridge Chart in Excel 2016 - As Easy as It Gets 67. New Ways to Visualize Your Data - Treemap Charts 68. How to Represent Trends with Sparklines
  • 11.
    11 Excel – Introto Pivot Tables Excel Financial Modeling Accounting Financial Statement Analysis Financial Analysis Finance 101 Capital Budgeting PowerPoint What you will learn: – Introduction to Excel Pivot Tables – Learn how to work with GETPIVOTDATA – Learn how to work with slicers -- > Excel Basics and Intermediate Excel Degree of difficulty: Lecture Lecture Title 69. Pivot Tables - Excel's Dynamic and Interactive Tables 70. Creating a Pivot Table: Choosing Row and Column Parameters 71. Design the Layout and Format of Your Pivot Tables 72. Additional Techniques That Will Ease Your Work with Pivot Tables 73. One of the Most Useful Excel Functions – GetPivotData 74. Welcome to the Future - Pivot Table Slicers 75. Introduction to the Course Challenge Course Challenge 1
  • 12.
    12 Excel – PivotTables & Slicers Excel Financial Modeling Accounting Financial Statement Analysis Financial Analysis Finance 101 Capital Budgeting PowerPoint What you will learn: – How to create world-class financial reporting using GETPIVOTDATA and slicers – Automate calculations – Format slicers -- > Advanced Excel Degree of difficulty: Lecture Lecture Title 77. Introduction to the Case Study 78. Working with an SAP data extraction 79. Preliminary mapping of the data extraction 80. Creating an output structure of the FMCG model 81. Improving the layout and appearance of the FMCG report 82. Inserting formulas and automating calculations 83. Creating a Master Pivot Table: The main data source for the FMCG report 84. GetPivotData is great! Extracting data from the Master Pivot Table 85. Combining Slicers and GetPivotData: The key to our success 86. Getting fancy with Excel slicers - Good-looking Excel slicers 87. This is how the report can be used in practice by high-level executives
  • 13.
    13 Modeling - 3-statementModel (1/3) Excel Financial Modeling Accounting Financial Statement Analysis Financial Analysis Finance 101 Capital Budgeting PowerPoint What you will learn: – How to map financials – Build a P&L sheet – Use historical figures to complete the P&L sheet – Calculate percentage variances – Build a Balance Sheet – Apply INDEX, MATCH, MATCH – Add a forecast period -- > Financial modeling in practice Degree of difficulty: Lecture Lecture Title 88. Introduction to the Exercise 89. Let's create a mapping of financials 90. Building an output P&L sheet 91. Filling in the output P&L sheet with historical financials 92. Calculating percentage variances and applying conditional formatting 93. Building an output Balance sheet 94. Using Index, Match, Match to fill in the output Balance sheet 95. Adding the forecast period
  • 14.
    14 Modeling - 3-statementModel (2/3) What you will learn: – Apply INDEX and MATCH in practice – Build a flexible financial model with CHOOSE and MATCH – Build a flexible financial model with VLOOKUP and COLUMNS – Forecast Balance sheet items -- > Financial modeling in practice Degree of difficulty: Lecture Lecture Title 96. Calculating historical percentage ratios and use Index and Match for scenarios 97. Building a flexible model with Choose & Match 98. Building a flexible model with Vlookup & Columns 99. Calculating historical DSO, DPO, DIO, Other assets %, and Other liabilities % 100. Forecasting DSO, DPO, DIO, Other assets and Other liabilities Excel Financial Modeling Accounting Financial Statement Analysis Financial Analysis Finance 101 Capital Budgeting PowerPoint
  • 15.
    15 Modeling - 3-statementModel (3/3) What you will learn: – Build a fixed asset roll forward – Prepare a financial liabilities schedule – Prepare an equity schedule – Build a cash flow statement – Complete the cash flow statement -- > Financial modeling in practice Degree of difficulty: Lecture Lecture Title 101. Building a Fixed asset roll forward 102. Building a Financial liabilities schedule 103. Building an Equity schedule 104. Preparing a Cash flow structure 105. Calculating Cash flows and completing the model Excel Financial Modeling Accounting Financial Statement Analysis Financial Analysis Finance 101 Capital Budgeting PowerPoint
  • 16.
    16 Accounting - Introduction ExcelFinancial Modeling Accounting Financial Statement Analysis Financial Analysis Finance 101 Capital Budgeting PowerPoint What you will learn: – Why companies need accounting – What is bookkeeping – What is the difference between financial and managerial accounting -- > Introduction to Accounting Degree of difficulty: Lecture Lecture Title 106. Accounting: The Science Behind Financial Figures 107. What is Accounting and Why Do You Need It 108. The Importance of Bookkeeping - Good Accounting Records Are Essential 109. An Introduction to Financial Accounting
  • 17.
    17 Accounting – TheThree Statements What you will learn: – Which are the three main financial statements – What you will find in a P&L – What you will find in a Balance sheet -- > Introduction to Accounting Degree of difficulty: Lecture Lecture Title 110. The Three Core Financial Statements: P&L, Balance Sheet and Cash Flow 111. The Key Accounts You Will Find in a P&L 112. The Main Balance Sheet Items Excel Financial Modeling Accounting Financial Statement Analysis Financial Analysis Finance 101 Capital Budgeting PowerPoint
  • 18.
    18 Accounting – What,When, and How much What you will learn: – Why is it important when a company recognizes revenues and expenses – What is the difference between historical and fair value accounting -- > Introduction to Accounting Degree of difficulty: Lecture Lecture Title 113. The Revenue Recognition Principle - Why Is it so Important? 114. The Expense Recognition Principle - When to Recognize Expenses 115. Historical Cost vs. Fair Value Accounting Excel Financial Modeling Accounting Financial Statement Analysis Financial Analysis Finance 101 Capital Budgeting PowerPoint
  • 19.
    19 Accounting – CorePrinciples What you will learn: – The main accounting equation – What is a general ledger – How to prepare a T-account – Why debits and credits are the fundamental pillar of any Accounting system – How to calculate Depreciation – What is the double-entry principle -- > Intermediate Accounting Degree of difficulty: Lecture Lecture Title 116. The Accounting Equation and Its Importance 117. Elements of the Accounting System: General Ledger 118. T-Accounts: The Best Way to Understand Debits and Credits 119. P&L T-Accounts 120. How to Calculate Depreciation Expense 121. The Double-Entry Principle - The Core Principle of Bookkeeping Excel Financial Modeling Accounting Financial Statement Analysis Financial Analysis Finance 101 Capital Budgeting PowerPoint
  • 20.
    20 Accounting – PracticalExercise What you will learn: – How to register accounting transactions in practice -- > Intermediate Accounting Degree of difficulty: Lecture Lecture Title 122. Case Study - The Accounting Transactions of a Lemonade Stand (1/4) 123. Case Study - The Accounting Transactions of a Lemonade Stand (2/4) 124. Case Study - The Accounting Transactions of a Lemonade Stand (3/4) 125. Case Study - The Accounting Transactions of a Lemonade Stand (4/4) Excel Financial Modeling Accounting Financial Statement Analysis Financial Analysis Finance 101 Capital Budgeting PowerPoint
  • 21.
    21 Accounting – CashFlow Statements What you will learn: – How to calculate cash flows – How to prepare a cash flow statement – What is the difference between the direct and indirect methods -- > Intermediate Accounting Degree of difficulty: Lecture Lecture Title 126. Calculating Cash Flows - Understand if a business makes or burns cash 127. The three parts of Cash Flow statements explained 128. Cash Flow computations - The Direct method 129. Cash Flow computations - The Indirect method 130. Calculating Cash Flow in practice: A complete example Excel Financial Modeling Accounting Financial Statement Analysis Financial Analysis Finance 101 Capital Budgeting PowerPoint
  • 22.
    22 Accounting – TheImportance of Timing What you will learn: – When to recognize revenue – When to recognize costs – How to work with accruals -- > Intermediate Accounting Lecture Lecture Title 131. Timing of Cash Flows and Why It Plays an Important Role for a Business 132. Timing of Income: Principles of Revenue Recognition 133. Timing of Expenses: Principles of Cost Recognition 134. The Four Type of Accruals Arising in Accounting Transactions Excel Financial Modeling Accounting Financial Statement Analysis Financial Analysis Finance 101 Capital Budgeting PowerPoint
  • 23.
    23 Financial Statement Analysis(1/2) Excel Financial Modeling Accounting Financial Statement Analysis Financial Analysis Finance 101 Capital Budgeting PowerPoint What you will learn: – Introduction to financial statement analysis – How to download a company’s annual report – Why auditors are important – How to perform financial statement analysis -- > Introduction to Financial statement analysis Degree of difficulty: Lecture Lecture Title 135. What is a 10-K Report and Why Is It important for Investors? 136. Finding, Downloading and Going Through the Annual Report of P&G 137. What is the Role of Auditing Firms and What Are the Benefits of an Audit? 138. Indispensable Tools for Financial Statement Analysis
  • 24.
    24 Financial Statement Analysis(2/2) What you will learn: – Horizontal analysis – Vertical analysis – Use accounting ratios -- > Introduction to Financial statement analysis Degree of difficulty: Lecture Lecture Title 139. Financial Statement Analysis - A Natural Continuation of Financial Accounting 140. First Steps in Financial Statement Analysis 141. Horizontal vs. Vertical Financial Statement Analysis 142. Calculating Days Payable (DPO), Days Receivable (DSO) and Days Inventory (DIO) 143. Using Accounting Ratios to Assess Business Performance Excel Financial Modeling Accounting Financial Statement Analysis Financial Analysis Finance 101 Capital Budgeting PowerPoint
  • 25.
    25 FSA – AnalyzingP&G’s Financials What you will learn: – Perform financial statement analysis in practice -- > Financial statement analysis in practice Degree of difficulty: Lecture Lecture Title 144. Case Study - Calculating Ratios and Analyzing P&G's Financials (1/2) 145. Case Study - Calculating Ratios and Analyzing P&G's Financials (2/2) Course Challenge 2 Excel Financial Modeling Accounting Financial Statement Analysis Financial Analysis Finance 101 Capital Budgeting PowerPoint
  • 26.
    26 Fundamentals of FinancialAnalysis Excel Financial Modeling Accounting Financial Statement Analysis Financial Analysis Finance 101 Capital Budgeting PowerPoint What you will learn: – Why investors invest in companies – What drives company value – What are the different positioning strategies – What factors influence the growth of sales – How to analyse a company’s growth potential – What factors influence profitability – How to analyse a company’s past performance – How to perform peer comparison – Analysing revenues, gross profit, EBITDA, net income, leverage, interest expenses, working capital, operating cash flows, etc. – Perform SWOT analysis -- > Fundamentals of financial analysis Degree of difficulty: Lecture Lecture Title 147. Fundamentals of Business & Financial Analysis
  • 27.
    27 Finance 101 –The Time Value of Money Excel Financial Modeling Accounting Financial Statement Analysis Financial Analysis Finance 101 Capital Budgeting PowerPoint What you will learn: – The time value of money – The importance of interest rates – Fixed vs. variable interest rates – How to deal with default risk -- > Finance and financial math basics Degree of difficulty: Lecture Lecture Title 148. 148. Finance 101: Important Financial Principles That You Will Need 149. 149. Understanding the Time Value of Money 150. 150. Why Interest Rates Play an Important Role in the Economy? 151. 151. The Components Forming Interest Rates in Real Life 152. 152. What Is Libor and What Does It Serve For? 153. 153. The Difference Between Fixed and Variable Interest Rates 154. What Is Default Risk and How Does a Bank Account For It? 155. Corporate Loan Specifics
  • 28.
    28 Finance 101 –Discounting Cash Flows What you will learn: – Calculate the present value of future cash flows – Calculate net present value -- > Finance and financial math basics Degree of difficulty: Lecture Lecture Title 156. Calculating the Present Value of Future Cash Flows 157. A Tool That Helps Us Decide Whether a Project Is Feasible: Net Present Value Excel Financial Modeling Accounting Financial Statement Analysis Financial Analysis Finance 101 Capital Budgeting PowerPoint
  • 29.
    29 Finance 101 –Loan Calculations What you will learn: – Use annuities – Calculate a complete loan schedule -- > Finance and financial math basics Degree of difficulty: Lecture Lecture Title 158. Using Annuities 159. Calculating a Complete Loan Schedule Course Challenge 3 Excel Financial Modeling Accounting Financial Statement Analysis Financial Analysis Finance 101 Capital Budgeting PowerPoint
  • 30.
    30 Capital Budgeting –The Theory Excel Financial Modeling Accounting Financial Statement Analysis Financial Analysis Finance 101 Capital Budgeting PowerPoint What you will learn: – Why companies use capital budgeting – How to calculate cost of equity – How to calculate a project-specific beta – How to calculate the weighted average cost of capital (WACC) – What are the different cash flow types in capital budgeting – How to model future cash flows -- > Introduction to Capital budgeting Degree of difficulty: Lecture Lecture Title 161. What is Capital Budgeting? 162. When Do We Use Capital Budgeting? 163. The Time Value of Money in a Capital Budgeting Setting 164. Calculating Present and Future Value 165. Cost of Equity 166. Project-specific Beta 167. The Weighted Average Cost of Capital (WACC) 168. The Different Cash Flow Types in a Capital Budgeting Exercise 169. Modeling Future Cash Flows
  • 31.
    31 Capital Budgeting –Case Study What you will learn: – How to create a complete capital budgeting exercise from scratch -- > Capital budgeting in practice Degree of difficulty: Lecture Lecture Title 170. An introduction to the Case Study 171. Organizing inputs in the "Drivers" sheet 172. Modeling expected savings - Building cars in Italy vs. Building cars in Vietnam 173. Preparing a fixed asset roll forward schedule 174. Calculating the cash impact of extra working capital required 175. Debt repayment and interest expenses calculation 176. The project's P&L sheet 177. The project's cash flow calculation 178. Calculating WACC (Weighted Average Cost of Capital) 179. Estimating cost of equity 180. Discounting project cash flows 181. Performing sensitivity analysis and wrapping up the Case Study Excel Financial Modeling Accounting Financial Statement Analysis Financial Analysis Finance 101 Capital Budgeting PowerPoint
  • 32.
    32 PowerPoint – QuickIntroduction Excel Financial Modeling Accounting Financial Statement Analysis Financial Analysis Finance 101 Capital Budgeting PowerPoint What you will learn: – Learn how to work with different PowerPoint tools -- > PowerPoint basics Degree of difficulty: Lecture Lecture Title 182. Microsoft PowerPoint: The Most Popular Presentation Software for the Office 183. The Structure of the PowerPoint Ribbon 184. General Considerations About Slide Structure 185. Learn How to Insert Objects in PowerPoint 186. Shortcuts Allow Us To Be Much Faster When Working in PowerPoint 187. Add Frequently Used Buttons to the Quick Access Toolbar 188. How to Easily Align Objects in PowerPoint 189. Editing Shapes in Your Presentation - The Format Shape Menu 190. How to Format Text Boxes in a PowerPoint Presentation 191. Changing an Object's Size and Learning About Rotation Options 192. Work Efficiently By Using Slide Masters
  • 33.
    33 PowerPoint – Tipsand Tricks What you will learn: – Learn how to work with different PowerPoint tools -- > Intermediate PowerPoint Degree of difficulty: Lecture Lecture Title 193. Modifying the Beginning and Ending of a Line Object 194. Join Shapes Together By Using Connector Lines 195. Group or Ungroup Shapes, Pictures or Other Objects 196. This is How You Can Fit Text When It Is Larger than a Shape 197. PowerPoint's Smart Art Feature Offers Great Return for Your Time 198. Creating Eye-Catching Text Effects in PowerPoint 199. Practical Exercise - Creating an Organizational Chart Course Challenge 4 Excel Financial Modeling Accounting Financial Statement Analysis Financial Analysis Finance 101 Capital Budgeting PowerPoint