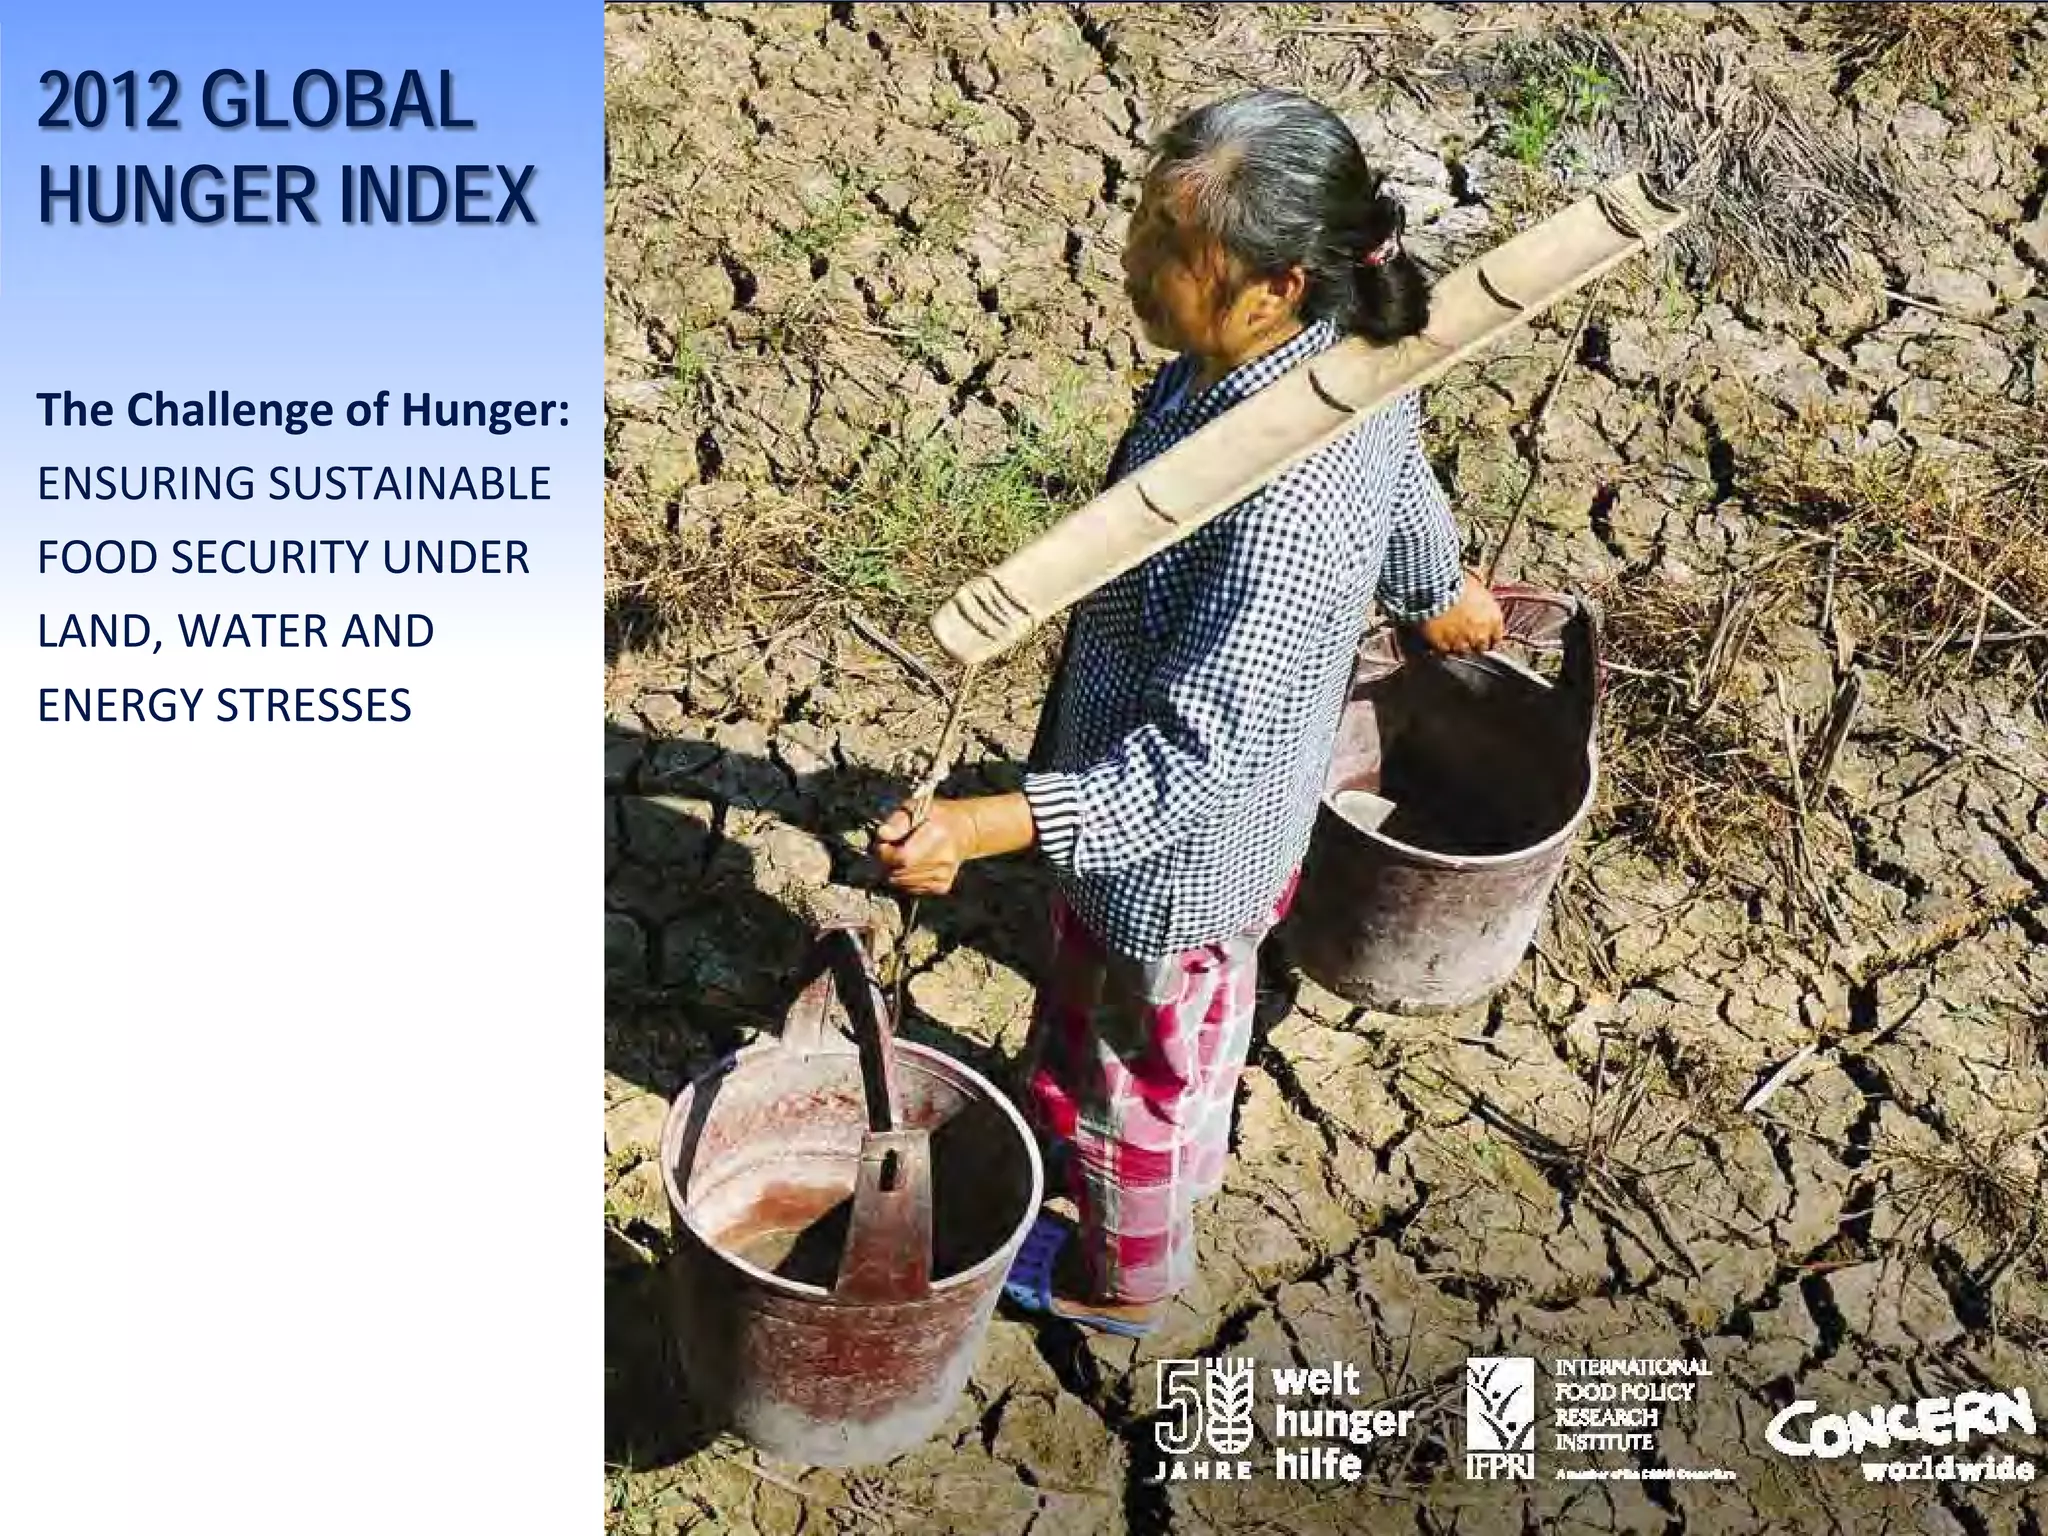
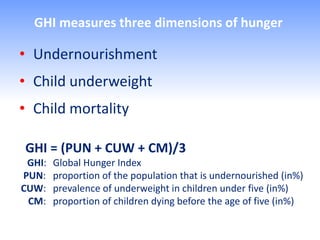
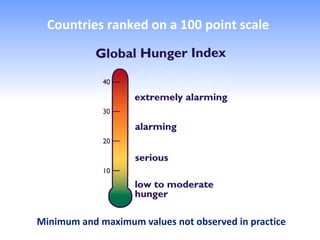
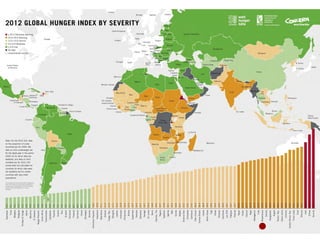
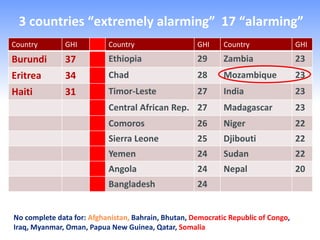
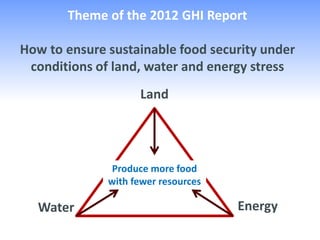
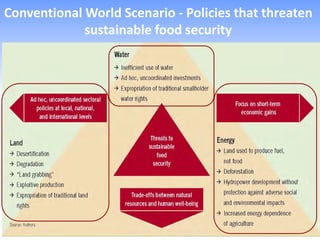
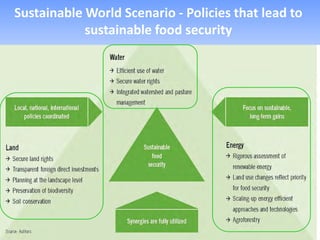
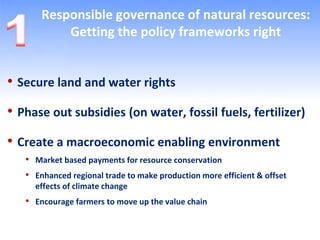
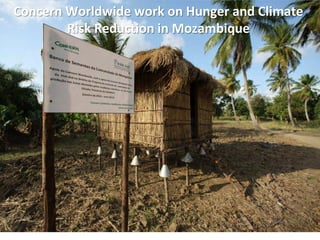
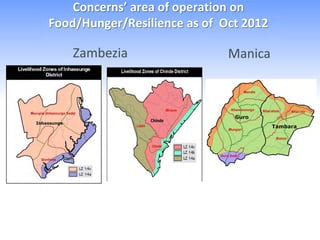
2012 GLOBAL
HUNGER INDEX

The Challenge of Hunger:
ENSURING SUSTAINABLE
FOOD SECURITY UNDER
LAND, WATER AND
ENERGY STRESSES
Concern Worldwide

• Founded in 1968, operational in Mozambique since 1987
• Supports 25 countries, majority in SSA
• Concern CEO Tom Arnold current member of the Lead
    Group of Scaling Up Nutrition Movement
•   Concern CEO member of the UN High Level Hunger Task
    Force and the Irish Hunger Task Force
•   Developed the approach Community Based Management of
    Acute Malnutrition (CMAM)
•   Founder initiator of the Global First 1,000 Days Movement
•   Lead of the First 1,000 Days Movement in Ireland
Global launch of the 2012 Global Hunger Index

• The IFPRI, Concern, Welthungerhilfe collaboration aims to
  reach global policy developers and implementers with the
  recommendations in the GHI, therefore in October 2012,
  launch events of the GHI are being held in;

• Washington, London, Berlin, Paris, Dublin, DeMoines,
  Belfast, Milan, Nairobi, Harare, Freetown, Maputo
Why a Global Hunger Index?

• To raise awareness of regional and country differences
  in hunger

• To show progress over time
• To help learn from successes and failures in hunger
  reduction

• To provide incentives to act and improve the
  international ranking

• To focus on one major hunger-related topic every year
GHI measures three dimensions of hunger

• Undernourishment
• Child underweight
• Child mortality

GHI = (PUN + CUW + CM)/3
 GHI:   Global Hunger Index
PUN:    proportion of the population that is undernourished (in%)
CUW:    prevalence of underweight in children under five (in%)
 CM:    proportion of children dying before the age of five (in%)
Countries ranked on a 100 point scale


Minimum and maximum values not observed in practice
3 countries “extremely alarming” 17 “alarming”
Country        GHI         Country                   GHI     Country                GHI
Burundi        37          Ethiopia                  29      Zambia                 23
Eritrea        34          Chad                      28      Mozambique             23
Haiti          31          Timor-Leste               27      India                  23
                           Central African Rep. 27           Madagascar             23
                           Comoros                   26      Niger                  22
                           Sierra Leone              25      Djibouti               22
                           Yemen                     24      Sudan                  22
                           Angola                    24      Nepal                  20
                           Bangladesh                24


No complete data for: Afghanistan, Bahrain, Bhutan, Democratic Republic of Congo,
Iraq, Myanmar, Oman, Papua New Guinea, Qatar, Somalia
Summary of Key Findings

“Recent events—drought, scrambles to invest in farmland around the
world, shifts in energy prices and shocks in energy supplies—
underline the scarcity of resources we depend on to produce the
world’s food supply.”

“The stark reality is that the world needs to produce more food
with fewer resources, while eliminating wasteful practices and
policies.”

• Hunger on a global scale remains “serious.” 20 countries have
    levels of hunger that are “alarming” or “extremely alarming.”
•   South Asia and Sub-Saharan Africa – highest levels of hunger
•   More than 50 percent of the population is undernourished in
    Burundi, Eritrea, and Haiti.
Summary of Key Findings 2

• The 2012 world GHI fell by 26 percent from the 1990
    world GHI.
•   Largest absolute improvements: Angola, Bangladesh,
    Ethiopia, Malawi, Nicaragua, Niger, and Vietnam.
•   Haiti’s GHI score fell about one quarter from 1990-2001,
    but most of this improvement was reversed in
    subsequent years.
•   Almost all the countries in which the hunger situation
    worsened from the 1990 GHI to the 2012 GHI are in
    Sub-Saharan Africa.
•   Mozambique movement - 23.7 in 2010, 22.7 in 2011,
    23.3 in 2012
Regional performance and progress
Selected trends in Income and GHI
Theme of the 2012 GHI Report

How to ensure sustainable food security under
 conditions of land, water and energy stress
                    Land


              Produce more food
                     Nexus
              with fewer resources

  Water                              Energy
Conventional World Scenario - Policies that threaten
             sustainable food security
Sustainable World Scenario - Policies that lead to
            sustainable food security
Responsible governance of natural resources:
           Getting the policy frameworks right


• Secure land and water rights
• Phase out subsidies (on water, fossil fuels, fertilizer)
• Create a macroeconomic enabling environment
   • Market based payments for resource conservation
   • Enhanced regional trade to make production more efficient & offset
     effects of climate change
   • Encourage farmers to move up the value chain
Scaling up technical approaches:
              Addressing the nexus


• Invest in agricultural production technologies that
 support increased land, water, and energy
 efficiency

• Foster approaches resulting in more efficient land,
 water, and energy use along the value chain

• Prevent resource depletion by monitoring and
 evaluating strategies in water, land, energy, and
 agricultural systems
Addressing the drivers
            of natural resource scarcity:
                 Managing the risks


• Address demographic change, women’s access to
 education and reproductive health

• Raise incomes, lower inequality, and promote
 sustainable life-styles

• Mitigate and adapt to climate change through
 agriculture
Concern Worldwide work on Hunger and Climate
        Risk Reduction in Mozambique
• Will add a v. brief summary with some images
Concerns’ area of operation on
Food/Hunger/Resilience as of Oct 2012

    Zambezia                  Manica
Using asset and vulnerability poverty ranking for
               targeting support


    Wealth ranked income and expenditure - Livelihood Zone 13c
    Inhassunge Interior Agriculture and Fishing Zone (Oct, 2012,
    Food Economy Group/Concern
Food Income Markets, Income Equity and Nutrition


                                                    Vulnerability –Joaquina
                                                   Mauricio’s damaged house,
                                                      Chinde April 2012


Mucuandaia Garden group, Chinde 2012

Supporting women and up to 16,200 farm families–
 produce more volume and variety with increased
access to income and its management and minimise                Internal view - simple
            the impact of natural disasters                     bracing and geometry
On behalf of IFPRI, Concern and
       Welthungerhilfe,
 thank you for your attention.
• GHI is Available in English,
  German, Spanish, French,
  and Italian
• Download from
  www.ifpri.org
  www.welthungerhilfe.de
  www.concern.net
• Embed interactive world
  hunger map
• Wikipedia and Google
  Books
• Available as interactive
  e-book for Kindle, iPad,
  and mobile phone

Moz global hunger-index-2012

  • 1.
    2012 GLOBAL HUNGER INDEX TheChallenge of Hunger: ENSURING SUSTAINABLE FOOD SECURITY UNDER LAND, WATER AND ENERGY STRESSES
  • 2.
    Concern Worldwide • Foundedin 1968, operational in Mozambique since 1987 • Supports 25 countries, majority in SSA • Concern CEO Tom Arnold current member of the Lead Group of Scaling Up Nutrition Movement • Concern CEO member of the UN High Level Hunger Task Force and the Irish Hunger Task Force • Developed the approach Community Based Management of Acute Malnutrition (CMAM) • Founder initiator of the Global First 1,000 Days Movement • Lead of the First 1,000 Days Movement in Ireland
  • 3.
    Global launch ofthe 2012 Global Hunger Index • The IFPRI, Concern, Welthungerhilfe collaboration aims to reach global policy developers and implementers with the recommendations in the GHI, therefore in October 2012, launch events of the GHI are being held in; • Washington, London, Berlin, Paris, Dublin, DeMoines, Belfast, Milan, Nairobi, Harare, Freetown, Maputo
  • 4.
    Why a GlobalHunger Index? • To raise awareness of regional and country differences in hunger • To show progress over time • To help learn from successes and failures in hunger reduction • To provide incentives to act and improve the international ranking • To focus on one major hunger-related topic every year
  • 5.
    GHI measures threedimensions of hunger • Undernourishment • Child underweight • Child mortality GHI = (PUN + CUW + CM)/3 GHI: Global Hunger Index PUN: proportion of the population that is undernourished (in%) CUW: prevalence of underweight in children under five (in%) CM: proportion of children dying before the age of five (in%)
  • 6.
    Countries ranked ona 100 point scale Minimum and maximum values not observed in practice
  • 8.
    3 countries “extremelyalarming” 17 “alarming” Country GHI Country GHI Country GHI Burundi 37 Ethiopia 29 Zambia 23 Eritrea 34 Chad 28 Mozambique 23 Haiti 31 Timor-Leste 27 India 23 Central African Rep. 27 Madagascar 23 Comoros 26 Niger 22 Sierra Leone 25 Djibouti 22 Yemen 24 Sudan 22 Angola 24 Nepal 20 Bangladesh 24 No complete data for: Afghanistan, Bahrain, Bhutan, Democratic Republic of Congo, Iraq, Myanmar, Oman, Papua New Guinea, Qatar, Somalia
  • 9.
    Summary of KeyFindings “Recent events—drought, scrambles to invest in farmland around the world, shifts in energy prices and shocks in energy supplies— underline the scarcity of resources we depend on to produce the world’s food supply.” “The stark reality is that the world needs to produce more food with fewer resources, while eliminating wasteful practices and policies.” • Hunger on a global scale remains “serious.” 20 countries have levels of hunger that are “alarming” or “extremely alarming.” • South Asia and Sub-Saharan Africa – highest levels of hunger • More than 50 percent of the population is undernourished in Burundi, Eritrea, and Haiti.
  • 10.
    Summary of KeyFindings 2 • The 2012 world GHI fell by 26 percent from the 1990 world GHI. • Largest absolute improvements: Angola, Bangladesh, Ethiopia, Malawi, Nicaragua, Niger, and Vietnam. • Haiti’s GHI score fell about one quarter from 1990-2001, but most of this improvement was reversed in subsequent years. • Almost all the countries in which the hunger situation worsened from the 1990 GHI to the 2012 GHI are in Sub-Saharan Africa. • Mozambique movement - 23.7 in 2010, 22.7 in 2011, 23.3 in 2012
  • 11.
  • 12.
    Selected trends inIncome and GHI
  • 13.
    Theme of the2012 GHI Report How to ensure sustainable food security under conditions of land, water and energy stress Land Produce more food Nexus with fewer resources Water Energy
  • 14.
    Conventional World Scenario- Policies that threaten sustainable food security
  • 15.
    Sustainable World Scenario- Policies that lead to sustainable food security
  • 16.
    Responsible governance ofnatural resources: Getting the policy frameworks right • Secure land and water rights • Phase out subsidies (on water, fossil fuels, fertilizer) • Create a macroeconomic enabling environment • Market based payments for resource conservation • Enhanced regional trade to make production more efficient & offset effects of climate change • Encourage farmers to move up the value chain
  • 17.
    Scaling up technicalapproaches: Addressing the nexus • Invest in agricultural production technologies that support increased land, water, and energy efficiency • Foster approaches resulting in more efficient land, water, and energy use along the value chain • Prevent resource depletion by monitoring and evaluating strategies in water, land, energy, and agricultural systems
  • 18.
    Addressing the drivers of natural resource scarcity: Managing the risks • Address demographic change, women’s access to education and reproductive health • Raise incomes, lower inequality, and promote sustainable life-styles • Mitigate and adapt to climate change through agriculture
  • 19.
    Concern Worldwide workon Hunger and Climate Risk Reduction in Mozambique • Will add a v. brief summary with some images
  • 20.
    Concerns’ area ofoperation on Food/Hunger/Resilience as of Oct 2012 Zambezia Manica
  • 21.
    Using asset andvulnerability poverty ranking for targeting support Wealth ranked income and expenditure - Livelihood Zone 13c Inhassunge Interior Agriculture and Fishing Zone (Oct, 2012, Food Economy Group/Concern
  • 22.
    Food Income Markets,Income Equity and Nutrition Vulnerability –Joaquina Mauricio’s damaged house, Chinde April 2012 Mucuandaia Garden group, Chinde 2012 Supporting women and up to 16,200 farm families– produce more volume and variety with increased access to income and its management and minimise Internal view - simple the impact of natural disasters bracing and geometry
  • 23.
    On behalf ofIFPRI, Concern and Welthungerhilfe, thank you for your attention.
  • 24.
    • GHI isAvailable in English, German, Spanish, French, and Italian • Download from www.ifpri.org www.welthungerhilfe.de www.concern.net • Embed interactive world hunger map • Wikipedia and Google Books • Available as interactive e-book for Kindle, iPad, and mobile phone