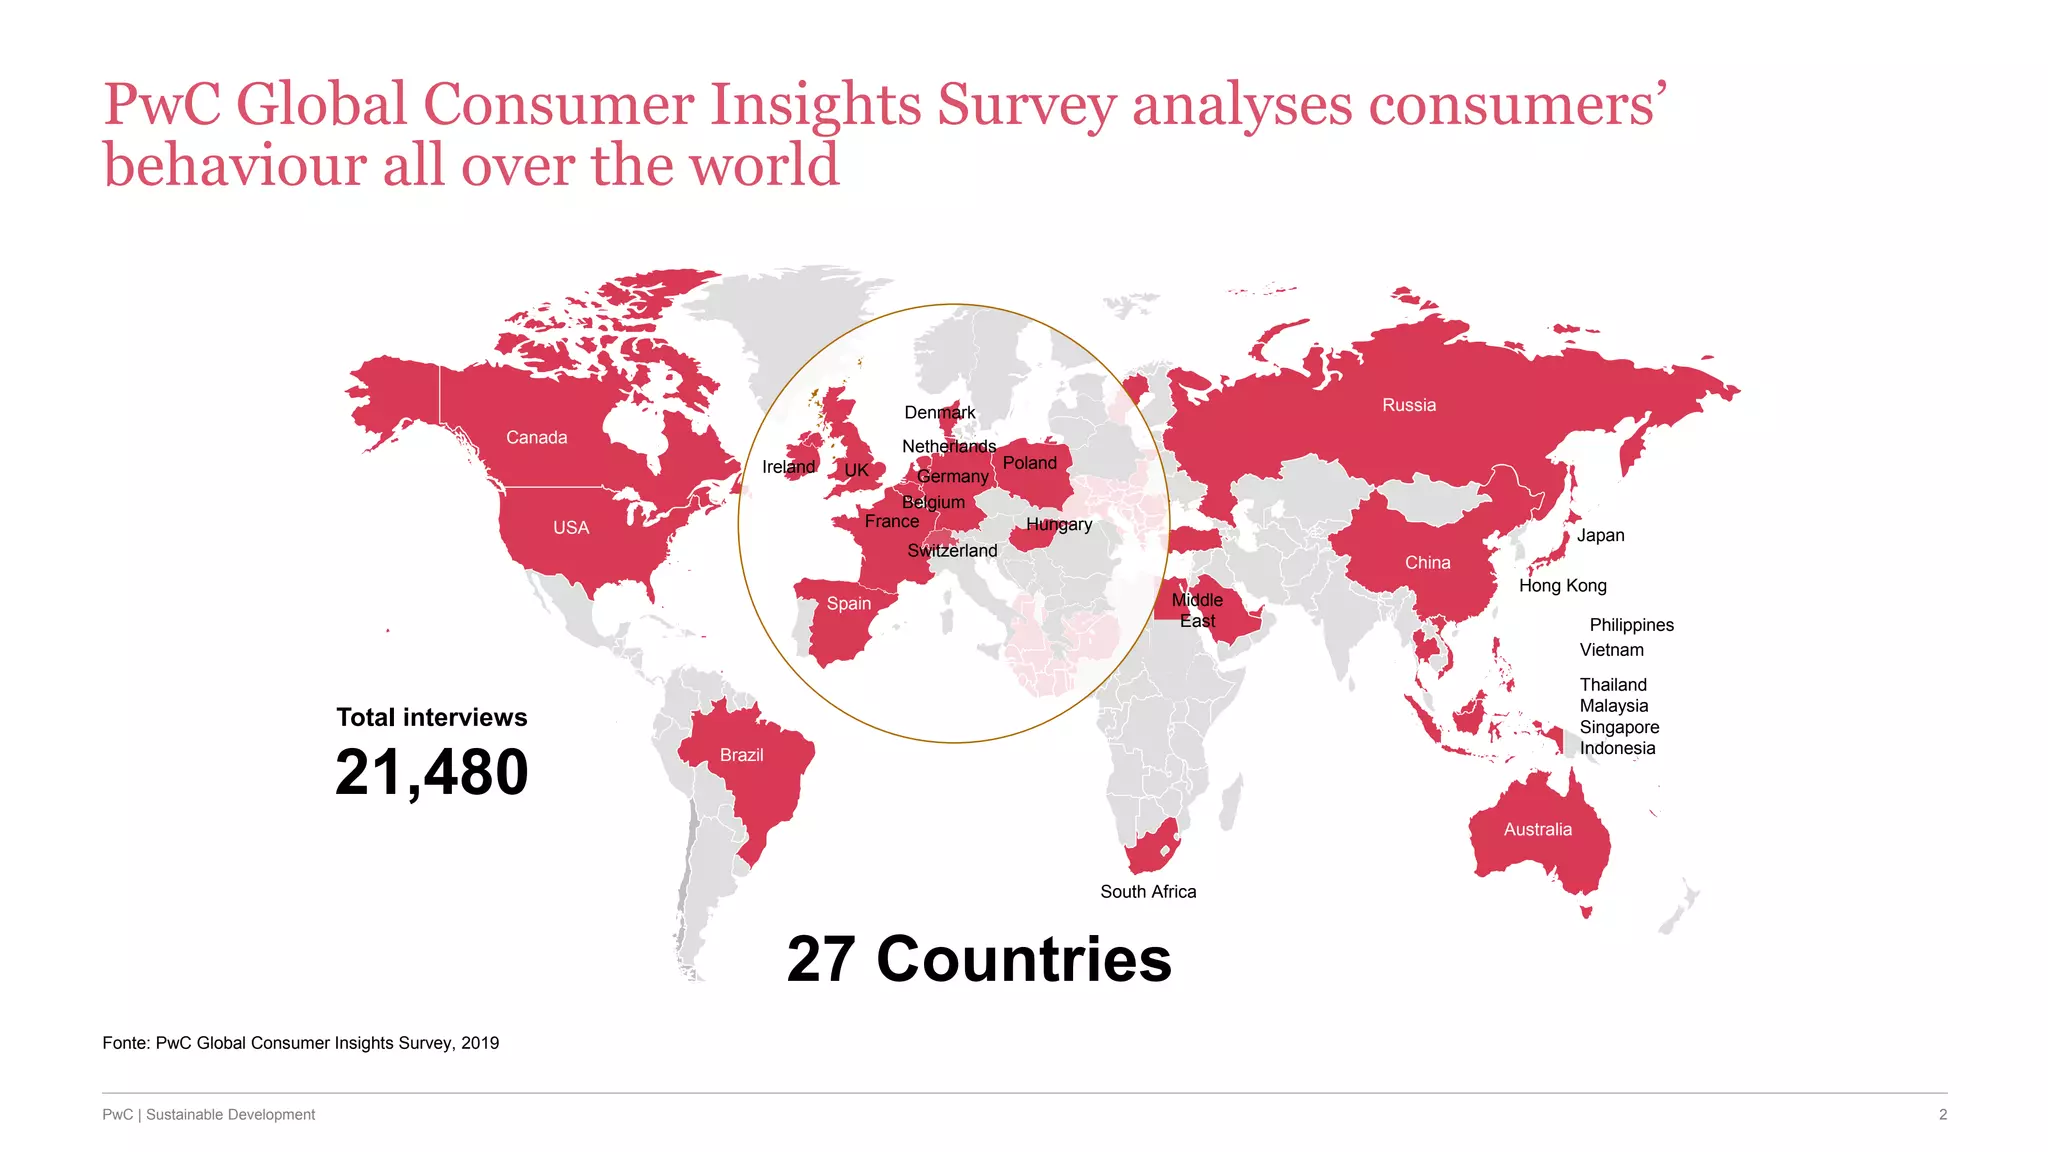
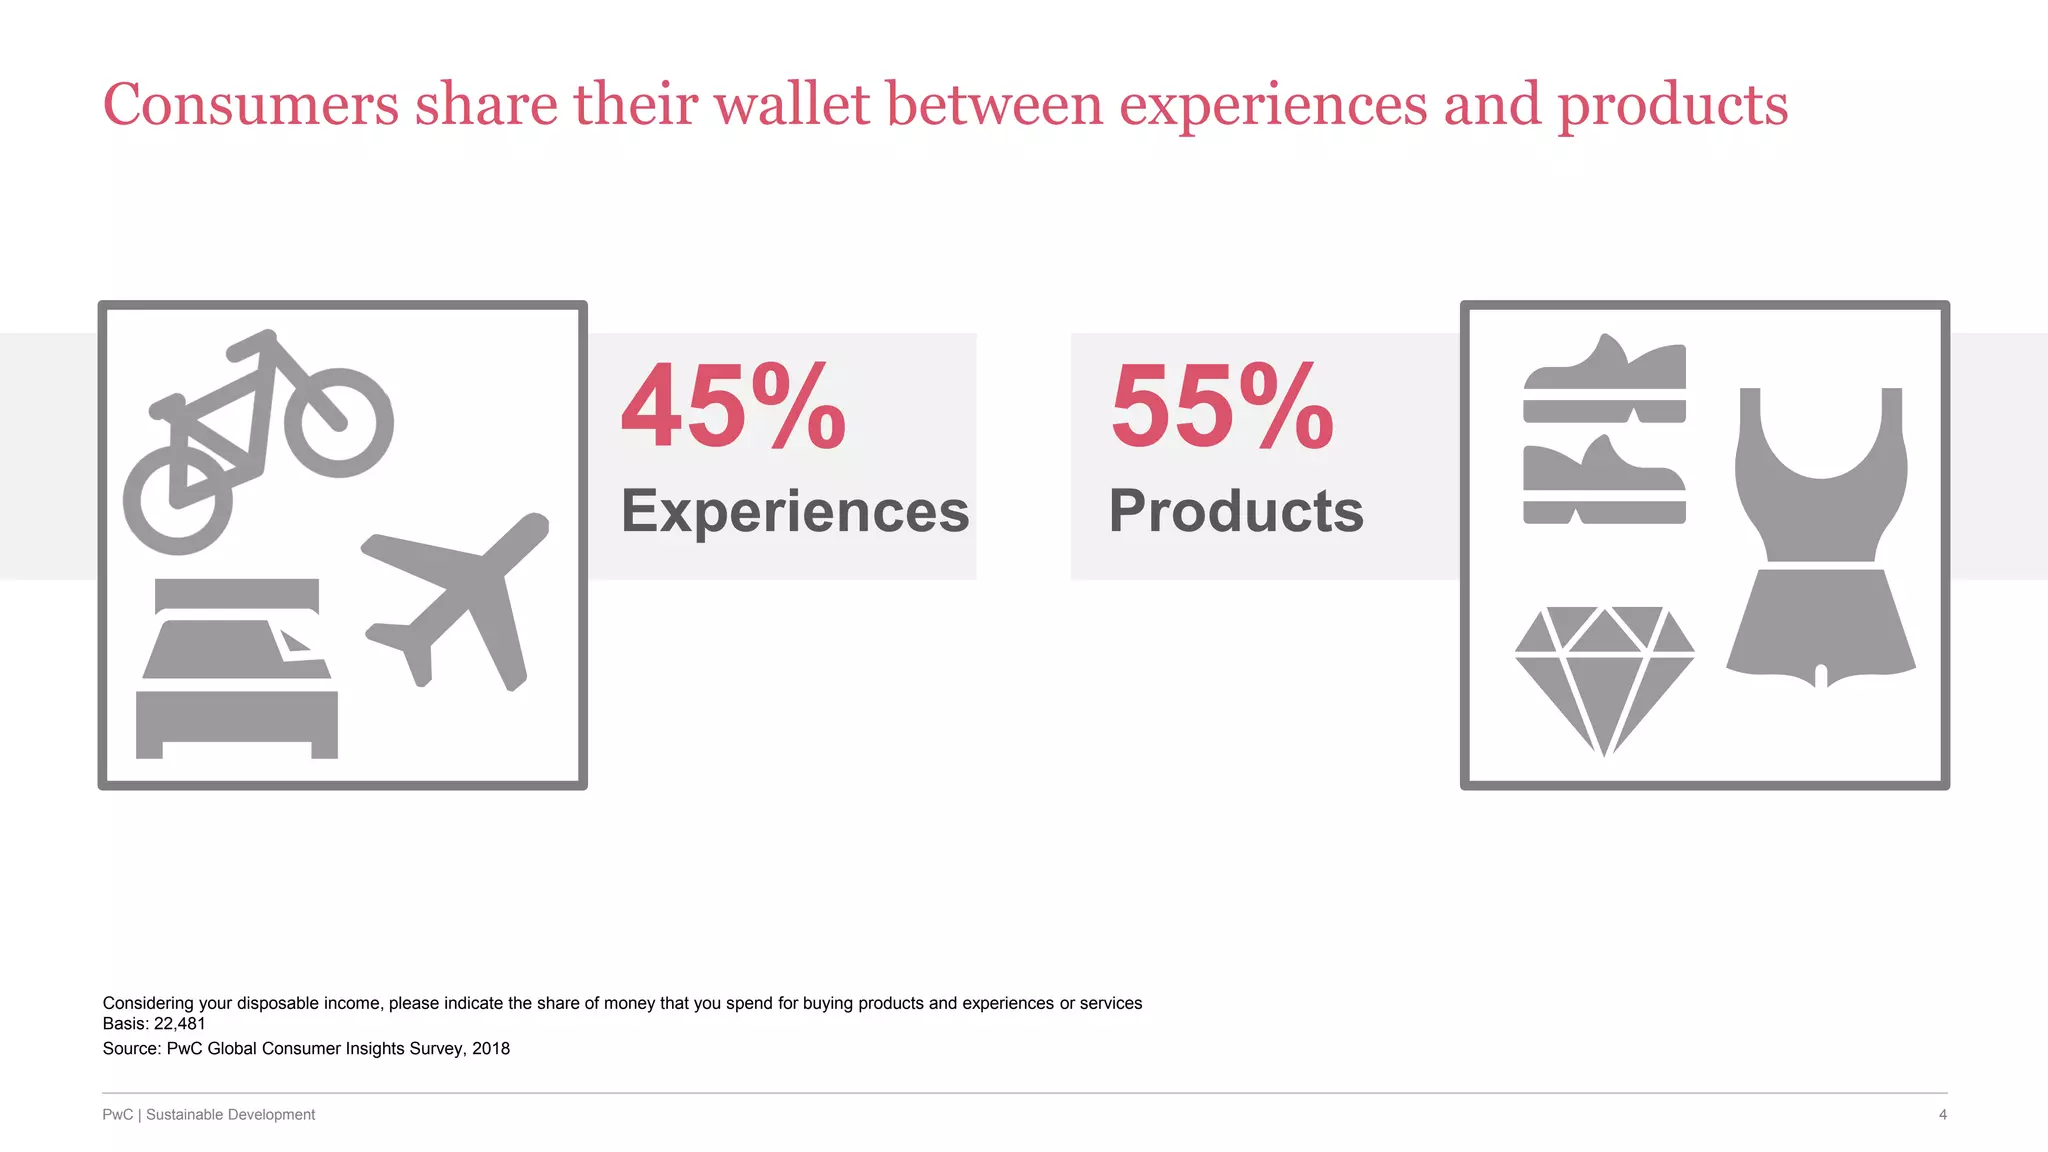
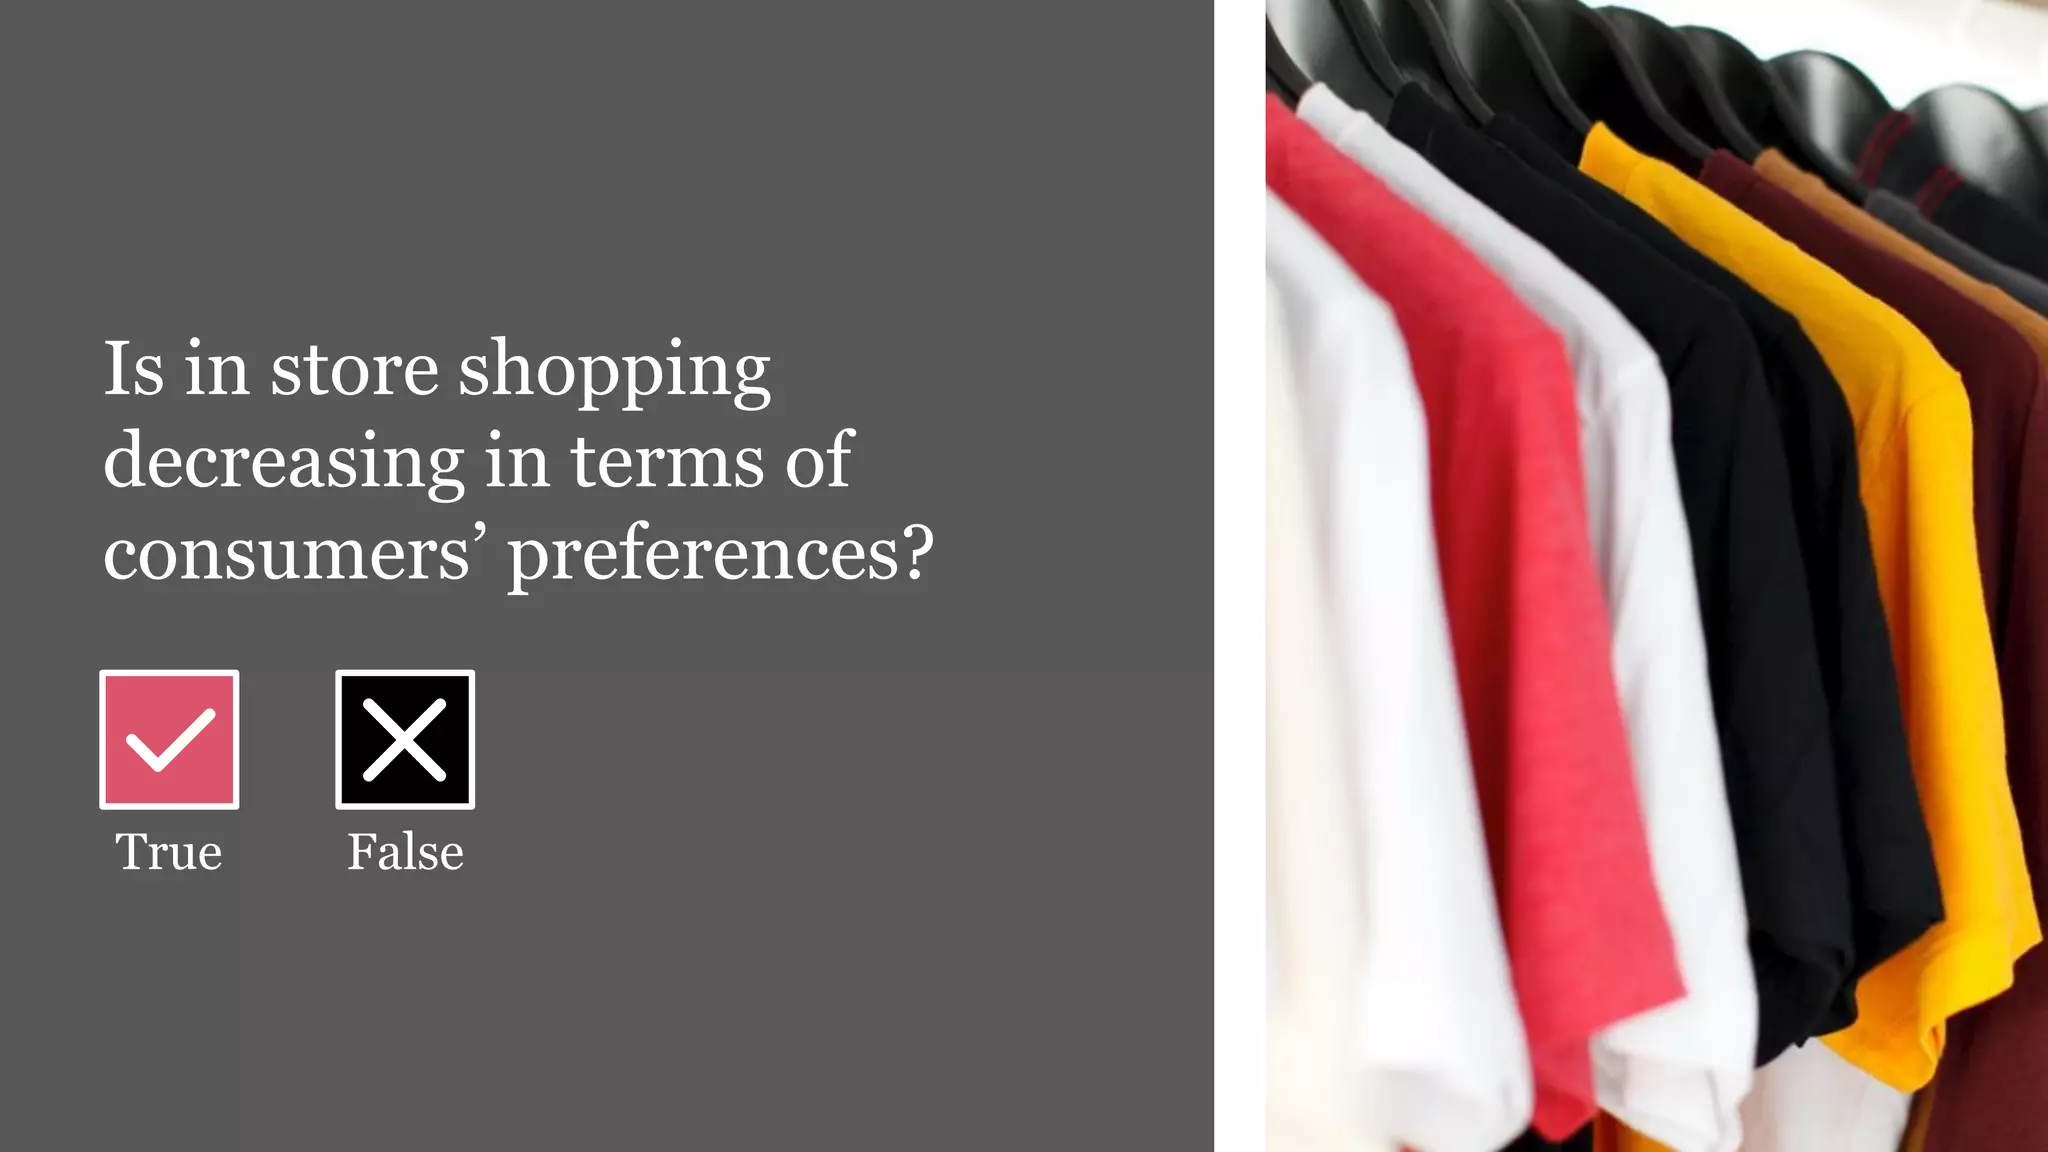
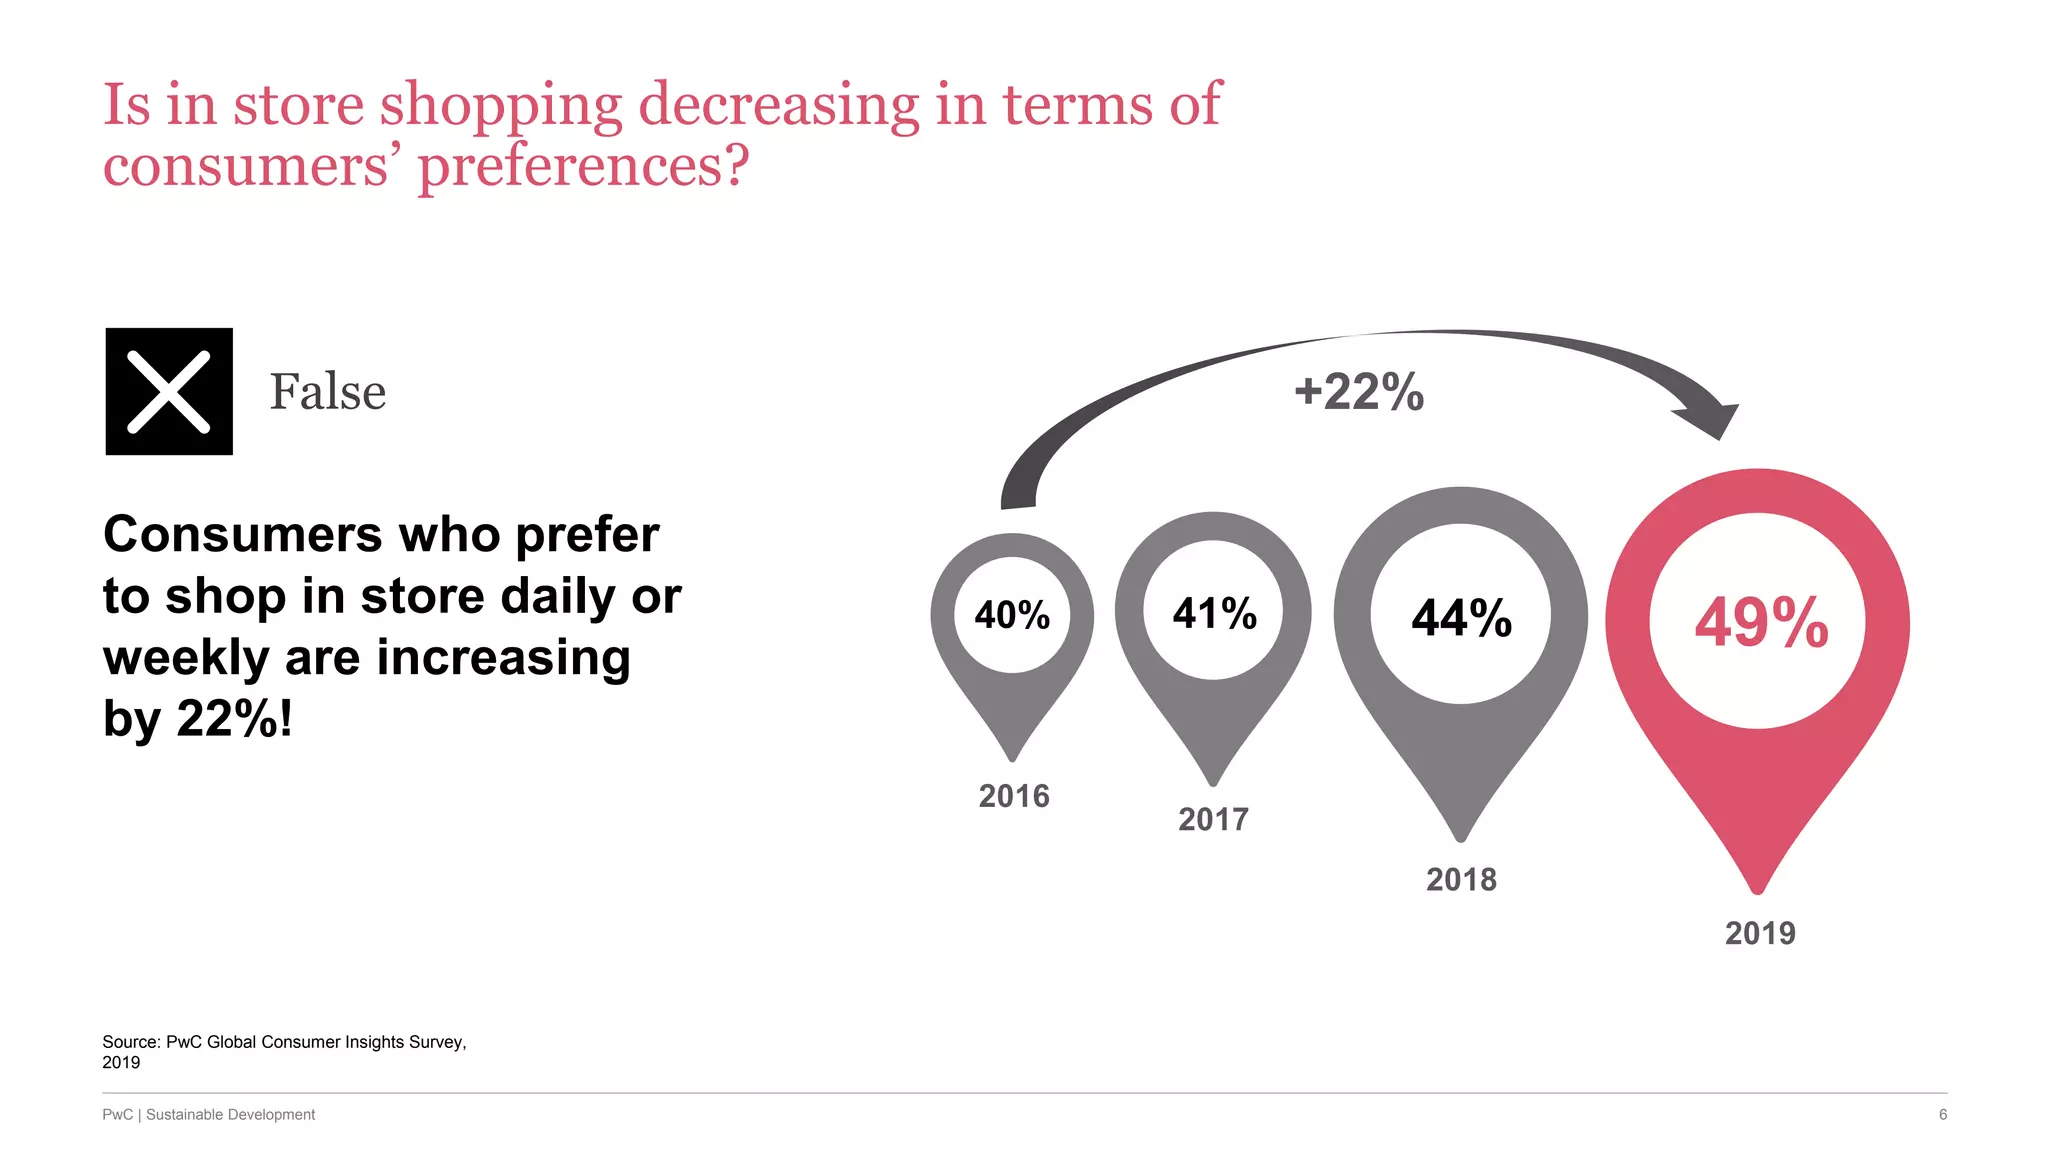
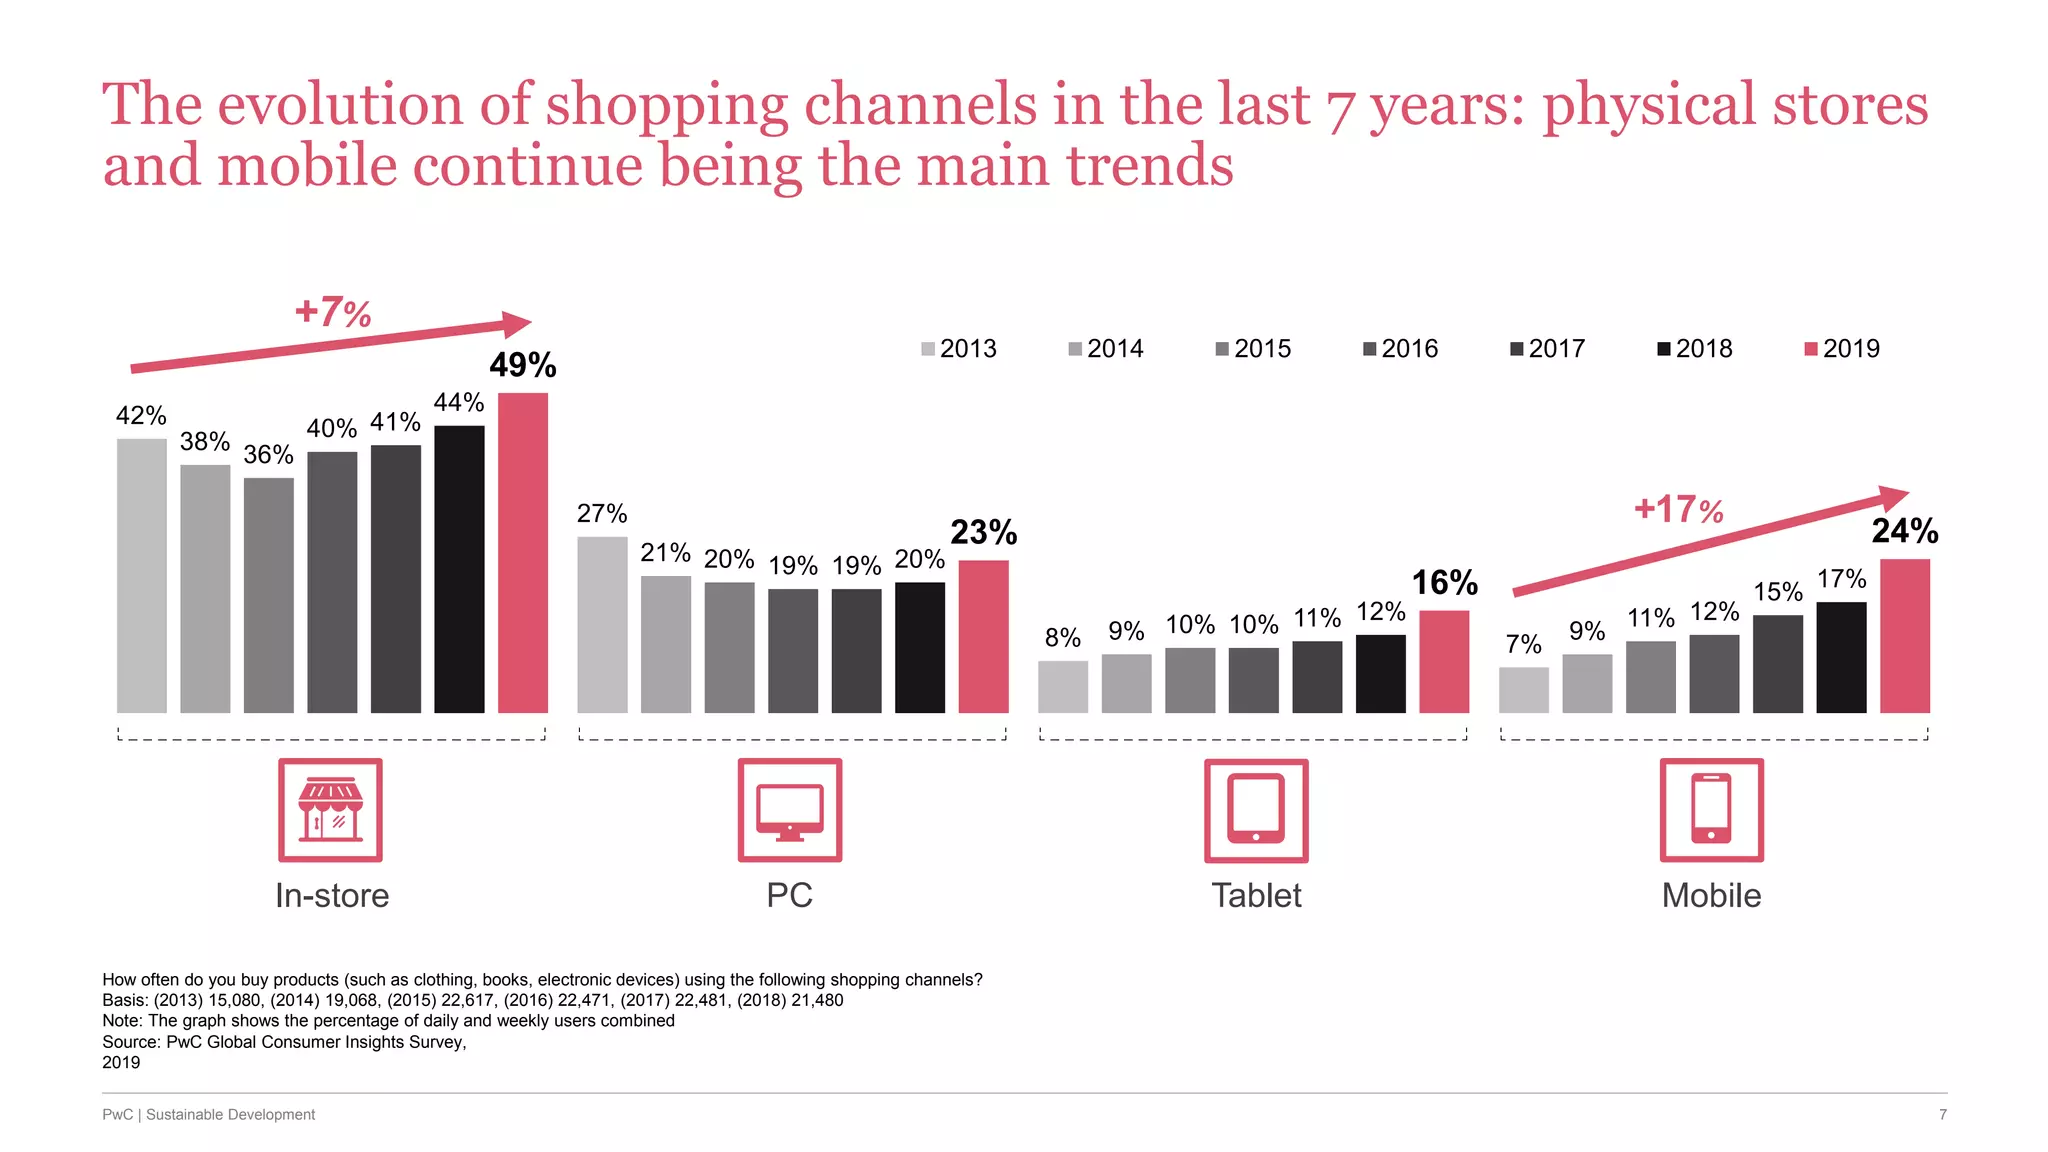
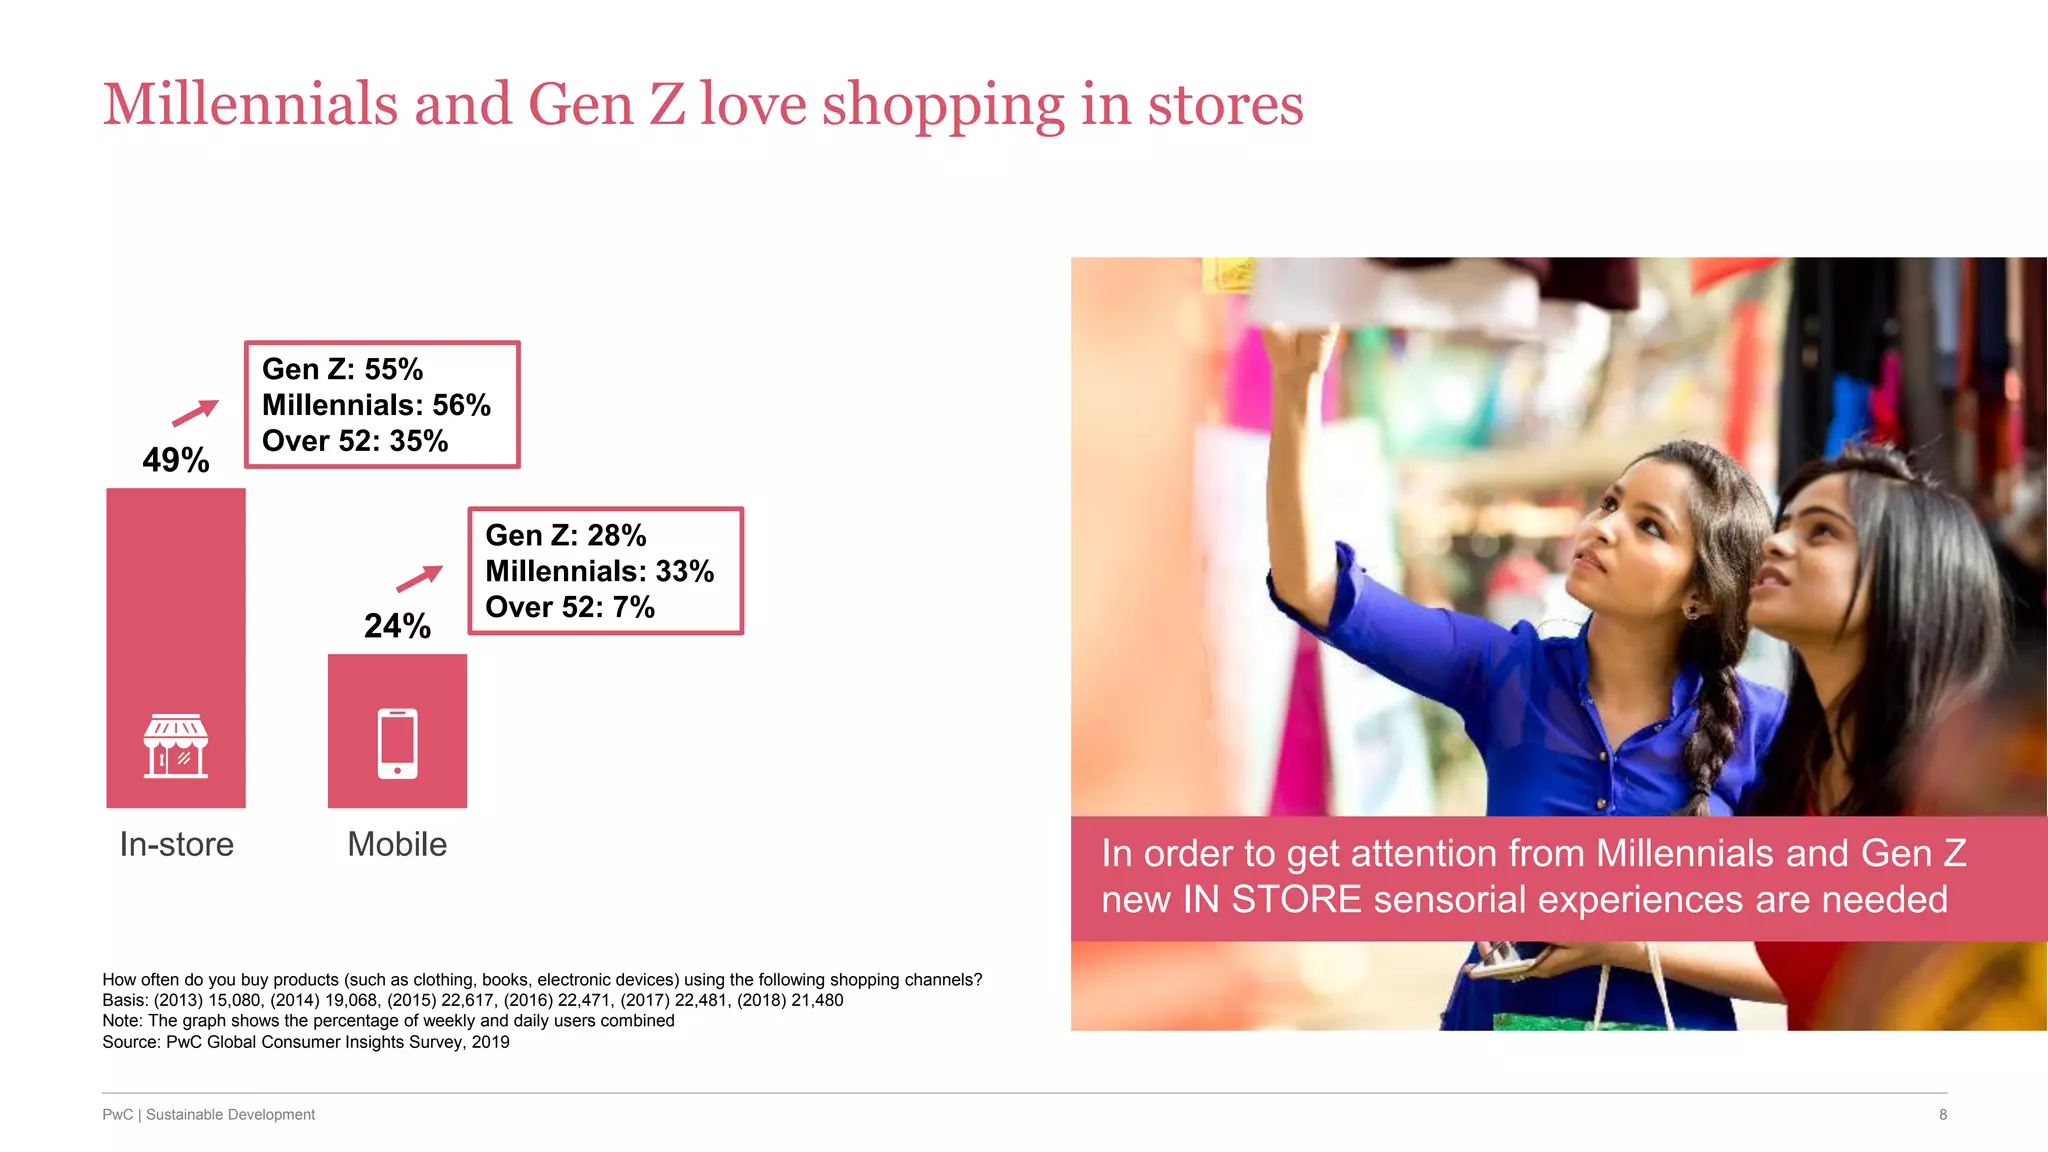
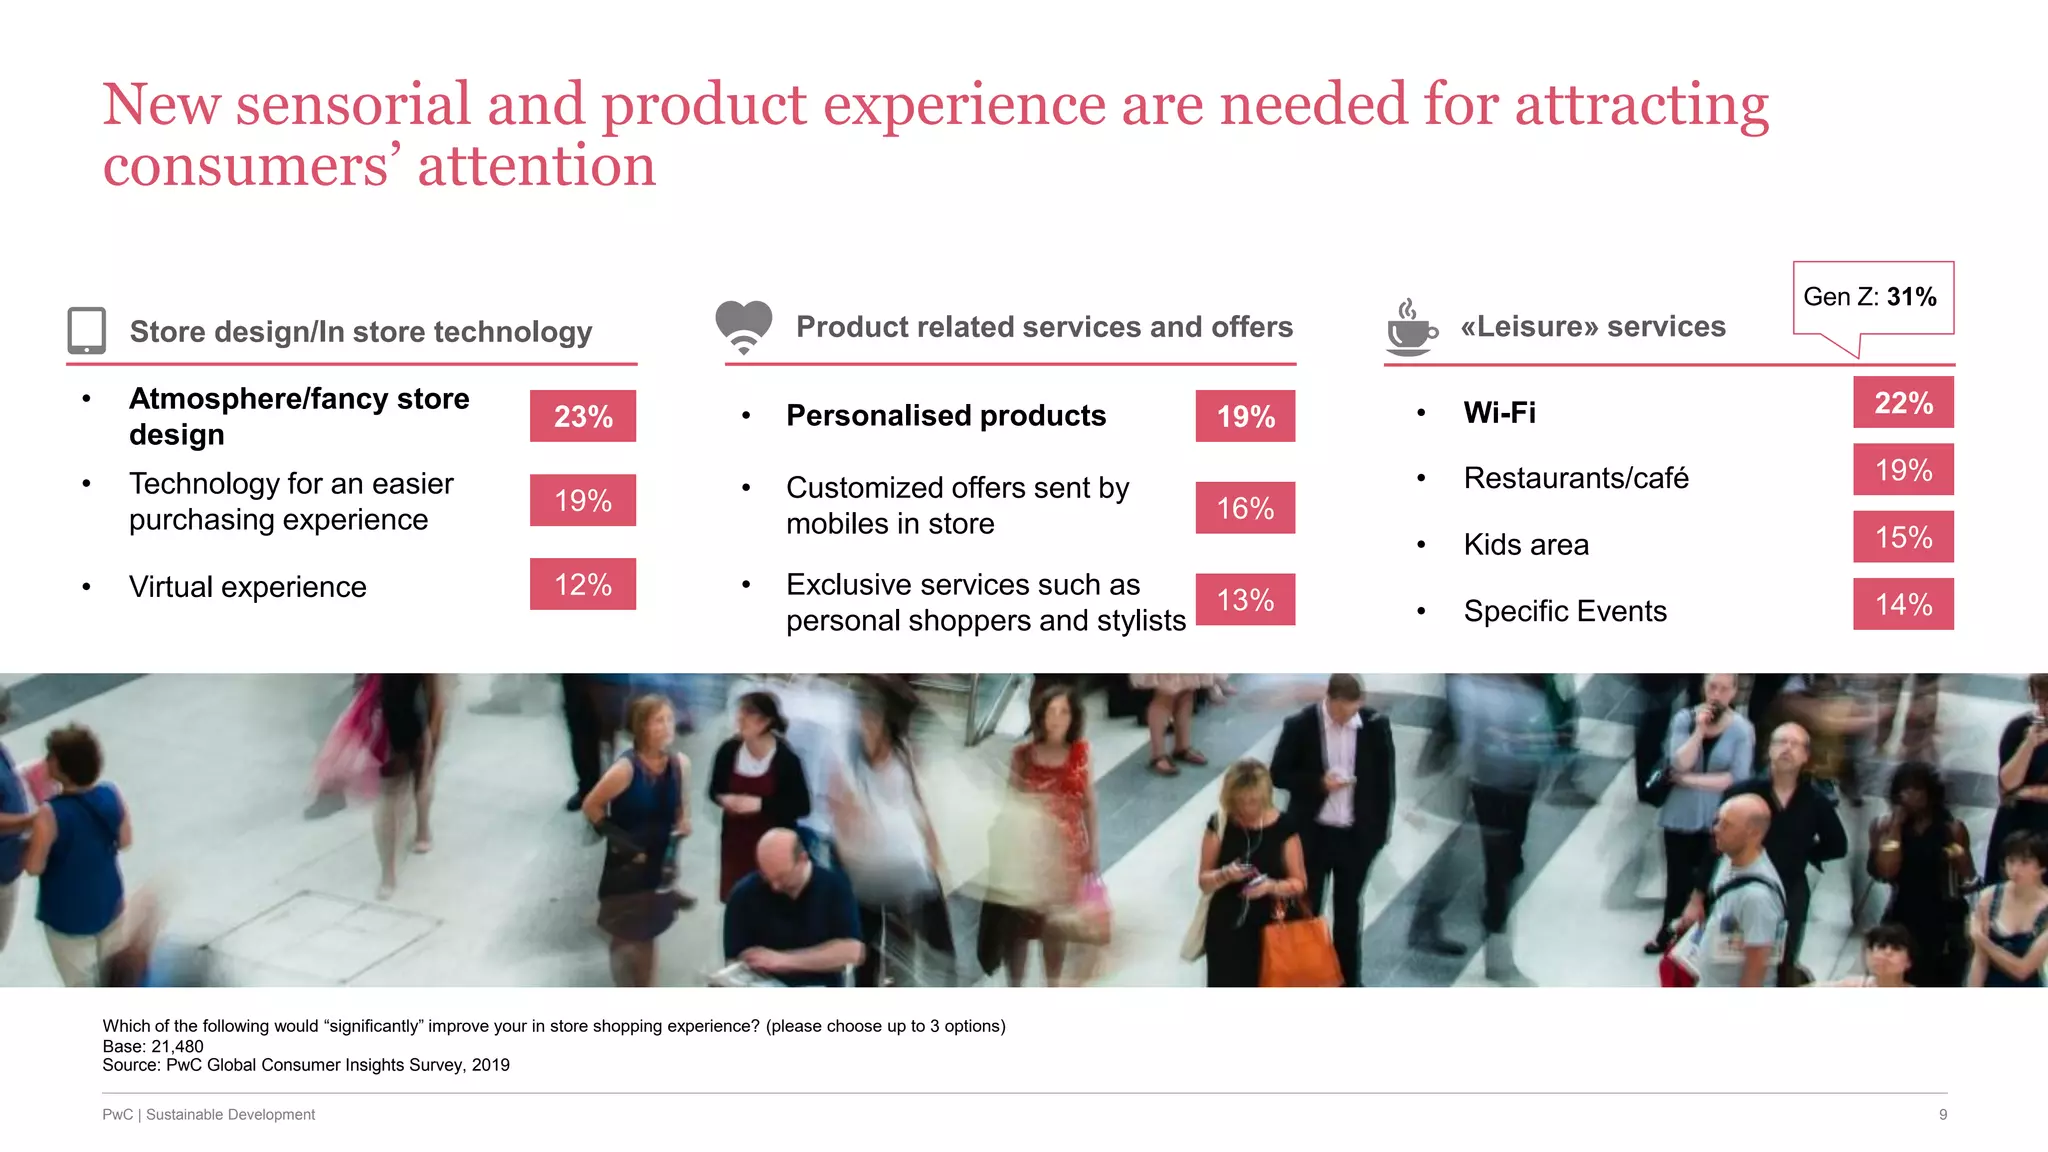
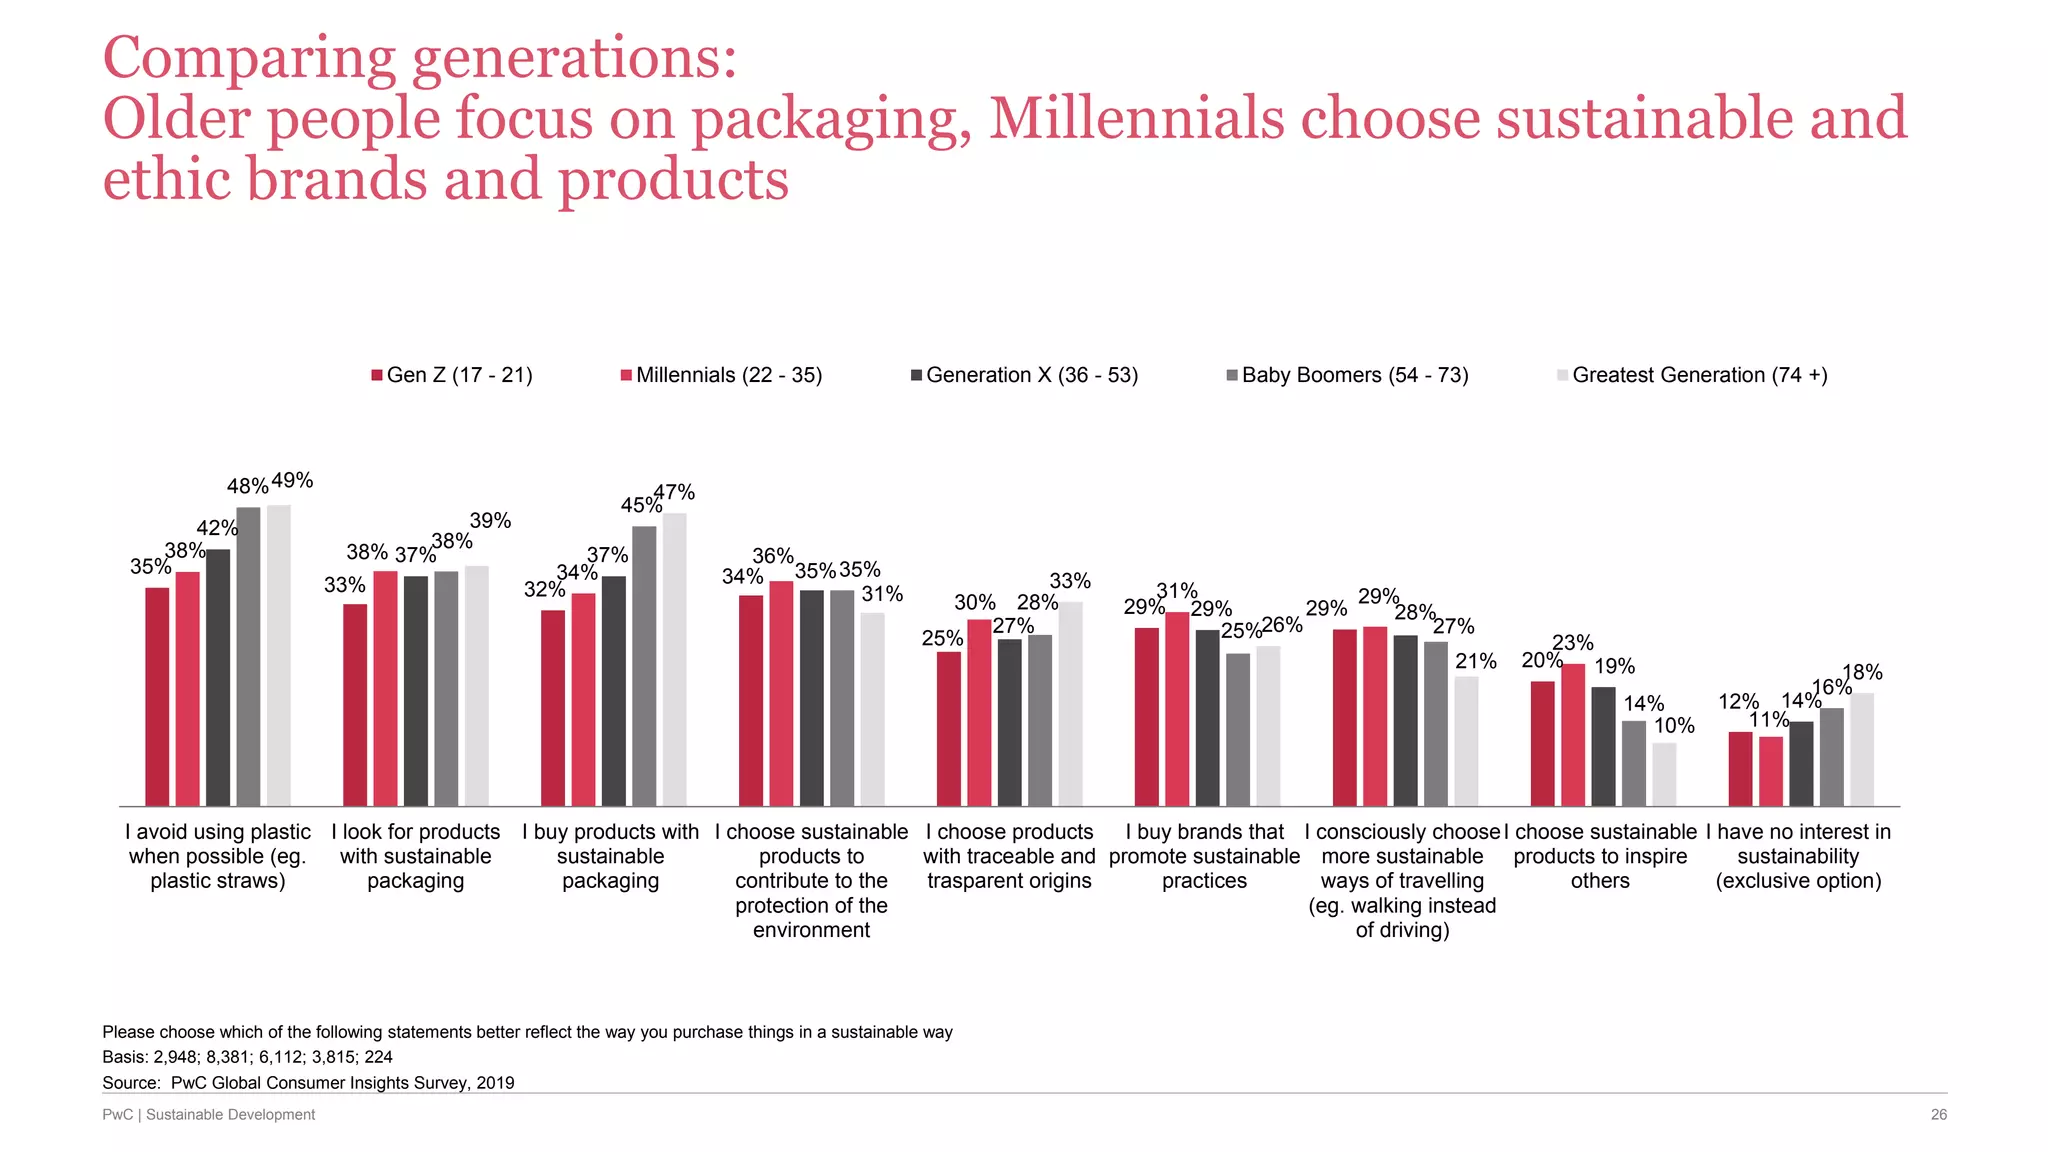
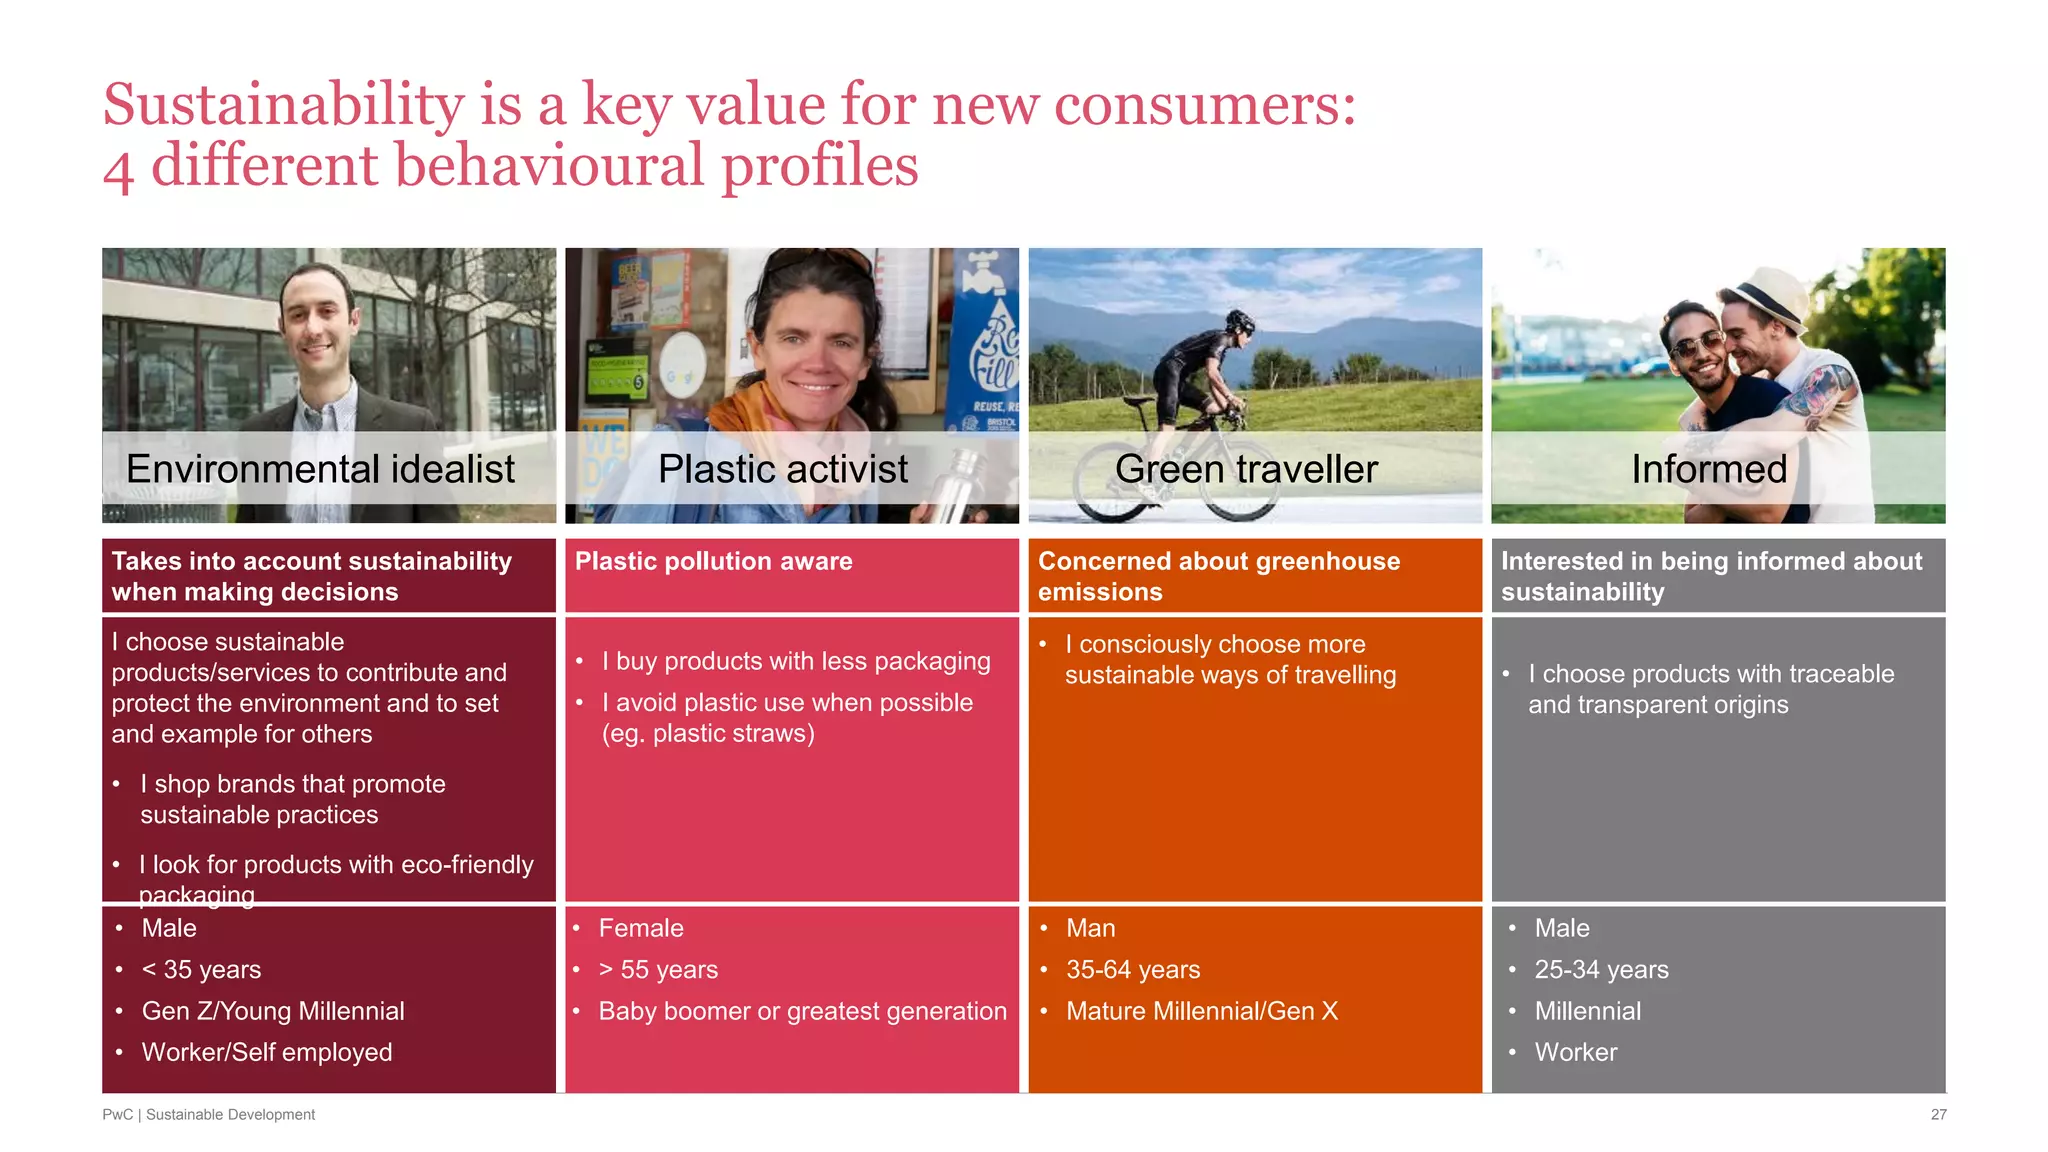
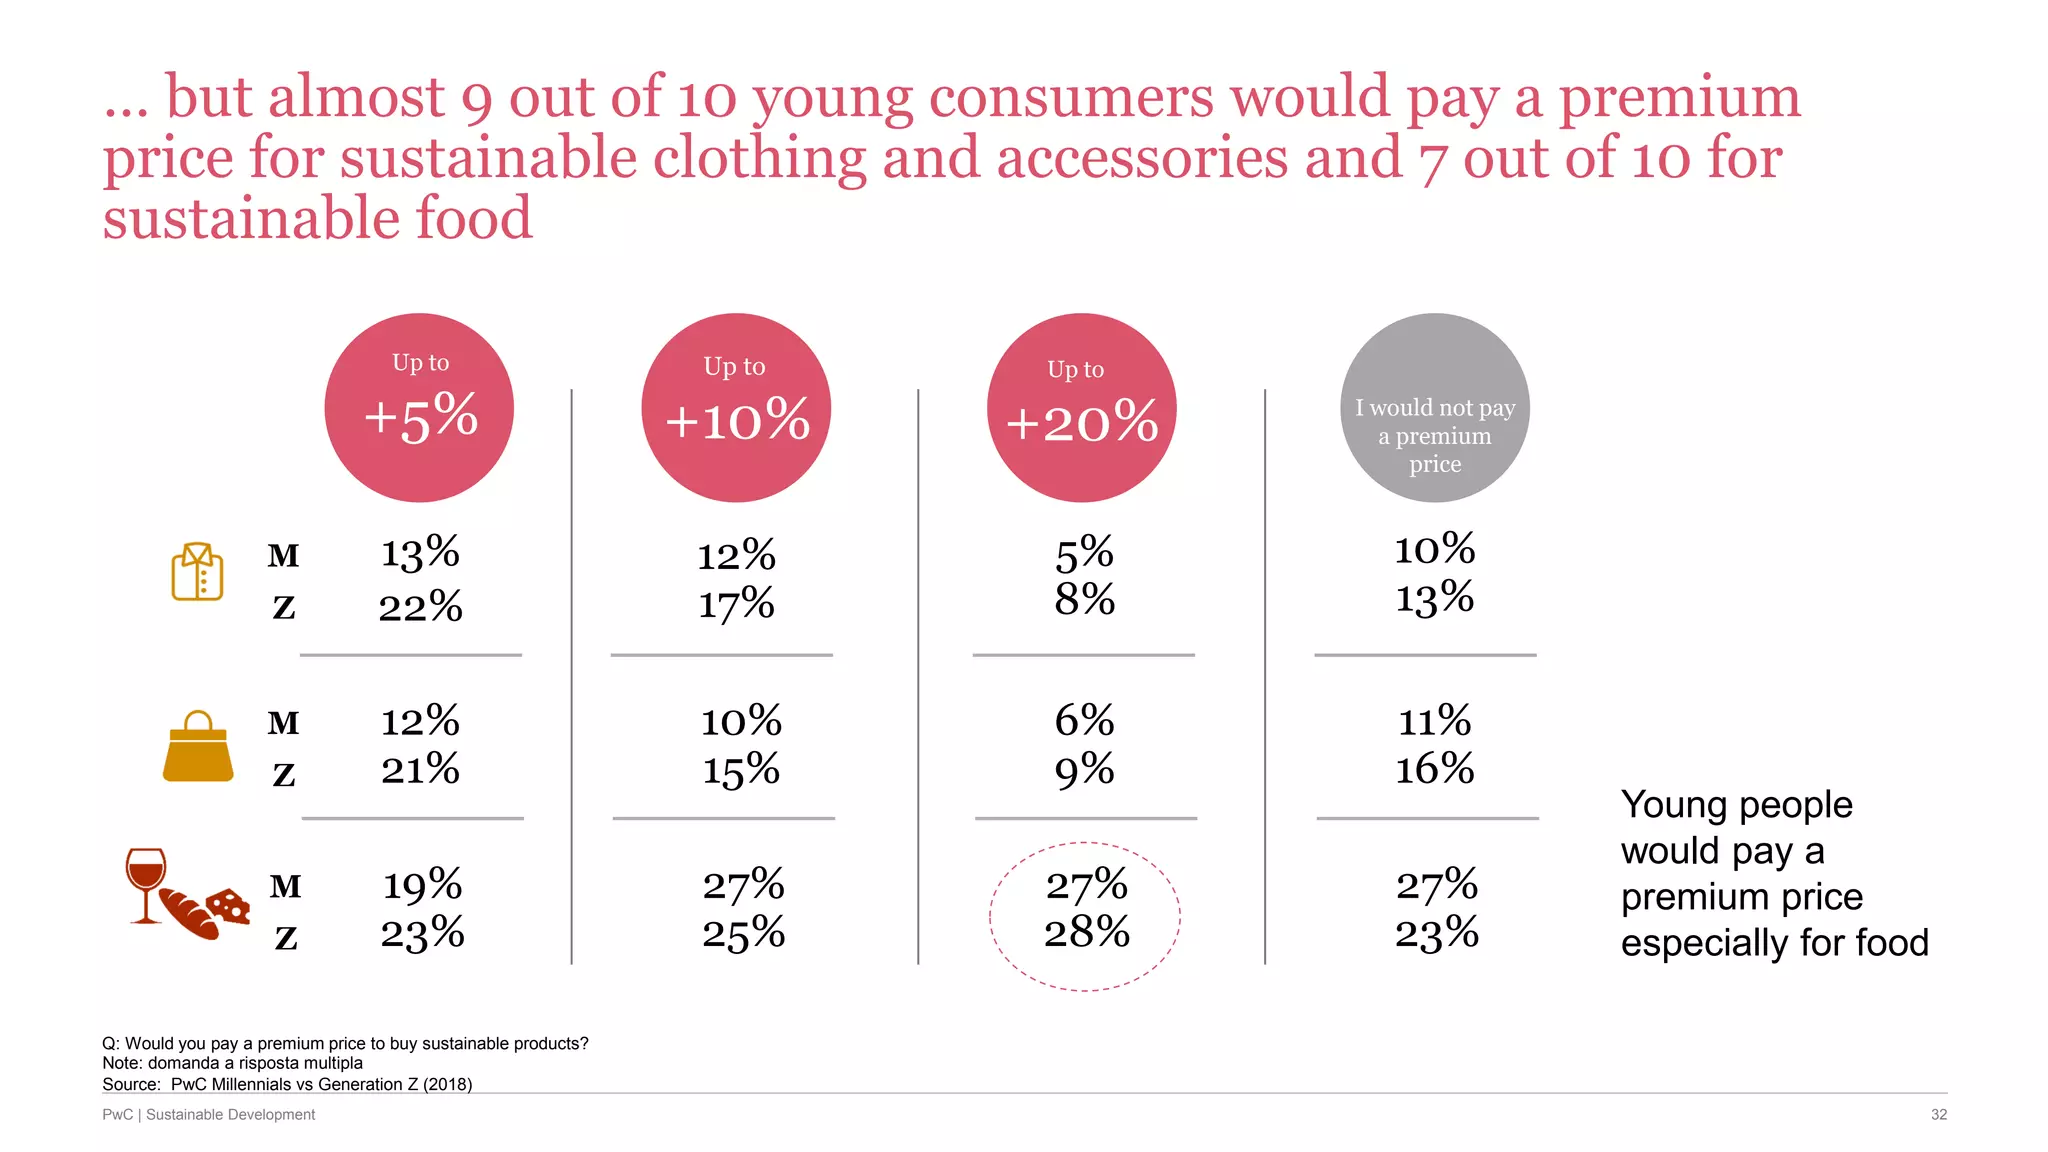
Monitoring the increasing interests of Millennials &
Generation Z for Sustainability
Villa d’Este,
Cernobbio
October, 3rd 2019
2PwC | Sustainable Development
PwC Global Consumer Insights Survey analyses consumers’
behaviour all over the world
USA
Canada
Brazil
Australia
China
Russia
South Africa
Japan
Vietnam
Thailand
Malaysia
Singapore
Indonesia
Middle
East Philippines
Total interviews
21,480
Hong Kong
UK
Belgium
France
Germany
Spain
Denmark
Poland
Hungary
Netherlands
Switzerland
Ireland
27 Countries
Fonte: PwC Global Consumer Insights Survey, 2019
Buying behaviours
Channels
Sharing
Price point
PwC Global Consumer
Insights Survey
4PwC | Sustainable Development
Consumers share their wallet between experiences and products
Source: PwC Global Consumer Insights Survey, 2018
Considering your disposable income, please indicate the share of money that you spend for buying products and experiences or services
Basis: 22,481
45%
Experiences
55%
Products
5PwC | Sustainable Development
Is in store shopping
decreasing in terms of
consumers’ preferences?
True False
6PwC | Sustainable Development
Is in store shopping decreasing in terms of
consumers’ preferences?
Consumers who prefer
to shop in store daily or
weekly are increasing
by 22%!
2017
2018
2019
+22%
2016
Source: PwC Global Consumer Insights Survey,
2019
False
40% 41% 44% 49%
7PwC | Sustainable Development
42%
27%
8% 7%
38%
21%
9% 9%
36%
20%
10% 11%
40%
19%
10%
12%
41%
19%
11%
15%
44%
20%
12%
17%
49%
23%
16%
24%
2013 2014 2015 2016 2017 2018 2019
The evolution of shopping channels in the last 7 years: physical stores
and mobile continue being the main trends
How often do you buy products (such as clothing, books, electronic devices) using the following shopping channels?
Basis: (2013) 15,080, (2014) 19,068, (2015) 22,617, (2016) 22,471, (2017) 22,481, (2018) 21,480
Note: The graph shows the percentage of daily and weekly users combined
In-store PC MobileTablet
Source: PwC Global Consumer Insights Survey,
2019
+17%
+7%
8PwC | Sustainable Development
49%
24%
Millennials and Gen Z love shopping in stores
In-store Mobile
Gen Z: 55%
Millennials: 56%
Over 52: 35%
Gen Z: 28%
Millennials: 33%
Over 52: 7%
How often do you buy products (such as clothing, books, electronic devices) using the following shopping channels?
Basis: (2013) 15,080, (2014) 19,068, (2015) 22,617, (2016) 22,471, (2017) 22,481, (2018) 21,480
Note: The graph shows the percentage of weekly and daily users combined
Source: PwC Global Consumer Insights Survey, 2019
In order to get attention from Millennials and Gen Z
new IN STORE sensorial experiences are needed
9PwC | Sustainable Development
Which of the following would “significantly” improve your in store shopping experience? (please choose up to 3 options)
Base: 21,480
New sensorial and product experience are needed for attracting
consumers’ attention
23%
• Atmosphere/fancy store
design
• Technology for an easier
purchasing experience
• Virtual experience
19%
12%
22%• Wi-Fi
• Restaurants/café
• Kids area
• Specific Events
19%
15%
14%
19%• Personalised products
• Customized offers sent by
mobiles in store
• Exclusive services such as
personal shoppers and stylists
16%
13%
«Leisure» servicesProduct related services and offersStore design/In store technology
Source: PwC Global Consumer Insights Survey, 2019
Gen Z: 31%
10PwC | Sustainable Development
38%
32%
30%
24%
13%
12%
12%
11%
Cars
Other means of transport
Sport facilities
DIY
Design bags
Jewels
Clothing and Footwear
Arredamento
Source: PwC Global Consumer Insights Survey, 2018
Which of the following product categories would you be interested in renting or sharing, rather that owning?
Basis: 22,481
“Sharing” economy is a growing trend, for accessories and clothing too!
11PwC | Sustainable Development
Who are the Premium Shoppers?
11
Typically
 Male
 25-34
 Millennial
 Self-Employed
$$$ Premium shopper
Instant shoppers:
they want it now
It’s all about me
Going green
Convenience
grocery shoppers
‘Connected’
consumers
Frequent
shoppers
Tech savvy
Open to a
changing world
$$$
Premium shopper
Source: PwC Global Consumer Insights Survey, 2019
12PwC | Sustainable Development
What do Low Price Shoppers look for?
12
Typically
 Female
 Mixed job
situation,
predominantly
housekeepers,
students,
unemployed
$$$ Low price shopper
Multi-channel
shoppers
Reluctant to
convert to
mobile wallets
Not so green
Convenience
grocery shoppers
Personal
connections
matter
Less Frequent
shoppers
Delivery costs
deter
Hesitant about
online grocery
$$$
Low price Shopper
Source: PwC Global Consumer Insights Survey, 2019
PwC Global Consumer
Insights Survey
Digital disruption
14PwC | Sustainable Development
14
Does 70% of consumers
buy online at least once a
month?
True False
15PwC | Sustainable Development
Does 70% of consumers buy online at least once
a month?
15
Increasing by 3% vs 2018
More than 76% within Mature
Millennials
True
Weekly
purchases
Monthly
purchases +3% vs 2018
Daily
purchases
6% 27% 39% 72%
Consumers buying
online at least monthly
95%
in CHINA
Source: PwC Global Consumer Insights Survey, 2019
16PwC | Sustainable Development
74%
67%
62%
59%
51%
51%
49%
47%
45%
45%
44%
42%
Clothing/Footwear
Books, Music, Movies
Travels
Beauty
Grocery
Consumer electronics
Toys
Furniture
Sports equipment
Jewelery/Watches
DIY
Household appliances
Clothing & footwear are main product categories purchased online
worldwide
16
Online Consumers
Over the last 12 months,
almost 75% of online
shoppers bought clothing and
footwear
79% Millennials
Fonte: PwC Global Consumer Insights Survey, 2019
Did you purchase online in the last 12 months for the following categories of products? Ha fatto acquisti online negli ultimi 12 mesi per le seguenti categorie di prodotti?
Basis: 21,480
90% Clothing and Footwear
17PwC | Sustainable Development
Digital Disruption: Amazon shoppers in the world are 65% of
consumers and fashion sales on Amazon are worth 35B$
17
Source: PwC Global Consumer Insights Survey, 2019
Amazon shoppers worldwide (or equivalent)
Americas
77%
E-Europe 35%
W-Europe
69%
Africa and Middle
East
57%
Asia Pacific
63%
95%
88%
65%
JD/ Tmall shopper
Amazon shopper
Amazon shopper
18PwC | Sustainable Development
Amazon (or JD/Tmall) keeps growing, especially in China
18
2017
56%
+9%
Amazon Shopper 2018
59%
2019
65%
Fonte: PwC Global Consumer Insights Survey, 2019
Do you purchase on Amazon?
Basis: 20,784
95% JD/Tmall
88% Amazon
19PwC | Sustainable Development
19
19%
26%
27%
29%
42%
42%
45%
Opportunity to book online and get delivery in store
Opportunity to return goods in store
Opportunity to choose a proper delivery
Tracking delivery
Free returns
Knowing the delivery date from date of order
Receiving the product as soon as possible
For more than 1 consumer out of 3 free returns, tracking and
immediate delivery are indispensable services
19
Fonte: PwC Global Consumer Insights Survey, 2019
In terms of delivery of online orders, classify the following characteristics by order of importance (select max 3 answers)
Basis: 21,479
20PwC | Sustainable Development
20
Do social media influence
purchasing behaviour for 1
consumer out of 2?
True False
21PwC | Sustainable Development
Do social media influence shopping behaviour?
21
Fonte: PwC Global Consumer Insights Survey, 2019
54%
of consumers are influenced
by Social Media for Fashion
purchases
Consumers on social media are mainly inspired by
reviews and peers’ opinions
32%
29%
28%
25%
23%
21%
19%
17%
10%
I have been influenced to buy a product or service,
following positive reviews I have read on social…
I browse social media channels to seek inspiration
for purchases
I have purchased products following
offers/promotions shared by others
I only use social media to keep up with my friends &
family
I recommend brands/products to others via social
media (i.e tags/comments/sharing links)
I have made a purchase directly through a
shoppable photo/post
I use social media channels to complain about a
product or service
I have been influenced to buy a product or service,
following an endorsement from an…
I do not use social media
Q25. Thinking about social media channels and how you use them, which of the following activities describes your online behavior?"
Base: 21,479
True
PwC Global Consumer
Insights Survey
Sustainability as a value
23PwC | Sustainable Development
Only 13% declare not to be interested in sustainability
41%
37%
37%
35%
28%
29%
28%
20%
13%
I avoid plastic use whenever possible (eg. plastic
straws and cutlery)
I look for products with sustainable packaging
I buy products with sustainable packaging
I choose sustainable products for contributing to
protecting the environment
I choose products with traceable and trasparent
origins
I buy brands promoting sustainable practices
I consciously choose more sustainable ways of
travelling (eg. walking instead of driving)
I choose sustainable products to inspire others
I have no interest in sustainability (exclusive option)
Please indicate which statement better reflects your way of purchasing in a sustainable way
Basis: 21,480
Packaging
priorities
Environmental
concerns
Living in a
sustainable way
Sustainability means
supporting the
environmental long term
balance by protecting the
environment and its natural
resources
9 consumers out of 10 are “sensitive” to sustainability: the
reduction of plastic consumption and packaging are key priorities
Source: PwC Global Consumer Insights Survey, 2019
24PwC | Sustainable Development
42%
41%
40%
38%
37%
37%
23%
22%
24%
Sustainable products
Ethic products
Retailer/Brands committed to charity
Brands famous for sustainable practices
Eco-friendly products
Organic products
Local products
Sustainable packaging
None of the above
Non-food products
For which of the following characteristics would you pay a premium price?
Basis: 21,480
More than 40% of consumers are willing to pay a premium price for
sustainable or ethic products/brands
Source: PwC Global Consumer Insights Survey, 2019
25PwC | Sustainable Development
Comparing generations:
Older people focus on packaging, Millennials choose sustainable and
ethic brands and products
Over 52: Packaging
Almost 1 out of 2 avoids the consumption of
plastic and choose products with a sustainable
packaging
Under 35: Sustainability
1 out of 3 consciously chooses brands that reflect
ethics and sustainable values
Source: PwC Global Consumer Insights Survey, 2019
26PwC | Sustainable Development
Please choose which of the following statements better reflect the way you purchase things in a sustainable way
Basis: 2,948; 8,381; 6,112; 3,815; 224
35%
33% 32%
34%
25%
29% 29%
20%
12%
38% 38%
34%
36%
30%
31% 29%
23%
11%
42%
37% 37%
35%
27%
29% 28%
19%
14%
48%
38%
45%
35%
28%
25% 27%
14%
16%
49%
39%
47%
31%
33%
26%
21%
10%
18%
I avoid using plastic
when possible (eg.
plastic straws)
I look for products
with sustainable
packaging
I buy products with
sustainable
packaging
I choose sustainable
products to
contribute to the
protection of the
environment
I choose products
with traceable and
trasparent origins
I buy brands that
promote sustainable
practices
I consciously choose
more sustainable
ways of travelling
(eg. walking instead
of driving)
I choose sustainable
products to inspire
others
I have no interest in
sustainability
(exclusive option)
Gen Z (17 - 21) Millennials (22 - 35) Generation X (36 - 53) Baby Boomers (54 - 73) Greatest Generation (74 +)
Comparing generations:
Older people focus on packaging, Millennials choose sustainable and
ethic brands and products
Source: PwC Global Consumer Insights Survey, 2019
27PwC | Sustainable Development
Takes into account sustainability
when making decisions
I choose sustainable
products/services to contribute and
protect the environment and to set
and example for others
• I shop brands that promote
sustainable practices
• I look for products with eco-friendly
packaging
Plastic pollution aware
• I buy products with less packaging
• I avoid plastic use when possible
(eg. plastic straws)
Concerned about greenhouse
emissions
• I consciously choose more
sustainable ways of travelling
Interested in being informed about
sustainability
• I choose products with traceable
and transparent origins
• Male
• < 35 years
• Gen Z/Young Millennial
• Worker/Self employed
• Female
• > 55 years
• Baby boomer or greatest generation
• Man
• 35-64 years
• Mature Millennial/Gen X
• Male
• 25-34 years
• Millennial
• Worker
Sustainability is a key value for new consumers:
4 different behavioural profiles
Environmental idealist Plastic activist Green traveller Informed
28PwC | Sustainable Development
Sustainable consumers favour “sharing”
38%
32%
30%
24%
13%
12%
12%
11%
Cars
Other means of transport
Sport facilities
DIY
Design bags
Jewels
Clothing & Footwear
Furniture
Source: PwC Global Consumer Insights Survey, 2018
Which of the following categories of products would you be interested in renting or sharing, but not necessarily owning? Base: 22,481
29PwC | Sustainable Development
What do young people think of sustainability in Italy?
Survey PwC Millennials vs Generation Z
PwC Millennials vs Generation Z
Interviewed
September 20182.424
61%
39%
Gen Z (1995-2010)
Millennials (1980-1994)
M
Z
30PwC | Sustainable Development
Within food products, 1 out of 2 consumers chooses sustainable brands
consciously
Millennials
Generation Z
Millennial:
48% choose what to buy depending on
values
Generation Z:
They are even more concerned when
making a decision: more than 50% prefer
responsible brands
Food
8%
11%
27%
33%
20%
7%
11%
34%
29%
19%
Completely disagree
Disagree
Neutral
Agree
Completely agree
Source: PwC Millennials vs Generation Z (2018)
Note: domanda a risposta multipla
Q: I choose respectful and socially responsible brands
31PwC | Sustainable Development
Sustainable choices of clothing and accessories brands go down to
15%-16% for Millennials and 16%-22% for Gen Z respectively…
Millennials
5%
13%
20%
16%
6%
4%
6%
15%
11%
4%
Completely disagree
Disagree
Neutral
Agree
Completely agree
Generation Z
Clothing
Source: PwC Millennials vs Generation Z (2018)
Note: multiple choice question
6%
10%
24%
14%
7%
2%
6%
15%
12%
4%
Completely disagree
Disagree
Neutral
Agree
Completely agree
Accessories
Q: I choose environmental and socially responsible brands
32PwC | Sustainable Development
… but almost 9 out of 10 young consumers would pay a premium
price for sustainable clothing and accessories and 7 out of 10 for
sustainable food
Young people
would pay a
premium price
especially for food
Up to
+5%
13%
22%
12%
21%
Up to
+10%
12%
17%
10%
15%
Up to
+20%
5%
8%
6%
9%
I would not pay
a premium
price
10%
13%
11%
16%
M
Z
M
Z
19%
23%
27%
25%
27%
28%
27%
23%
M
Z
Source: PwC Millennials vs Generation Z (2018)
Note: domanda a risposta multipla
Q: Would you pay a premium price to buy sustainable products?
33PwC | Sustainable Development
Consumers experience a communication problem from companies
especially in the fashion and accessories industries
Companies do not
communicate information
about products in a
properly transparent way:
 For more than 40% of
consumers in the fashion
and accessories
industries
 For 30% of consumers in
the food industry
42% 35%23%
44% 32%24%
28% 53%19%
Yes, completelyAbsolutely no
Source: PwC Millennials vs Generation Z (2018)
Q: According to your experience, do companies communicate in a properly transparent way where, who and how a product is produced?
Note: domanda a risposta multipla
34PwC | Sustainable Development
Company’s website and social media are favourite channels for
collecting information about a brand’s sustainability for both
Millennials and Gen Z
6%
10%
14%
14%
15%
16%
19%
20%
28%
4%
5%
9%
11%
8%
9%
11%
12%
16%
Other
Newspapers/Magazines
Family/Friends
In store
Advertising
Other websites
Word of mouth
Social media
Company's website
Millennials
Generation Z
Apparel
Q: Where do you collect information about a company or brand’s approach to environmental sustainability?
Note: multiple choice question
Source: PwC Millennials vs Generation Z (2018)
35PwC | Sustainable Development
Company’s website, family and friends and social media are most
influential about accessories
Millennials
Generation Z
Accessori
6%
10%
12%
13%
14%
15%
16%
17%
20%
4%
7%
6%
7%
8%
10%
10%
10%
11%
Altro
In negozio
Giornali/riviste
Altro sito Web
Pubblicità
Passaparola
Social media
Parenti/amici
Sito Web del rivenditore
Q: Where do you collect information about a company or brand’s approach to environmental sustainability?
Note: multiple choice question
Source: PwC Millennials vs Generation Z (2018)
36PwC | Sustainable Development
What are the most
efficient tools to
communicate
information about
companies’
sustainability?
37PwC | Sustainable Development
Social Media and Labels are the most effective channels for
communicating sustainability of fashion and accessories
Clothing + Accessories
Labels
2°
M Gen Z
15% 27%
Social
Media
1°
M Gen Z
17% 26%
Source: PwC Millennials vs Generation Z (2018)
Note: multiple choice question
3°
M Gen Z
15% 25%
Advertising
campaigns
Thank you
© 2019 PricewaterhouseCoopers Advisory SpA. All rights reserved. PwC refers to PricewaterhouseCoopers Advisory SpA and may sometimes refer to the PwC
network. Each member firm is a separate legal entity. Please see www.pwc.com/structure for further details. This content is for general information purposes only,
and should not be used as a substitute for consultation with professional advisors.
39PwC | Sustainable Development
PwC Global Consumer Insights Survey: comparing generations
Basis: 21,480
14%
39%
28%
18%
1%
‘Mature’ Gen Z
17-22
Millennials
23-36
Generation X
37-51
Baby Boomers
52-71
Greatest Generation
72+
• Young Millennials (23-26)
• Core Millennials (27-31)
• Mature Millennials (32-36)
Source: PwC Global Consumer Insights Survey, 2019

Monitoring the increasing interests of Millenials and Generation Z for sustainability

  • 1.
    Monitoring the increasinginterests of Millennials & Generation Z for Sustainability Villa d’Este, Cernobbio October, 3rd 2019
  • 2.
    2PwC | SustainableDevelopment PwC Global Consumer Insights Survey analyses consumers’ behaviour all over the world USA Canada Brazil Australia China Russia South Africa Japan Vietnam Thailand Malaysia Singapore Indonesia Middle East Philippines Total interviews 21,480 Hong Kong UK Belgium France Germany Spain Denmark Poland Hungary Netherlands Switzerland Ireland 27 Countries Fonte: PwC Global Consumer Insights Survey, 2019
  • 3.
  • 4.
    4PwC | SustainableDevelopment Consumers share their wallet between experiences and products Source: PwC Global Consumer Insights Survey, 2018 Considering your disposable income, please indicate the share of money that you spend for buying products and experiences or services Basis: 22,481 45% Experiences 55% Products
  • 5.
    5PwC | SustainableDevelopment Is in store shopping decreasing in terms of consumers’ preferences? True False
  • 6.
    6PwC | SustainableDevelopment Is in store shopping decreasing in terms of consumers’ preferences? Consumers who prefer to shop in store daily or weekly are increasing by 22%! 2017 2018 2019 +22% 2016 Source: PwC Global Consumer Insights Survey, 2019 False 40% 41% 44% 49%
  • 7.
    7PwC | SustainableDevelopment 42% 27% 8% 7% 38% 21% 9% 9% 36% 20% 10% 11% 40% 19% 10% 12% 41% 19% 11% 15% 44% 20% 12% 17% 49% 23% 16% 24% 2013 2014 2015 2016 2017 2018 2019 The evolution of shopping channels in the last 7 years: physical stores and mobile continue being the main trends How often do you buy products (such as clothing, books, electronic devices) using the following shopping channels? Basis: (2013) 15,080, (2014) 19,068, (2015) 22,617, (2016) 22,471, (2017) 22,481, (2018) 21,480 Note: The graph shows the percentage of daily and weekly users combined In-store PC MobileTablet Source: PwC Global Consumer Insights Survey, 2019 +17% +7%
  • 8.
    8PwC | SustainableDevelopment 49% 24% Millennials and Gen Z love shopping in stores In-store Mobile Gen Z: 55% Millennials: 56% Over 52: 35% Gen Z: 28% Millennials: 33% Over 52: 7% How often do you buy products (such as clothing, books, electronic devices) using the following shopping channels? Basis: (2013) 15,080, (2014) 19,068, (2015) 22,617, (2016) 22,471, (2017) 22,481, (2018) 21,480 Note: The graph shows the percentage of weekly and daily users combined Source: PwC Global Consumer Insights Survey, 2019 In order to get attention from Millennials and Gen Z new IN STORE sensorial experiences are needed
  • 9.
    9PwC | SustainableDevelopment Which of the following would “significantly” improve your in store shopping experience? (please choose up to 3 options) Base: 21,480 New sensorial and product experience are needed for attracting consumers’ attention 23% • Atmosphere/fancy store design • Technology for an easier purchasing experience • Virtual experience 19% 12% 22%• Wi-Fi • Restaurants/café • Kids area • Specific Events 19% 15% 14% 19%• Personalised products • Customized offers sent by mobiles in store • Exclusive services such as personal shoppers and stylists 16% 13% «Leisure» servicesProduct related services and offersStore design/In store technology Source: PwC Global Consumer Insights Survey, 2019 Gen Z: 31%
  • 10.
    10PwC | SustainableDevelopment 38% 32% 30% 24% 13% 12% 12% 11% Cars Other means of transport Sport facilities DIY Design bags Jewels Clothing and Footwear Arredamento Source: PwC Global Consumer Insights Survey, 2018 Which of the following product categories would you be interested in renting or sharing, rather that owning? Basis: 22,481 “Sharing” economy is a growing trend, for accessories and clothing too!
  • 11.
    11PwC | SustainableDevelopment Who are the Premium Shoppers? 11 Typically  Male  25-34  Millennial  Self-Employed $$$ Premium shopper Instant shoppers: they want it now It’s all about me Going green Convenience grocery shoppers ‘Connected’ consumers Frequent shoppers Tech savvy Open to a changing world $$$ Premium shopper Source: PwC Global Consumer Insights Survey, 2019
  • 12.
    12PwC | SustainableDevelopment What do Low Price Shoppers look for? 12 Typically  Female  Mixed job situation, predominantly housekeepers, students, unemployed $$$ Low price shopper Multi-channel shoppers Reluctant to convert to mobile wallets Not so green Convenience grocery shoppers Personal connections matter Less Frequent shoppers Delivery costs deter Hesitant about online grocery $$$ Low price Shopper Source: PwC Global Consumer Insights Survey, 2019
  • 13.
    PwC Global Consumer InsightsSurvey Digital disruption
  • 14.
    14PwC | SustainableDevelopment 14 Does 70% of consumers buy online at least once a month? True False
  • 15.
    15PwC | SustainableDevelopment Does 70% of consumers buy online at least once a month? 15 Increasing by 3% vs 2018 More than 76% within Mature Millennials True Weekly purchases Monthly purchases +3% vs 2018 Daily purchases 6% 27% 39% 72% Consumers buying online at least monthly 95% in CHINA Source: PwC Global Consumer Insights Survey, 2019
  • 16.
    16PwC | SustainableDevelopment 74% 67% 62% 59% 51% 51% 49% 47% 45% 45% 44% 42% Clothing/Footwear Books, Music, Movies Travels Beauty Grocery Consumer electronics Toys Furniture Sports equipment Jewelery/Watches DIY Household appliances Clothing & footwear are main product categories purchased online worldwide 16 Online Consumers Over the last 12 months, almost 75% of online shoppers bought clothing and footwear 79% Millennials Fonte: PwC Global Consumer Insights Survey, 2019 Did you purchase online in the last 12 months for the following categories of products? Ha fatto acquisti online negli ultimi 12 mesi per le seguenti categorie di prodotti? Basis: 21,480 90% Clothing and Footwear
  • 17.
    17PwC | SustainableDevelopment Digital Disruption: Amazon shoppers in the world are 65% of consumers and fashion sales on Amazon are worth 35B$ 17 Source: PwC Global Consumer Insights Survey, 2019 Amazon shoppers worldwide (or equivalent) Americas 77% E-Europe 35% W-Europe 69% Africa and Middle East 57% Asia Pacific 63% 95% 88% 65% JD/ Tmall shopper Amazon shopper Amazon shopper
  • 18.
    18PwC | SustainableDevelopment Amazon (or JD/Tmall) keeps growing, especially in China 18 2017 56% +9% Amazon Shopper 2018 59% 2019 65% Fonte: PwC Global Consumer Insights Survey, 2019 Do you purchase on Amazon? Basis: 20,784 95% JD/Tmall 88% Amazon
  • 19.
    19PwC | SustainableDevelopment 19 19% 26% 27% 29% 42% 42% 45% Opportunity to book online and get delivery in store Opportunity to return goods in store Opportunity to choose a proper delivery Tracking delivery Free returns Knowing the delivery date from date of order Receiving the product as soon as possible For more than 1 consumer out of 3 free returns, tracking and immediate delivery are indispensable services 19 Fonte: PwC Global Consumer Insights Survey, 2019 In terms of delivery of online orders, classify the following characteristics by order of importance (select max 3 answers) Basis: 21,479
  • 20.
    20PwC | SustainableDevelopment 20 Do social media influence purchasing behaviour for 1 consumer out of 2? True False
  • 21.
    21PwC | SustainableDevelopment Do social media influence shopping behaviour? 21 Fonte: PwC Global Consumer Insights Survey, 2019 54% of consumers are influenced by Social Media for Fashion purchases Consumers on social media are mainly inspired by reviews and peers’ opinions 32% 29% 28% 25% 23% 21% 19% 17% 10% I have been influenced to buy a product or service, following positive reviews I have read on social… I browse social media channels to seek inspiration for purchases I have purchased products following offers/promotions shared by others I only use social media to keep up with my friends & family I recommend brands/products to others via social media (i.e tags/comments/sharing links) I have made a purchase directly through a shoppable photo/post I use social media channels to complain about a product or service I have been influenced to buy a product or service, following an endorsement from an… I do not use social media Q25. Thinking about social media channels and how you use them, which of the following activities describes your online behavior?" Base: 21,479 True
  • 22.
    PwC Global Consumer InsightsSurvey Sustainability as a value
  • 23.
    23PwC | SustainableDevelopment Only 13% declare not to be interested in sustainability 41% 37% 37% 35% 28% 29% 28% 20% 13% I avoid plastic use whenever possible (eg. plastic straws and cutlery) I look for products with sustainable packaging I buy products with sustainable packaging I choose sustainable products for contributing to protecting the environment I choose products with traceable and trasparent origins I buy brands promoting sustainable practices I consciously choose more sustainable ways of travelling (eg. walking instead of driving) I choose sustainable products to inspire others I have no interest in sustainability (exclusive option) Please indicate which statement better reflects your way of purchasing in a sustainable way Basis: 21,480 Packaging priorities Environmental concerns Living in a sustainable way Sustainability means supporting the environmental long term balance by protecting the environment and its natural resources 9 consumers out of 10 are “sensitive” to sustainability: the reduction of plastic consumption and packaging are key priorities Source: PwC Global Consumer Insights Survey, 2019
  • 24.
    24PwC | SustainableDevelopment 42% 41% 40% 38% 37% 37% 23% 22% 24% Sustainable products Ethic products Retailer/Brands committed to charity Brands famous for sustainable practices Eco-friendly products Organic products Local products Sustainable packaging None of the above Non-food products For which of the following characteristics would you pay a premium price? Basis: 21,480 More than 40% of consumers are willing to pay a premium price for sustainable or ethic products/brands Source: PwC Global Consumer Insights Survey, 2019
  • 25.
    25PwC | SustainableDevelopment Comparing generations: Older people focus on packaging, Millennials choose sustainable and ethic brands and products Over 52: Packaging Almost 1 out of 2 avoids the consumption of plastic and choose products with a sustainable packaging Under 35: Sustainability 1 out of 3 consciously chooses brands that reflect ethics and sustainable values Source: PwC Global Consumer Insights Survey, 2019
  • 26.
    26PwC | SustainableDevelopment Please choose which of the following statements better reflect the way you purchase things in a sustainable way Basis: 2,948; 8,381; 6,112; 3,815; 224 35% 33% 32% 34% 25% 29% 29% 20% 12% 38% 38% 34% 36% 30% 31% 29% 23% 11% 42% 37% 37% 35% 27% 29% 28% 19% 14% 48% 38% 45% 35% 28% 25% 27% 14% 16% 49% 39% 47% 31% 33% 26% 21% 10% 18% I avoid using plastic when possible (eg. plastic straws) I look for products with sustainable packaging I buy products with sustainable packaging I choose sustainable products to contribute to the protection of the environment I choose products with traceable and trasparent origins I buy brands that promote sustainable practices I consciously choose more sustainable ways of travelling (eg. walking instead of driving) I choose sustainable products to inspire others I have no interest in sustainability (exclusive option) Gen Z (17 - 21) Millennials (22 - 35) Generation X (36 - 53) Baby Boomers (54 - 73) Greatest Generation (74 +) Comparing generations: Older people focus on packaging, Millennials choose sustainable and ethic brands and products Source: PwC Global Consumer Insights Survey, 2019
  • 27.
    27PwC | SustainableDevelopment Takes into account sustainability when making decisions I choose sustainable products/services to contribute and protect the environment and to set and example for others • I shop brands that promote sustainable practices • I look for products with eco-friendly packaging Plastic pollution aware • I buy products with less packaging • I avoid plastic use when possible (eg. plastic straws) Concerned about greenhouse emissions • I consciously choose more sustainable ways of travelling Interested in being informed about sustainability • I choose products with traceable and transparent origins • Male • < 35 years • Gen Z/Young Millennial • Worker/Self employed • Female • > 55 years • Baby boomer or greatest generation • Man • 35-64 years • Mature Millennial/Gen X • Male • 25-34 years • Millennial • Worker Sustainability is a key value for new consumers: 4 different behavioural profiles Environmental idealist Plastic activist Green traveller Informed
  • 28.
    28PwC | SustainableDevelopment Sustainable consumers favour “sharing” 38% 32% 30% 24% 13% 12% 12% 11% Cars Other means of transport Sport facilities DIY Design bags Jewels Clothing & Footwear Furniture Source: PwC Global Consumer Insights Survey, 2018 Which of the following categories of products would you be interested in renting or sharing, but not necessarily owning? Base: 22,481
  • 29.
    29PwC | SustainableDevelopment What do young people think of sustainability in Italy? Survey PwC Millennials vs Generation Z PwC Millennials vs Generation Z Interviewed September 20182.424 61% 39% Gen Z (1995-2010) Millennials (1980-1994) M Z
  • 30.
    30PwC | SustainableDevelopment Within food products, 1 out of 2 consumers chooses sustainable brands consciously Millennials Generation Z Millennial: 48% choose what to buy depending on values Generation Z: They are even more concerned when making a decision: more than 50% prefer responsible brands Food 8% 11% 27% 33% 20% 7% 11% 34% 29% 19% Completely disagree Disagree Neutral Agree Completely agree Source: PwC Millennials vs Generation Z (2018) Note: domanda a risposta multipla Q: I choose respectful and socially responsible brands
  • 31.
    31PwC | SustainableDevelopment Sustainable choices of clothing and accessories brands go down to 15%-16% for Millennials and 16%-22% for Gen Z respectively… Millennials 5% 13% 20% 16% 6% 4% 6% 15% 11% 4% Completely disagree Disagree Neutral Agree Completely agree Generation Z Clothing Source: PwC Millennials vs Generation Z (2018) Note: multiple choice question 6% 10% 24% 14% 7% 2% 6% 15% 12% 4% Completely disagree Disagree Neutral Agree Completely agree Accessories Q: I choose environmental and socially responsible brands
  • 32.
    32PwC | SustainableDevelopment … but almost 9 out of 10 young consumers would pay a premium price for sustainable clothing and accessories and 7 out of 10 for sustainable food Young people would pay a premium price especially for food Up to +5% 13% 22% 12% 21% Up to +10% 12% 17% 10% 15% Up to +20% 5% 8% 6% 9% I would not pay a premium price 10% 13% 11% 16% M Z M Z 19% 23% 27% 25% 27% 28% 27% 23% M Z Source: PwC Millennials vs Generation Z (2018) Note: domanda a risposta multipla Q: Would you pay a premium price to buy sustainable products?
  • 33.
    33PwC | SustainableDevelopment Consumers experience a communication problem from companies especially in the fashion and accessories industries Companies do not communicate information about products in a properly transparent way:  For more than 40% of consumers in the fashion and accessories industries  For 30% of consumers in the food industry 42% 35%23% 44% 32%24% 28% 53%19% Yes, completelyAbsolutely no Source: PwC Millennials vs Generation Z (2018) Q: According to your experience, do companies communicate in a properly transparent way where, who and how a product is produced? Note: domanda a risposta multipla
  • 34.
    34PwC | SustainableDevelopment Company’s website and social media are favourite channels for collecting information about a brand’s sustainability for both Millennials and Gen Z 6% 10% 14% 14% 15% 16% 19% 20% 28% 4% 5% 9% 11% 8% 9% 11% 12% 16% Other Newspapers/Magazines Family/Friends In store Advertising Other websites Word of mouth Social media Company's website Millennials Generation Z Apparel Q: Where do you collect information about a company or brand’s approach to environmental sustainability? Note: multiple choice question Source: PwC Millennials vs Generation Z (2018)
  • 35.
    35PwC | SustainableDevelopment Company’s website, family and friends and social media are most influential about accessories Millennials Generation Z Accessori 6% 10% 12% 13% 14% 15% 16% 17% 20% 4% 7% 6% 7% 8% 10% 10% 10% 11% Altro In negozio Giornali/riviste Altro sito Web Pubblicità Passaparola Social media Parenti/amici Sito Web del rivenditore Q: Where do you collect information about a company or brand’s approach to environmental sustainability? Note: multiple choice question Source: PwC Millennials vs Generation Z (2018)
  • 36.
    36PwC | SustainableDevelopment What are the most efficient tools to communicate information about companies’ sustainability?
  • 37.
    37PwC | SustainableDevelopment Social Media and Labels are the most effective channels for communicating sustainability of fashion and accessories Clothing + Accessories Labels 2° M Gen Z 15% 27% Social Media 1° M Gen Z 17% 26% Source: PwC Millennials vs Generation Z (2018) Note: multiple choice question 3° M Gen Z 15% 25% Advertising campaigns
  • 38.
    Thank you © 2019PricewaterhouseCoopers Advisory SpA. All rights reserved. PwC refers to PricewaterhouseCoopers Advisory SpA and may sometimes refer to the PwC network. Each member firm is a separate legal entity. Please see www.pwc.com/structure for further details. This content is for general information purposes only, and should not be used as a substitute for consultation with professional advisors.
  • 39.
    39PwC | SustainableDevelopment PwC Global Consumer Insights Survey: comparing generations Basis: 21,480 14% 39% 28% 18% 1% ‘Mature’ Gen Z 17-22 Millennials 23-36 Generation X 37-51 Baby Boomers 52-71 Greatest Generation 72+ • Young Millennials (23-26) • Core Millennials (27-31) • Mature Millennials (32-36) Source: PwC Global Consumer Insights Survey, 2019