Download as PDF, PPTX


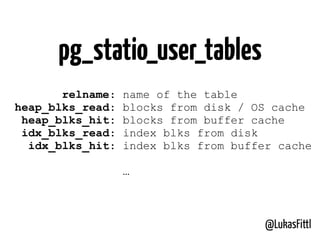


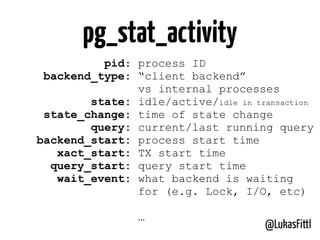

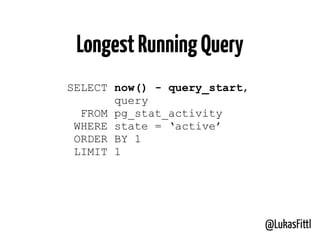

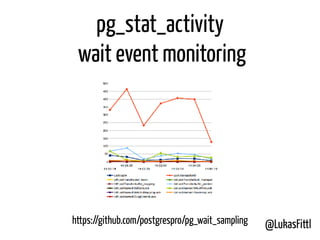

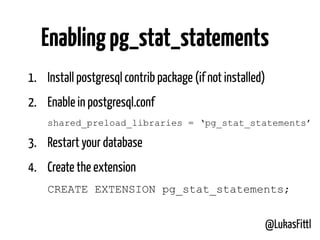
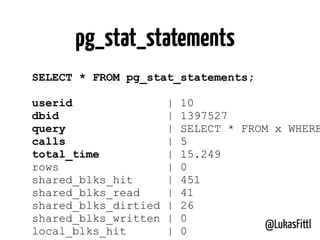
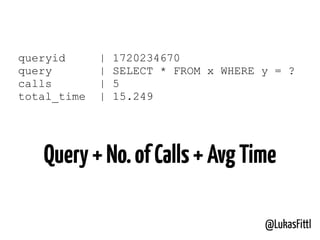


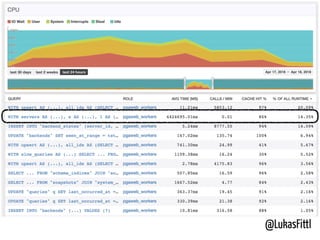


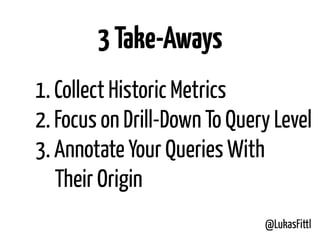

The document discusses best practices for monitoring PostgreSQL databases at scale, highlighting important statistics to track, including user tables and query workload. It emphasizes the need for historic metrics collection, query performance analysis, and effective use of PostgreSQL's monitoring tools, like pg_stat_activity and pg_stat_statements. The conclusion suggests annotating queries for better tracking and diagnosing performance issues.