Downloaded 123 times
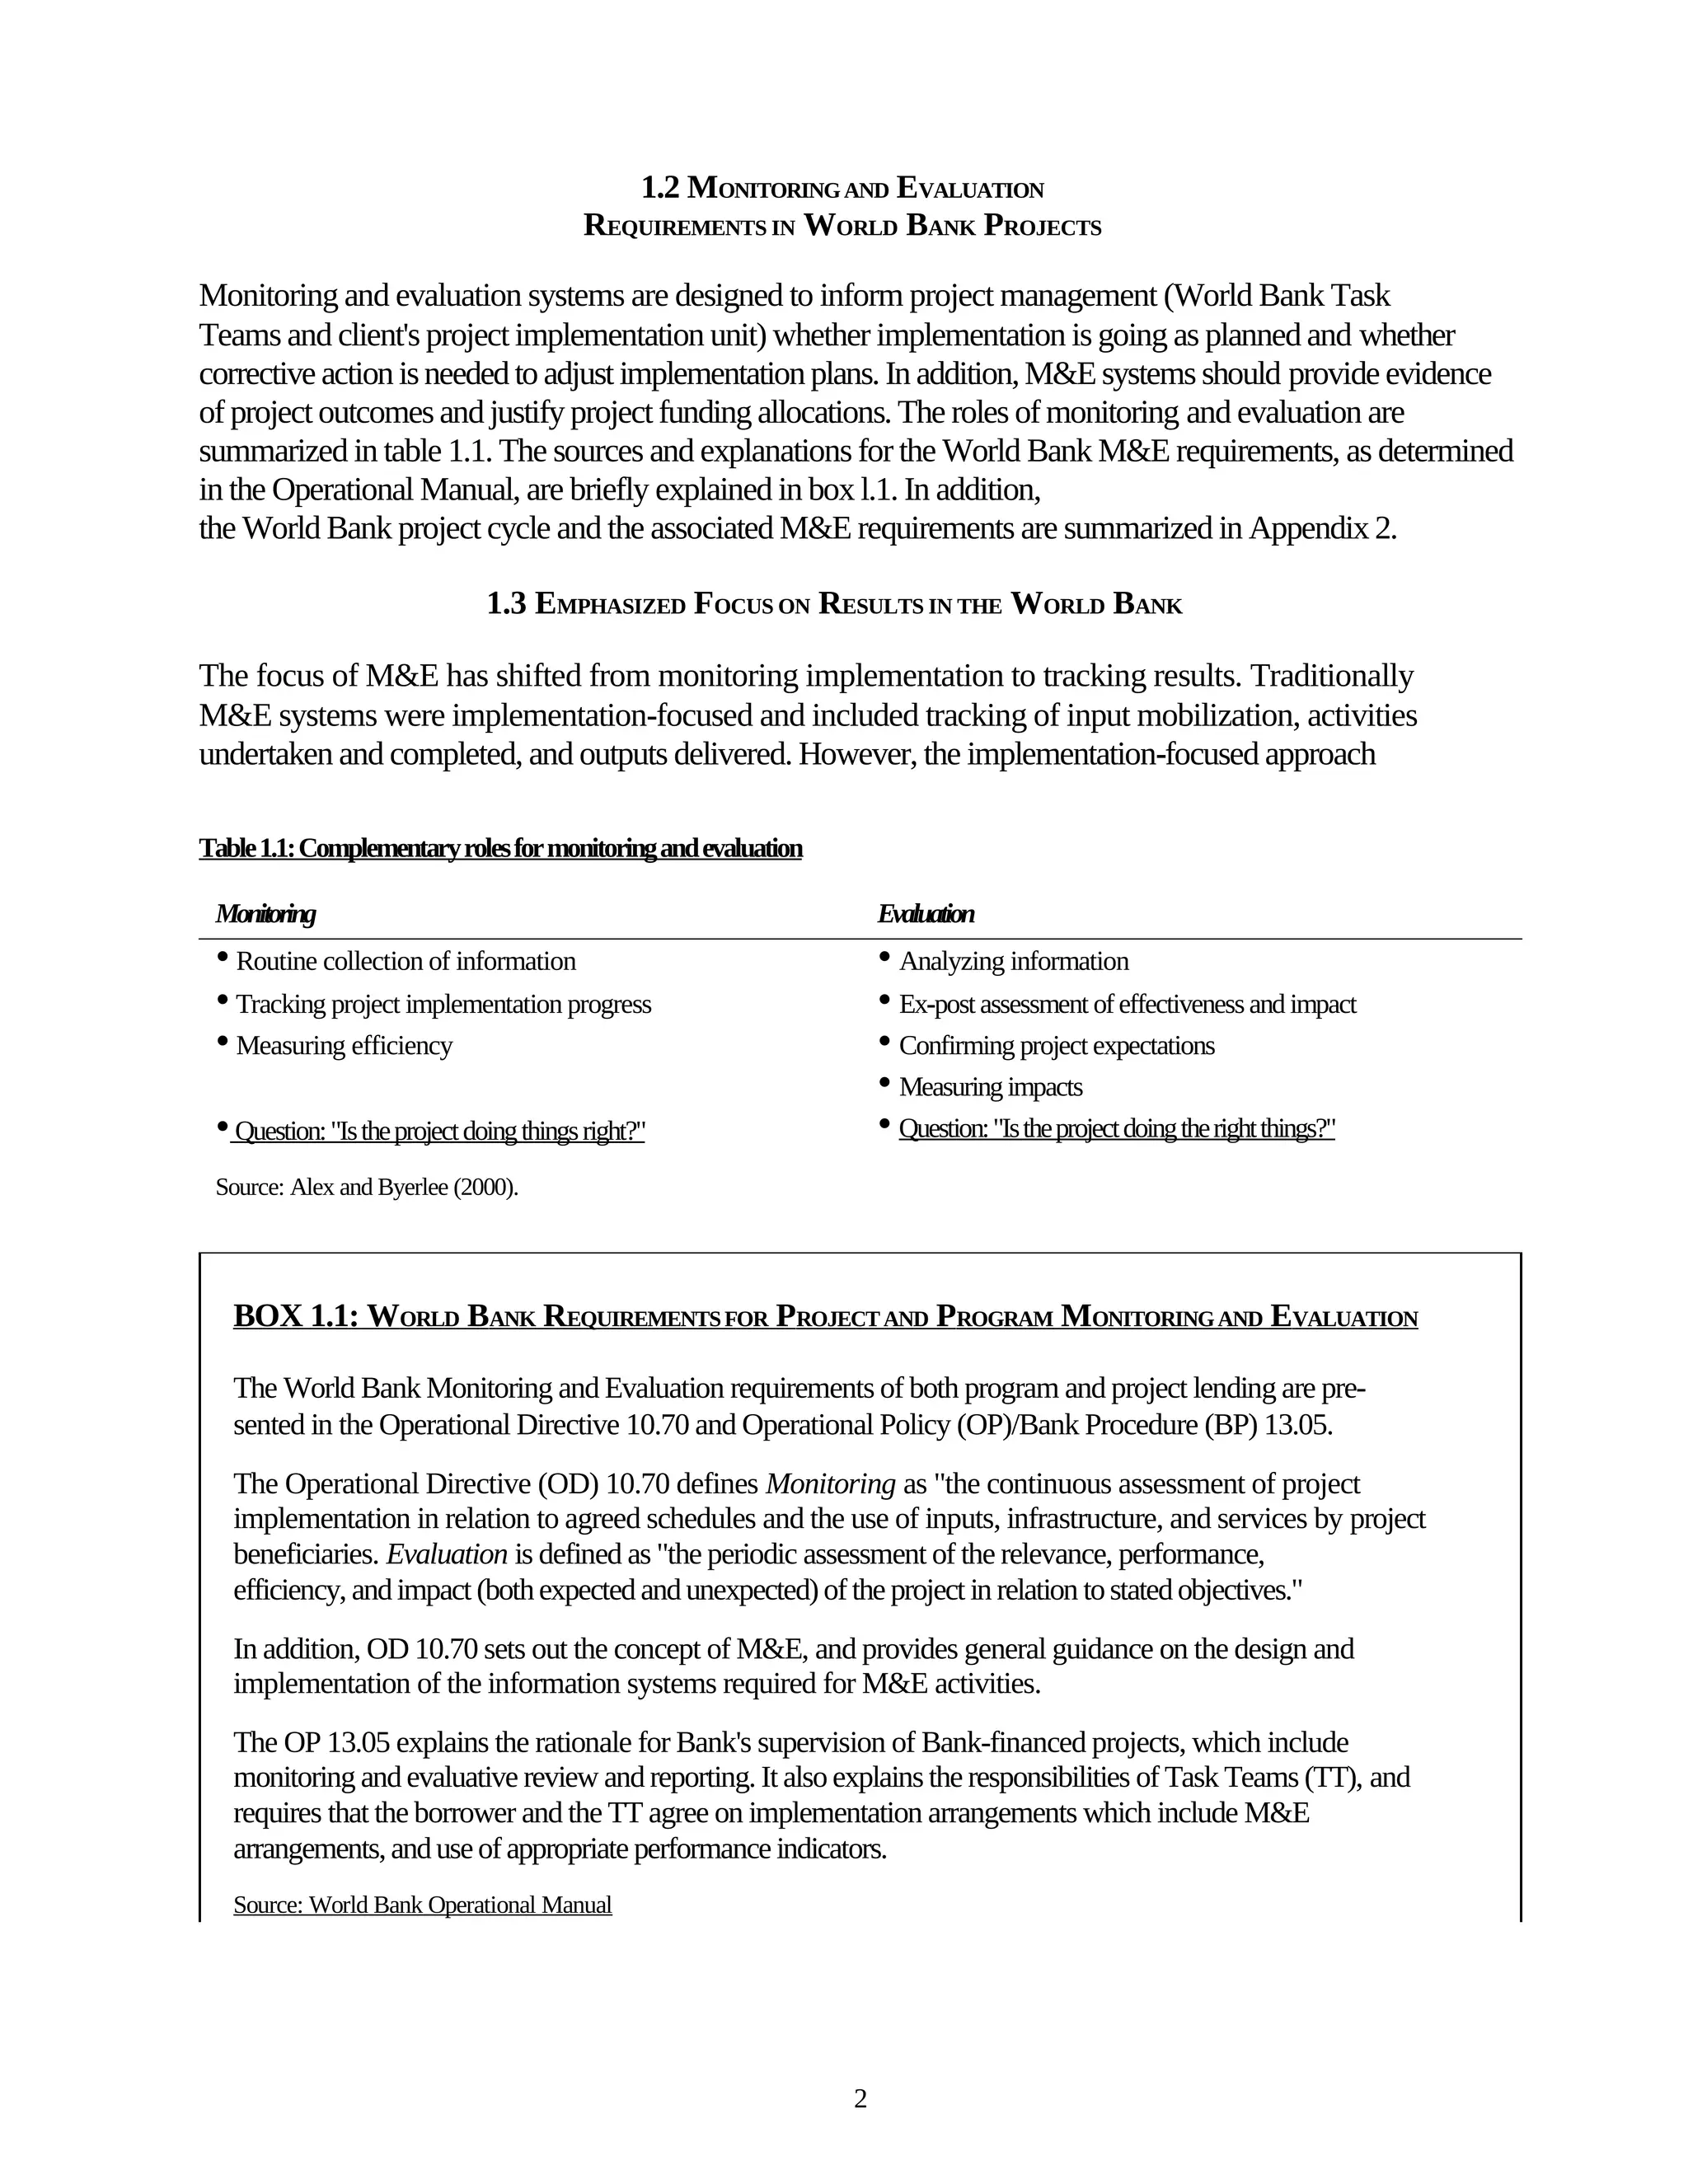
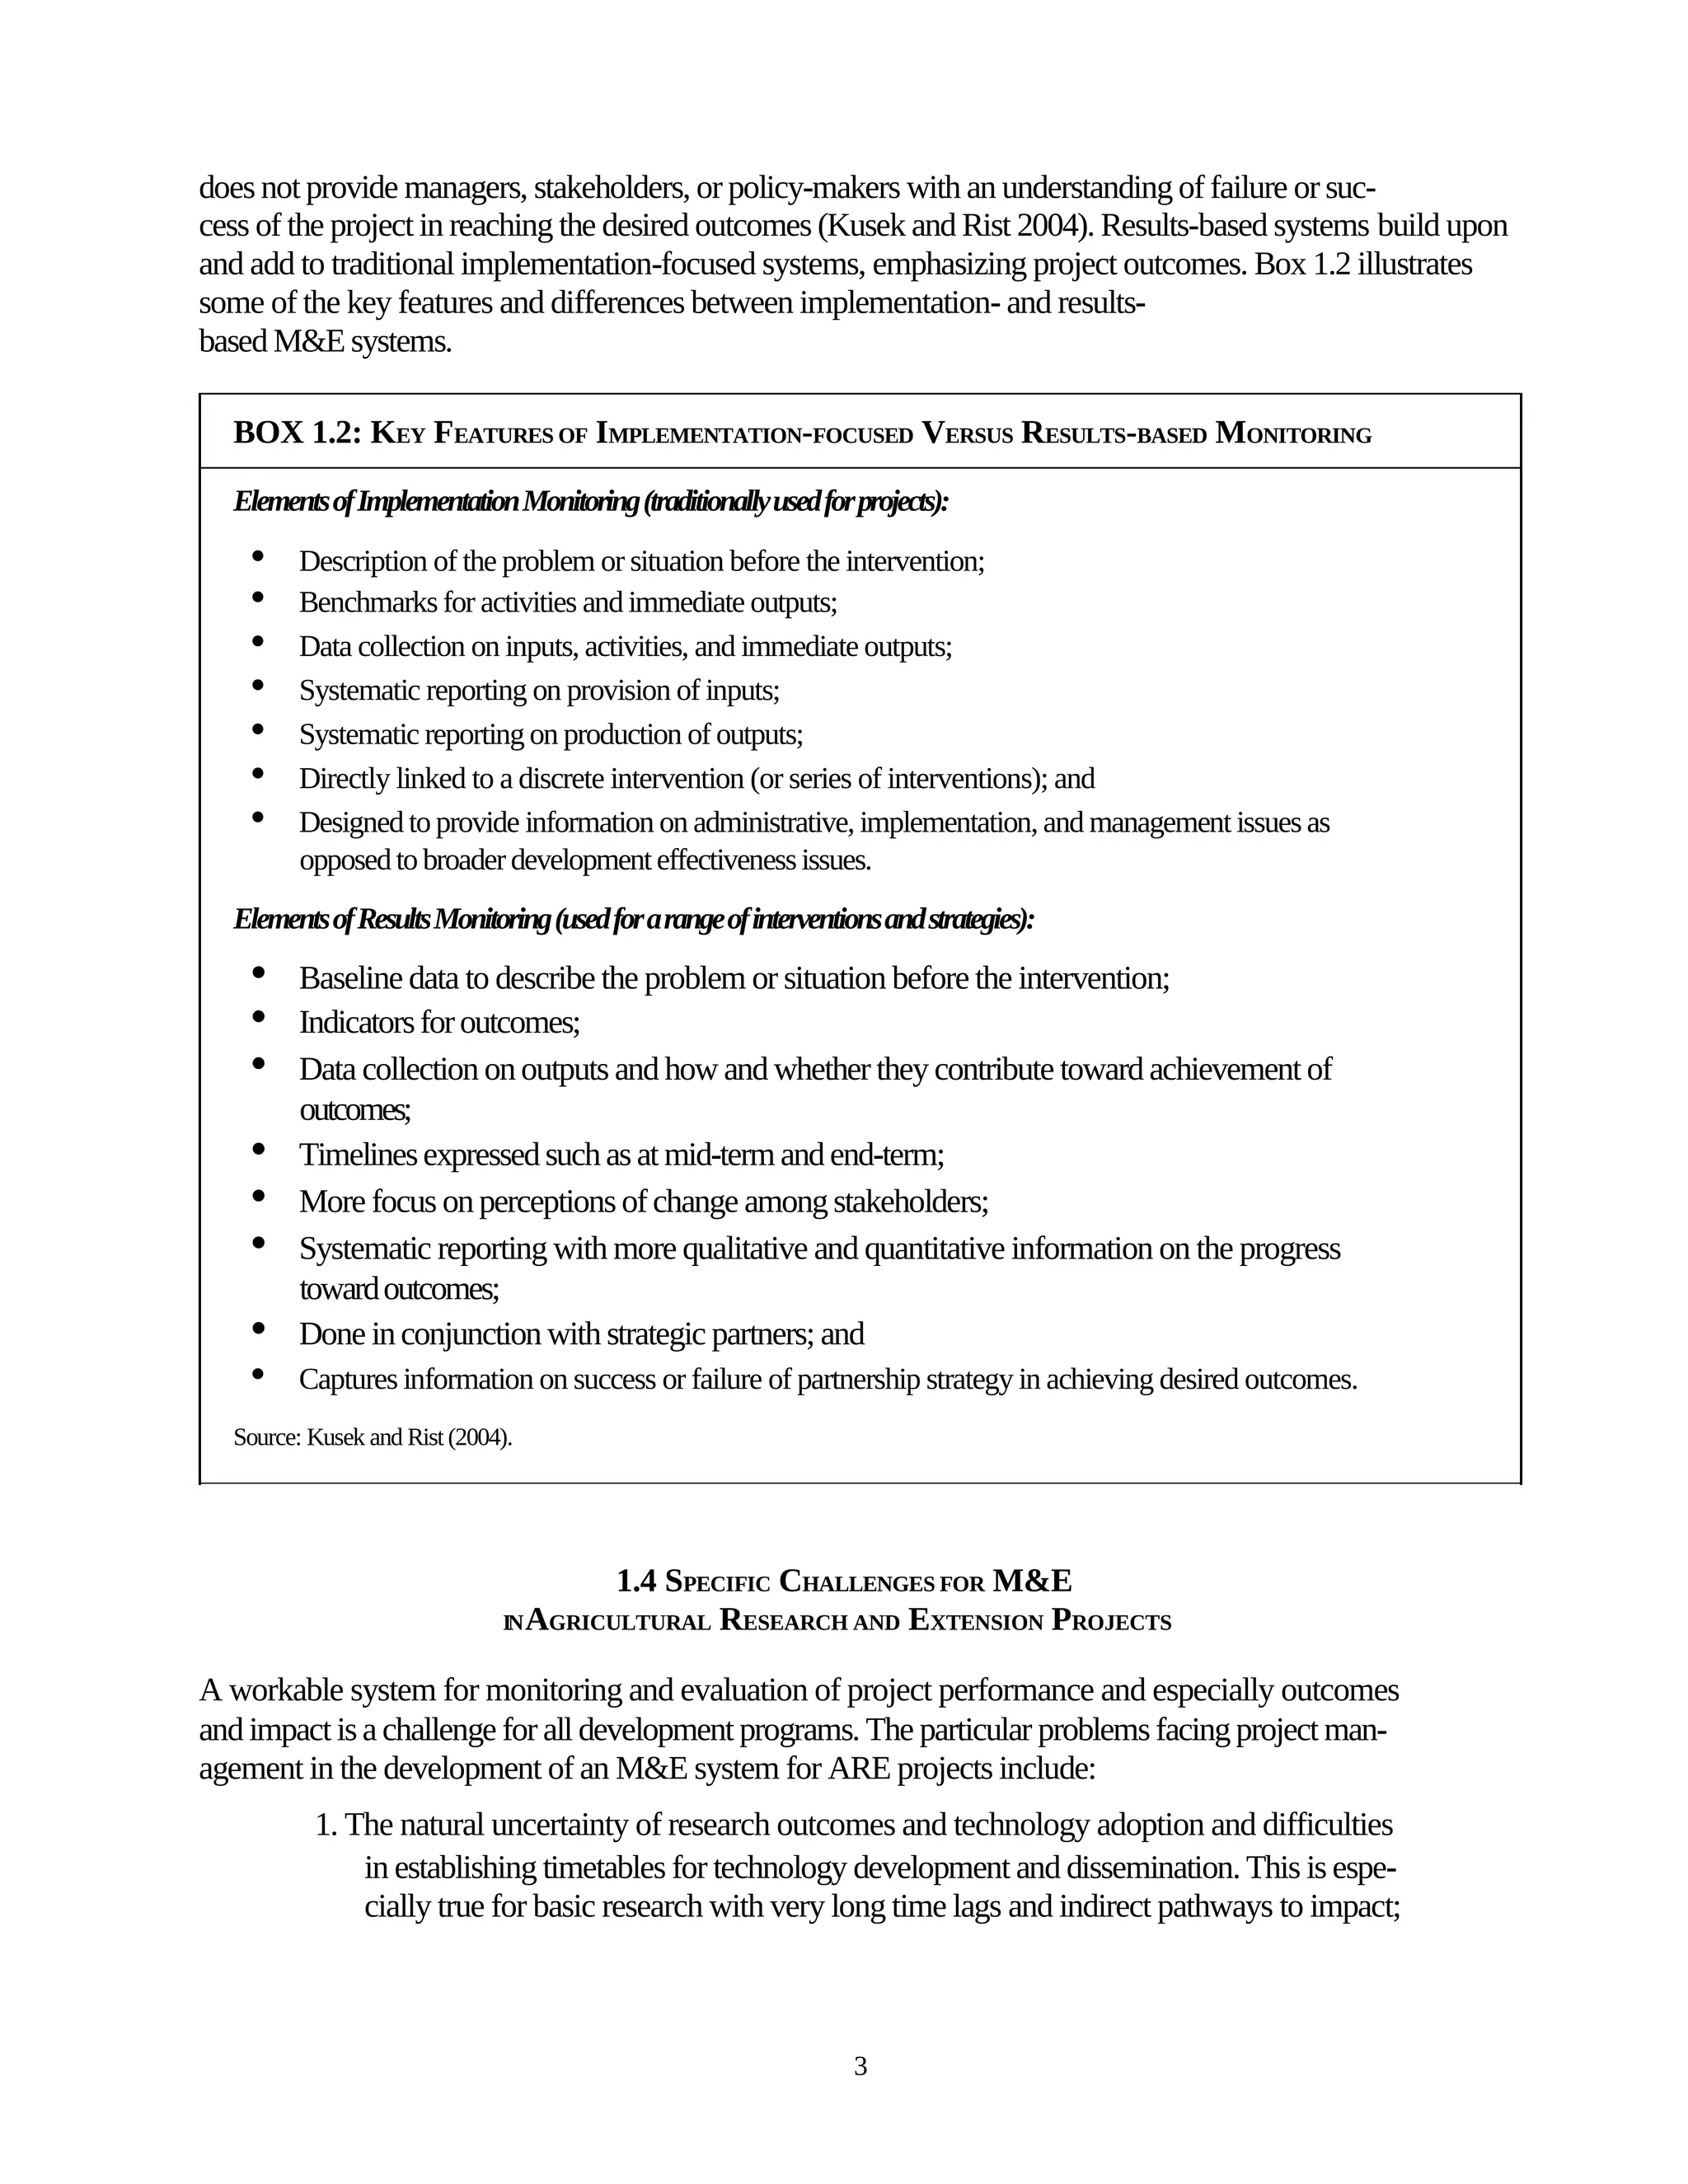
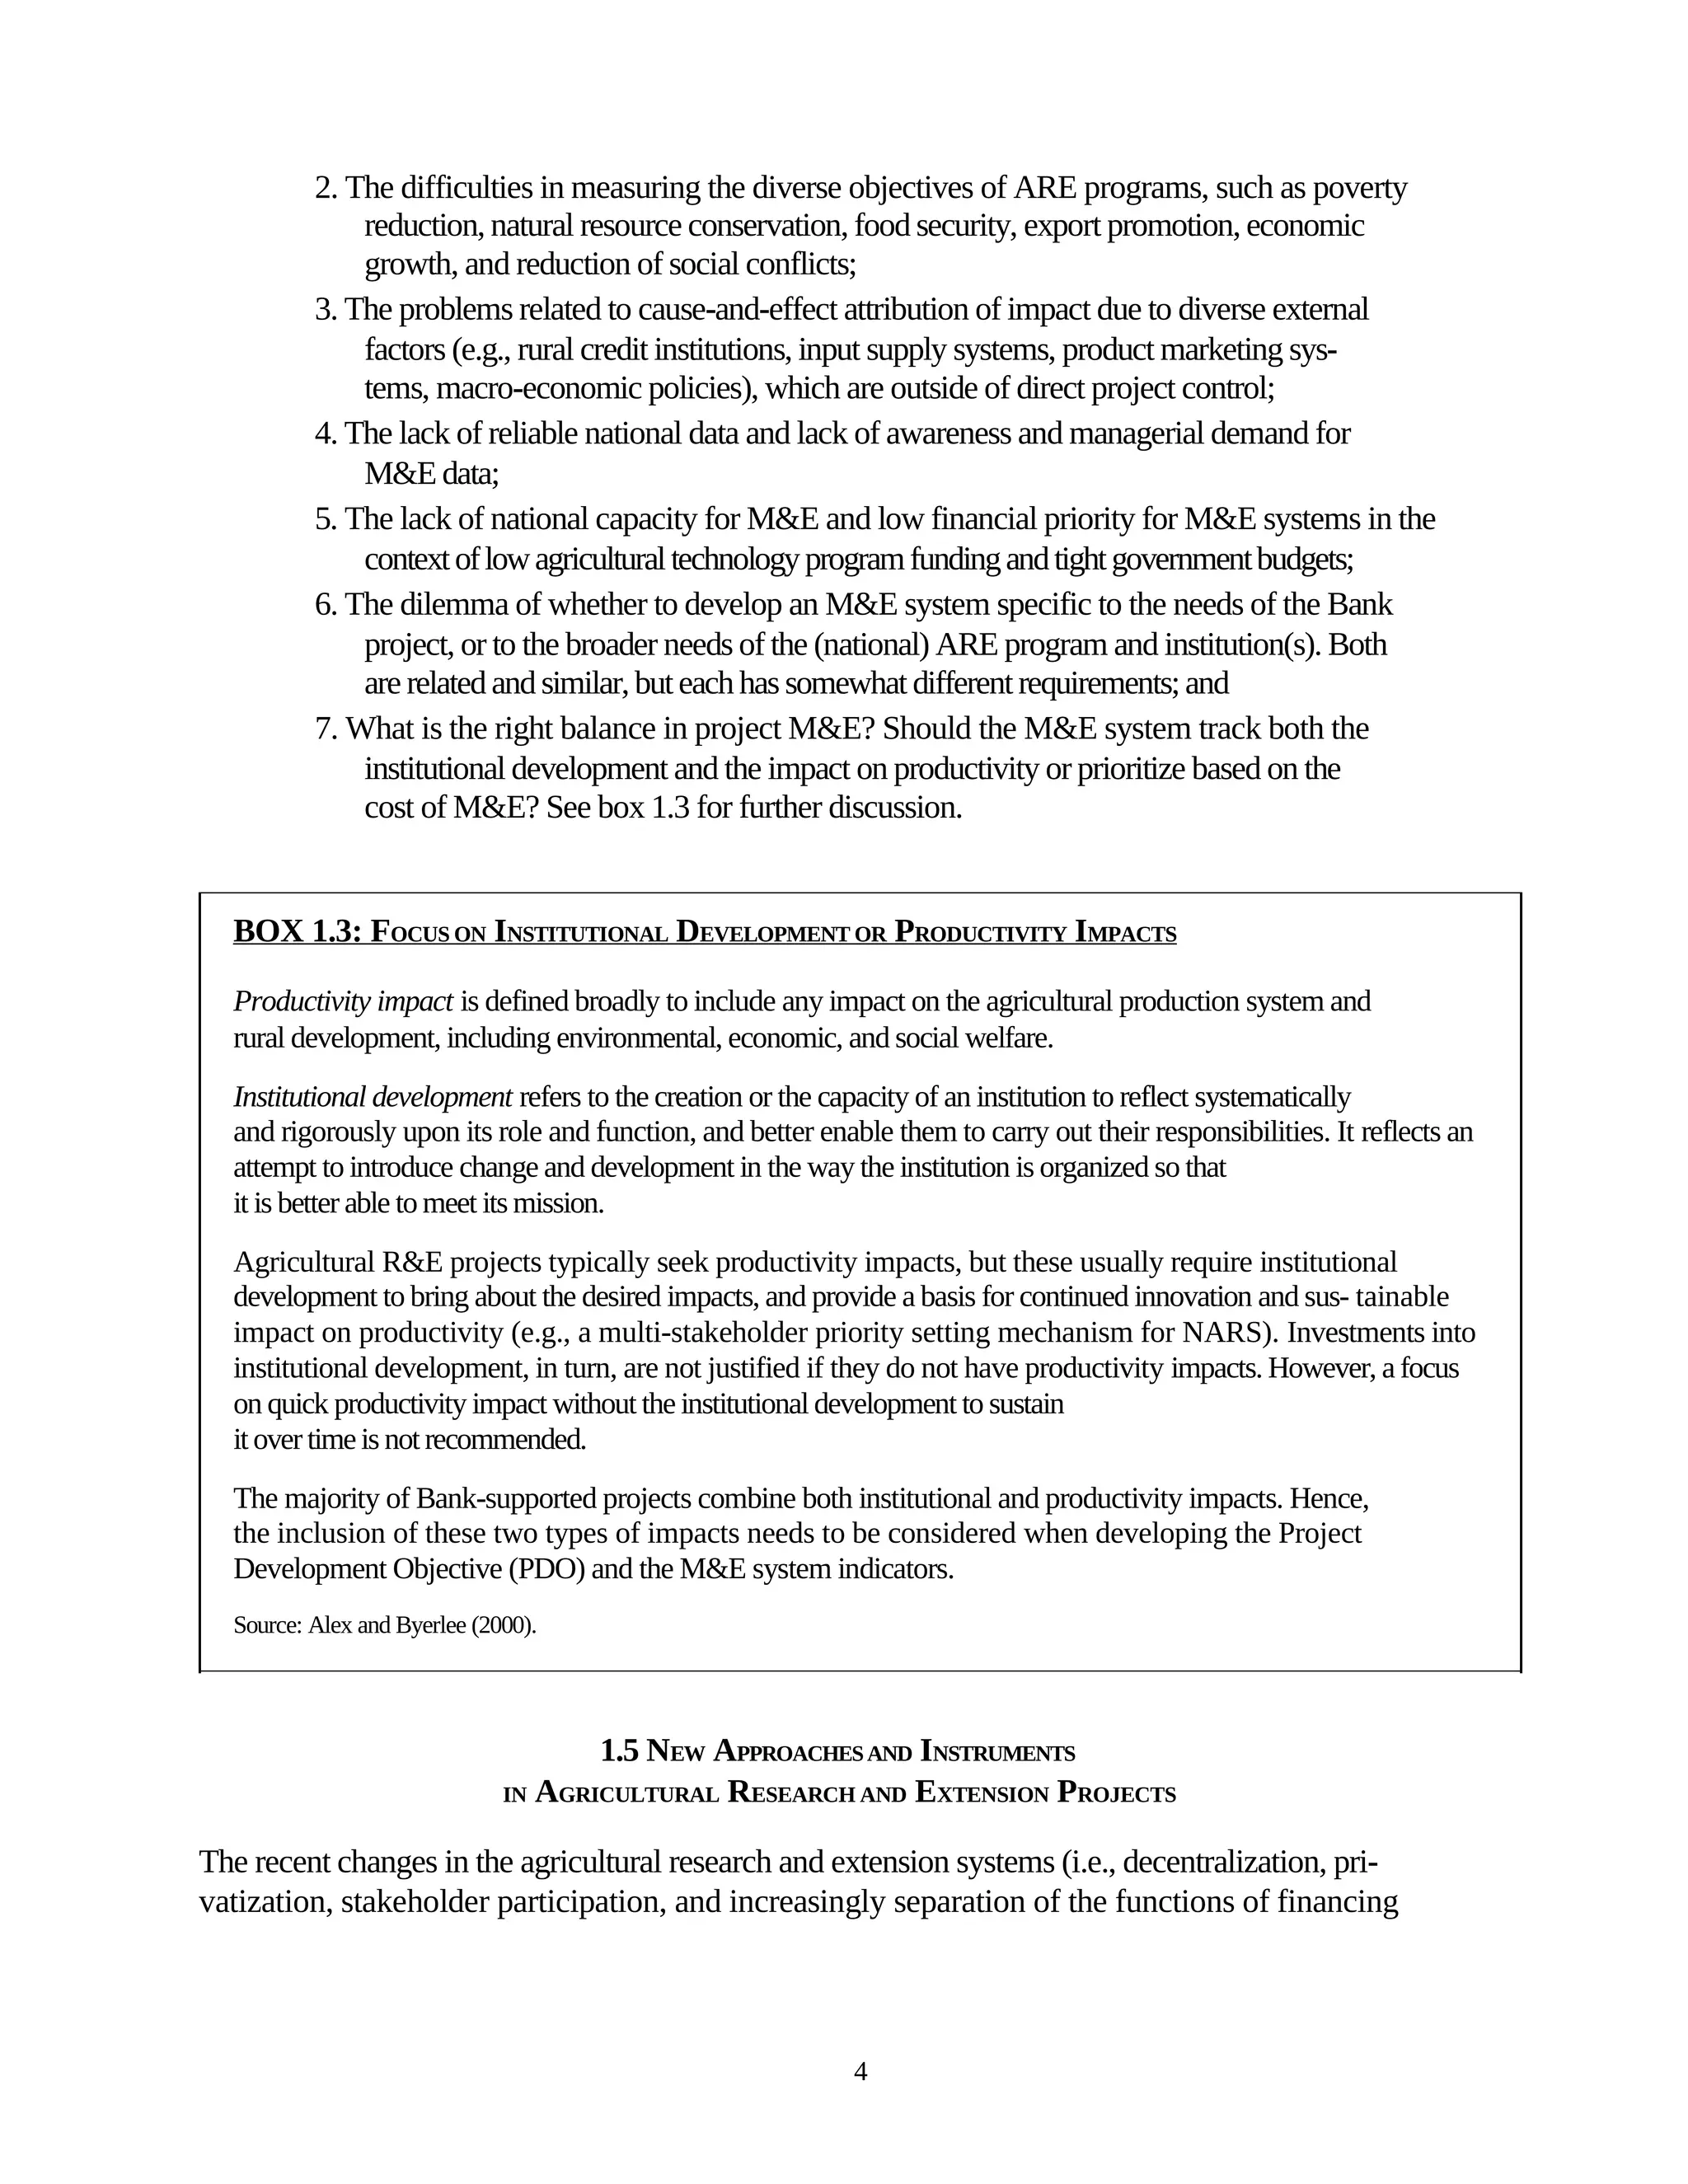
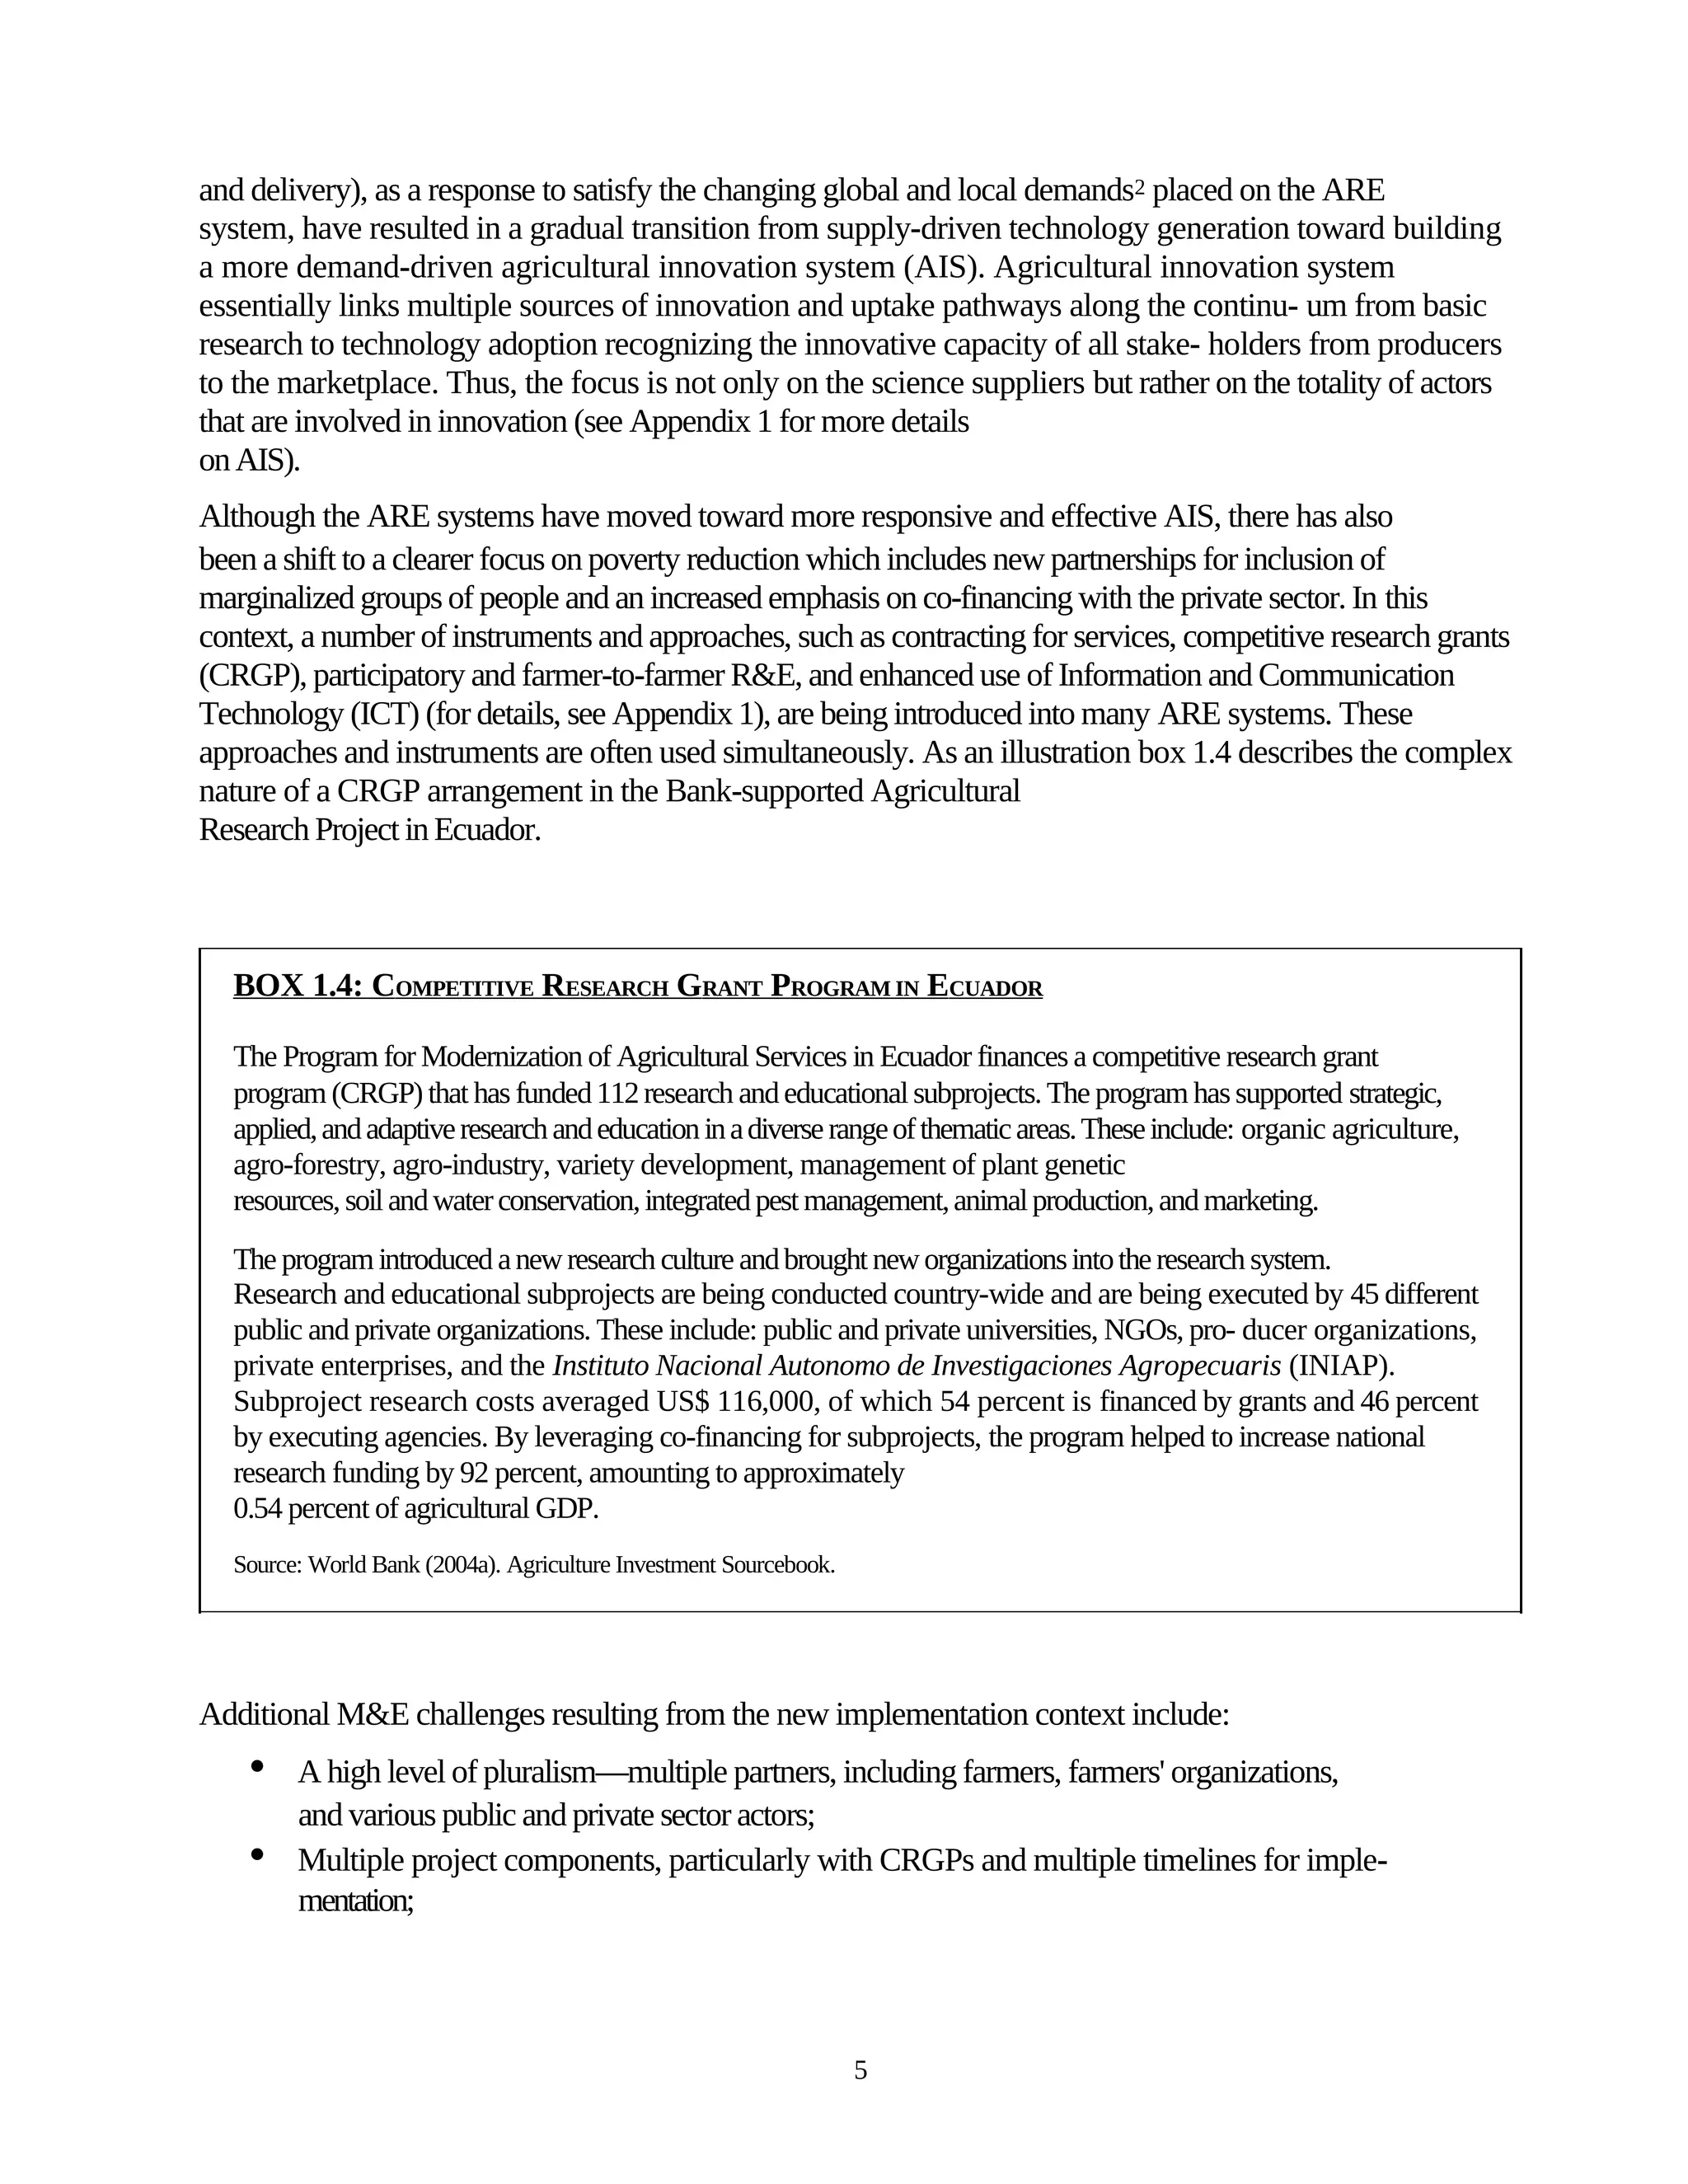
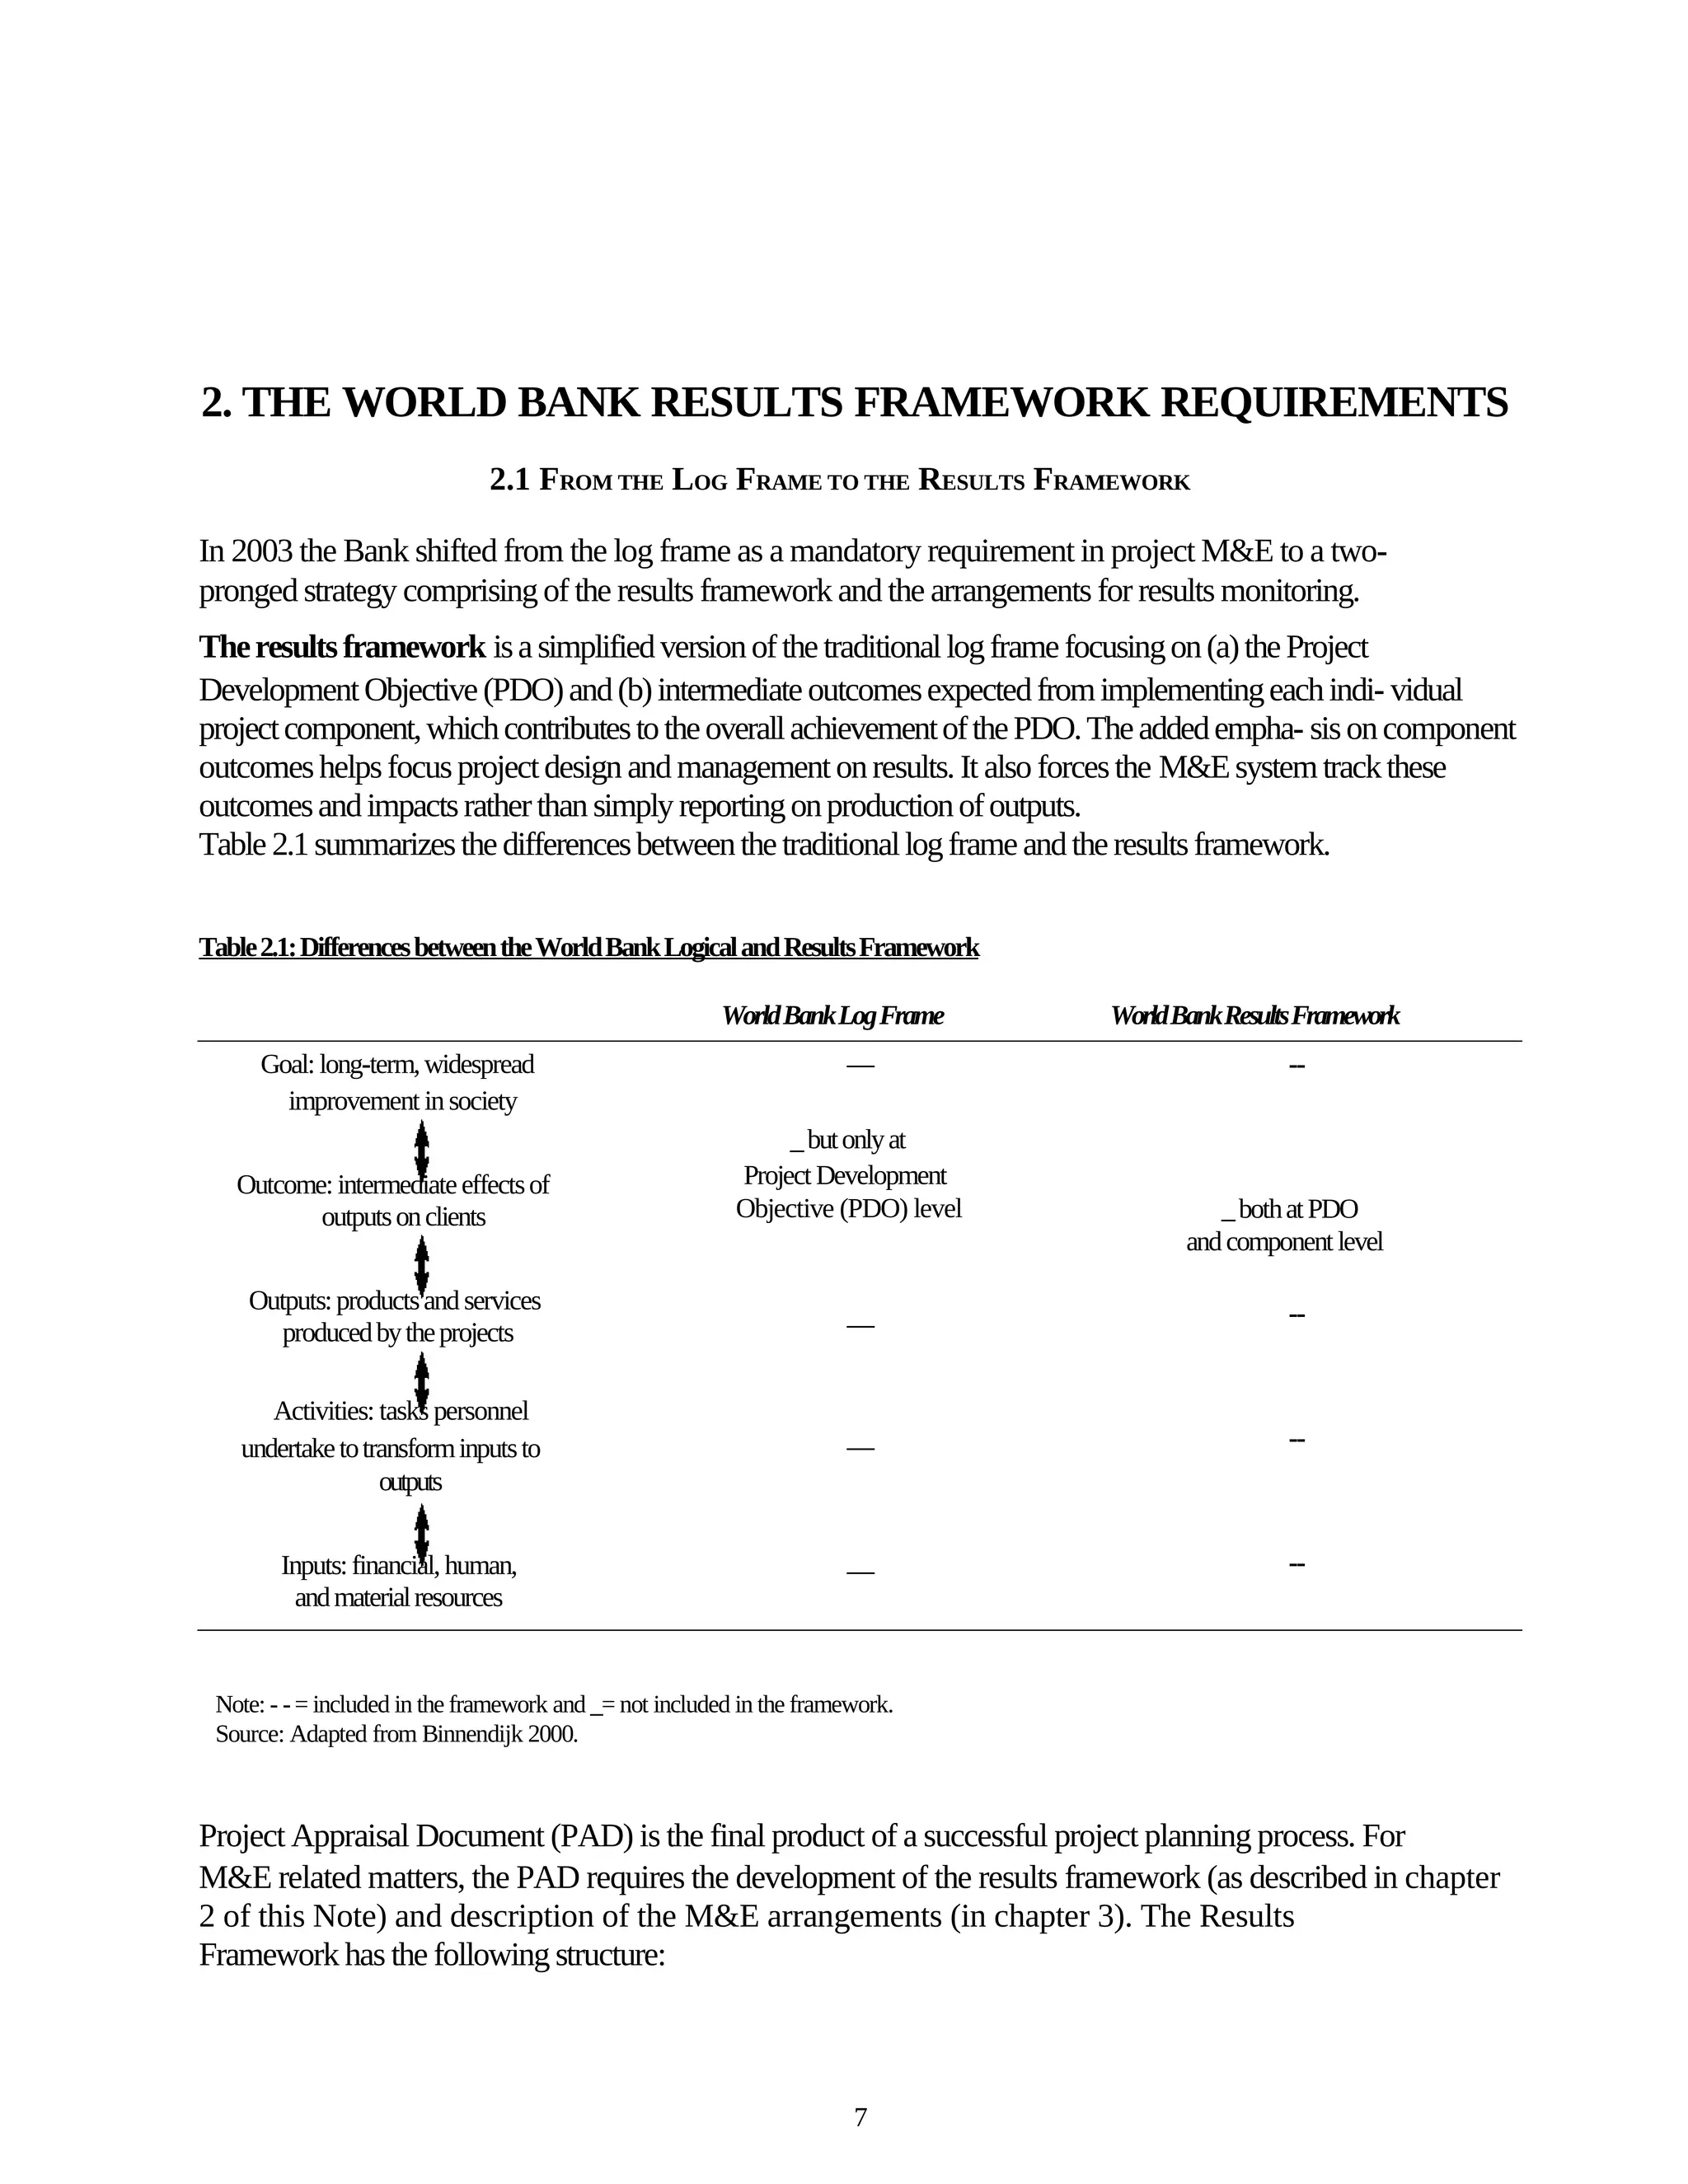
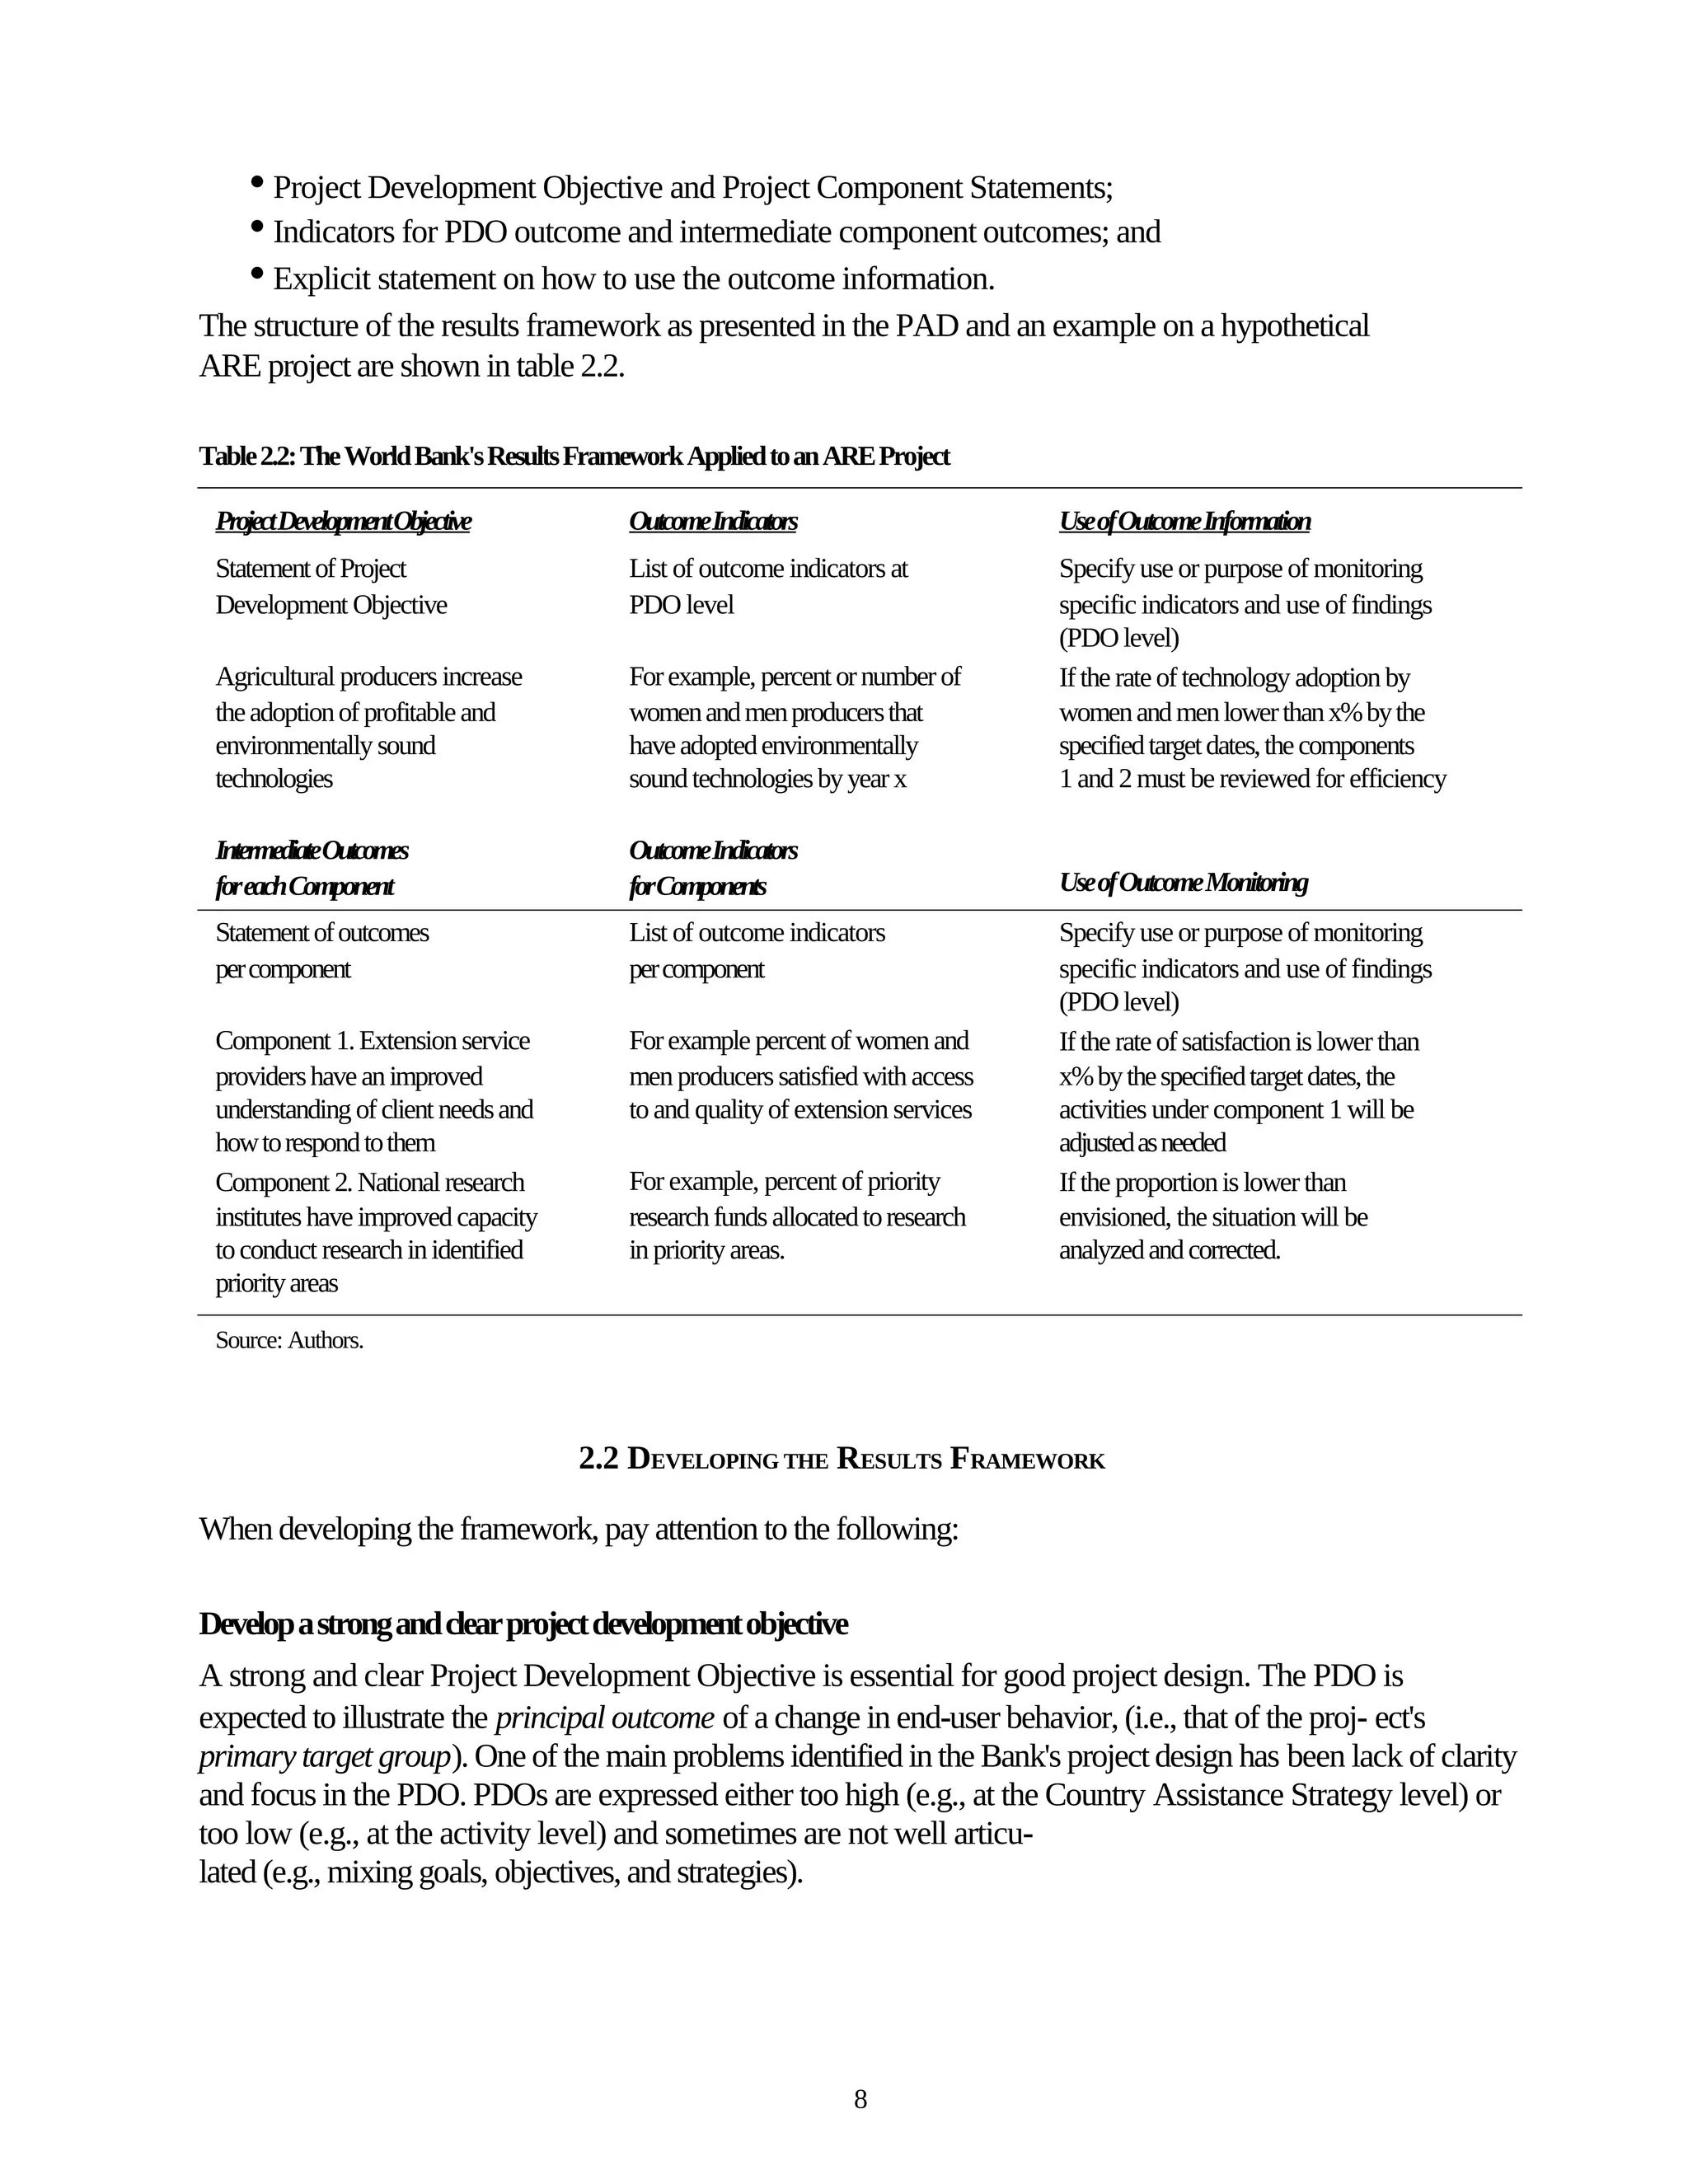
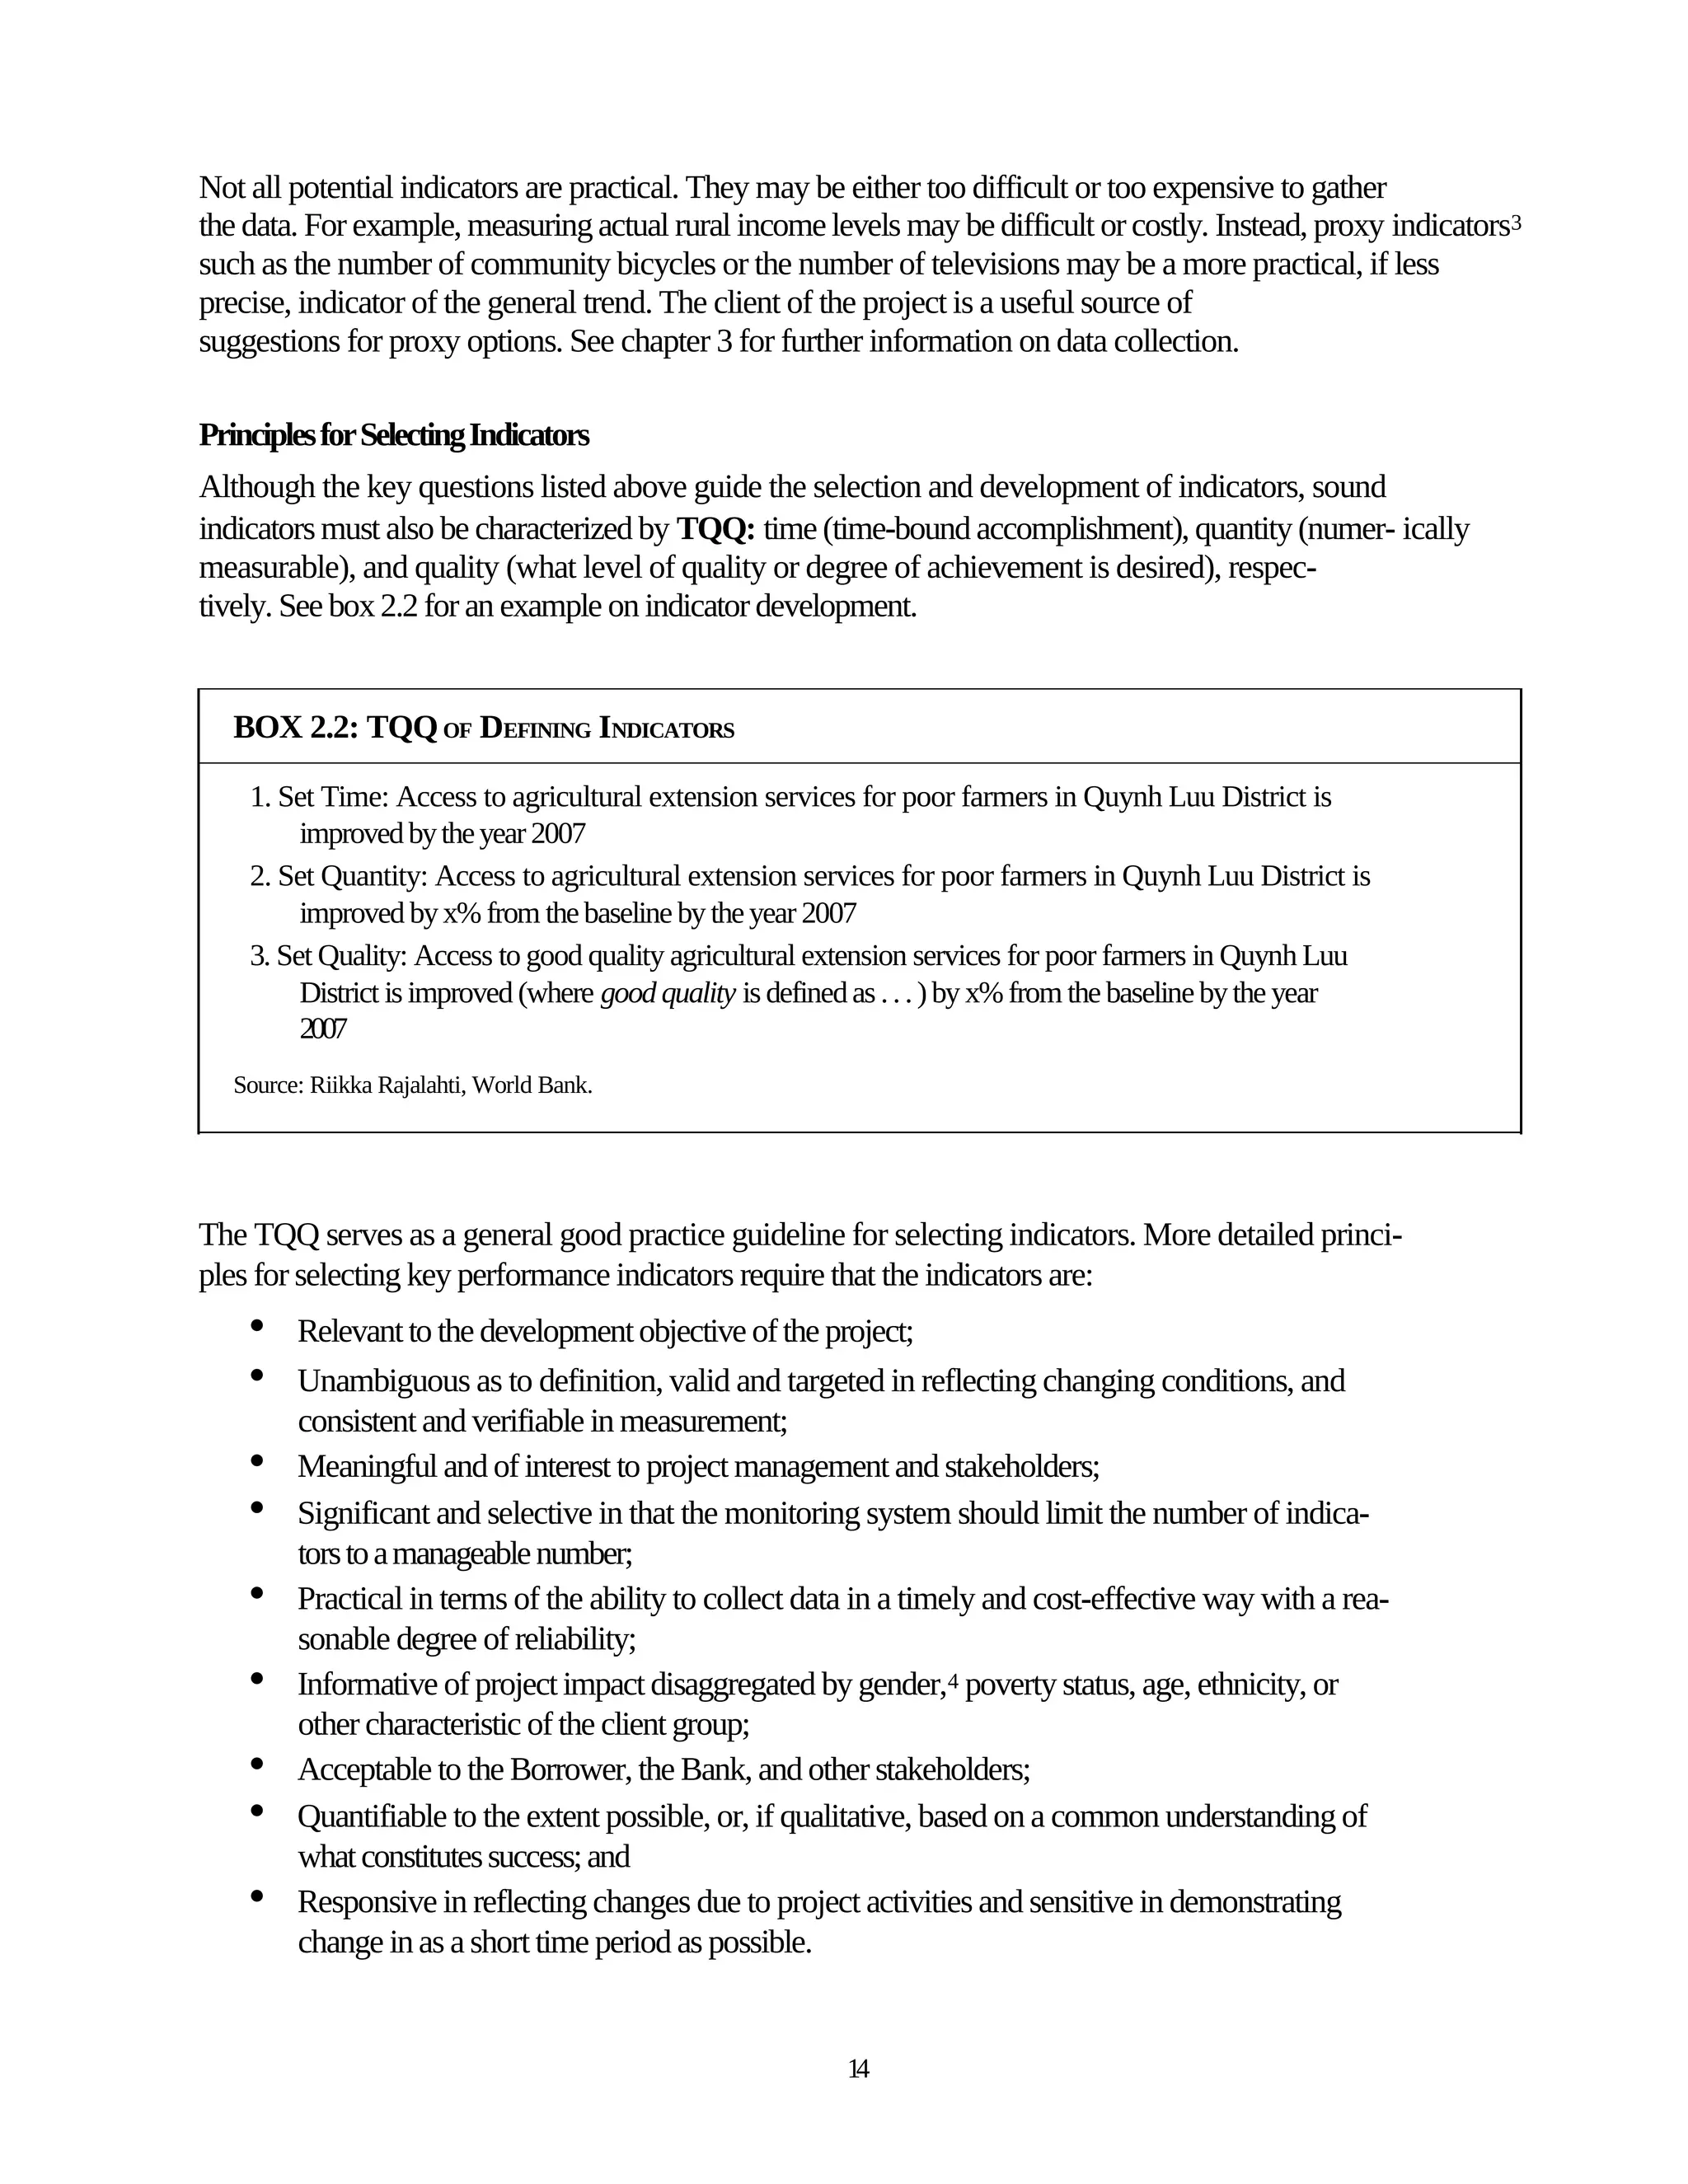
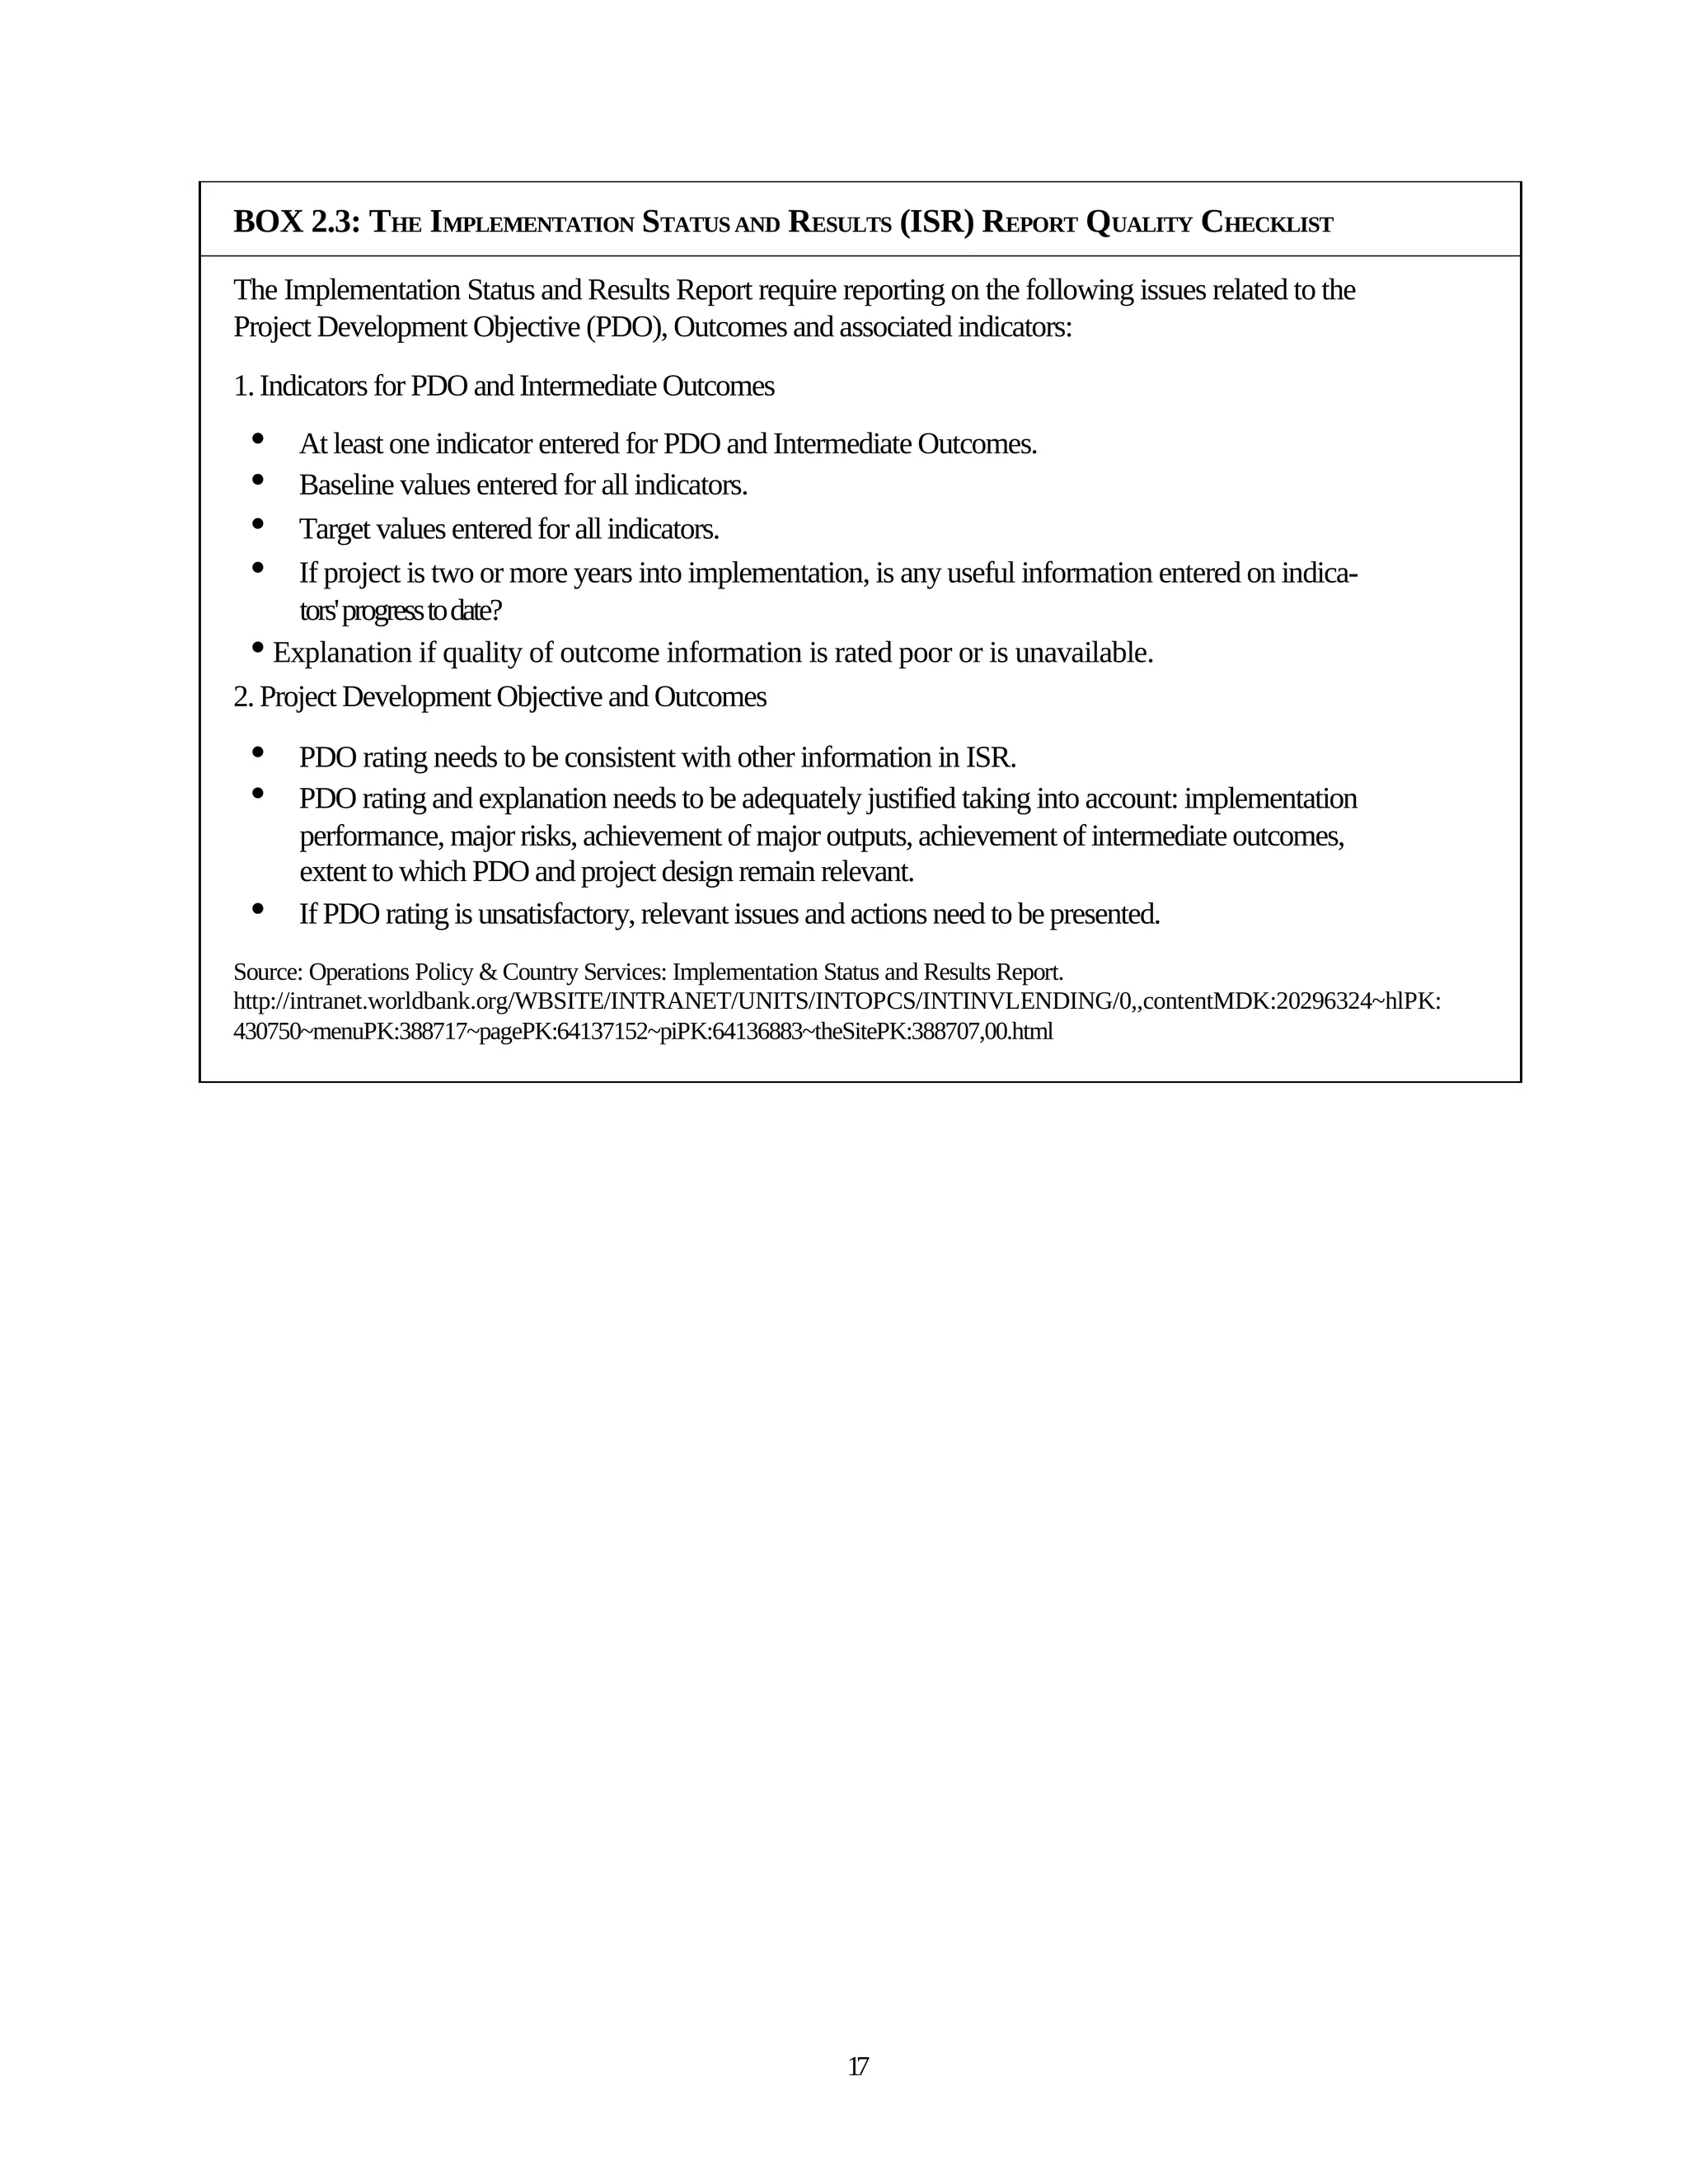
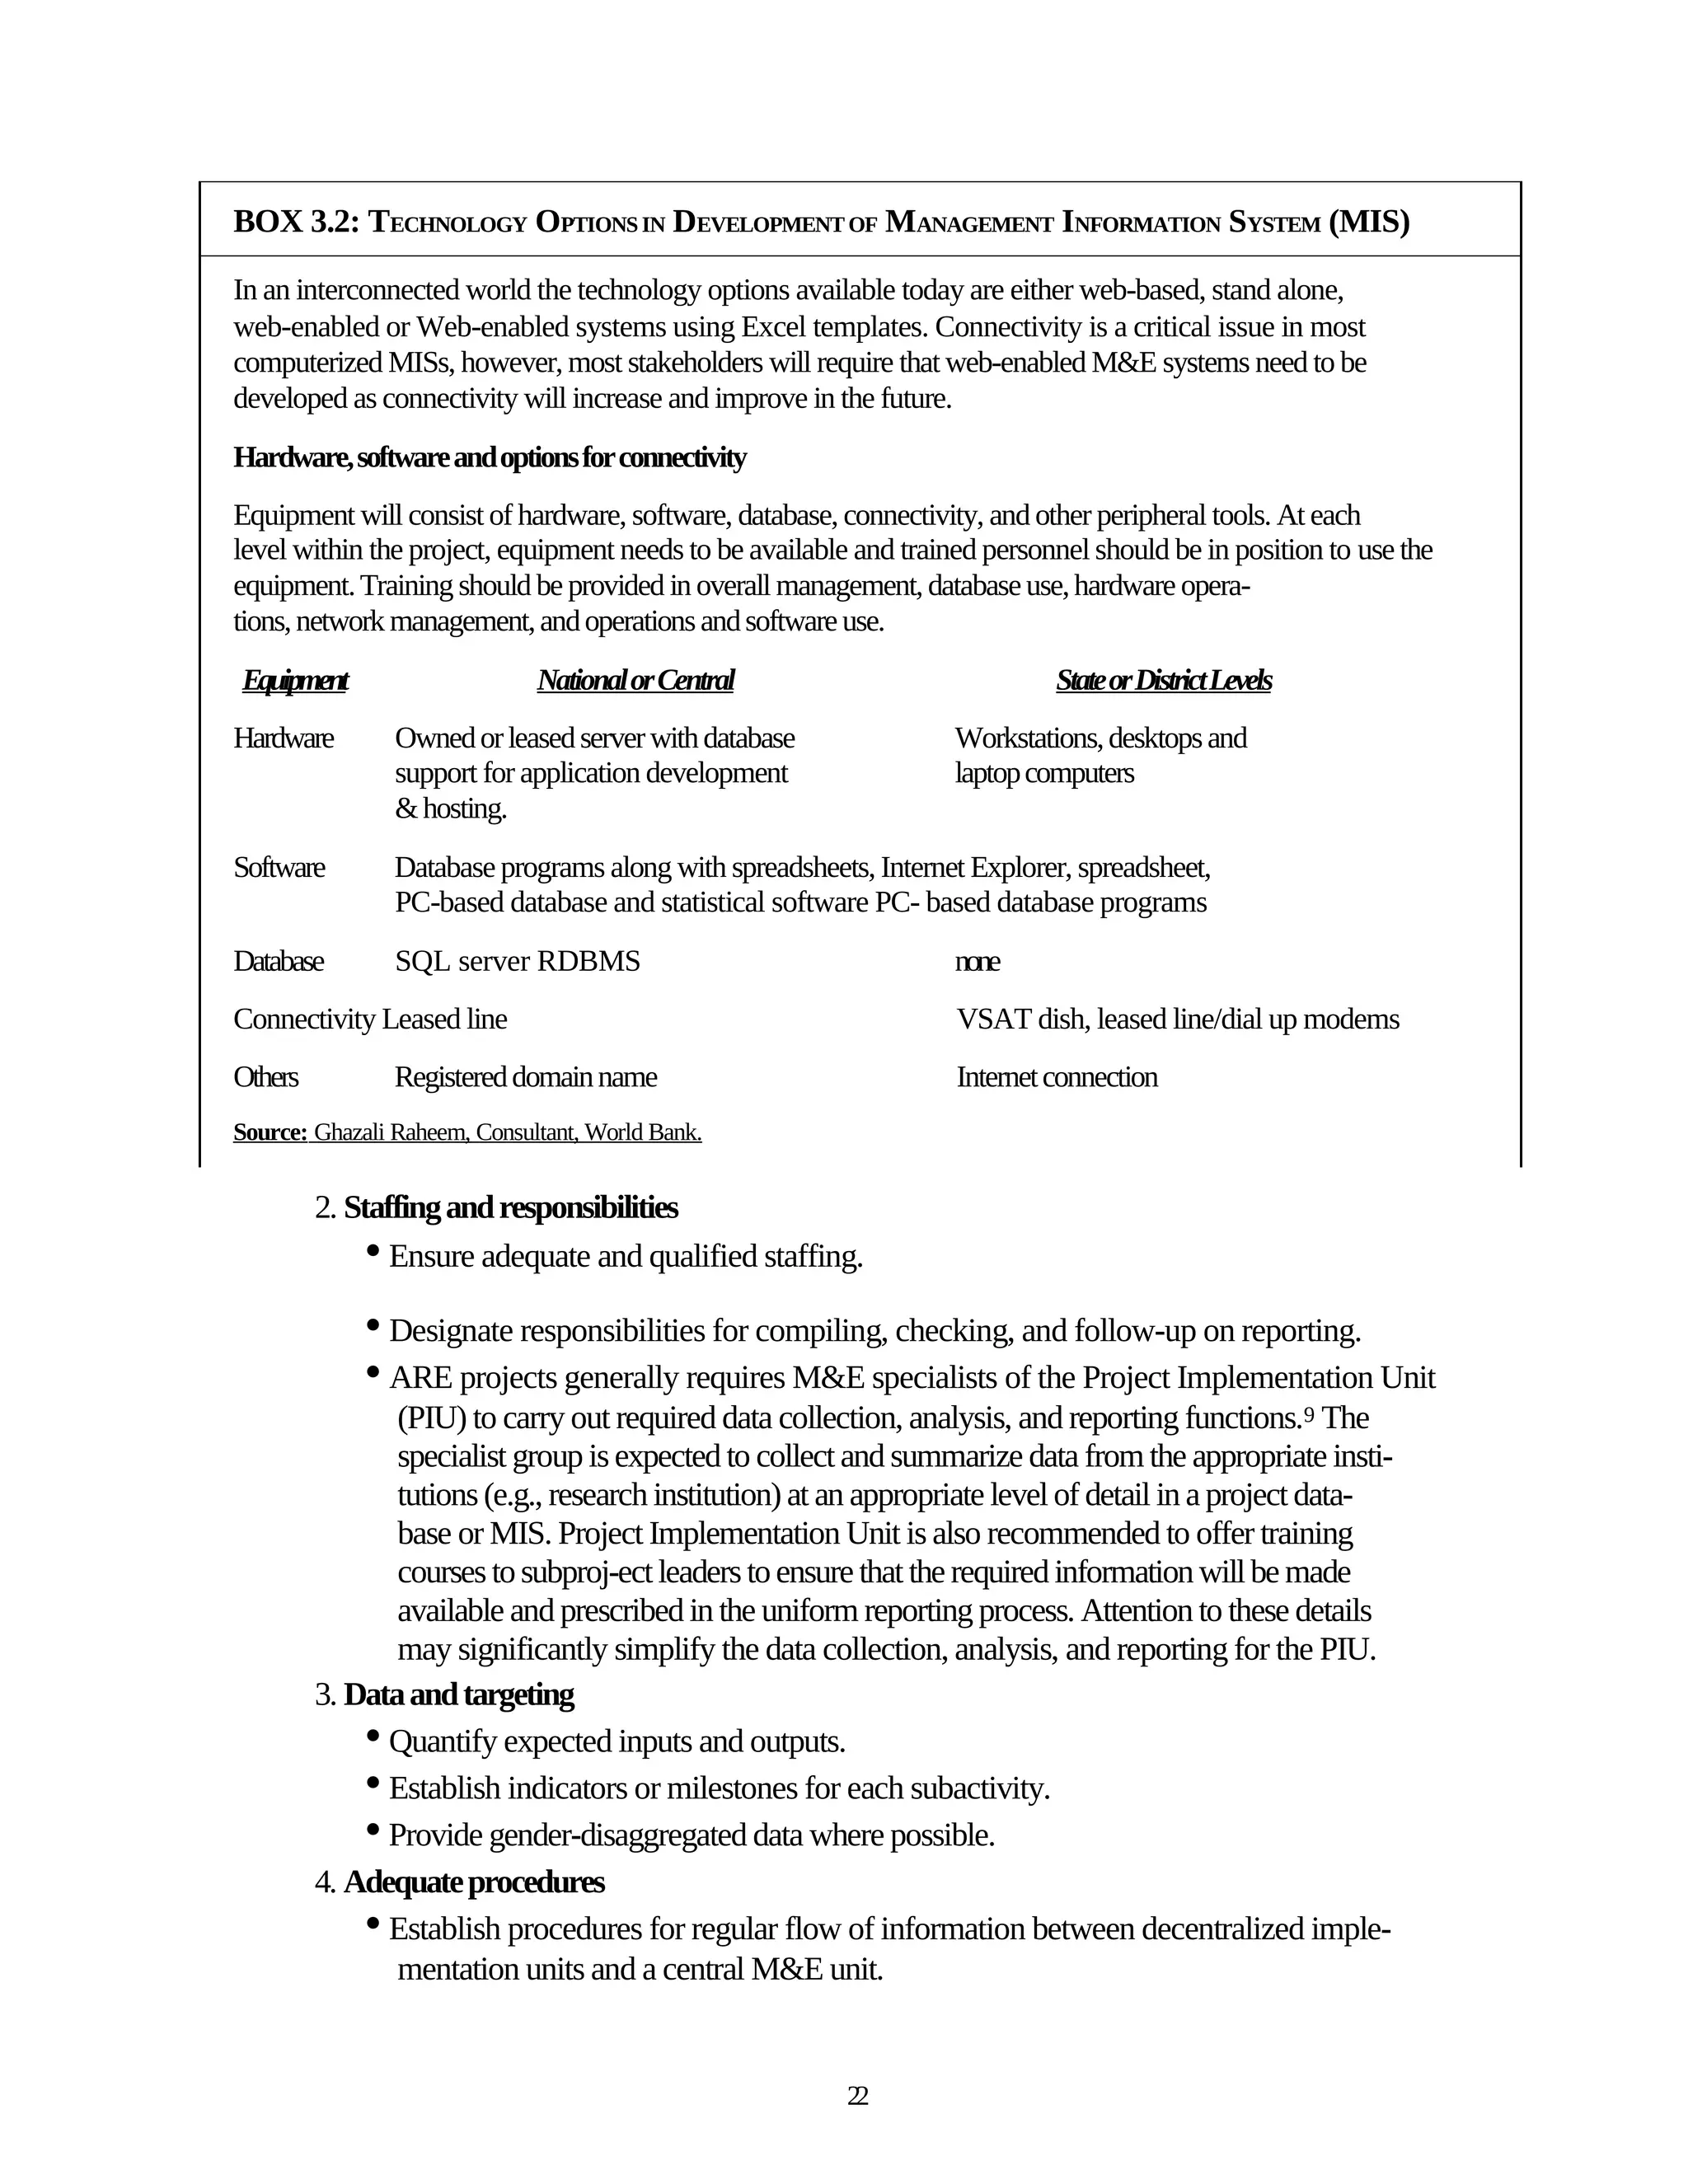
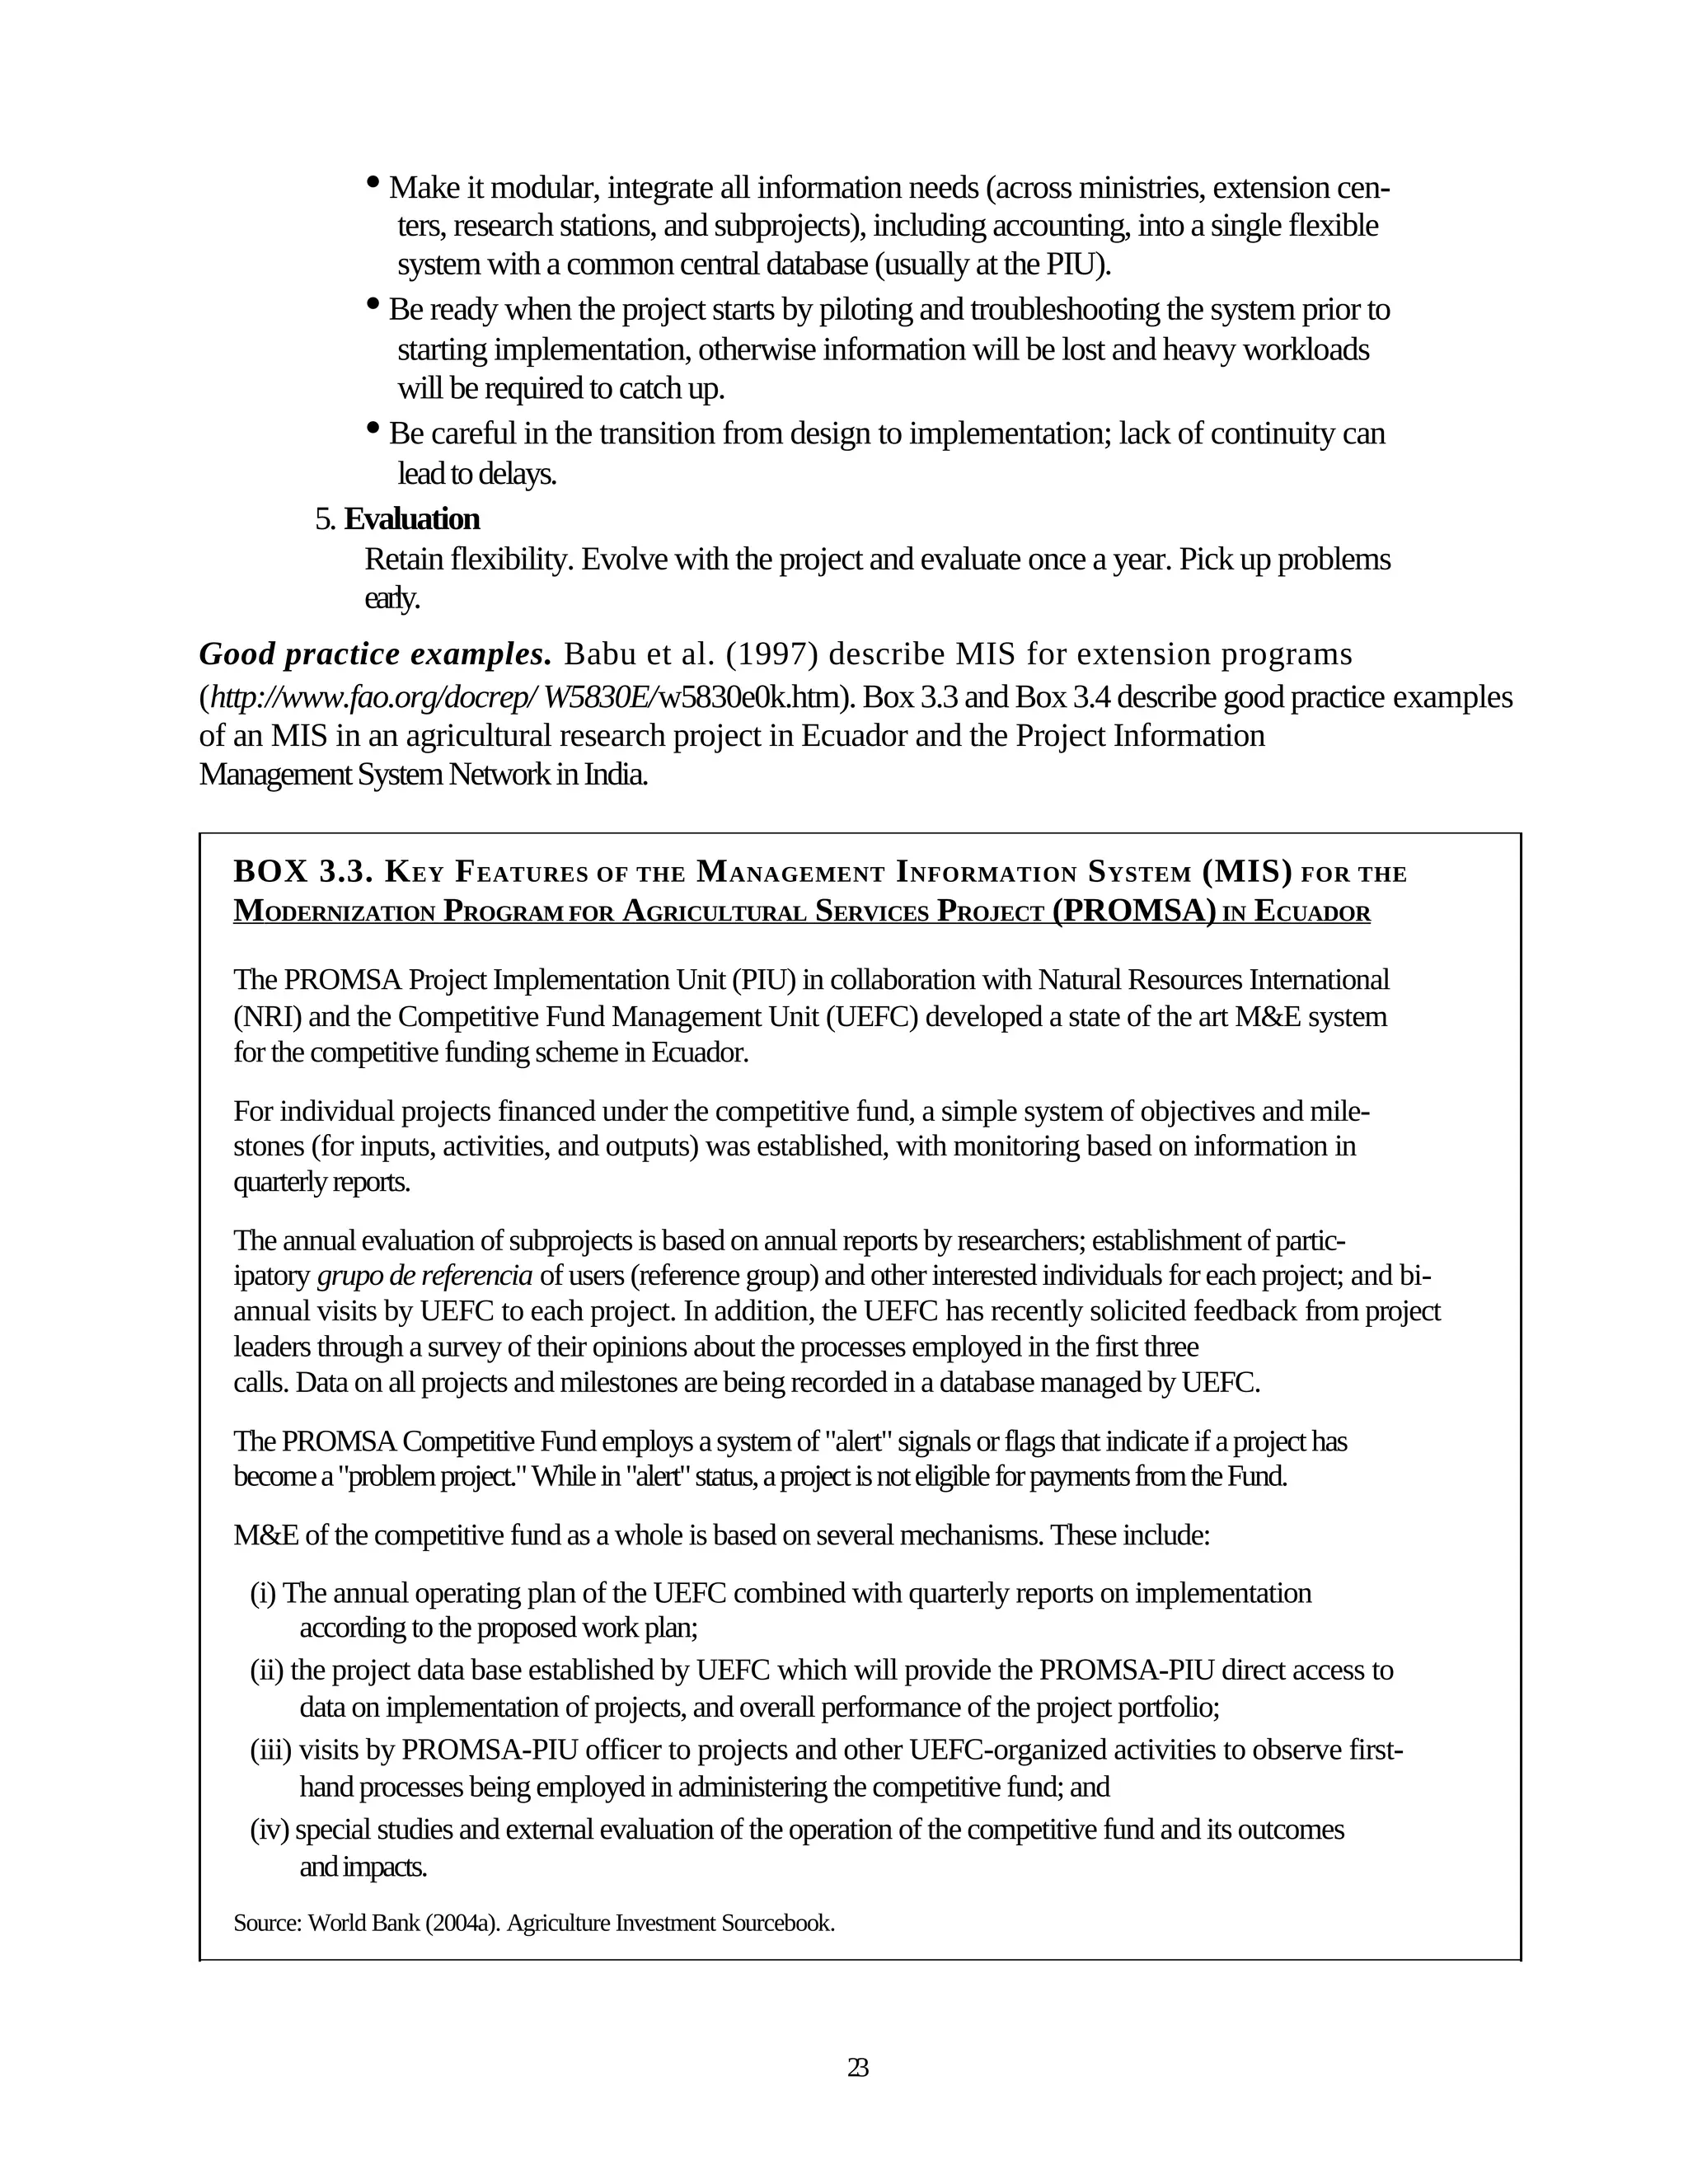
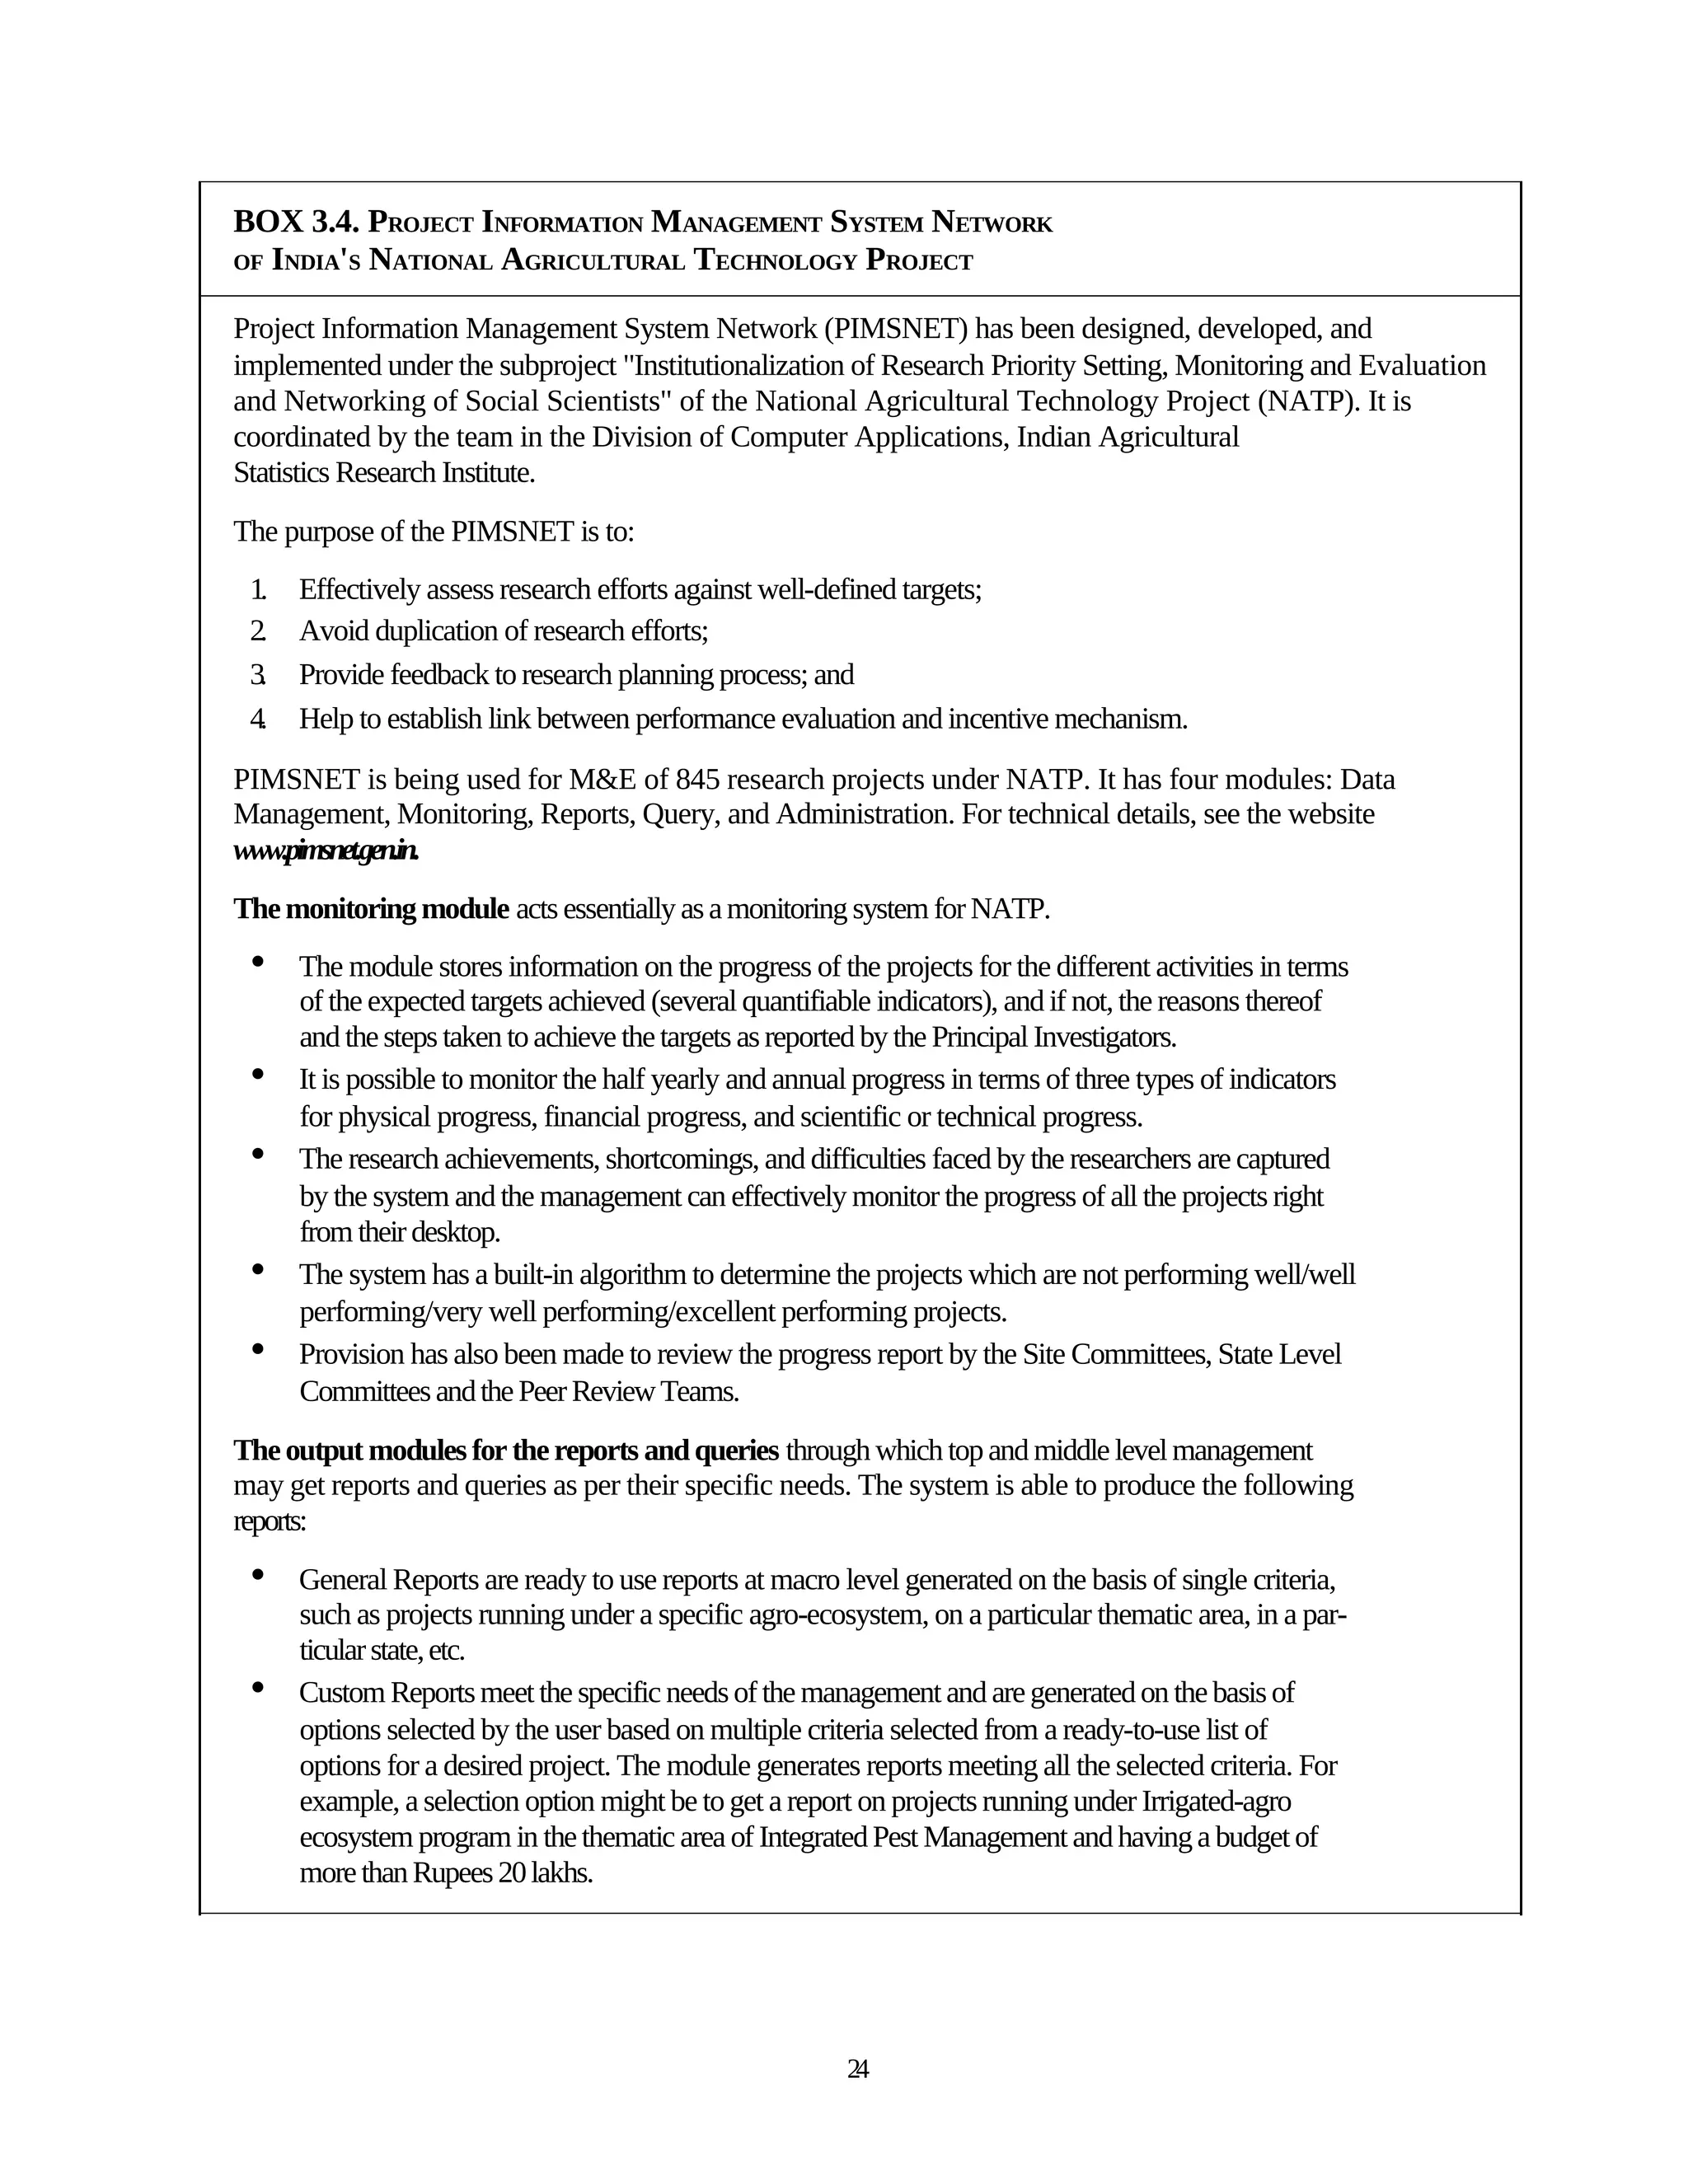
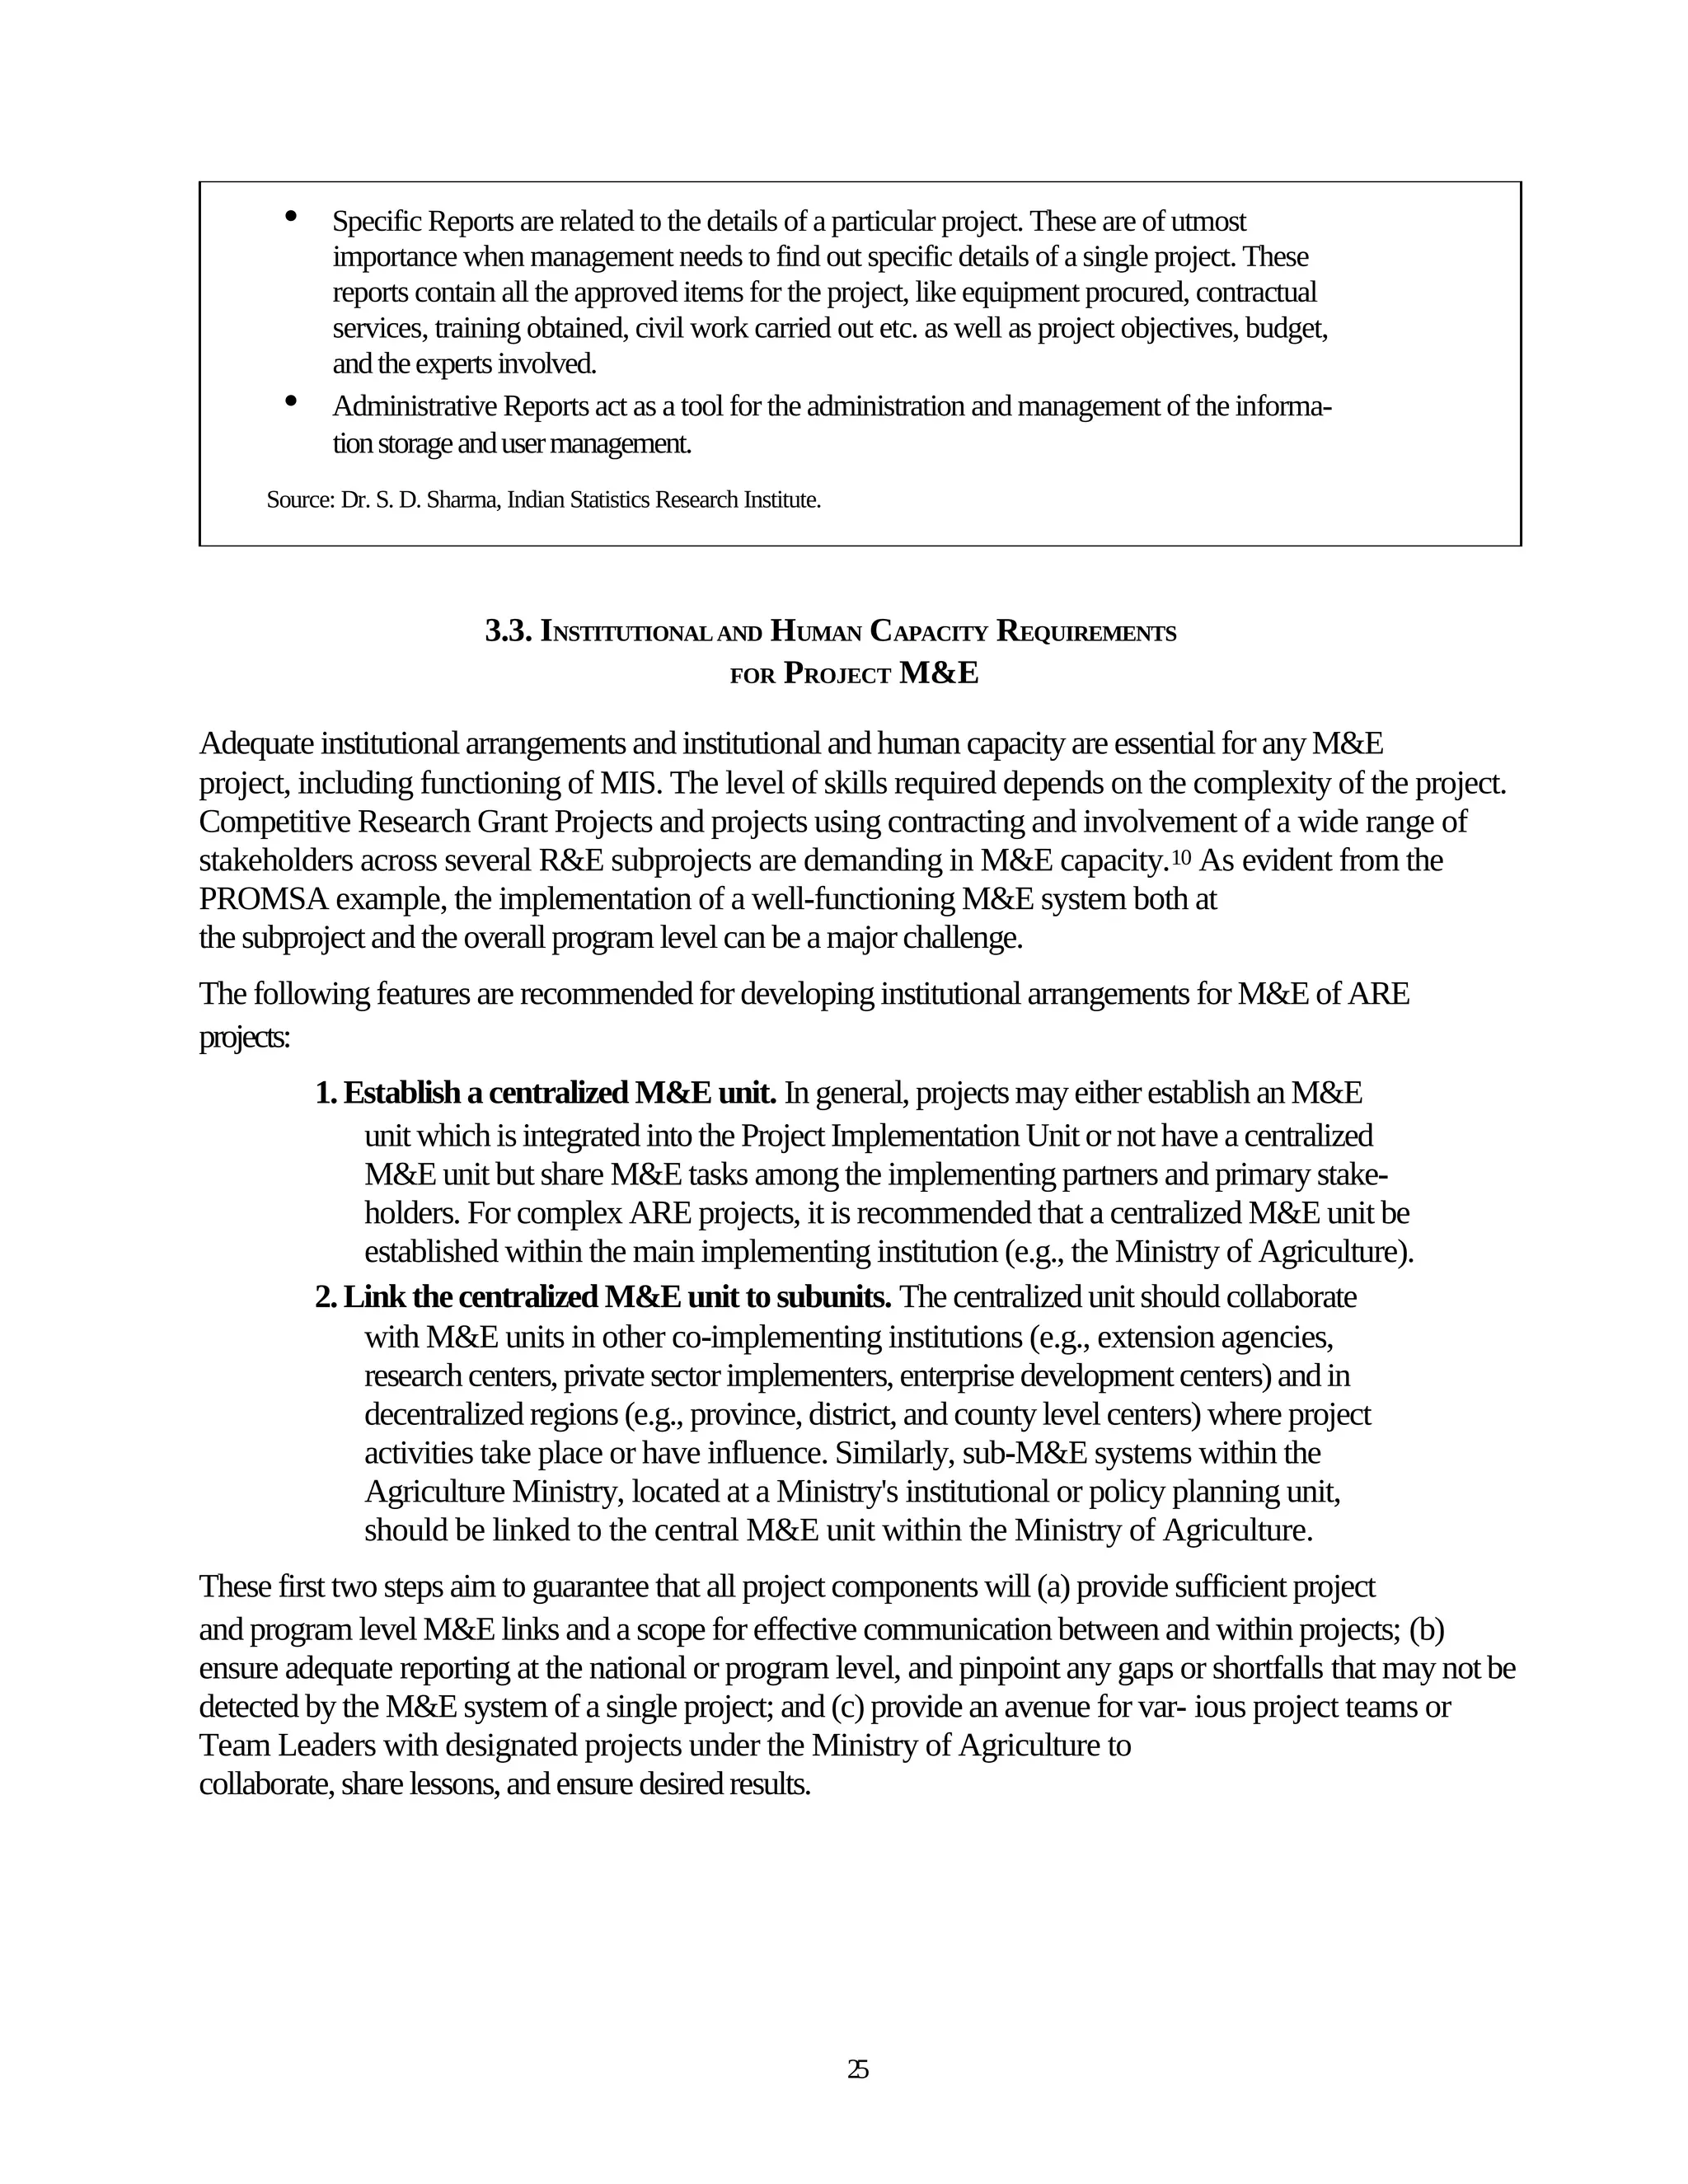
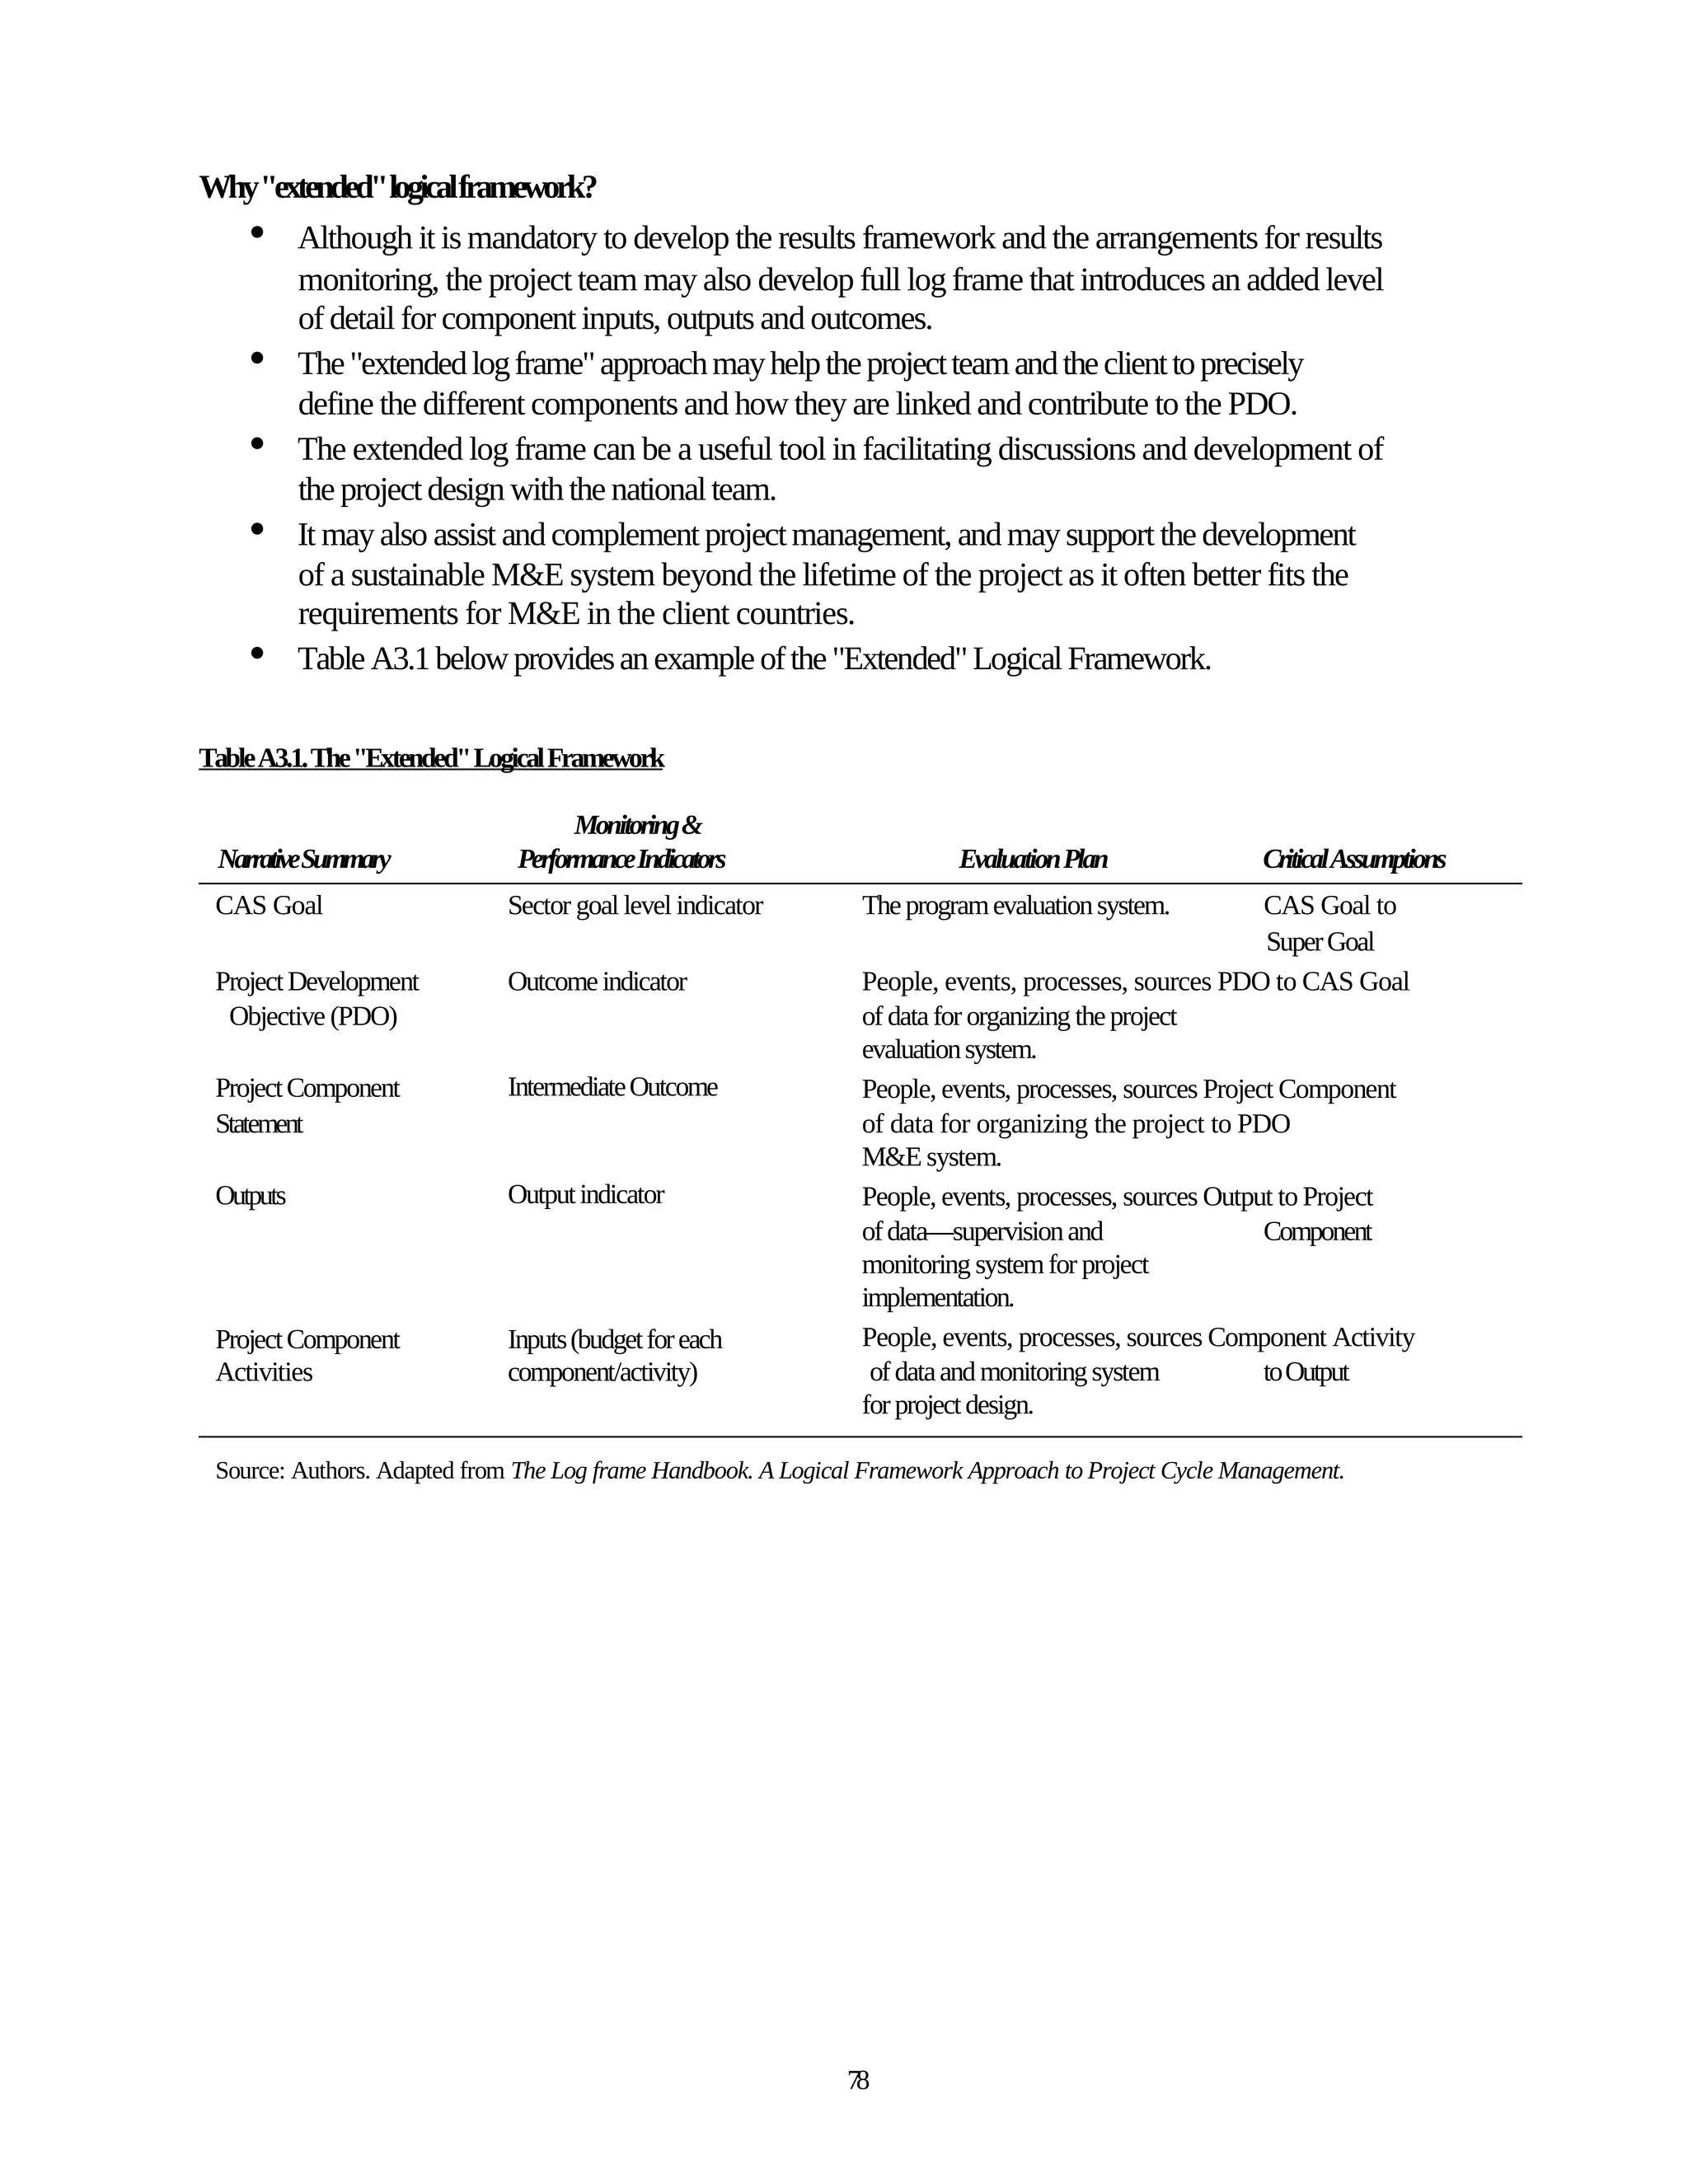
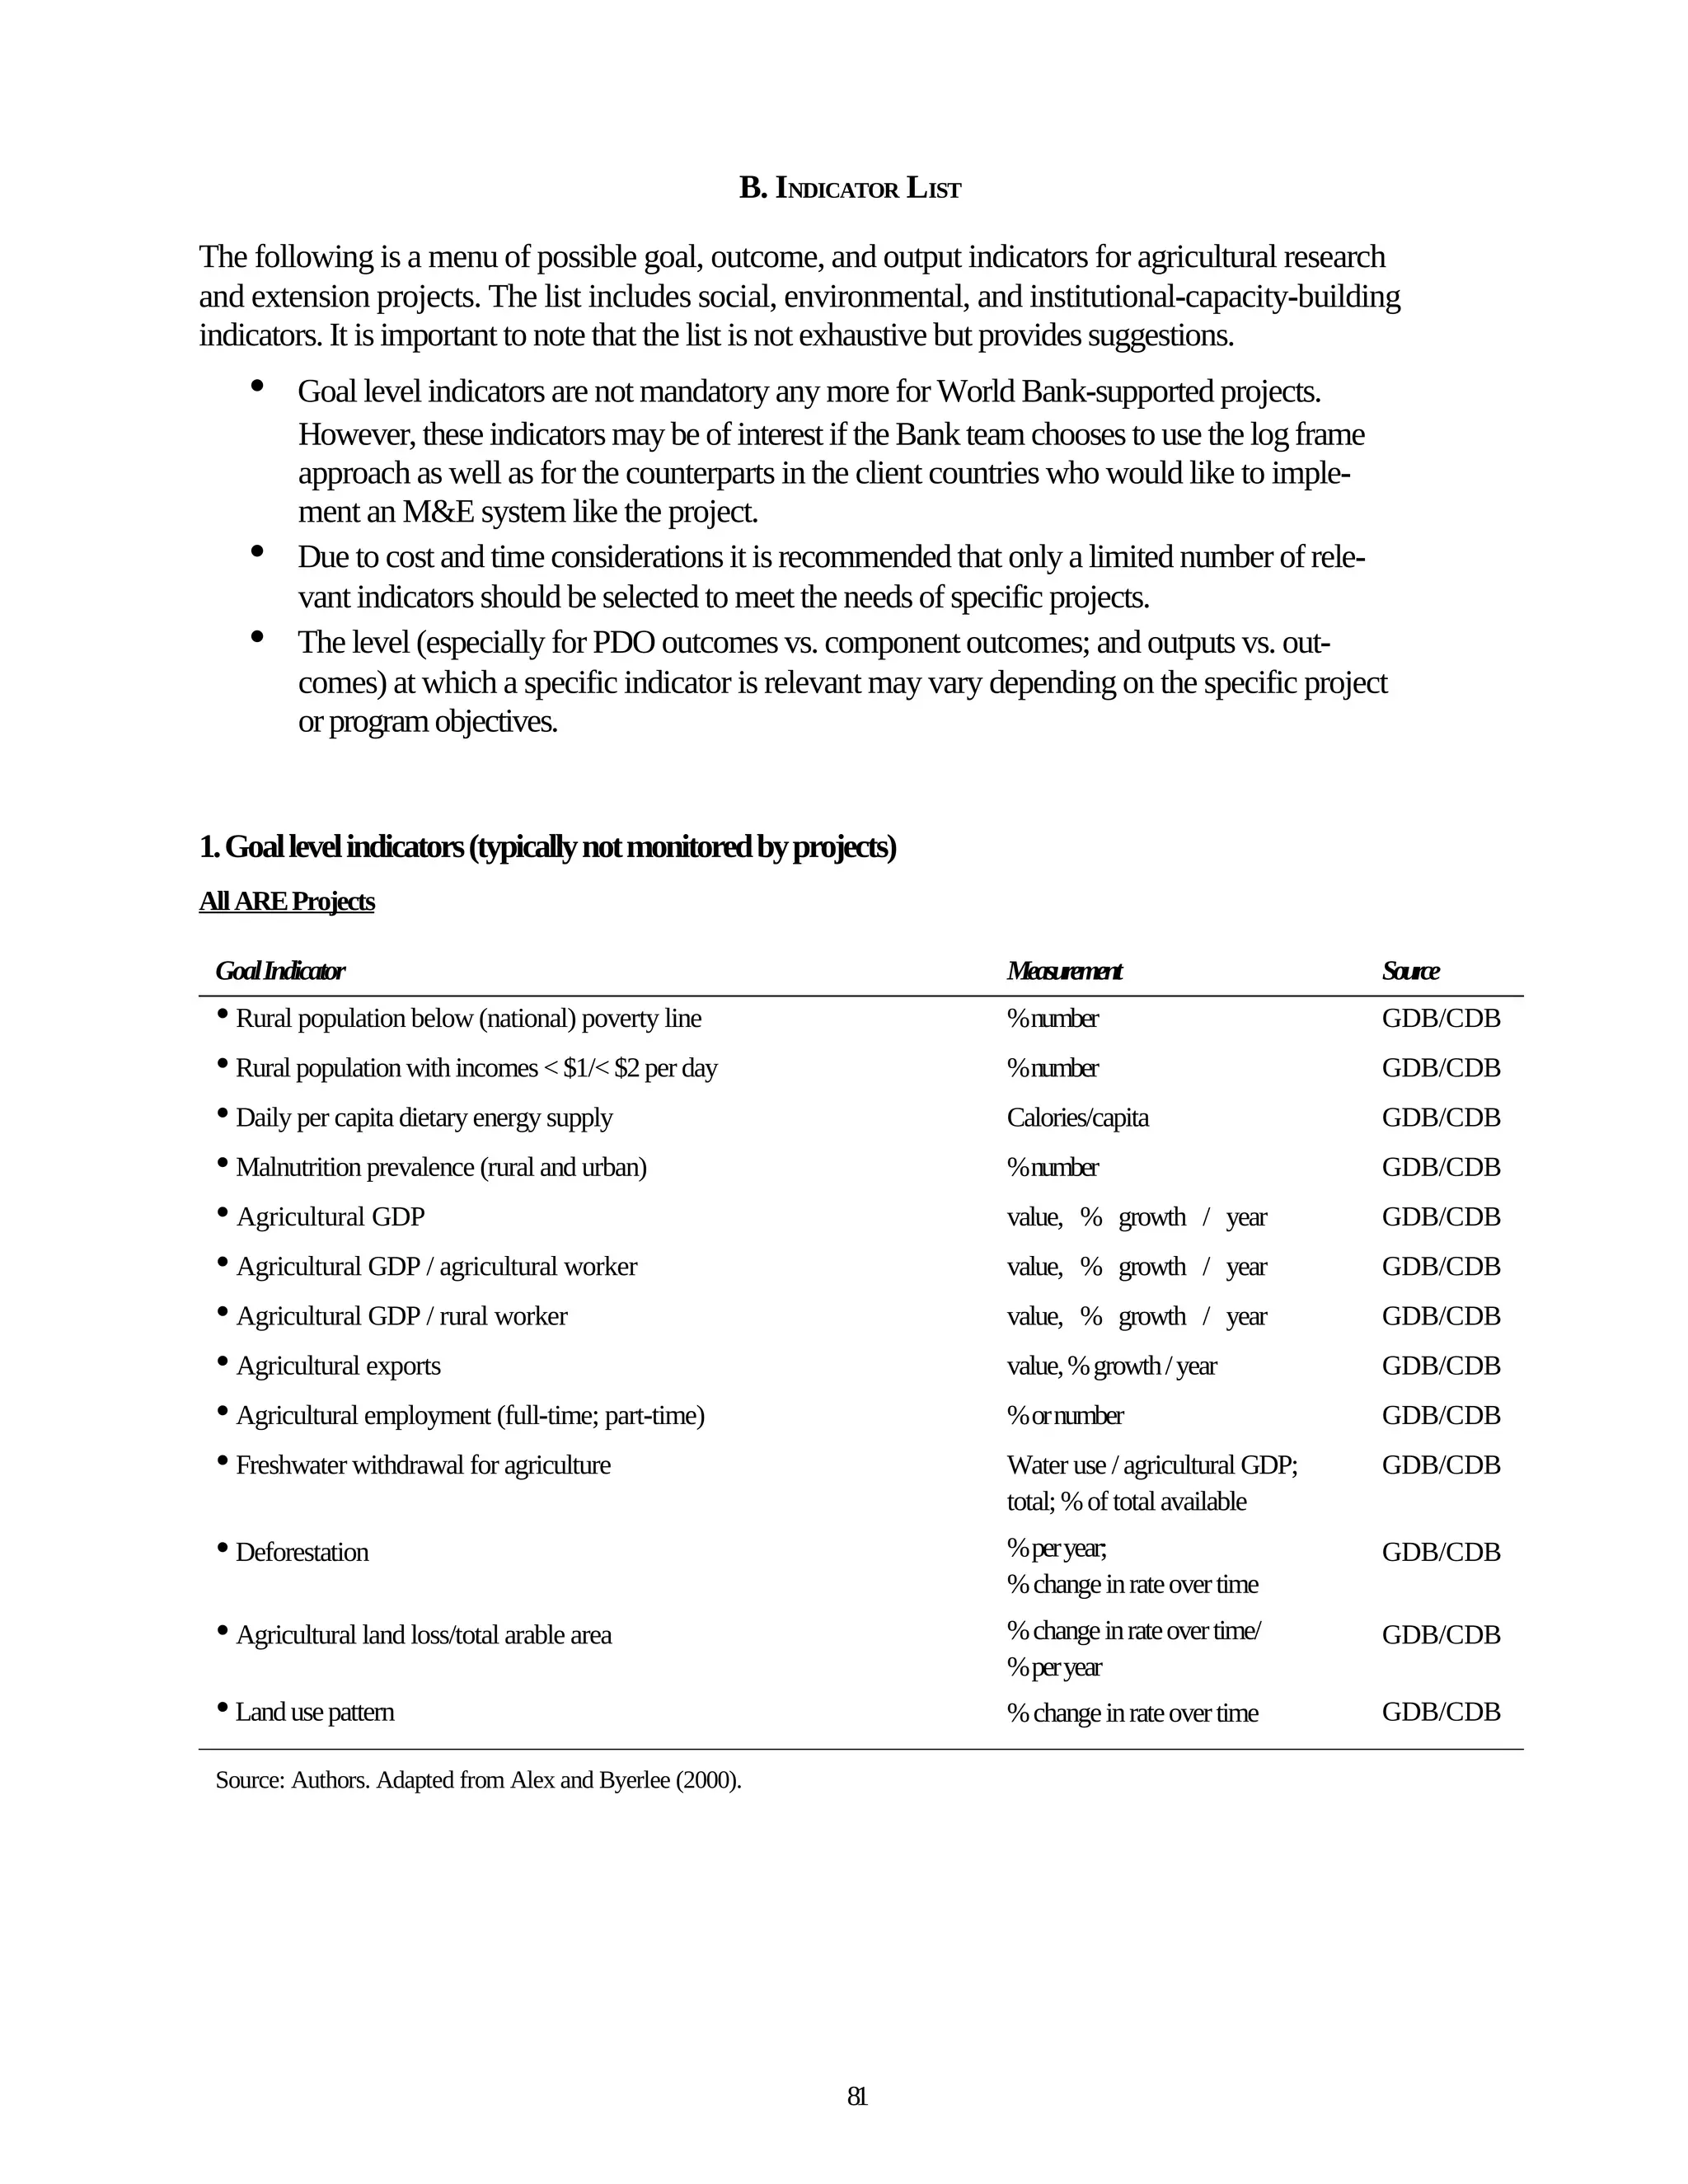
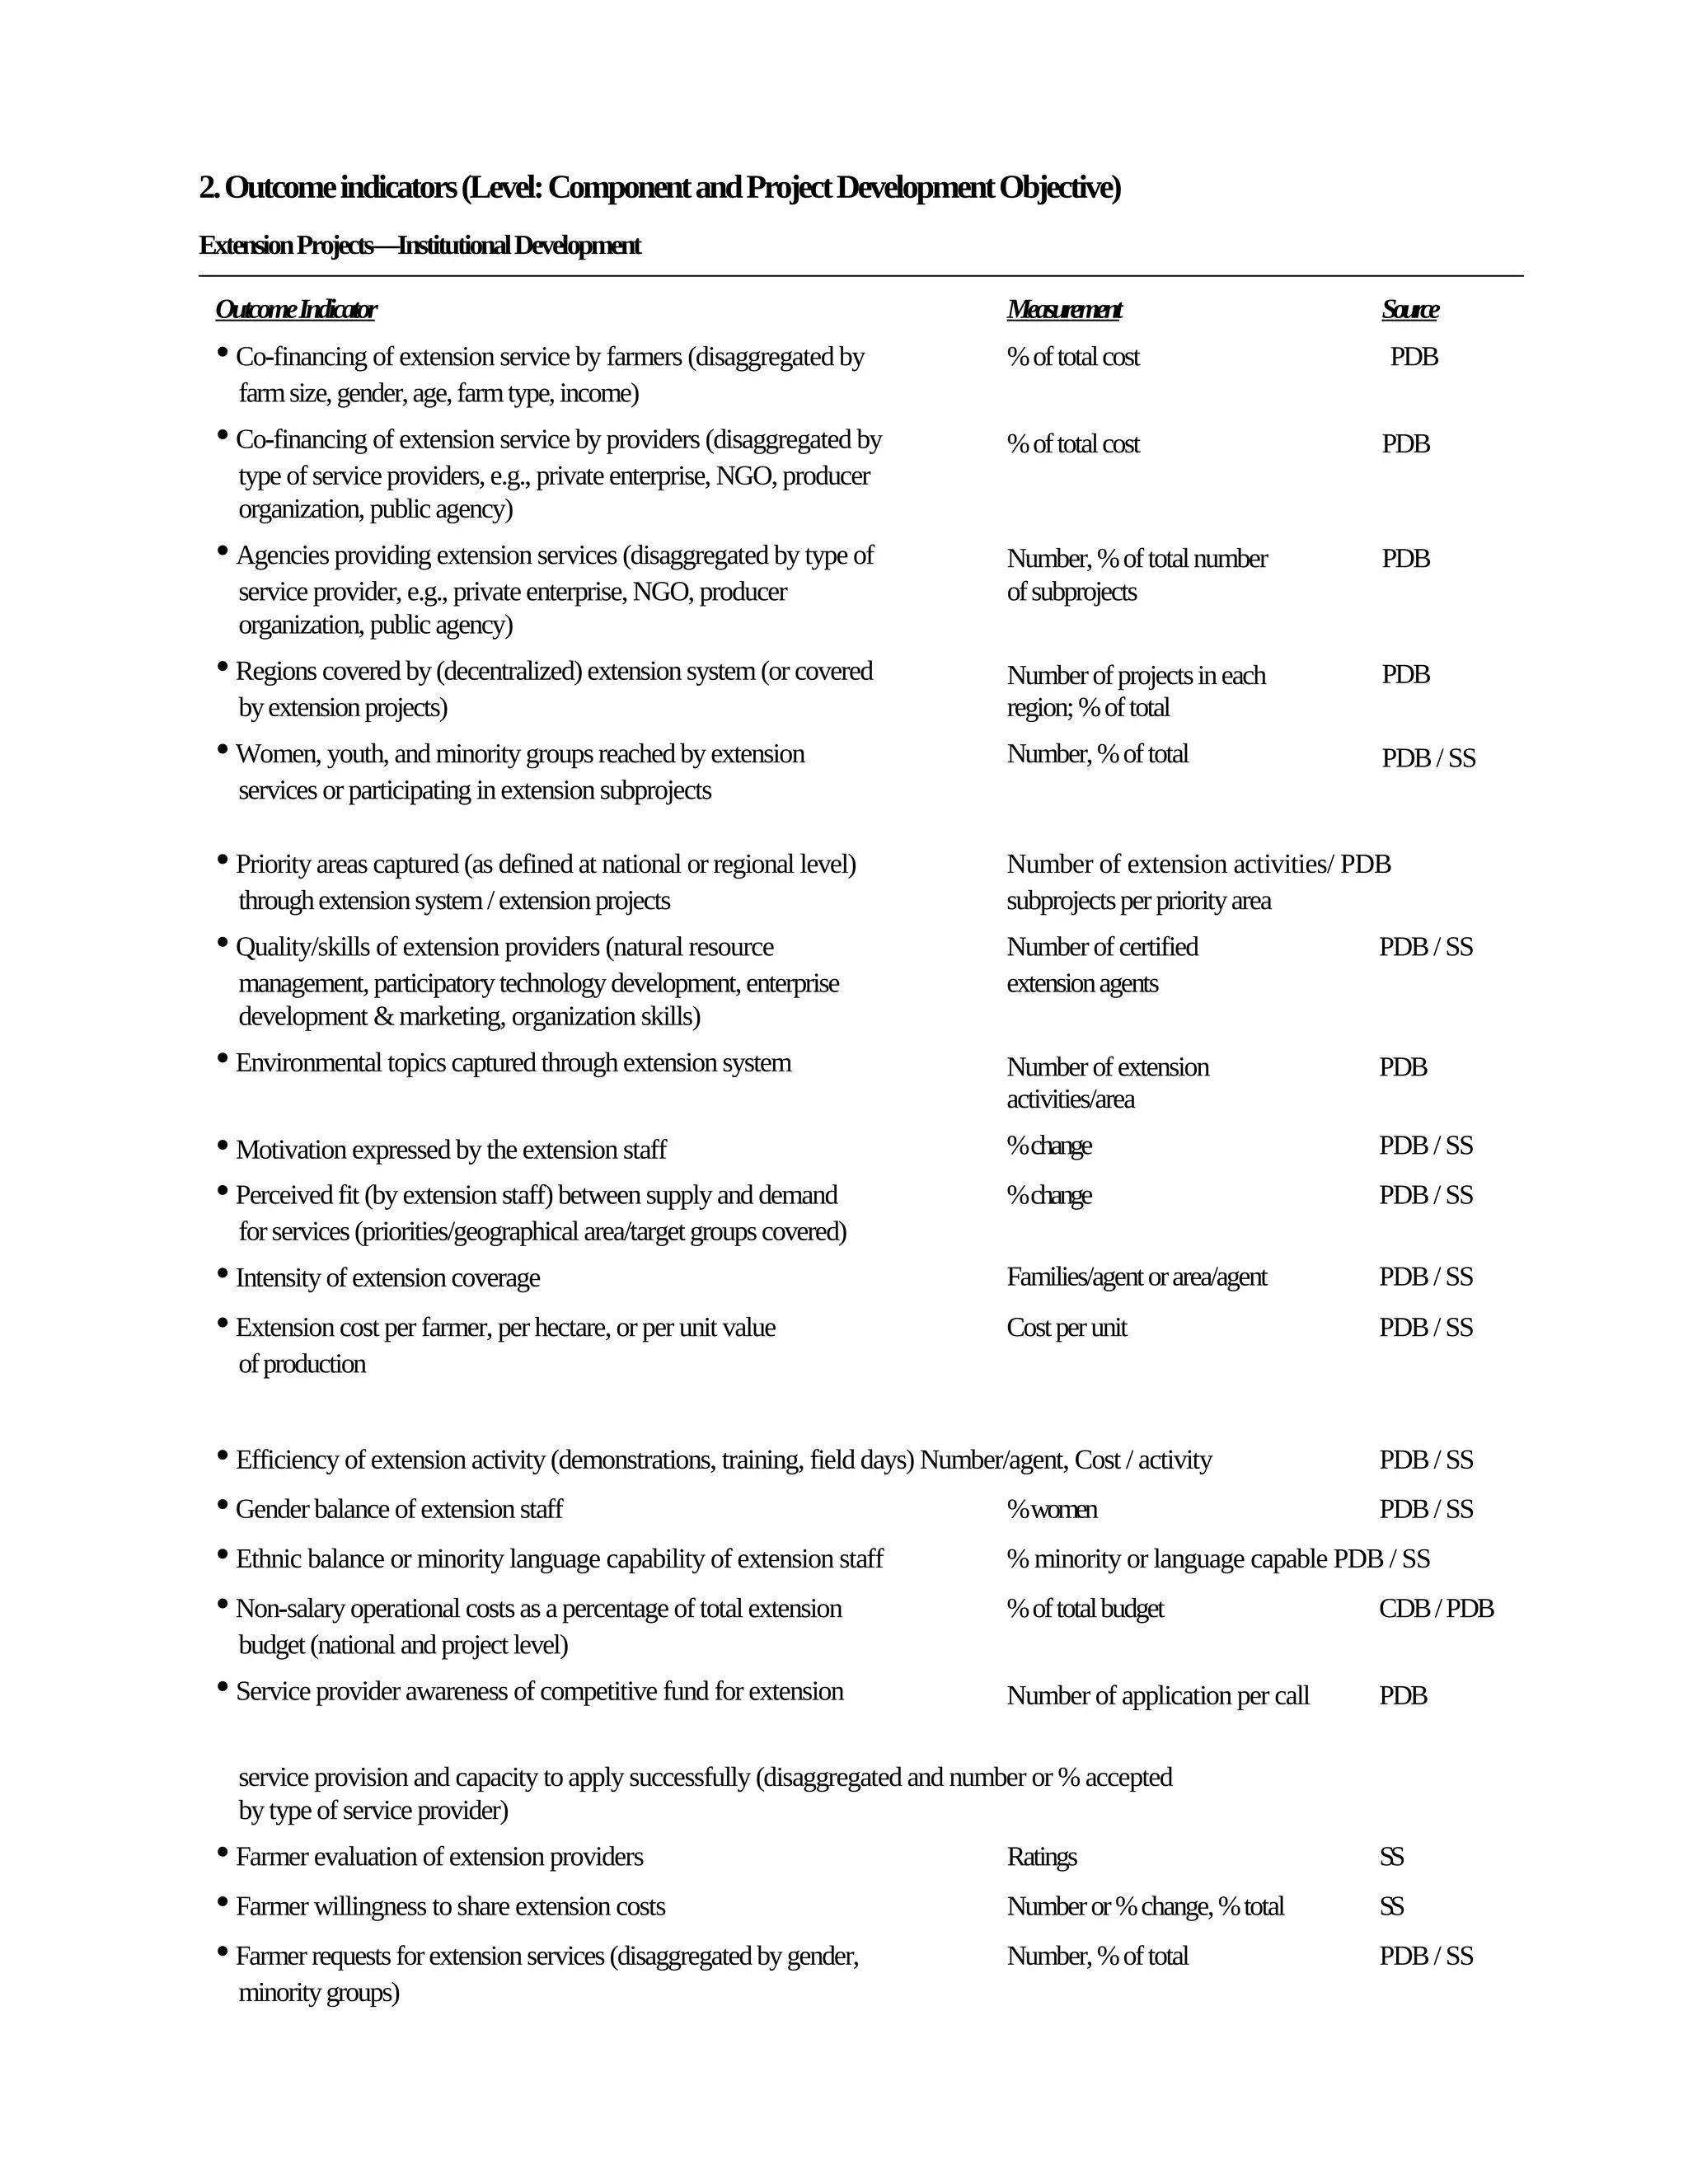

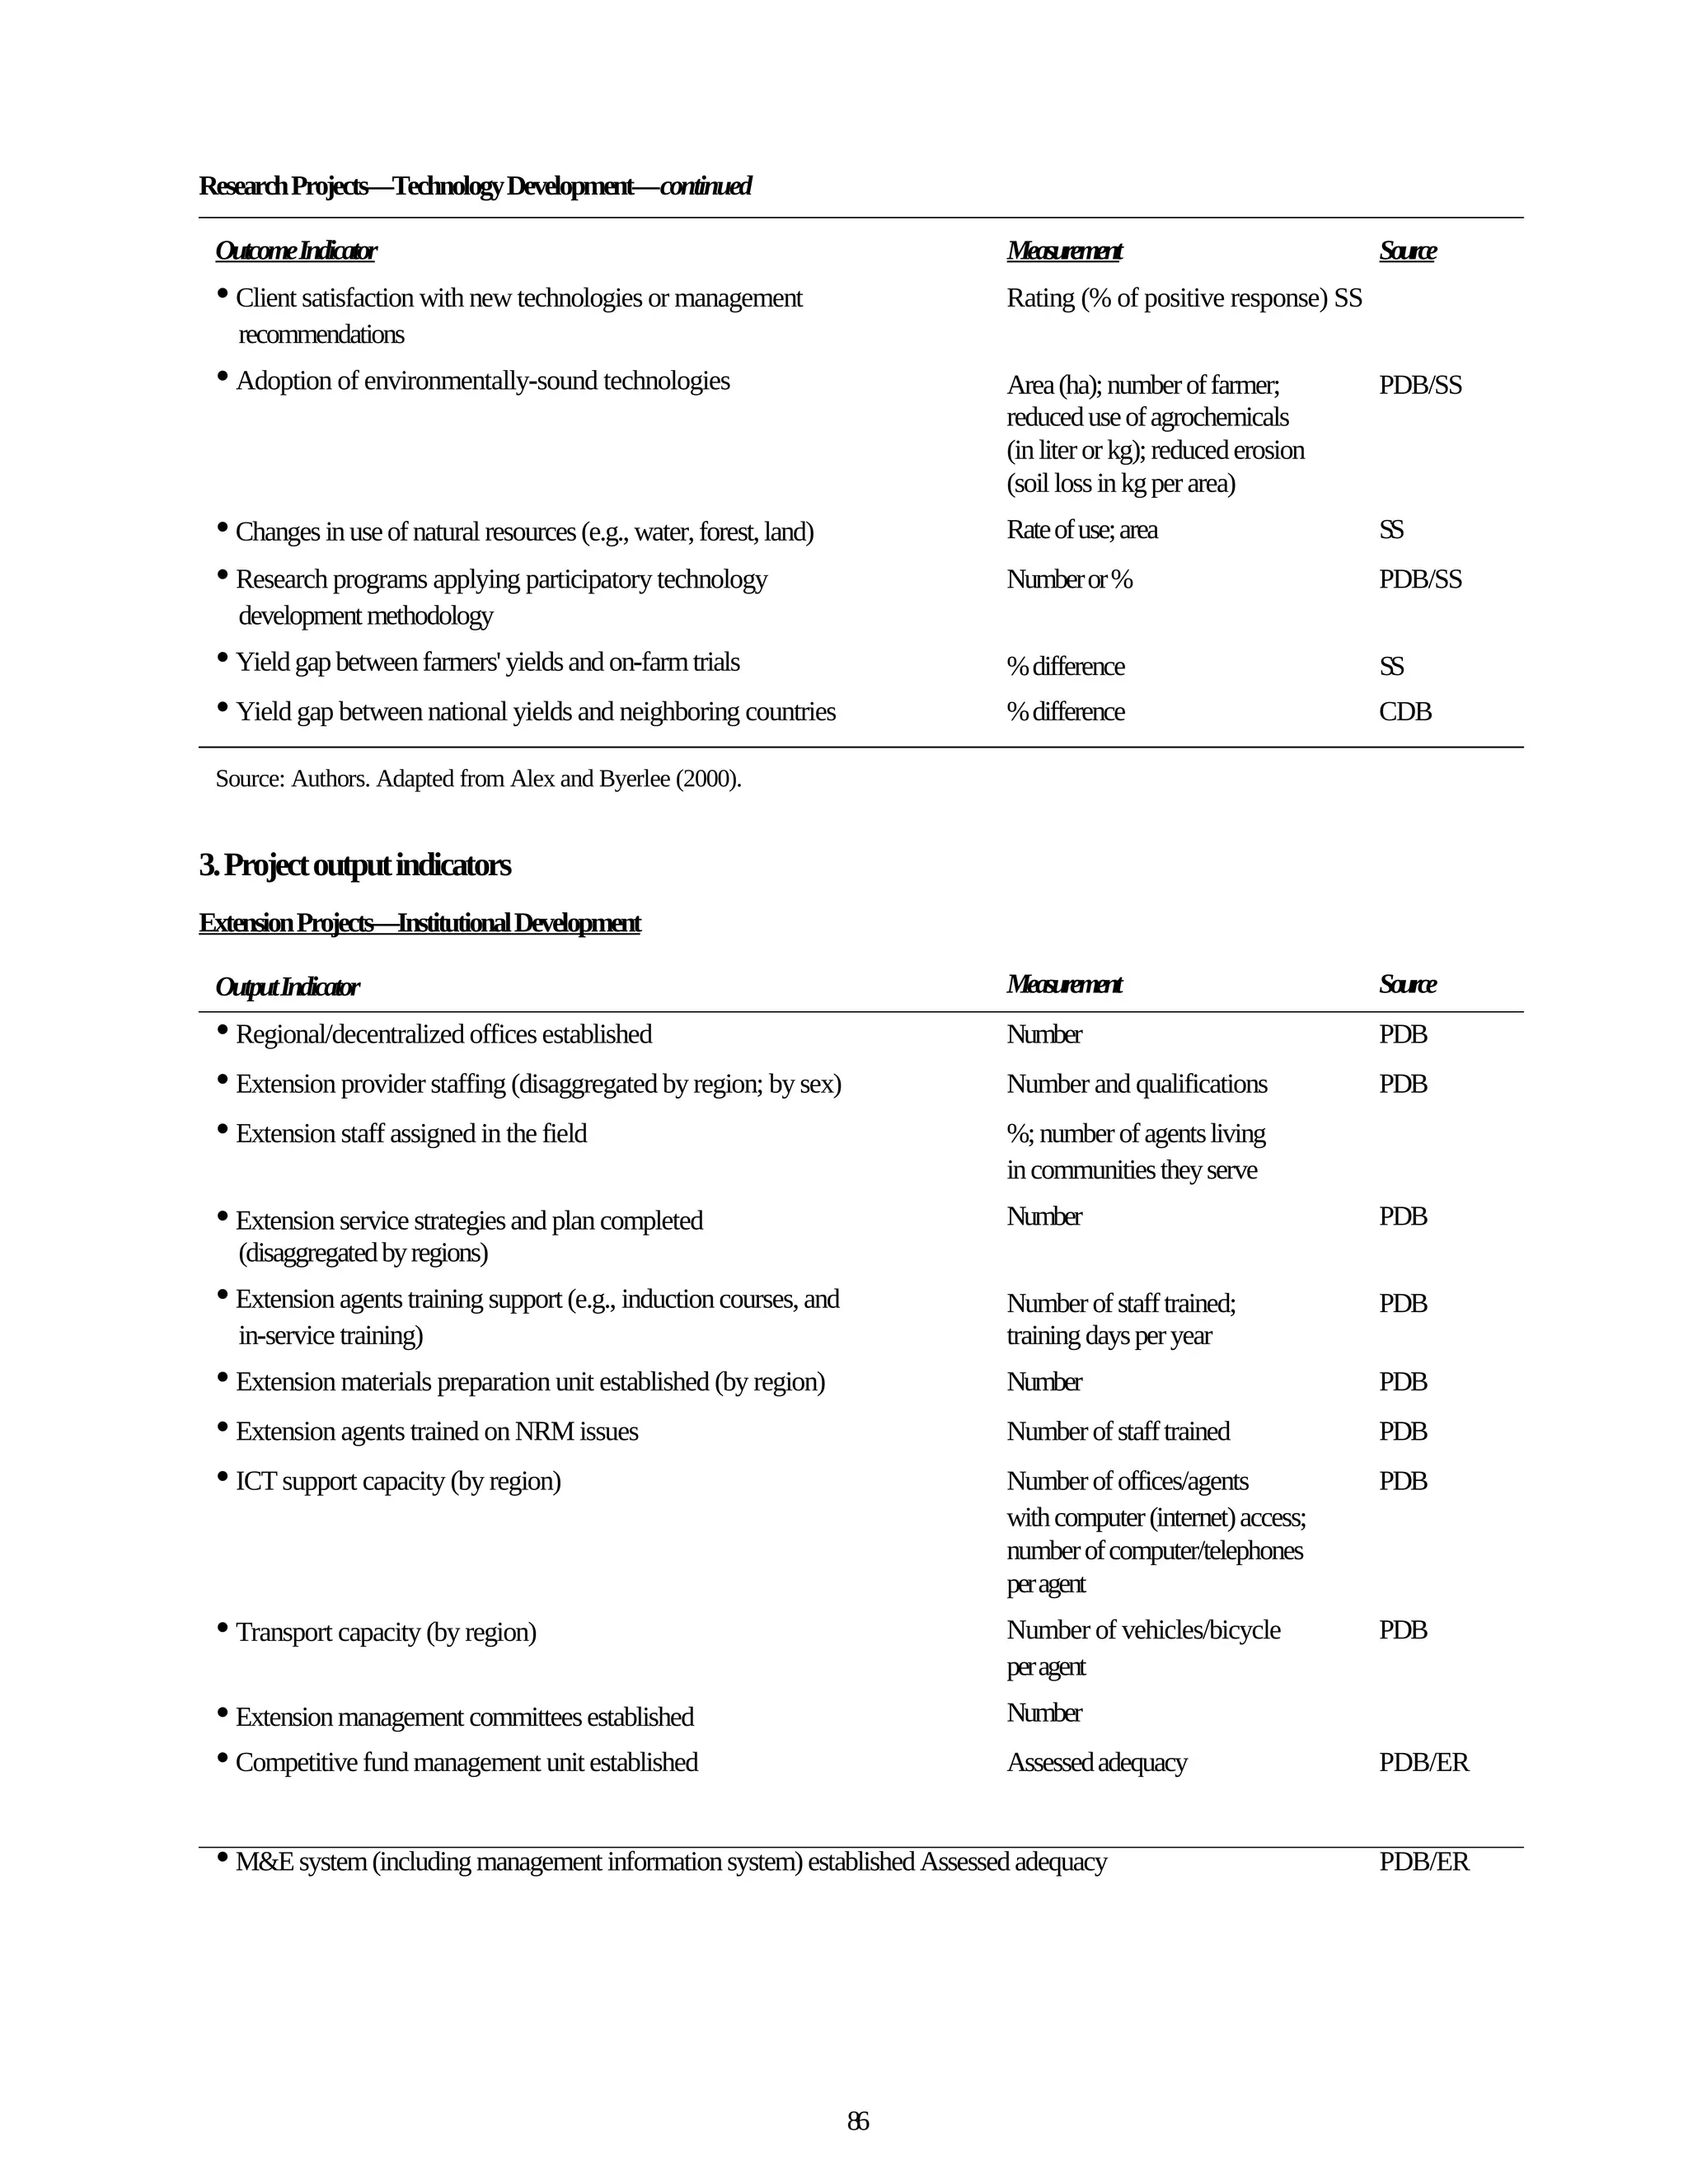
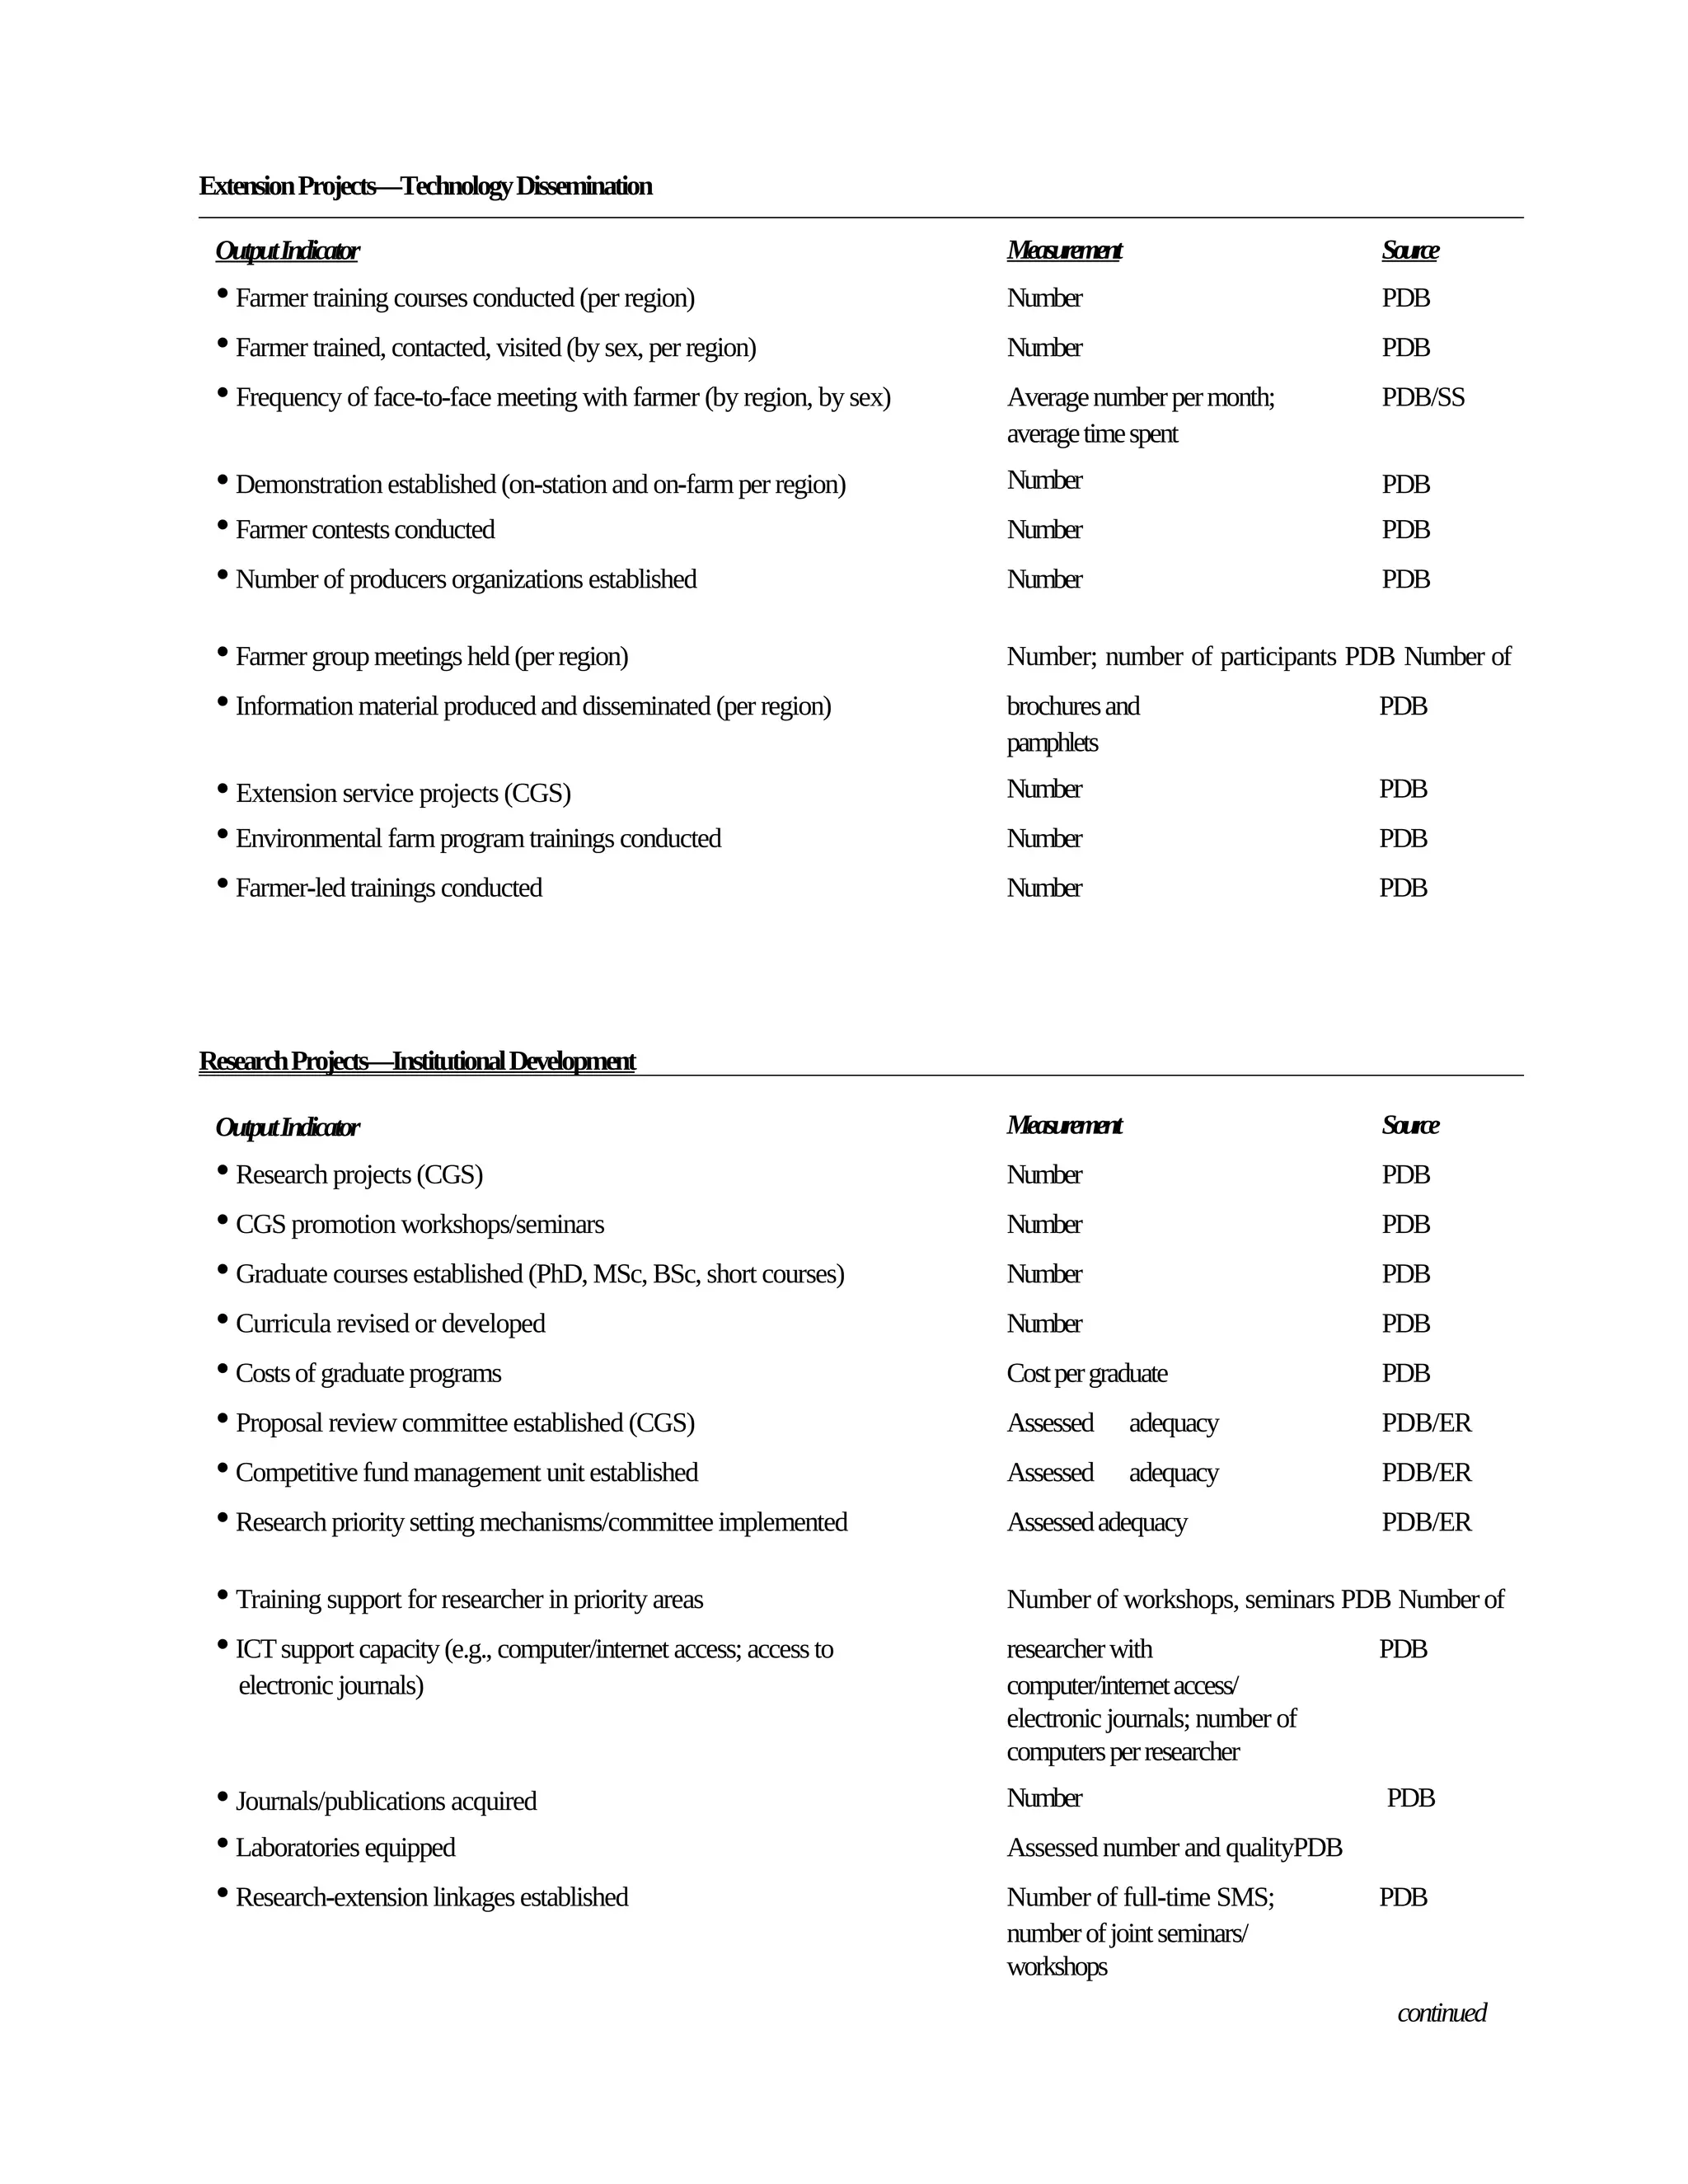

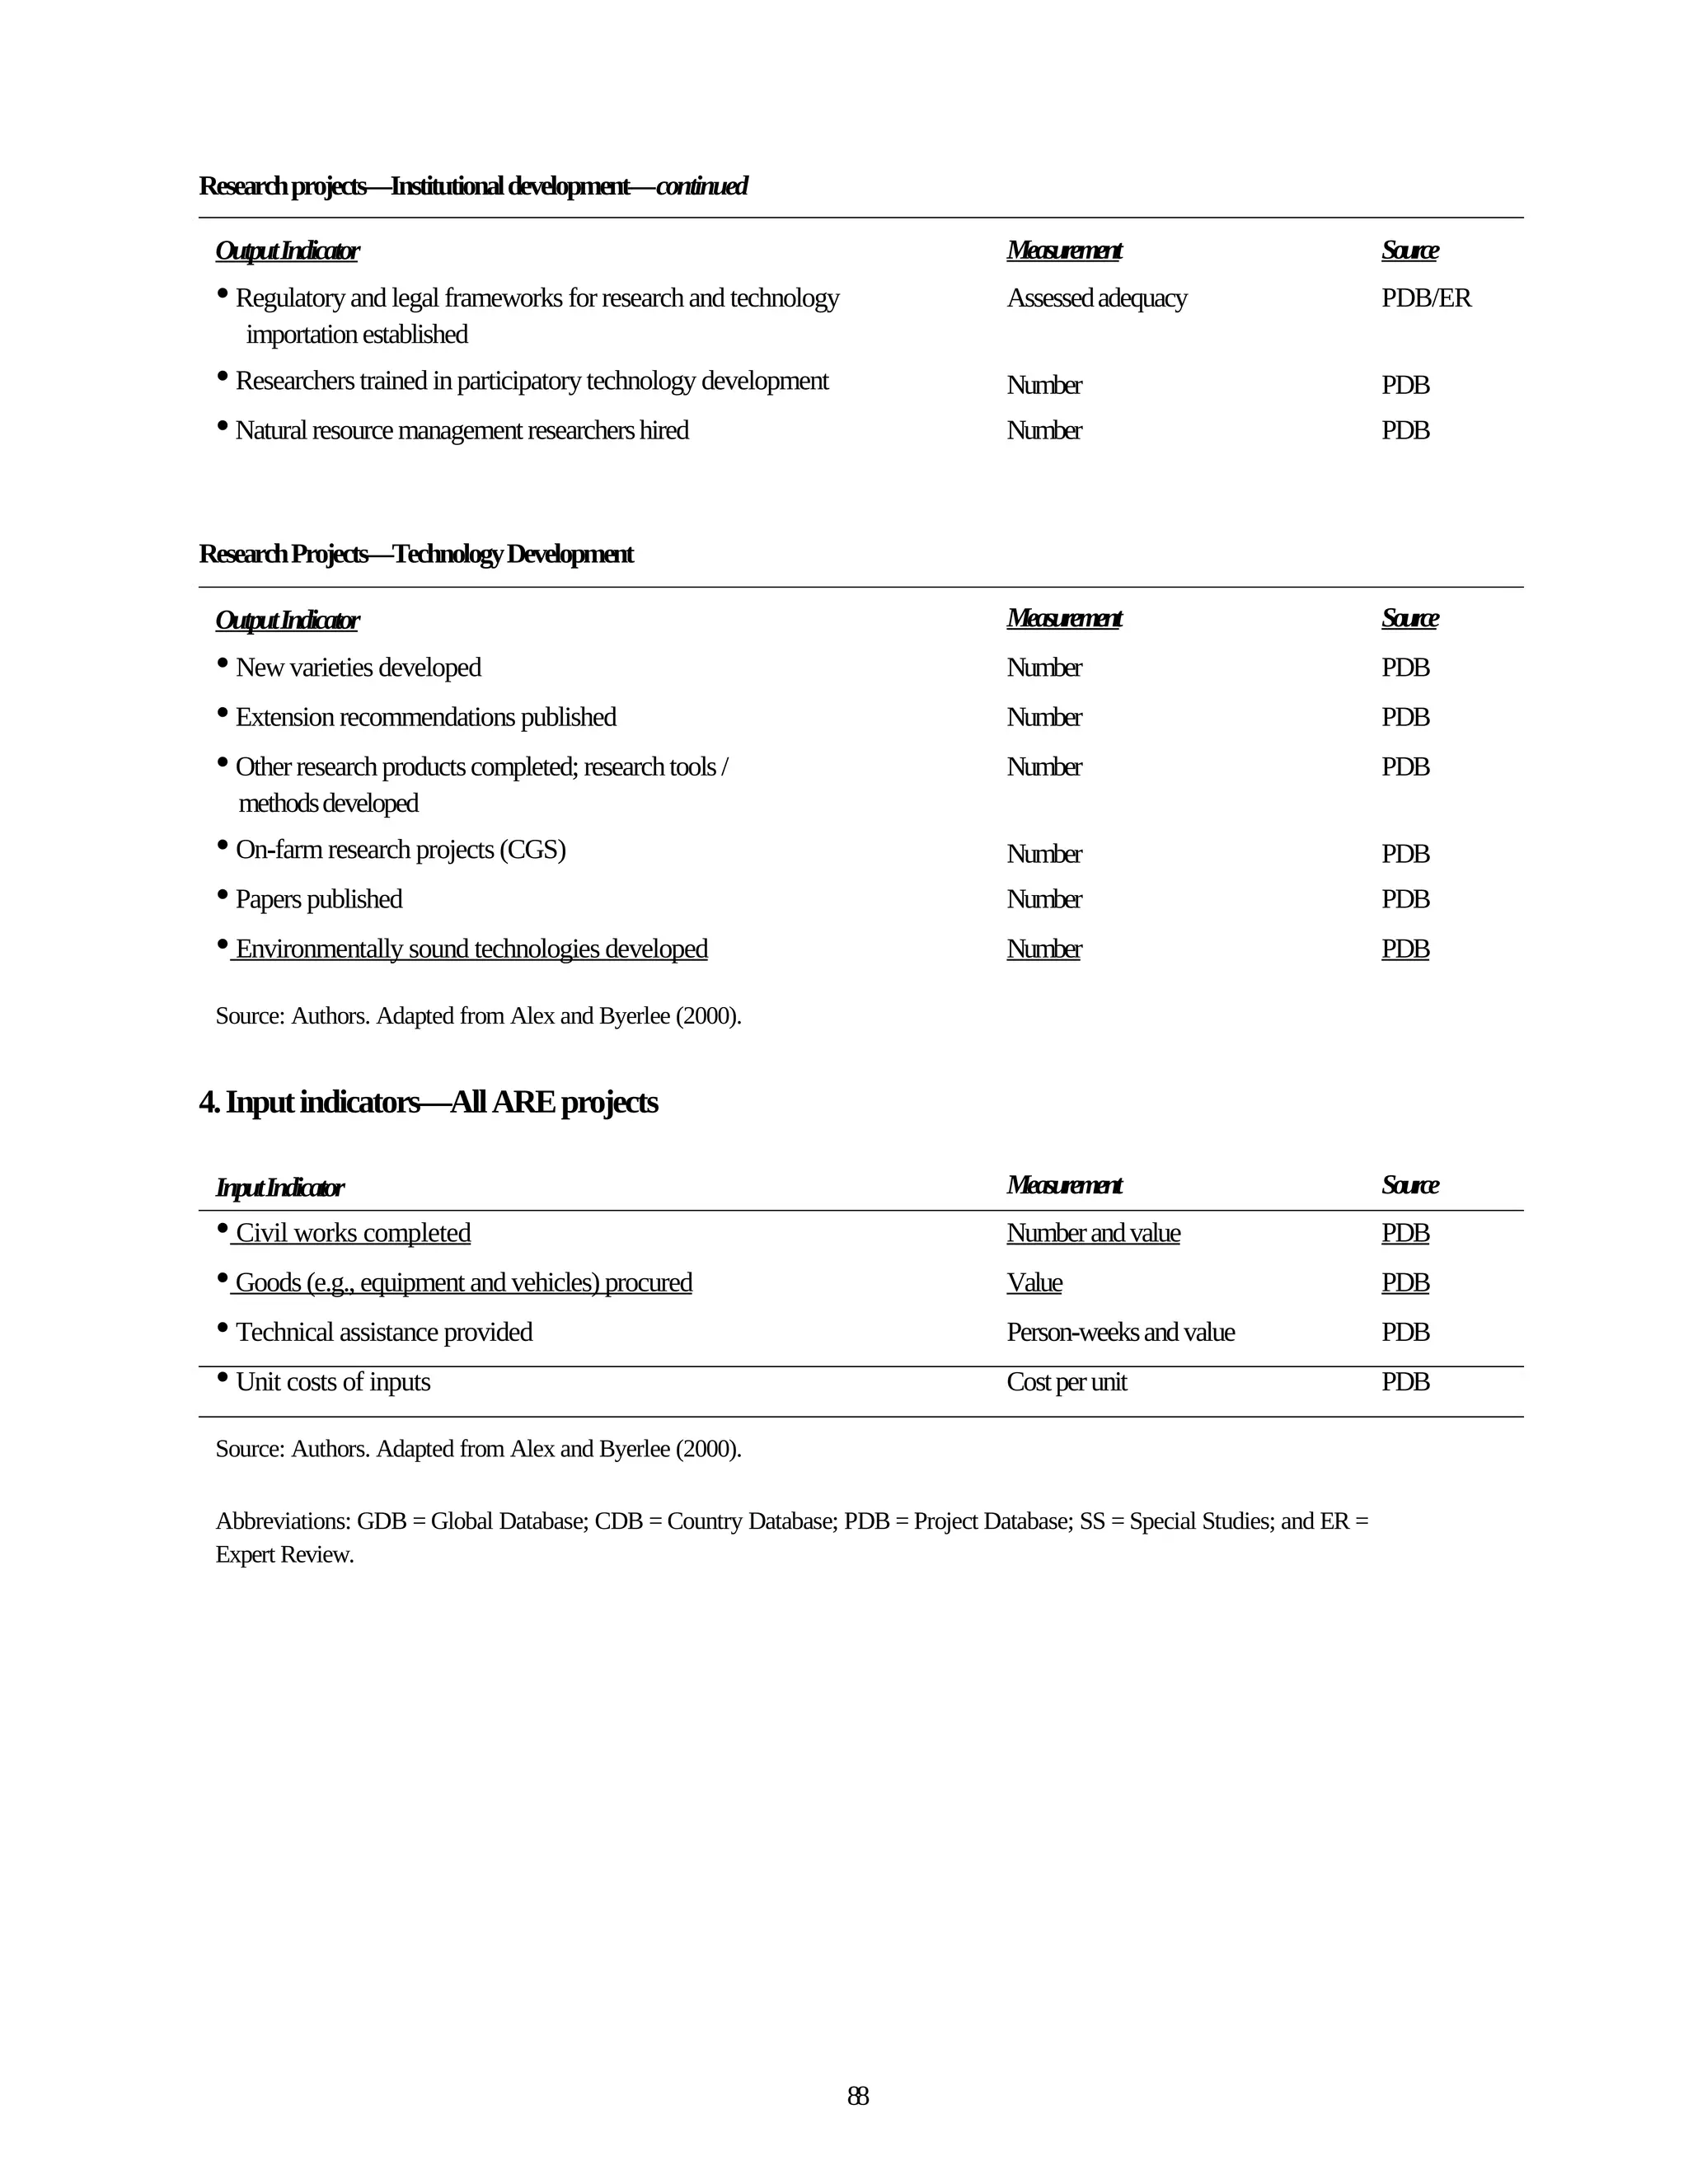


The document provides guidance on monitoring and evaluation (M&E) for World Bank agricultural research and extension projects. It discusses World Bank requirements for M&E, including developing a results framework with indicators. It also covers data collection, reporting, participatory M&E, evaluating outcomes and impact, and economic evaluation of competitive grant schemes. The goal is to establish effective M&E systems that generate high-quality data for learning and accountability.