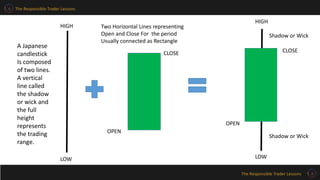
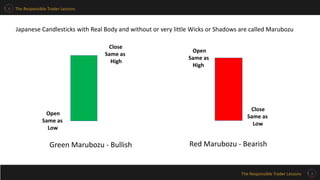
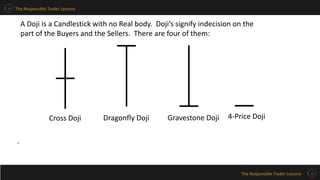
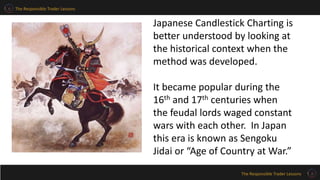
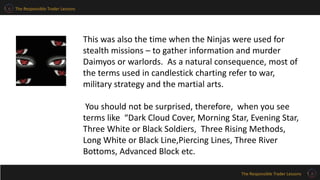
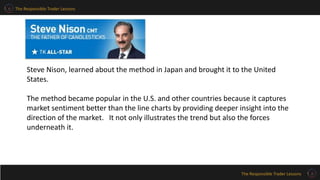
SlideShare a Scribd company logo
1 of 22
The Responsible Trader Lessons
The Responsible Trader’s - POV
Module 8 – Further Charting
The Responsible Trader Lessons
The Responsible Trader’s - POV
• The Responsible Trader's POV (Point of View).
• These are my notes, my own additional research and studies on the
Topic that I posted, and my personal observations and opinions that I
am sharing to further enhance our knowledge and understanding.
• Some of these were previously posted on “The Responsible Trader”
thread, Stock Market Pilipinas (www.stockmarketpilipinas.com). This
is the latest version of previous posts I made.
• Some of these plus further explanations and discussions will be
appearing in my forthcoming book “The Responsible Trader.”
The Responsible Trader Lessons
Our topic this week is a continuation of Module 2 –
Charting Basics where I suggested that you create your
own key words for remembering candlestick patterns.
Instead of doing a review of Module 7, let us go over what
we have learned so far about candlesticks.
Review of Module 2 – Charting Basics
The Responsible Trader Lessons
A Japanese
candlestick
Is composed
of two lines.
A vertical
line called
the shadow
or wick and
the full
height
represents
the trading
range.
HIGH
LOW
Two Horizontal Lines representing
Open and Close For the period
Usually connected as Rectangle
CLOSE
OPEN
Shadow or Wick
Shadow or Wick
HIGH
LOW
OPEN
CLOSE
The Responsible Trader Lessons
Japanese Candlesticks with Real Body and without or very little Wicks or Shadows are called Marubozu
Green Marubozu - Bullish Red Marubozu - Bearish
Close
Same as
High
Open
Same as
Low
Close
Same as
Low
Open
Same as
High
The Responsible Trader Lessons
A Doji is a Candlestick with no Real body. Doji’s signify indecision on the
part of the Buyers and the Sellers. There are four of them:
Cross Doji 4-Price DojiGravestone DojiDragonfly Doji
.
The Responsible Trader Lessons
Japanese Candlestick Charting is
better understood by looking at
the historical context when the
method was developed.
It became popular during the
16th and 17th centuries when
the feudal lords waged constant
wars with each other. In Japan
this era is known as Sengoku
Jidai or “Age of Country at War.”
The Responsible Trader Lessons
This was also the time when the Ninjas were used for
stealth missions – to gather information and murder
Daimyos or warlords. As a natural consequence, most of
the terms used in candlestick charting refer to war,
military strategy and the martial arts.
You should not be surprised, therefore, when you see
terms like “Dark Cloud Cover, Morning Star, Evening Star,
Three White or Black Soldiers, Three Rising Methods,
Long White or Black Line,Piercing Lines, Three River
Bottoms, Advanced Block etc.
The Responsible Trader Lessons
Steve Nison, learned about the method in Japan and brought it to the United
States.
The method became popular in the U.S. and other countries because it captures
market sentiment better than the line charts by providing deeper insight into the
direction of the market. It not only illustrates the trend but also the forces
underneath it.
The Responsible Trader Lessons
The most significant candlestick patterns have been thoroughly discussed in the
MCTA video so I will no longer discuss them here. I will just focus on some salient
points.
There are three simple rules in detecting candlestick patterns and determining
possible actions to be taken
1. Size – Larger candles play an important role when identifying patterns.
2. Shape – The shape of the candlestick or pattern determines the type of pattern
generated, the possible trading signal and the potential direction of the trend.
3. Location – The location of a candlestick pattern assists in determining the
possible trading signal. The location also determines what the pattern is called.
The Responsible Trader Lessons
1. Size – the larger and more solid the candles, the higher the sentiment
Increasing size of green candles
show bullish sentiment
Increasing size of red candles
show bearish sentiment
Charts courtesy of Amibroker Charting Software
The Responsible Trader Lessons
2. Shape – The shape of the candlestick or pattern determines the type of pattern
generated, the possible trading signal and the potential direction of the trend.
Bullish engulfing – a large green candle
engulfing a small red candle in a downtrend
Bearish engulfing – a large red candle
engulfing a small green candle in an uptrend
Charts courtesy of Amibroker Charting Software
The Responsible Trader Lessons
Single Candle Patterns – the Hammer and the Hanging Man – both have the same shape but their names
vary depending on their location.
Hammer in a Downtrend, a Reversal Signal A Hanging Man in an Uptrend, a Reversal Signal
3. Location – determines what the Pattern is called
Charts courtesy of Amibroker Charting Software
The Responsible Trader Lessons
Candlestick Addition
Just identify the open. Here since the first candle in the series is green, the open for the whole series is
the bottom of the first candle’s body. Then you identify the highest in the series and it becomes the high,
the lowest in the series becomes the low. Since the last candle in the series is green, the close for the
series is at the top of the last candle’s body. The result is a green Marubozu with a small wick or shadow.
You can easily convert a series of candles into one. Below is an example for a series of
candles from a 30-minute chart of DNL from COL’s trading platform.
The Responsible Trader Lessons
Candlestick Reading
In the absence of additional information , you can read a candlestick by starting with the open and ending with the close.
Where you go after the open depends on the color of the candle. If the candle is green you go to the highest price in the
trading range then proceed to the lowest of the trading range and vice versa. The candle we saw in the last slide is read
as follows:
1) Opened at 16.12
2) Buyers bought it as
High as 16.32
3) Sellers sold it as
Low as 16.12 same as open
4) But buyers were eventually
able to close it a16.30 showing that
Buyers are in control
DATA:
Open 16.12
High 16.32
Low 16.12
Close 16.30
The Responsible Trader Lessons
1. Candlesticks should be used together with other forms of technical analysis, trendlines, support
and resistance.
2. Candlesticks should be used in connection with clear trends, whether uptrend or downtrend. The
candlestick patterns are not useful in a sideways market.
3. The more agreement between signals (candle patterns and technical analysis) the more likely the
reversal.
4. The candle line shows the force behind each move, as well as the price.
5. The candlestick pattern requires both the shape and the trend.
6. A candlestick pattern alone is not justification for a new trade.
7. Candlesticks do not give price targets.
8. Set stop loss levels by other means and know when you are wrong and must exit the trade.
Principles to be observed when using Japanese Candlesticks
The Responsible Trader Lessons
Point and Figure Chart On a Point and figure chart, day-to-day price
movements are plotted without taking into
consideration the passage of time. Point and figure
charts are composed of a number of columns that
either consist of a series of stacked X's or O's. A
column of X's is used to illustrate a rising price,
while O's represent a falling price. As you can see
from the chart on the left, this type of chart is
used to filter out non-significant price movements,
and enables the trader to easily determine critical
support and resistance levels. Traders will place
orders when the price moves beyond identified
support/resistance levels.
The Responsible Trader Lessons
Candle Volume Chart
CandleVolume charts merge volume into
candlesticks. This allows chartists to analyze both
price action and volume with one look at the
price chart.
The charts show candlestick patterns as well as
classical chart patterns, such as triangles and
wedges, to generate signals.
Charts courtesy of StockCharts.com
The Responsible Trader Lessons
Three Line Break
Three Line Break charts ignore time and only change when prices move a certain
amount. In this regard, these charts are quite similar to Point & Figure charts.
Three Line Break charts show a series of vertical white and black lines. White lines
represent rising prices, while black lines portray falling prices. Prices continue in the
same direction until a reversal is warranted. A reversal occurs when the closing
price exceeds the high or low of the prior two lines.
Charts courtesy of StockCharts.com
The Responsible Trader Lessons
Renko Invented in Japan, Renko charts ignore time and focus solely on
price changes that meet a minimum requirement. The chart got its
name from the Japanese word for bricks, "renga".
A renko chart is constructed by placing a brick in the next column
once the price surpasses the top or bottom of the previous brick by
a predefined amount. White bricks are used when the direction of
the trend is up, while black bricks are used when the trend is
down. This type of chart is very effective for traders to identify key
support/resistance levels. Transaction signals are generated when
the direction of the trend changes and the bricks alternate colors.
In this regard, these charts are quite similar to Point & Figure
charts. Instead of X-Columns and O-Columns, Renko charts use
price “bricks” that represent a fixed price move.
The Responsible Trader Lessons
Kagi The Kagi is a type of chart developed by the Japanese in
the 1870s that uses a series of vertical lines to illustrate
general levels of supply and demand for certain assets.
Thick lines are drawn when the price of the underlying
asset breaks above the previous high price and is
interpreted as an increase in demand for the asset. Thin
lines are used to represent increased supply when the
price falls below the previous low.
An entry signal is triggered when the vertical line changes
from thin to thick and is not reversed until the thick line
changes back to thin.
The Responsible Trader Lessons
For your information, in connection with my Advocacy, Responsible Trading, I have established the
following in order to reach out to you more effectively and serve you better.
Please visit, like and share:
My Blog:http://www.theresponsibletrader.com– where I write and share lessons on trading and my
thoughts about trading in particular and life in general
My Facebook Page: https://www.facebook.com/theresponsibletrader – where I share what’s on my
mind and make posts to groups where I am a member of
My YouTube Channel: https://www.youtube.com/theresponsibletrader – where you can view and
download my TRT-POV (The Responsible Trader’s Point of View) and other videos I intend to make
My Slideshare: http://www.slideshare.net/TheResponsibleTrader – where you can view and download
copy of the Powerpoint Presentation of my TRT-POV (The Responsible Trader’s Point of View) and other
presentations I intend to make

More Related Content

What's hot

Profit From Pullback Trading
Profit From Pullback TradingProfit From Pullback Trading
Profit From Pullback TradingNetpicksTrading
 
mastering-candlestick-charts-part-i
mastering-candlestick-charts-part-imastering-candlestick-charts-part-i
mastering-candlestick-charts-part-iBoyEnvi BoyEnvi
 
50 DAY SIMPLE MOVING AVERAGE
50 DAY SIMPLE MOVING AVERAGE50 DAY SIMPLE MOVING AVERAGE
50 DAY SIMPLE MOVING AVERAGENetpicksTrading
 
May 20 I Session 1 I GBIH
May 20 I Session 1 I GBIHMay 20 I Session 1 I GBIH
May 20 I Session 1 I GBIHGBIHSupport
 
My Personal Forex Trading Plan
My Personal Forex Trading PlanMy Personal Forex Trading Plan
My Personal Forex Trading PlanRuben Topaz
 
What are Key Chart Levels and How to Trade Them
What are Key Chart Levels and How to Trade ThemWhat are Key Chart Levels and How to Trade Them
What are Key Chart Levels and How to Trade Them My Trading Skills
 
Doji Candlestick Trading
Doji Candlestick TradingDoji Candlestick Trading
Doji Candlestick TradingInvestingTips
 
The Most Profitable Forex and Stock Chart Patterns
The Most Profitable Forex and Stock Chart PatternsThe Most Profitable Forex and Stock Chart Patterns
The Most Profitable Forex and Stock Chart PatternsSyrous Pejman
 

What's hot (20)

Profit From Pullback Trading
Profit From Pullback TradingProfit From Pullback Trading
Profit From Pullback Trading
 
mastering-candlestick-charts-part-i
mastering-candlestick-charts-part-imastering-candlestick-charts-part-i
mastering-candlestick-charts-part-i
 
50 DAY SIMPLE MOVING AVERAGE
50 DAY SIMPLE MOVING AVERAGE50 DAY SIMPLE MOVING AVERAGE
50 DAY SIMPLE MOVING AVERAGE
 
Trading plan
Trading planTrading plan
Trading plan
 
May 20 I Session 1 I GBIH
May 20 I Session 1 I GBIHMay 20 I Session 1 I GBIH
May 20 I Session 1 I GBIH
 
Ichimoku
IchimokuIchimoku
Ichimoku
 
My Personal Forex Trading Plan
My Personal Forex Trading PlanMy Personal Forex Trading Plan
My Personal Forex Trading Plan
 
Meetup Slides for May 13, 2019
Meetup Slides for May 13, 2019Meetup Slides for May 13, 2019
Meetup Slides for May 13, 2019
 
What are Key Chart Levels and How to Trade Them
What are Key Chart Levels and How to Trade ThemWhat are Key Chart Levels and How to Trade Them
What are Key Chart Levels and How to Trade Them
 
The 3 duck's trading system.
The 3 duck's trading system.The 3 duck's trading system.
The 3 duck's trading system.
 
Ai1 october 30 17
Ai1 october 30 17Ai1 october 30 17
Ai1 october 30 17
 
Meetup Slides for July 8, 2019
Meetup Slides for July 8, 2019Meetup Slides for July 8, 2019
Meetup Slides for July 8, 2019
 
Star ticker
Star tickerStar ticker
Star ticker
 
Doji Candlestick Trading
Doji Candlestick TradingDoji Candlestick Trading
Doji Candlestick Trading
 
The Most Profitable Forex and Stock Chart Patterns
The Most Profitable Forex and Stock Chart PatternsThe Most Profitable Forex and Stock Chart Patterns
The Most Profitable Forex and Stock Chart Patterns
 
Meetup Slides for May 20, 2019
Meetup Slides for May 20, 2019Meetup Slides for May 20, 2019
Meetup Slides for May 20, 2019
 
Meetup Slides for July 14, 2019
Meetup Slides for July 14, 2019Meetup Slides for July 14, 2019
Meetup Slides for July 14, 2019
 
Meetup Slides for June 16, 2019
Meetup Slides for June 16, 2019Meetup Slides for June 16, 2019
Meetup Slides for June 16, 2019
 
Meetup Slides for May 27, 2019
Meetup Slides for May 27, 2019Meetup Slides for May 27, 2019
Meetup Slides for May 27, 2019
 
Meetup Slides for August 18, 2019
Meetup Slides for August 18, 2019Meetup Slides for August 18, 2019
Meetup Slides for August 18, 2019
 

Viewers also liked

Src presentation technical trading systems in forex
Src presentation   technical trading systems in forexSrc presentation   technical trading systems in forex
Src presentation technical trading systems in forexCelticaces
 
Module 9 - Elliott Waves and Cycles of Time
Module 9 - Elliott Waves and Cycles of TimeModule 9 - Elliott Waves and Cycles of Time
Module 9 - Elliott Waves and Cycles of TimeThe Responsible Trader
 
ES Daytrading Presentation
ES Daytrading PresentationES Daytrading Presentation
ES Daytrading PresentationCelticaces
 
Basic candlestick pattern
Basic candlestick patternBasic candlestick pattern
Basic candlestick patternJahangir Alam
 
Candlestick charting basics steve nison
Candlestick charting basics   steve nisonCandlestick charting basics   steve nison
Candlestick charting basics steve nisonsrinivas raju k
 
Five Part Daytrading
Five Part DaytradingFive Part Daytrading
Five Part Daytradingaccsnet1
 
Module 1 - Technical Analysis and the Dow Theory
Module 1 - Technical Analysis  and the Dow TheoryModule 1 - Technical Analysis  and the Dow Theory
Module 1 - Technical Analysis and the Dow TheoryThe Responsible Trader
 

Viewers also liked (7)

Src presentation technical trading systems in forex
Src presentation   technical trading systems in forexSrc presentation   technical trading systems in forex
Src presentation technical trading systems in forex
 
Module 9 - Elliott Waves and Cycles of Time
Module 9 - Elliott Waves and Cycles of TimeModule 9 - Elliott Waves and Cycles of Time
Module 9 - Elliott Waves and Cycles of Time
 
ES Daytrading Presentation
ES Daytrading PresentationES Daytrading Presentation
ES Daytrading Presentation
 
Basic candlestick pattern
Basic candlestick patternBasic candlestick pattern
Basic candlestick pattern
 
Candlestick charting basics steve nison
Candlestick charting basics   steve nisonCandlestick charting basics   steve nison
Candlestick charting basics steve nison
 
Five Part Daytrading
Five Part DaytradingFive Part Daytrading
Five Part Daytrading
 
Module 1 - Technical Analysis and the Dow Theory
Module 1 - Technical Analysis  and the Dow TheoryModule 1 - Technical Analysis  and the Dow Theory
Module 1 - Technical Analysis and the Dow Theory
 

Similar to Module 8 - Further Charting

What are the candlesticks telling you
What are the candlesticks telling youWhat are the candlesticks telling you
What are the candlesticks telling youChris Nice
 
How to read japanese candlesticks
How to read japanese candlesticksHow to read japanese candlesticks
How to read japanese candlesticksJustForex
 
Mindfluential Trading (Session 1)....pdf
Mindfluential Trading (Session 1)....pdfMindfluential Trading (Session 1)....pdf
Mindfluential Trading (Session 1)....pdfKanifDukarePatil
 
The candlestick trading bible(1)
The candlestick trading bible(1)The candlestick trading bible(1)
The candlestick trading bible(1)Ashley915859
 
Candle stick bible
Candle stick bibleCandle stick bible
Candle stick bibleChris134449
 
Candlestick patterns in Share market trading
Candlestick patterns in Share market tradingCandlestick patterns in Share market trading
Candlestick patterns in Share market tradingTraders Mantra
 
Best 30 Candlestick Pattern You Should Have To Know
Best 30 Candlestick Pattern You Should Have To KnowBest 30 Candlestick Pattern You Should Have To Know
Best 30 Candlestick Pattern You Should Have To KnowStockia
 
How to Trade Chart Patterns with Target and SL@forexgdp.com.pdf
How to Trade Chart Patterns with Target and SL@forexgdp.com.pdfHow to Trade Chart Patterns with Target and SL@forexgdp.com.pdf
How to Trade Chart Patterns with Target and SL@forexgdp.com.pdfmillatbd
 
Technical Analysis of the Stock market- Traders Mantra
Technical Analysis of the Stock market- Traders MantraTechnical Analysis of the Stock market- Traders Mantra
Technical Analysis of the Stock market- Traders MantraTraders Mantra
 
Portfolio - Technical Analysis
Portfolio - Technical Analysis Portfolio - Technical Analysis
Portfolio - Technical Analysis Kannan Knight
 
May 27 I Session 2 I GBIH
May 27 I Session 2 I GBIHMay 27 I Session 2 I GBIH
May 27 I Session 2 I GBIHGBIHSupport
 
Classical Methods - Chapter 26 - Part I - Japanese Candle Stick Pattern - Bas...
Classical Methods - Chapter 26 - Part I - Japanese Candle Stick Pattern - Bas...Classical Methods - Chapter 26 - Part I - Japanese Candle Stick Pattern - Bas...
Classical Methods - Chapter 26 - Part I - Japanese Candle Stick Pattern - Bas...Professional Training Academy
 
A fundamental study on Technical Analysis
A fundamental study on Technical AnalysisA fundamental study on Technical Analysis
A fundamental study on Technical AnalysisJay Sadhwani
 
Understanding Candlestick Charting To Assess Prevailing Market Forces
Understanding Candlestick Charting To Assess Prevailing Market ForcesUnderstanding Candlestick Charting To Assess Prevailing Market Forces
Understanding Candlestick Charting To Assess Prevailing Market ForcesGlobal Trading Tools
 
Technical Analysis.pdf
Technical Analysis.pdfTechnical Analysis.pdf
Technical Analysis.pdfSachin Kumar
 
Forex Trading - How to Create a Trading Strategy
Forex Trading - How to Create a Trading StrategyForex Trading - How to Create a Trading Strategy
Forex Trading - How to Create a Trading StrategyBlueMax Capital
 
Forex Trading - How to Create a Trading Strategy | Different Candle Stick Pat...
Forex Trading - How to Create a Trading Strategy | Different Candle Stick Pat...Forex Trading - How to Create a Trading Strategy | Different Candle Stick Pat...
Forex Trading - How to Create a Trading Strategy | Different Candle Stick Pat...BlueMax Capital
 
May 26 I Session 2 I GBIH
May 26 I Session 2 I GBIHMay 26 I Session 2 I GBIH
May 26 I Session 2 I GBIHGBIHSupport
 

Similar to Module 8 - Further Charting (20)

What are the candlesticks telling you
What are the candlesticks telling youWhat are the candlesticks telling you
What are the candlesticks telling you
 
How to read japanese candlesticks
How to read japanese candlesticksHow to read japanese candlesticks
How to read japanese candlesticks
 
Mindfluential Trading (Session 1)....pdf
Mindfluential Trading (Session 1)....pdfMindfluential Trading (Session 1)....pdf
Mindfluential Trading (Session 1)....pdf
 
The candlestick trading bible(1)
The candlestick trading bible(1)The candlestick trading bible(1)
The candlestick trading bible(1)
 
Candle stick bible
Candle stick bibleCandle stick bible
Candle stick bible
 
Basic Technical Analysis
Basic Technical AnalysisBasic Technical Analysis
Basic Technical Analysis
 
Candlestick patterns in Share market trading
Candlestick patterns in Share market tradingCandlestick patterns in Share market trading
Candlestick patterns in Share market trading
 
Best 30 Candlestick Pattern You Should Have To Know
Best 30 Candlestick Pattern You Should Have To KnowBest 30 Candlestick Pattern You Should Have To Know
Best 30 Candlestick Pattern You Should Have To Know
 
How to Trade Chart Patterns with Target and SL@forexgdp.com.pdf
How to Trade Chart Patterns with Target and SL@forexgdp.com.pdfHow to Trade Chart Patterns with Target and SL@forexgdp.com.pdf
How to Trade Chart Patterns with Target and SL@forexgdp.com.pdf
 
Technical Analysis of the Stock market- Traders Mantra
Technical Analysis of the Stock market- Traders MantraTechnical Analysis of the Stock market- Traders Mantra
Technical Analysis of the Stock market- Traders Mantra
 
Portfolio - Technical Analysis
Portfolio - Technical Analysis Portfolio - Technical Analysis
Portfolio - Technical Analysis
 
May 27 I Session 2 I GBIH
May 27 I Session 2 I GBIHMay 27 I Session 2 I GBIH
May 27 I Session 2 I GBIH
 
Classical Methods - Chapter 26 - Part I - Japanese Candle Stick Pattern - Bas...
Classical Methods - Chapter 26 - Part I - Japanese Candle Stick Pattern - Bas...Classical Methods - Chapter 26 - Part I - Japanese Candle Stick Pattern - Bas...
Classical Methods - Chapter 26 - Part I - Japanese Candle Stick Pattern - Bas...
 
A fundamental study on Technical Analysis
A fundamental study on Technical AnalysisA fundamental study on Technical Analysis
A fundamental study on Technical Analysis
 
Understanding Candlestick Charting To Assess Prevailing Market Forces
Understanding Candlestick Charting To Assess Prevailing Market ForcesUnderstanding Candlestick Charting To Assess Prevailing Market Forces
Understanding Candlestick Charting To Assess Prevailing Market Forces
 
Crypto Currencyy.pdf
Crypto Currencyy.pdfCrypto Currencyy.pdf
Crypto Currencyy.pdf
 
Technical Analysis.pdf
Technical Analysis.pdfTechnical Analysis.pdf
Technical Analysis.pdf
 
Forex Trading - How to Create a Trading Strategy
Forex Trading - How to Create a Trading StrategyForex Trading - How to Create a Trading Strategy
Forex Trading - How to Create a Trading Strategy
 
Forex Trading - How to Create a Trading Strategy | Different Candle Stick Pat...
Forex Trading - How to Create a Trading Strategy | Different Candle Stick Pat...Forex Trading - How to Create a Trading Strategy | Different Candle Stick Pat...
Forex Trading - How to Create a Trading Strategy | Different Candle Stick Pat...
 
May 26 I Session 2 I GBIH
May 26 I Session 2 I GBIHMay 26 I Session 2 I GBIH
May 26 I Session 2 I GBIH
 

Recently uploaded

Proudly South Africa powerpoint Thorisha.pptx
Proudly South Africa powerpoint Thorisha.pptxProudly South Africa powerpoint Thorisha.pptx
Proudly South Africa powerpoint Thorisha.pptxthorishapillay1
 
Interactive Powerpoint_How to Master effective communication
Interactive Powerpoint_How to Master effective communicationInteractive Powerpoint_How to Master effective communication
Interactive Powerpoint_How to Master effective communicationnomboosow
 
Hierarchy of management that covers different levels of management
Hierarchy of management that covers different levels of managementHierarchy of management that covers different levels of management
Hierarchy of management that covers different levels of managementmkooblal
 
History Class XII Ch. 3 Kinship, Caste and Class (1).pptx
History Class XII Ch. 3 Kinship, Caste and Class (1).pptxHistory Class XII Ch. 3 Kinship, Caste and Class (1).pptx
History Class XII Ch. 3 Kinship, Caste and Class (1).pptxsocialsciencegdgrohi
 
Framing an Appropriate Research Question 6b9b26d93da94caf993c038d9efcdedb.pdf
Framing an Appropriate Research Question 6b9b26d93da94caf993c038d9efcdedb.pdfFraming an Appropriate Research Question 6b9b26d93da94caf993c038d9efcdedb.pdf
Framing an Appropriate Research Question 6b9b26d93da94caf993c038d9efcdedb.pdfUjwalaBharambe
 
भारत-रोम व्यापार.pptx, Indo-Roman Trade,
भारत-रोम व्यापार.pptx, Indo-Roman Trade,भारत-रोम व्यापार.pptx, Indo-Roman Trade,
भारत-रोम व्यापार.pptx, Indo-Roman Trade,Virag Sontakke
 
How to Configure Email Server in Odoo 17
How to Configure Email Server in Odoo 17How to Configure Email Server in Odoo 17
How to Configure Email Server in Odoo 17Celine George
 
Capitol Tech U Doctoral Presentation - April 2024.pptx
Capitol Tech U Doctoral Presentation - April 2024.pptxCapitol Tech U Doctoral Presentation - April 2024.pptx
Capitol Tech U Doctoral Presentation - April 2024.pptxCapitolTechU
 
KSHARA STURA .pptx---KSHARA KARMA THERAPY (CAUSTIC THERAPY)————IMP.OF KSHARA ...
KSHARA STURA .pptx---KSHARA KARMA THERAPY (CAUSTIC THERAPY)————IMP.OF KSHARA ...KSHARA STURA .pptx---KSHARA KARMA THERAPY (CAUSTIC THERAPY)————IMP.OF KSHARA ...
KSHARA STURA .pptx---KSHARA KARMA THERAPY (CAUSTIC THERAPY)————IMP.OF KSHARA ...M56BOOKSTORE PRODUCT/SERVICE
 
Historical philosophical, theoretical, and legal foundations of special and i...
Historical philosophical, theoretical, and legal foundations of special and i...Historical philosophical, theoretical, and legal foundations of special and i...
Historical philosophical, theoretical, and legal foundations of special and i...jaredbarbolino94
 
Painted Grey Ware.pptx, PGW Culture of India
Painted Grey Ware.pptx, PGW Culture of IndiaPainted Grey Ware.pptx, PGW Culture of India
Painted Grey Ware.pptx, PGW Culture of IndiaVirag Sontakke
 
Introduction to AI in Higher Education_draft.pptx
Introduction to AI in Higher Education_draft.pptxIntroduction to AI in Higher Education_draft.pptx
Introduction to AI in Higher Education_draft.pptxpboyjonauth
 
ECONOMIC CONTEXT - PAPER 1 Q3: NEWSPAPERS.pptx
ECONOMIC CONTEXT - PAPER 1 Q3: NEWSPAPERS.pptxECONOMIC CONTEXT - PAPER 1 Q3: NEWSPAPERS.pptx
ECONOMIC CONTEXT - PAPER 1 Q3: NEWSPAPERS.pptxiammrhaywood
 
Alper Gobel In Media Res Media Component
Alper Gobel In Media Res Media ComponentAlper Gobel In Media Res Media Component
Alper Gobel In Media Res Media ComponentInMediaRes1
 
DATA STRUCTURE AND ALGORITHM for beginners
DATA STRUCTURE AND ALGORITHM for beginnersDATA STRUCTURE AND ALGORITHM for beginners
DATA STRUCTURE AND ALGORITHM for beginnersSabitha Banu
 
Biting mechanism of poisonous snakes.pdf
Biting mechanism of poisonous snakes.pdfBiting mechanism of poisonous snakes.pdf
Biting mechanism of poisonous snakes.pdfadityarao40181
 
Introduction to ArtificiaI Intelligence in Higher Education
Introduction to ArtificiaI Intelligence in Higher EducationIntroduction to ArtificiaI Intelligence in Higher Education
Introduction to ArtificiaI Intelligence in Higher Educationpboyjonauth
 
18-04-UA_REPORT_MEDIALITERAСY_INDEX-DM_23-1-final-eng.pdf
18-04-UA_REPORT_MEDIALITERAСY_INDEX-DM_23-1-final-eng.pdf18-04-UA_REPORT_MEDIALITERAСY_INDEX-DM_23-1-final-eng.pdf
18-04-UA_REPORT_MEDIALITERAСY_INDEX-DM_23-1-final-eng.pdfssuser54595a
 

Recently uploaded (20)

Proudly South Africa powerpoint Thorisha.pptx
Proudly South Africa powerpoint Thorisha.pptxProudly South Africa powerpoint Thorisha.pptx
Proudly South Africa powerpoint Thorisha.pptx
 
Interactive Powerpoint_How to Master effective communication
Interactive Powerpoint_How to Master effective communicationInteractive Powerpoint_How to Master effective communication
Interactive Powerpoint_How to Master effective communication
 
Hierarchy of management that covers different levels of management
Hierarchy of management that covers different levels of managementHierarchy of management that covers different levels of management
Hierarchy of management that covers different levels of management
 
History Class XII Ch. 3 Kinship, Caste and Class (1).pptx
History Class XII Ch. 3 Kinship, Caste and Class (1).pptxHistory Class XII Ch. 3 Kinship, Caste and Class (1).pptx
History Class XII Ch. 3 Kinship, Caste and Class (1).pptx
 
Framing an Appropriate Research Question 6b9b26d93da94caf993c038d9efcdedb.pdf
Framing an Appropriate Research Question 6b9b26d93da94caf993c038d9efcdedb.pdfFraming an Appropriate Research Question 6b9b26d93da94caf993c038d9efcdedb.pdf
Framing an Appropriate Research Question 6b9b26d93da94caf993c038d9efcdedb.pdf
 
भारत-रोम व्यापार.pptx, Indo-Roman Trade,
भारत-रोम व्यापार.pptx, Indo-Roman Trade,भारत-रोम व्यापार.pptx, Indo-Roman Trade,
भारत-रोम व्यापार.pptx, Indo-Roman Trade,
 
ESSENTIAL of (CS/IT/IS) class 06 (database)
ESSENTIAL of (CS/IT/IS) class 06 (database)ESSENTIAL of (CS/IT/IS) class 06 (database)
ESSENTIAL of (CS/IT/IS) class 06 (database)
 
How to Configure Email Server in Odoo 17
How to Configure Email Server in Odoo 17How to Configure Email Server in Odoo 17
How to Configure Email Server in Odoo 17
 
Capitol Tech U Doctoral Presentation - April 2024.pptx
Capitol Tech U Doctoral Presentation - April 2024.pptxCapitol Tech U Doctoral Presentation - April 2024.pptx
Capitol Tech U Doctoral Presentation - April 2024.pptx
 
KSHARA STURA .pptx---KSHARA KARMA THERAPY (CAUSTIC THERAPY)————IMP.OF KSHARA ...
KSHARA STURA .pptx---KSHARA KARMA THERAPY (CAUSTIC THERAPY)————IMP.OF KSHARA ...KSHARA STURA .pptx---KSHARA KARMA THERAPY (CAUSTIC THERAPY)————IMP.OF KSHARA ...
KSHARA STURA .pptx---KSHARA KARMA THERAPY (CAUSTIC THERAPY)————IMP.OF KSHARA ...
 
OS-operating systems- ch04 (Threads) ...
OS-operating systems- ch04 (Threads) ...OS-operating systems- ch04 (Threads) ...
OS-operating systems- ch04 (Threads) ...
 
Historical philosophical, theoretical, and legal foundations of special and i...
Historical philosophical, theoretical, and legal foundations of special and i...Historical philosophical, theoretical, and legal foundations of special and i...
Historical philosophical, theoretical, and legal foundations of special and i...
 
Painted Grey Ware.pptx, PGW Culture of India
Painted Grey Ware.pptx, PGW Culture of IndiaPainted Grey Ware.pptx, PGW Culture of India
Painted Grey Ware.pptx, PGW Culture of India
 
Introduction to AI in Higher Education_draft.pptx
Introduction to AI in Higher Education_draft.pptxIntroduction to AI in Higher Education_draft.pptx
Introduction to AI in Higher Education_draft.pptx
 
ECONOMIC CONTEXT - PAPER 1 Q3: NEWSPAPERS.pptx
ECONOMIC CONTEXT - PAPER 1 Q3: NEWSPAPERS.pptxECONOMIC CONTEXT - PAPER 1 Q3: NEWSPAPERS.pptx
ECONOMIC CONTEXT - PAPER 1 Q3: NEWSPAPERS.pptx
 
Alper Gobel In Media Res Media Component
Alper Gobel In Media Res Media ComponentAlper Gobel In Media Res Media Component
Alper Gobel In Media Res Media Component
 
DATA STRUCTURE AND ALGORITHM for beginners
DATA STRUCTURE AND ALGORITHM for beginnersDATA STRUCTURE AND ALGORITHM for beginners
DATA STRUCTURE AND ALGORITHM for beginners
 
Biting mechanism of poisonous snakes.pdf
Biting mechanism of poisonous snakes.pdfBiting mechanism of poisonous snakes.pdf
Biting mechanism of poisonous snakes.pdf
 
Introduction to ArtificiaI Intelligence in Higher Education
Introduction to ArtificiaI Intelligence in Higher EducationIntroduction to ArtificiaI Intelligence in Higher Education
Introduction to ArtificiaI Intelligence in Higher Education
 
18-04-UA_REPORT_MEDIALITERAСY_INDEX-DM_23-1-final-eng.pdf
18-04-UA_REPORT_MEDIALITERAСY_INDEX-DM_23-1-final-eng.pdf18-04-UA_REPORT_MEDIALITERAСY_INDEX-DM_23-1-final-eng.pdf
18-04-UA_REPORT_MEDIALITERAСY_INDEX-DM_23-1-final-eng.pdf
 

Module 8 - Further Charting

  • 1. The Responsible Trader Lessons The Responsible Trader Lessons The Responsible Trader’s - POV Module 8 – Further Charting
  • 2. The Responsible Trader Lessons The Responsible Trader Lessons The Responsible Trader’s - POV • The Responsible Trader's POV (Point of View). • These are my notes, my own additional research and studies on the Topic that I posted, and my personal observations and opinions that I am sharing to further enhance our knowledge and understanding. • Some of these were previously posted on “The Responsible Trader” thread, Stock Market Pilipinas (www.stockmarketpilipinas.com). This is the latest version of previous posts I made. • Some of these plus further explanations and discussions will be appearing in my forthcoming book “The Responsible Trader.”
  • 3. The Responsible Trader Lessons The Responsible Trader Lessons Our topic this week is a continuation of Module 2 – Charting Basics where I suggested that you create your own key words for remembering candlestick patterns. Instead of doing a review of Module 7, let us go over what we have learned so far about candlesticks. Review of Module 2 – Charting Basics
  • 4. The Responsible Trader Lessons The Responsible Trader Lessons A Japanese candlestick Is composed of two lines. A vertical line called the shadow or wick and the full height represents the trading range. HIGH LOW Two Horizontal Lines representing Open and Close For the period Usually connected as Rectangle CLOSE OPEN Shadow or Wick Shadow or Wick HIGH LOW OPEN CLOSE
  • 5. The Responsible Trader Lessons The Responsible Trader Lessons Japanese Candlesticks with Real Body and without or very little Wicks or Shadows are called Marubozu Green Marubozu - Bullish Red Marubozu - Bearish Close Same as High Open Same as Low Close Same as Low Open Same as High
  • 6. The Responsible Trader Lessons The Responsible Trader Lessons A Doji is a Candlestick with no Real body. Doji’s signify indecision on the part of the Buyers and the Sellers. There are four of them: Cross Doji 4-Price DojiGravestone DojiDragonfly Doji .
  • 7. The Responsible Trader Lessons The Responsible Trader Lessons Japanese Candlestick Charting is better understood by looking at the historical context when the method was developed. It became popular during the 16th and 17th centuries when the feudal lords waged constant wars with each other. In Japan this era is known as Sengoku Jidai or “Age of Country at War.”
  • 8. The Responsible Trader Lessons The Responsible Trader Lessons This was also the time when the Ninjas were used for stealth missions – to gather information and murder Daimyos or warlords. As a natural consequence, most of the terms used in candlestick charting refer to war, military strategy and the martial arts. You should not be surprised, therefore, when you see terms like “Dark Cloud Cover, Morning Star, Evening Star, Three White or Black Soldiers, Three Rising Methods, Long White or Black Line,Piercing Lines, Three River Bottoms, Advanced Block etc.
  • 9. The Responsible Trader Lessons The Responsible Trader Lessons Steve Nison, learned about the method in Japan and brought it to the United States. The method became popular in the U.S. and other countries because it captures market sentiment better than the line charts by providing deeper insight into the direction of the market. It not only illustrates the trend but also the forces underneath it.
  • 10. The Responsible Trader Lessons The Responsible Trader Lessons The most significant candlestick patterns have been thoroughly discussed in the MCTA video so I will no longer discuss them here. I will just focus on some salient points. There are three simple rules in detecting candlestick patterns and determining possible actions to be taken 1. Size – Larger candles play an important role when identifying patterns. 2. Shape – The shape of the candlestick or pattern determines the type of pattern generated, the possible trading signal and the potential direction of the trend. 3. Location – The location of a candlestick pattern assists in determining the possible trading signal. The location also determines what the pattern is called.
  • 11. The Responsible Trader Lessons The Responsible Trader Lessons 1. Size – the larger and more solid the candles, the higher the sentiment Increasing size of green candles show bullish sentiment Increasing size of red candles show bearish sentiment Charts courtesy of Amibroker Charting Software
  • 12. The Responsible Trader Lessons The Responsible Trader Lessons 2. Shape – The shape of the candlestick or pattern determines the type of pattern generated, the possible trading signal and the potential direction of the trend. Bullish engulfing – a large green candle engulfing a small red candle in a downtrend Bearish engulfing – a large red candle engulfing a small green candle in an uptrend Charts courtesy of Amibroker Charting Software
  • 13. The Responsible Trader Lessons The Responsible Trader Lessons Single Candle Patterns – the Hammer and the Hanging Man – both have the same shape but their names vary depending on their location. Hammer in a Downtrend, a Reversal Signal A Hanging Man in an Uptrend, a Reversal Signal 3. Location – determines what the Pattern is called Charts courtesy of Amibroker Charting Software
  • 14. The Responsible Trader Lessons The Responsible Trader Lessons Candlestick Addition Just identify the open. Here since the first candle in the series is green, the open for the whole series is the bottom of the first candle’s body. Then you identify the highest in the series and it becomes the high, the lowest in the series becomes the low. Since the last candle in the series is green, the close for the series is at the top of the last candle’s body. The result is a green Marubozu with a small wick or shadow. You can easily convert a series of candles into one. Below is an example for a series of candles from a 30-minute chart of DNL from COL’s trading platform.
  • 15. The Responsible Trader Lessons The Responsible Trader Lessons Candlestick Reading In the absence of additional information , you can read a candlestick by starting with the open and ending with the close. Where you go after the open depends on the color of the candle. If the candle is green you go to the highest price in the trading range then proceed to the lowest of the trading range and vice versa. The candle we saw in the last slide is read as follows: 1) Opened at 16.12 2) Buyers bought it as High as 16.32 3) Sellers sold it as Low as 16.12 same as open 4) But buyers were eventually able to close it a16.30 showing that Buyers are in control DATA: Open 16.12 High 16.32 Low 16.12 Close 16.30
  • 16. The Responsible Trader Lessons The Responsible Trader Lessons 1. Candlesticks should be used together with other forms of technical analysis, trendlines, support and resistance. 2. Candlesticks should be used in connection with clear trends, whether uptrend or downtrend. The candlestick patterns are not useful in a sideways market. 3. The more agreement between signals (candle patterns and technical analysis) the more likely the reversal. 4. The candle line shows the force behind each move, as well as the price. 5. The candlestick pattern requires both the shape and the trend. 6. A candlestick pattern alone is not justification for a new trade. 7. Candlesticks do not give price targets. 8. Set stop loss levels by other means and know when you are wrong and must exit the trade. Principles to be observed when using Japanese Candlesticks
  • 17. The Responsible Trader Lessons The Responsible Trader Lessons Point and Figure Chart On a Point and figure chart, day-to-day price movements are plotted without taking into consideration the passage of time. Point and figure charts are composed of a number of columns that either consist of a series of stacked X's or O's. A column of X's is used to illustrate a rising price, while O's represent a falling price. As you can see from the chart on the left, this type of chart is used to filter out non-significant price movements, and enables the trader to easily determine critical support and resistance levels. Traders will place orders when the price moves beyond identified support/resistance levels.
  • 18. The Responsible Trader Lessons The Responsible Trader Lessons Candle Volume Chart CandleVolume charts merge volume into candlesticks. This allows chartists to analyze both price action and volume with one look at the price chart. The charts show candlestick patterns as well as classical chart patterns, such as triangles and wedges, to generate signals. Charts courtesy of StockCharts.com
  • 19. The Responsible Trader Lessons The Responsible Trader Lessons Three Line Break Three Line Break charts ignore time and only change when prices move a certain amount. In this regard, these charts are quite similar to Point & Figure charts. Three Line Break charts show a series of vertical white and black lines. White lines represent rising prices, while black lines portray falling prices. Prices continue in the same direction until a reversal is warranted. A reversal occurs when the closing price exceeds the high or low of the prior two lines. Charts courtesy of StockCharts.com
  • 20. The Responsible Trader Lessons The Responsible Trader Lessons Renko Invented in Japan, Renko charts ignore time and focus solely on price changes that meet a minimum requirement. The chart got its name from the Japanese word for bricks, "renga". A renko chart is constructed by placing a brick in the next column once the price surpasses the top or bottom of the previous brick by a predefined amount. White bricks are used when the direction of the trend is up, while black bricks are used when the trend is down. This type of chart is very effective for traders to identify key support/resistance levels. Transaction signals are generated when the direction of the trend changes and the bricks alternate colors. In this regard, these charts are quite similar to Point & Figure charts. Instead of X-Columns and O-Columns, Renko charts use price “bricks” that represent a fixed price move.
  • 21. The Responsible Trader Lessons The Responsible Trader Lessons Kagi The Kagi is a type of chart developed by the Japanese in the 1870s that uses a series of vertical lines to illustrate general levels of supply and demand for certain assets. Thick lines are drawn when the price of the underlying asset breaks above the previous high price and is interpreted as an increase in demand for the asset. Thin lines are used to represent increased supply when the price falls below the previous low. An entry signal is triggered when the vertical line changes from thin to thick and is not reversed until the thick line changes back to thin.
  • 22. The Responsible Trader Lessons The Responsible Trader Lessons For your information, in connection with my Advocacy, Responsible Trading, I have established the following in order to reach out to you more effectively and serve you better. Please visit, like and share: My Blog:http://www.theresponsibletrader.com– where I write and share lessons on trading and my thoughts about trading in particular and life in general My Facebook Page: https://www.facebook.com/theresponsibletrader – where I share what’s on my mind and make posts to groups where I am a member of My YouTube Channel: https://www.youtube.com/theresponsibletrader – where you can view and download my TRT-POV (The Responsible Trader’s Point of View) and other videos I intend to make My Slideshare: http://www.slideshare.net/TheResponsibleTrader – where you can view and download copy of the Powerpoint Presentation of my TRT-POV (The Responsible Trader’s Point of View) and other presentations I intend to make