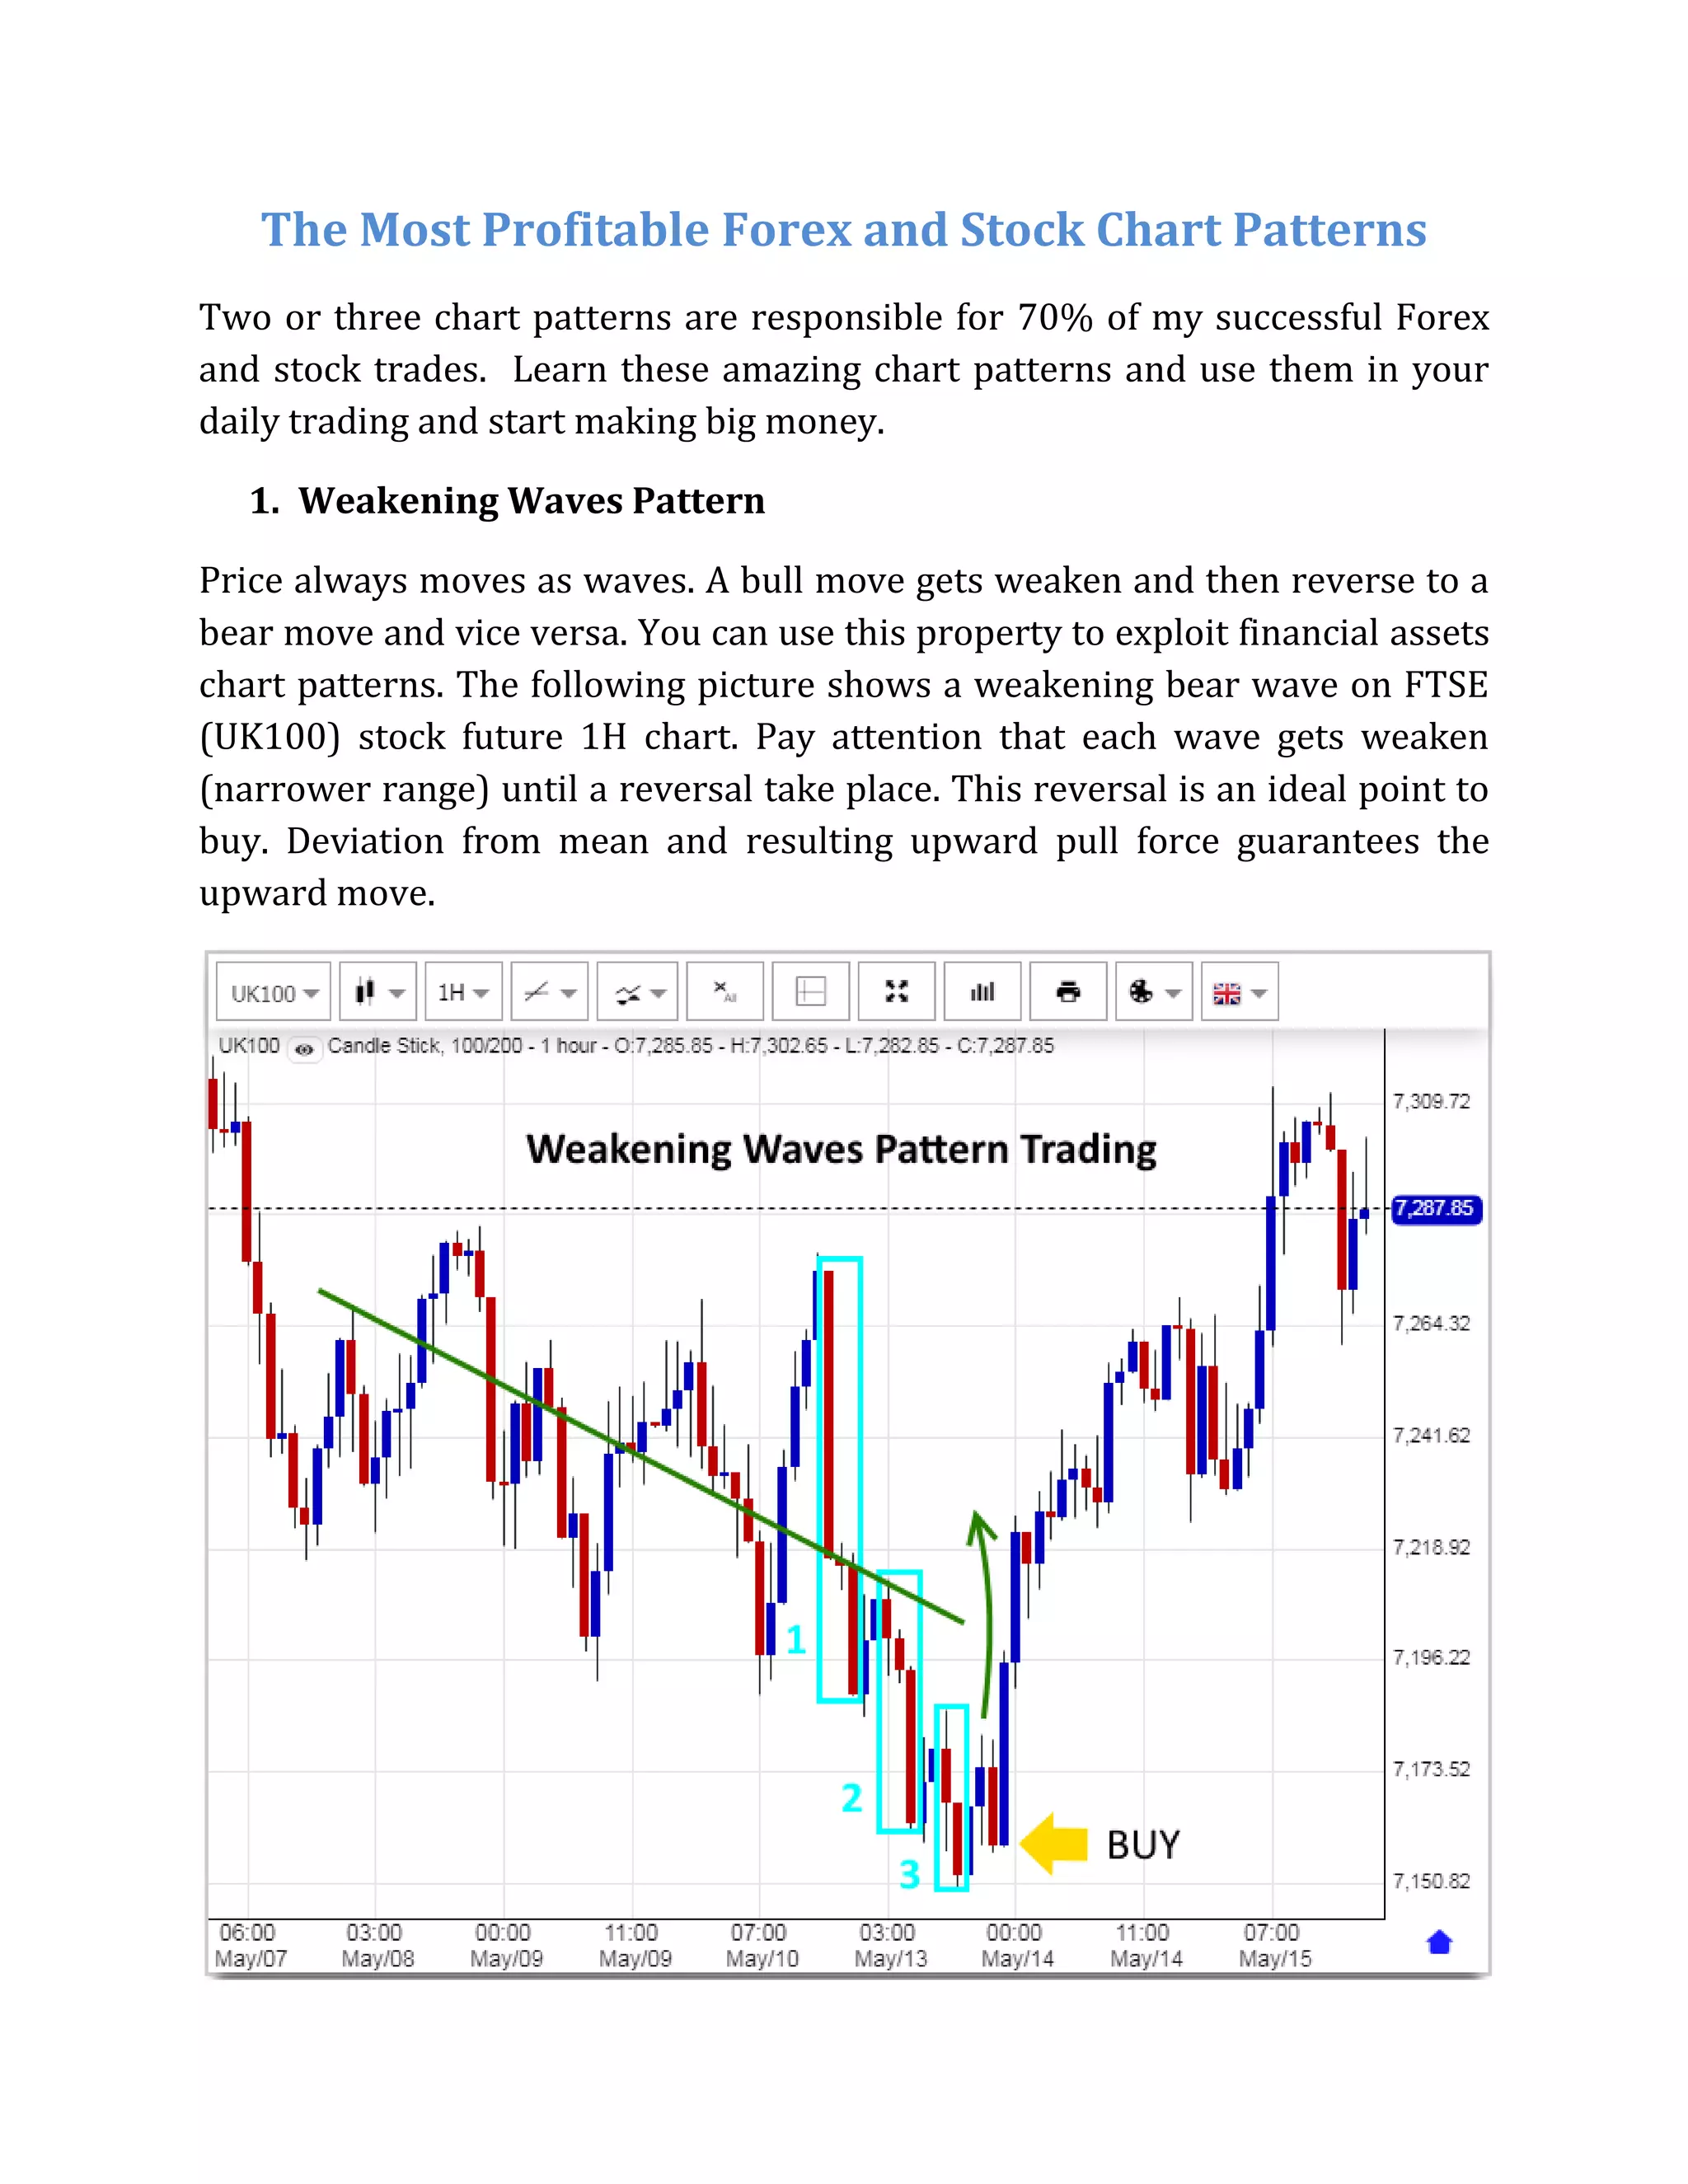
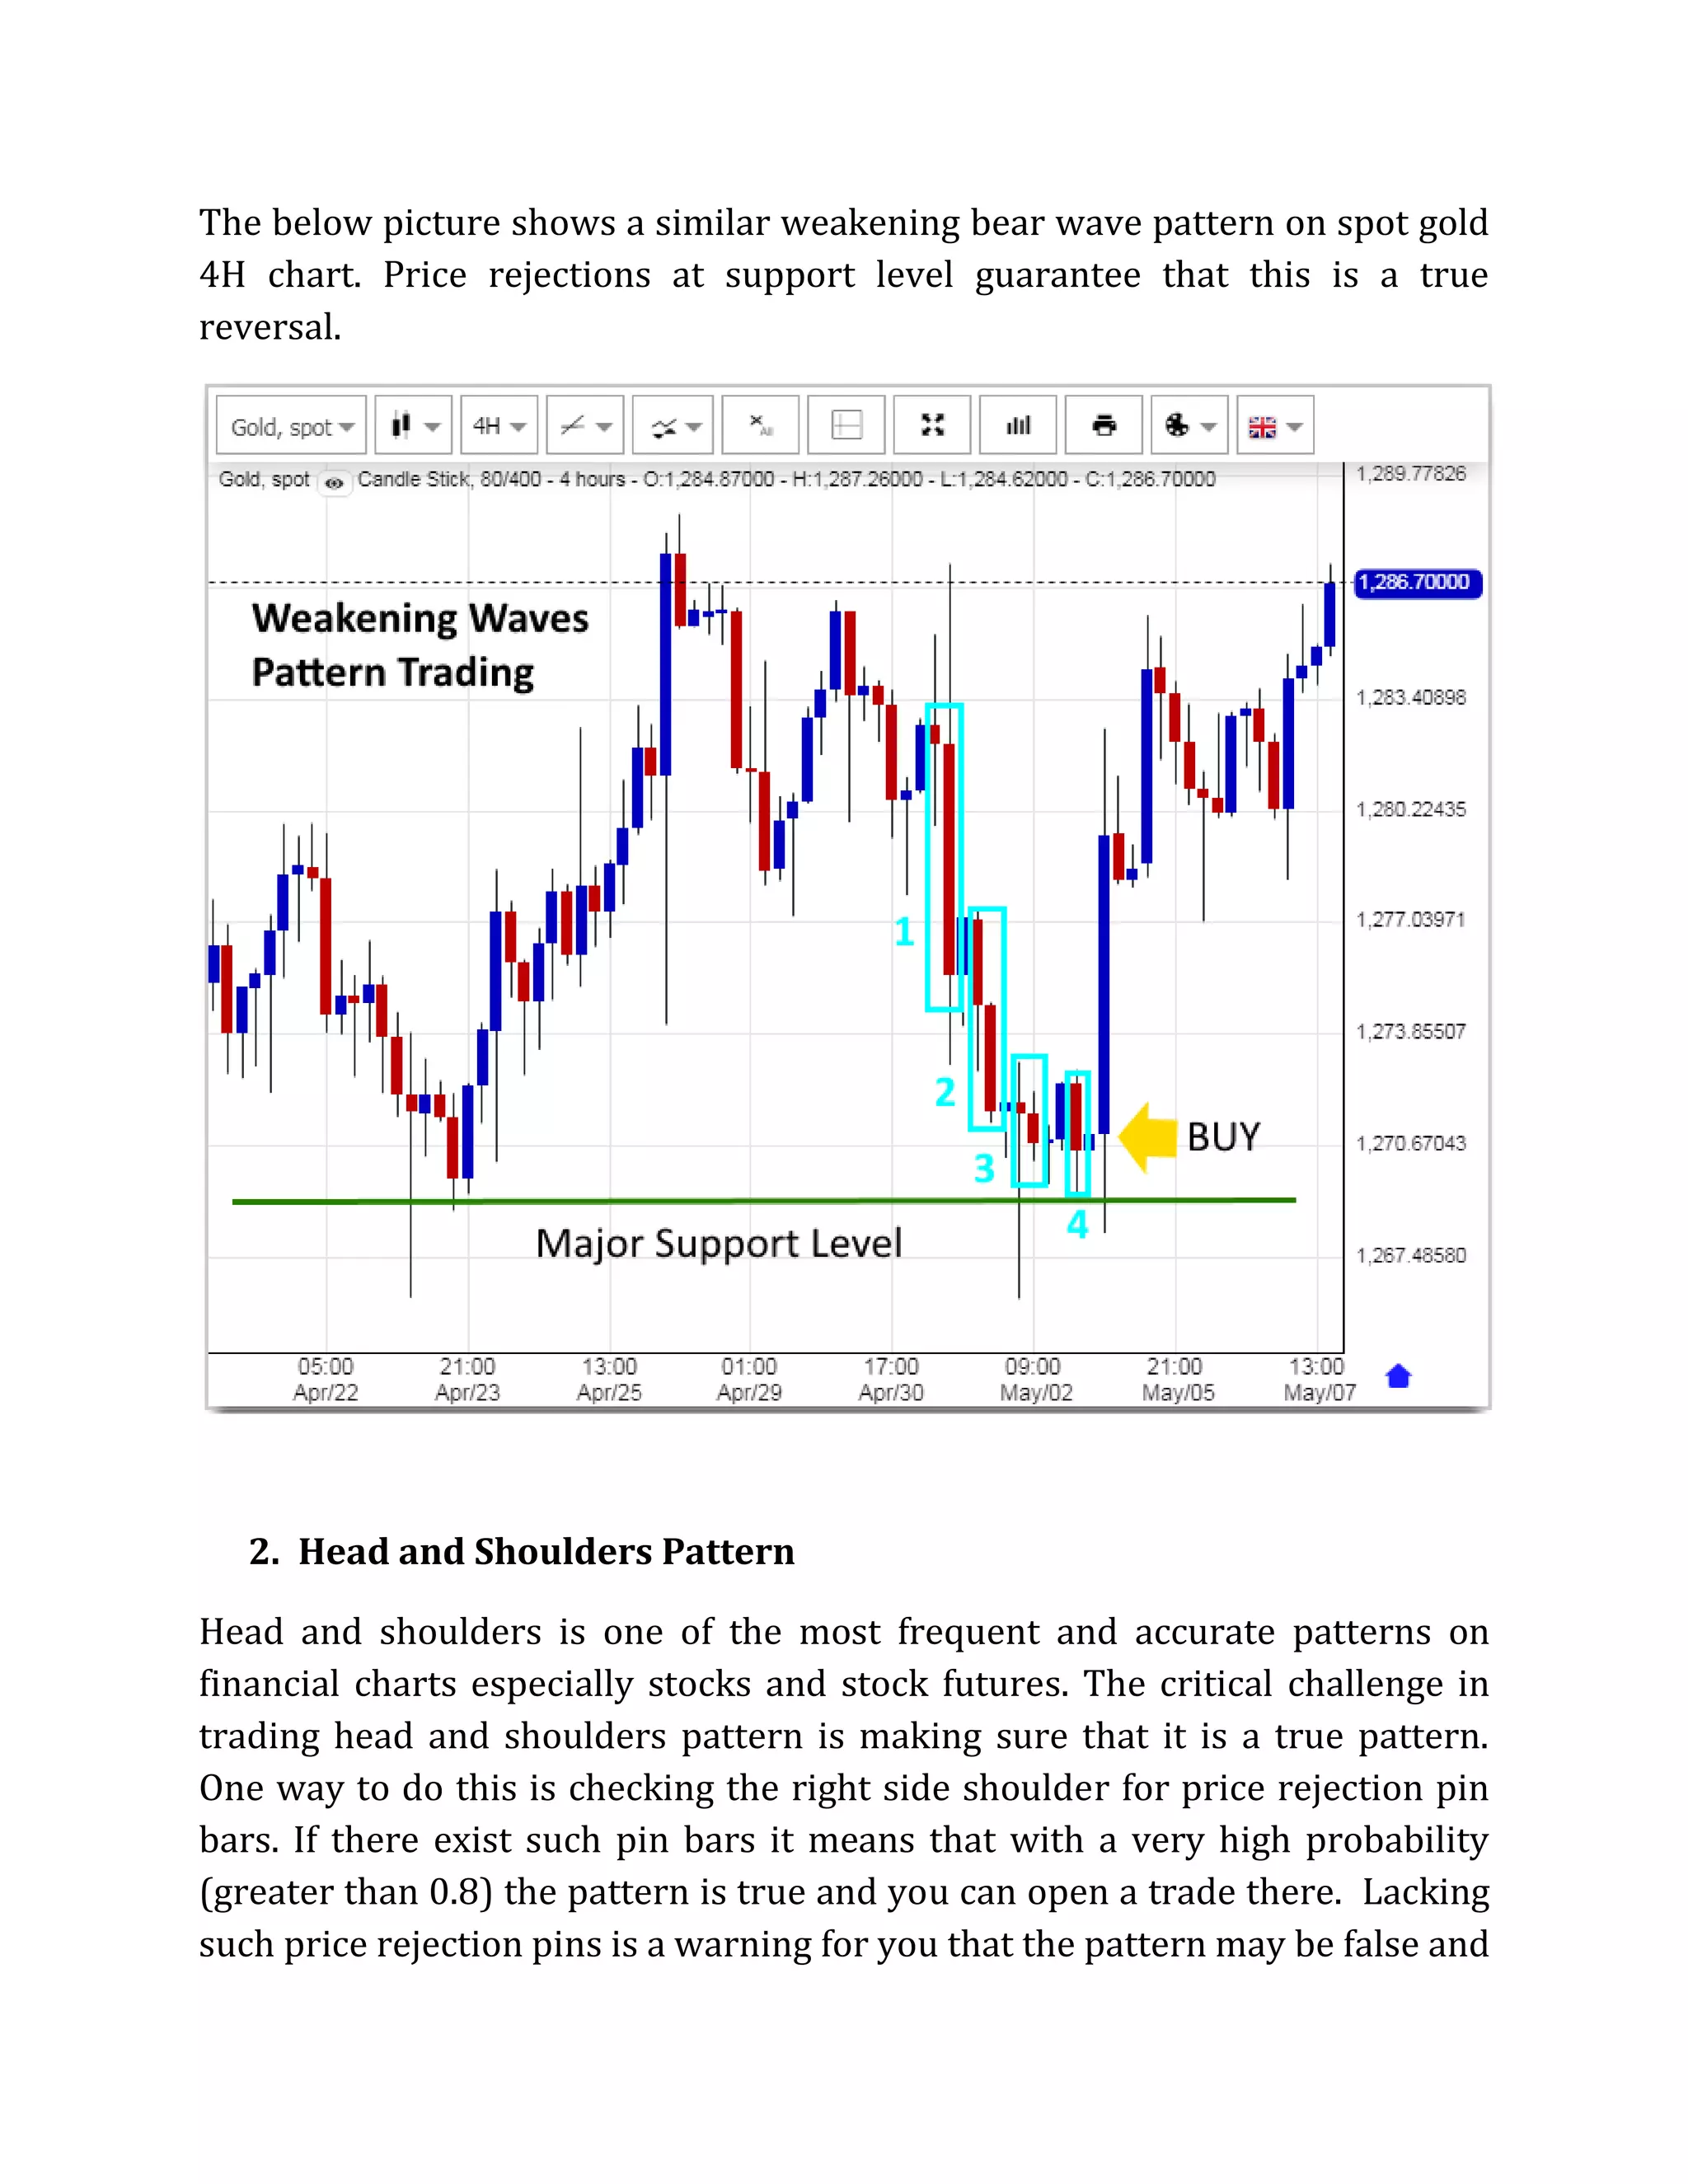
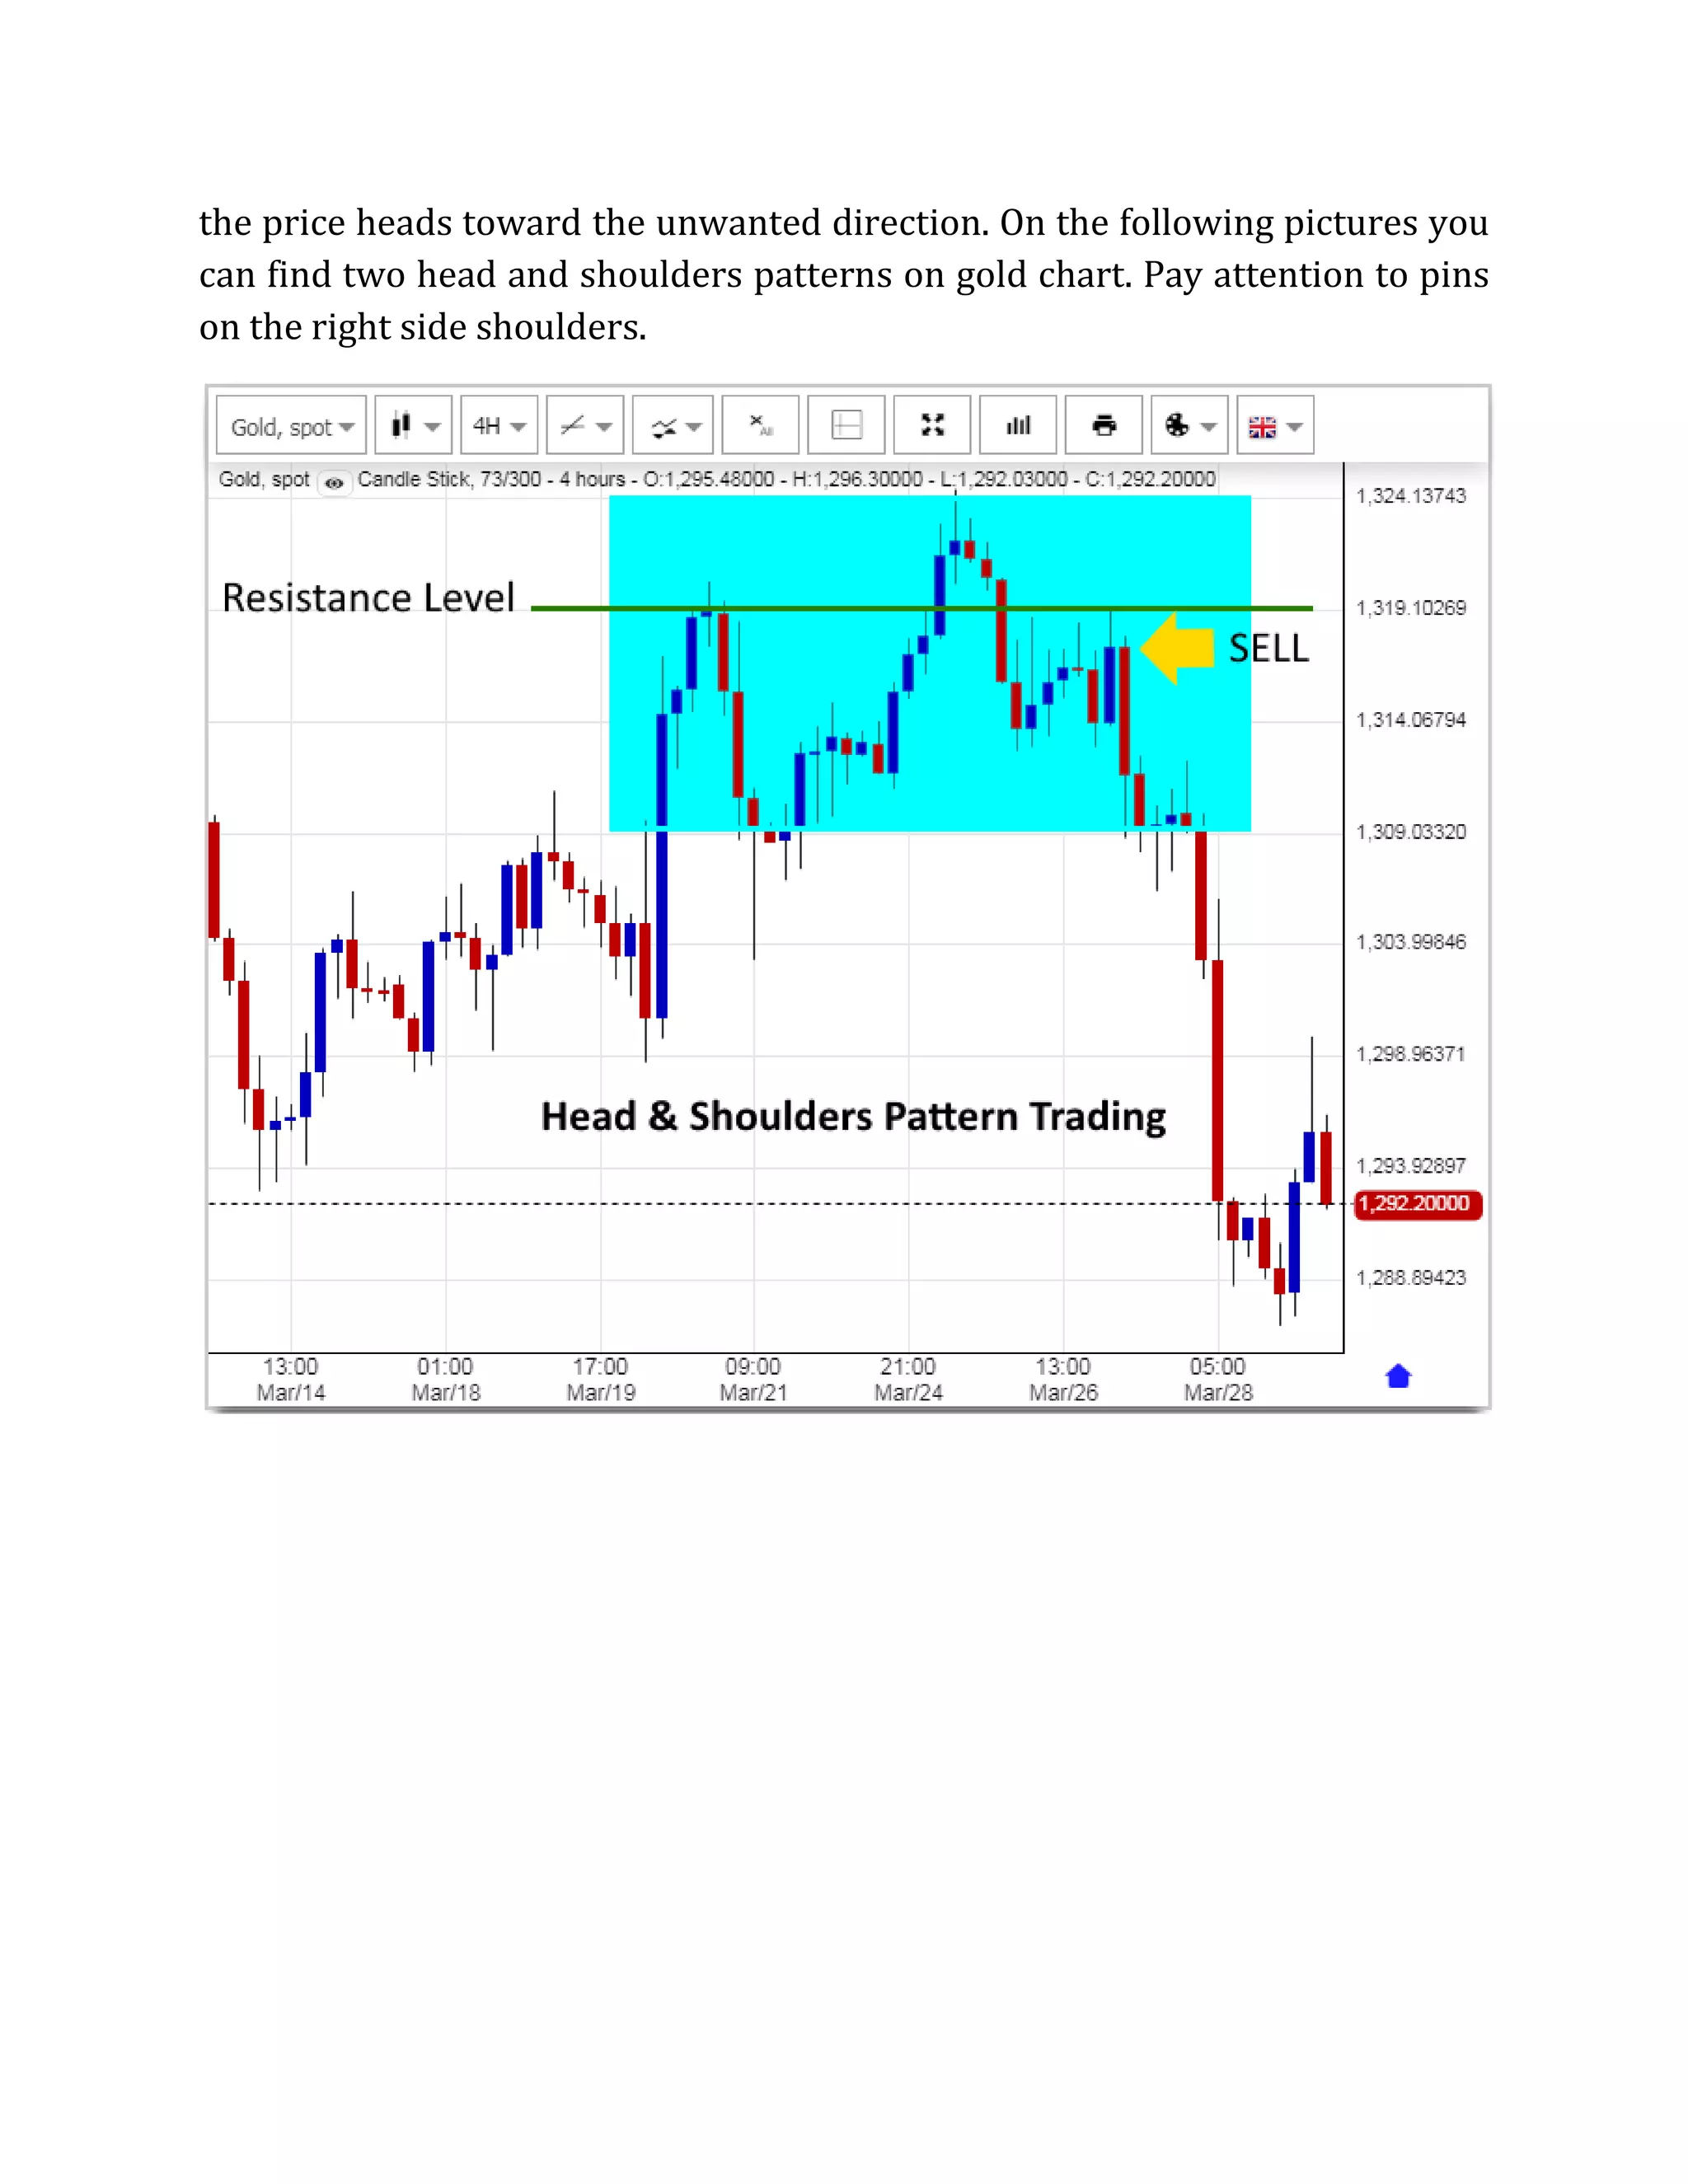
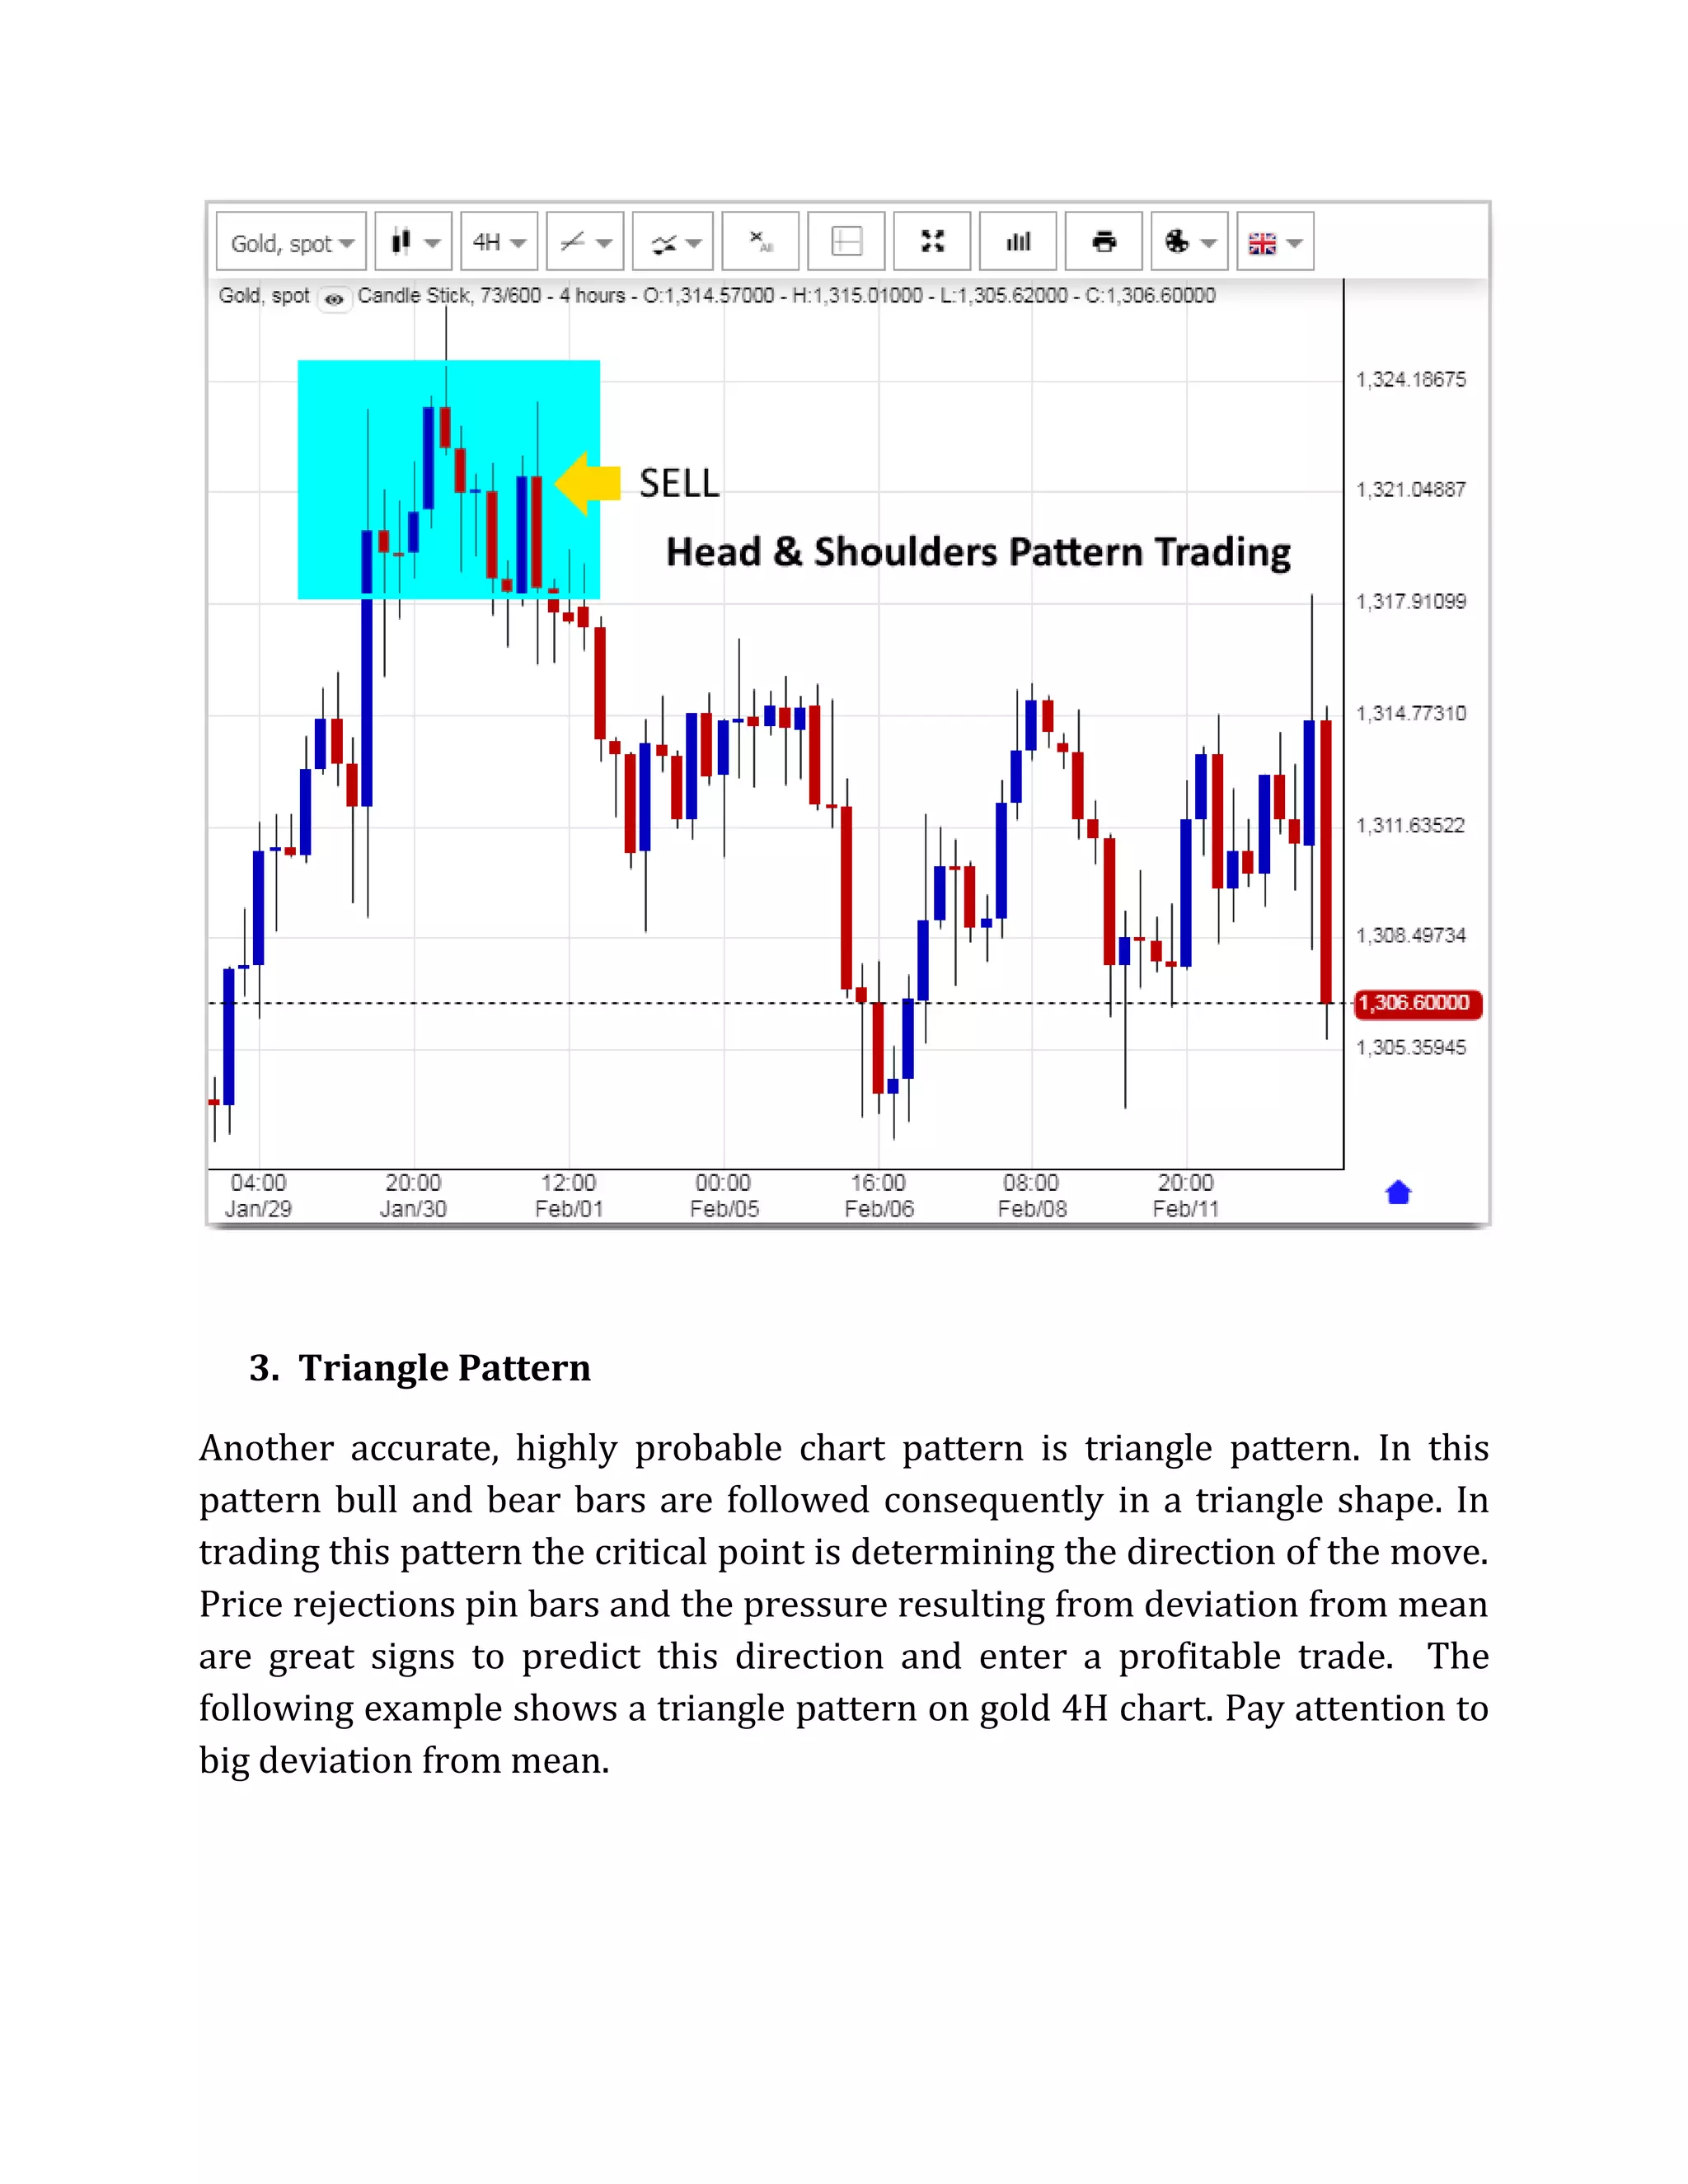
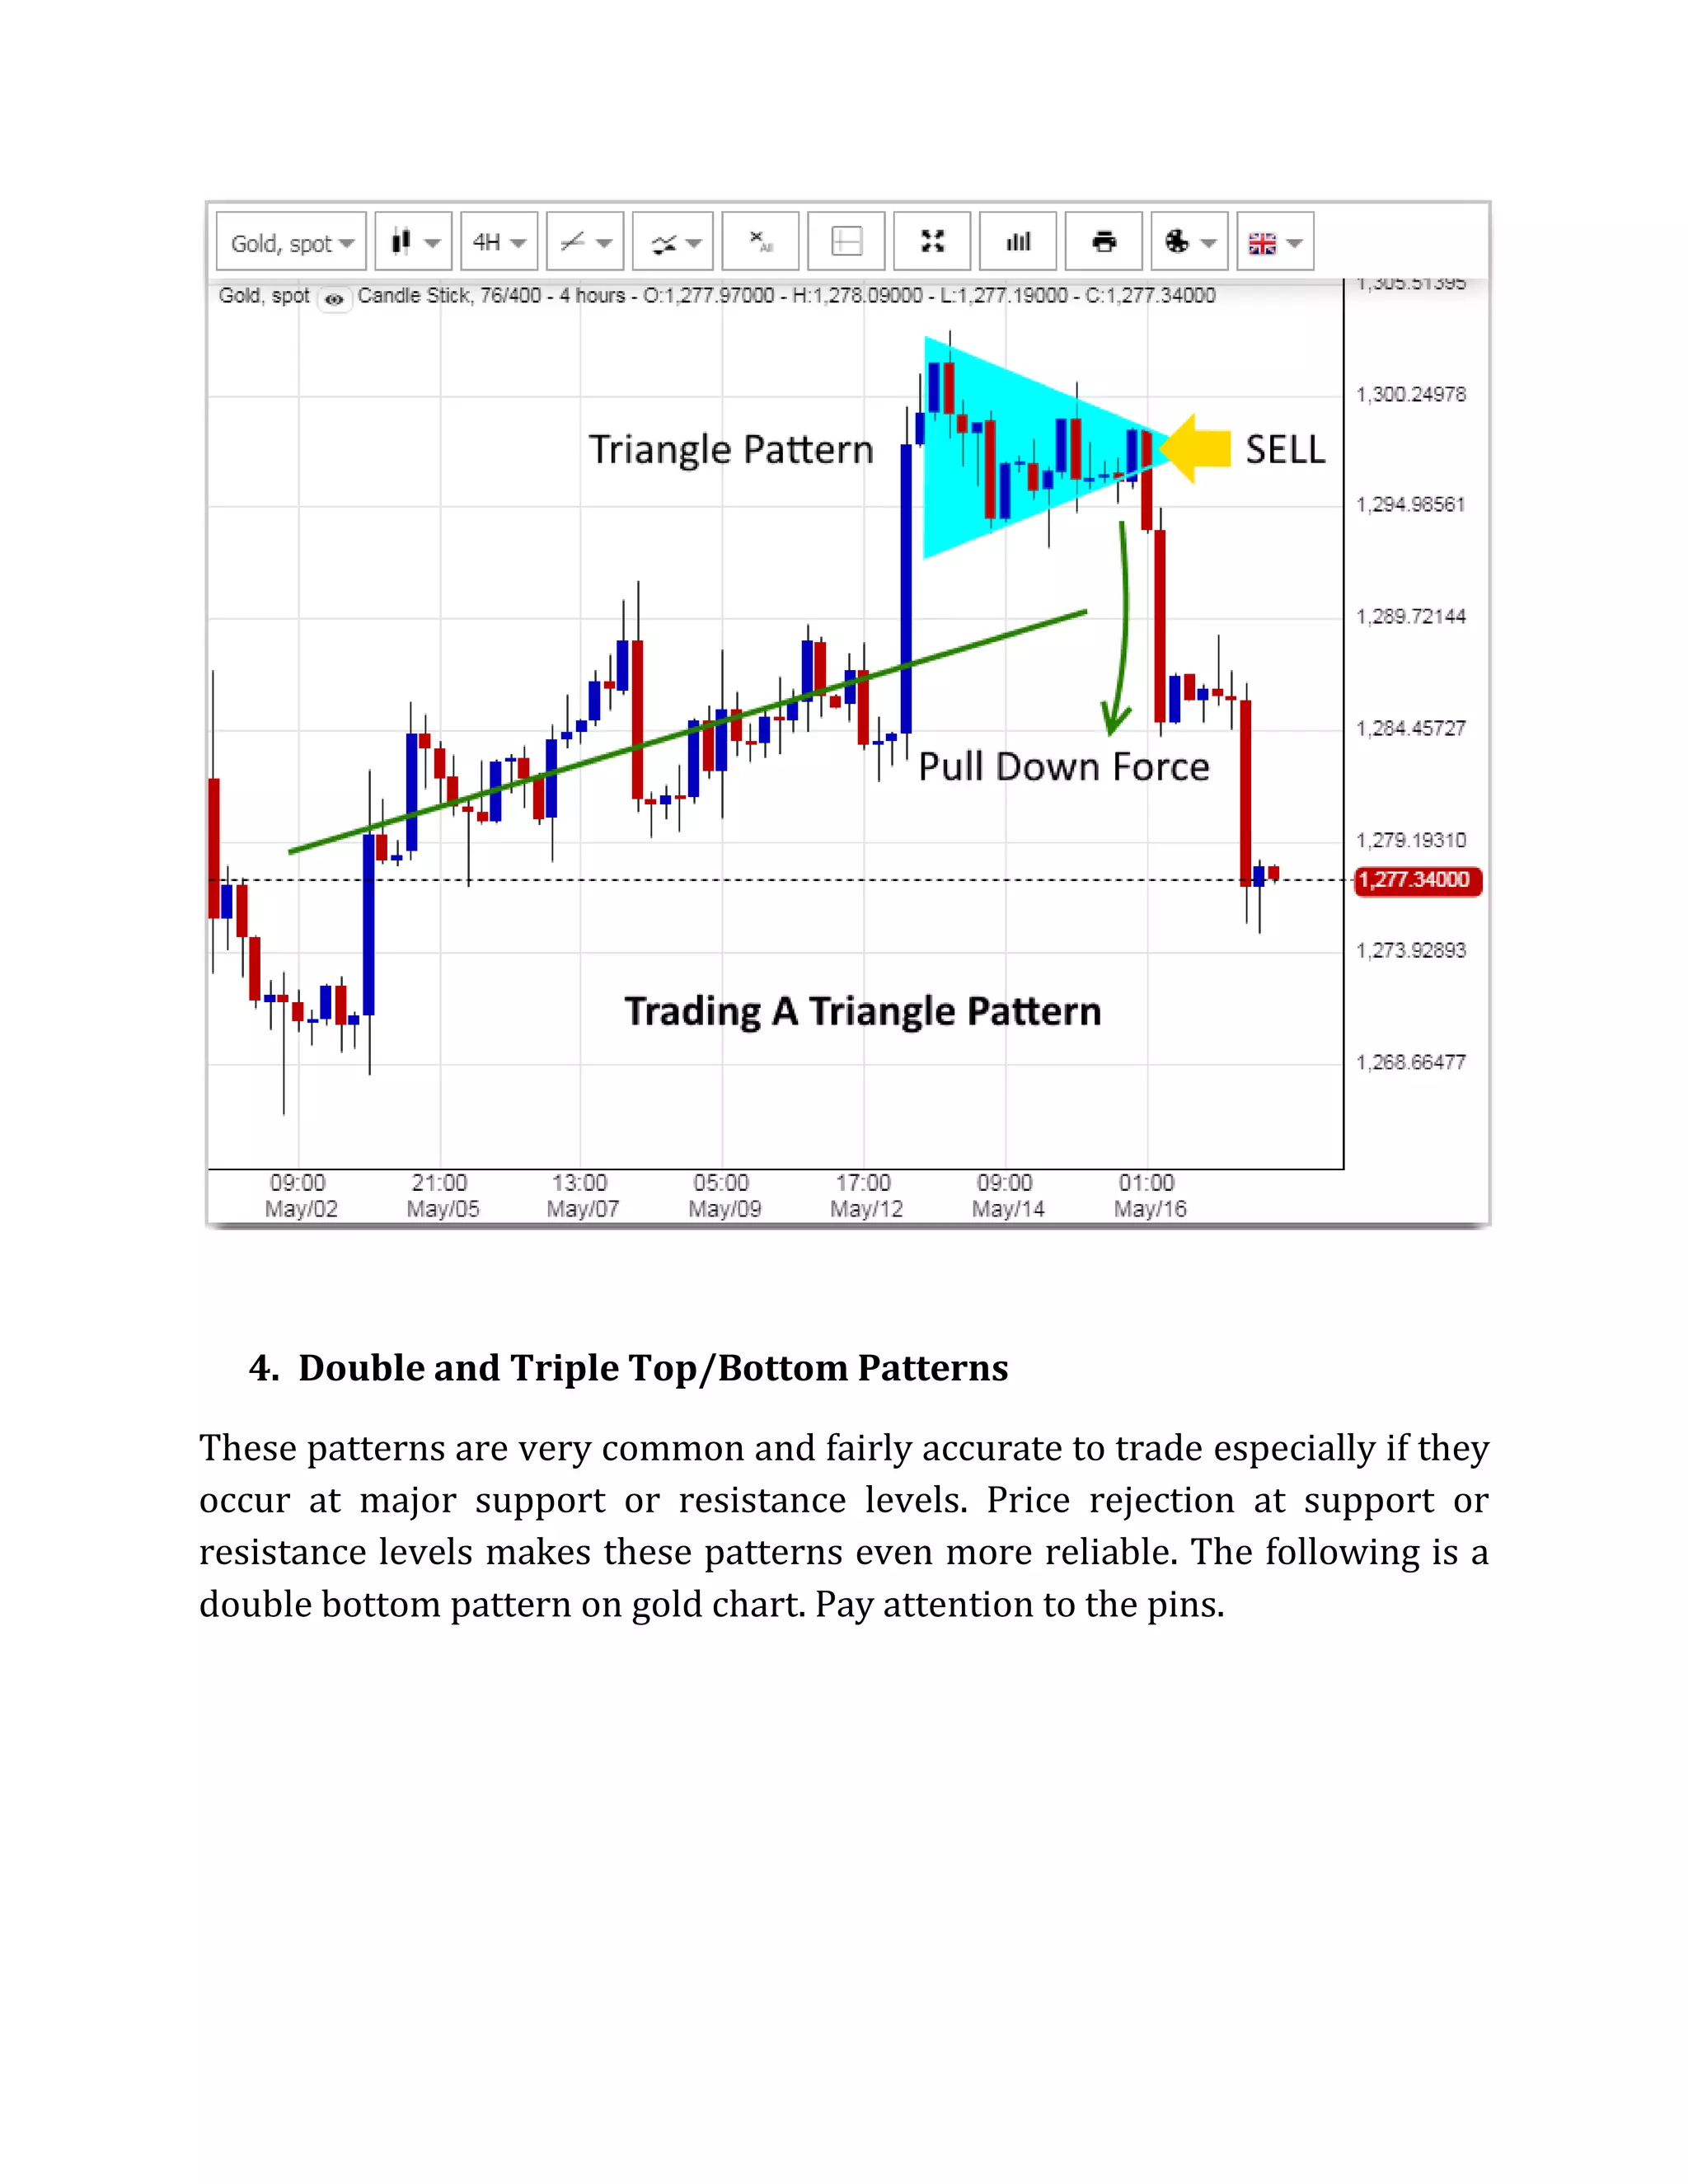
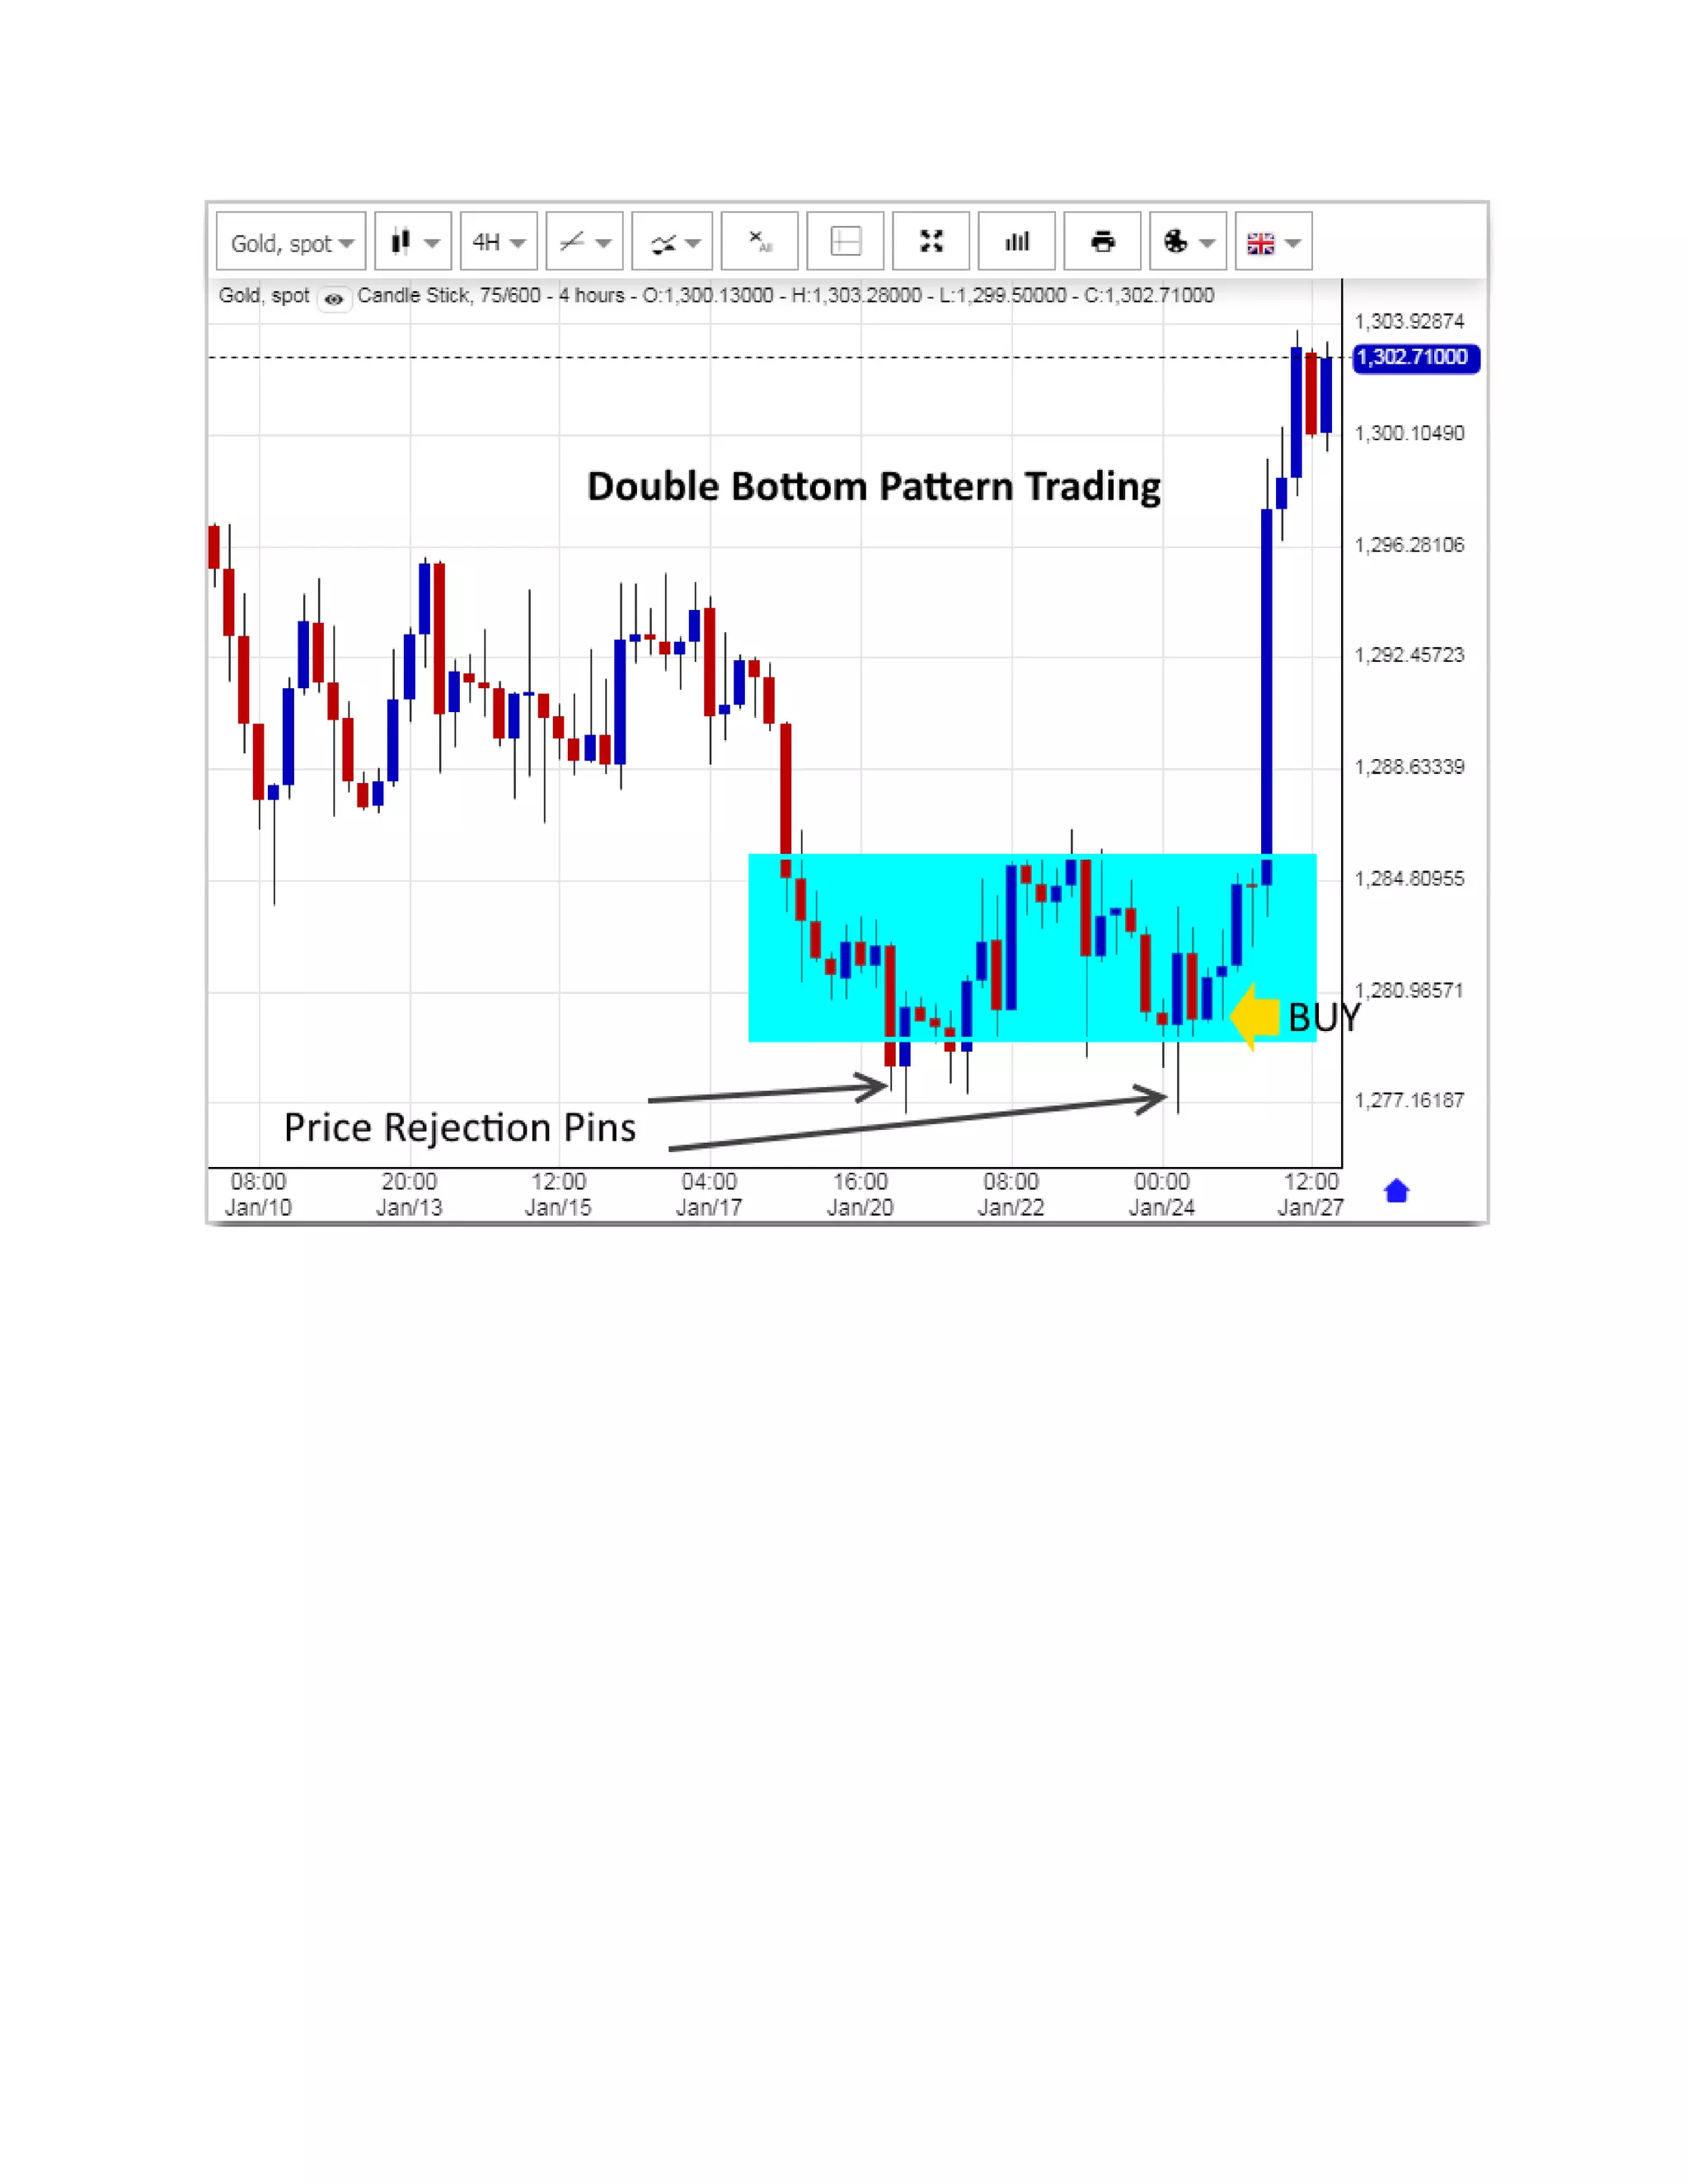
The Most Profitable Forex and Stock Chart Patterns
Two or three chart patterns are responsible for 70% of my successful Forex
and stock trades. Learn these amazing chart patterns and use them in your
daily trading and start making big money.
1. Weakening Waves Pattern
Price always moves as waves. A bull move gets weaken and then reverse to a
bear move and vice versa. You can use this property to exploit financial assets
chart patterns. The following picture shows a weakening bear wave on FTSE
(UK100) stock future 1H chart. Pay attention that each wave gets weaken
(narrower range) until a reversal take place. This reversal is an ideal point to
buy. Deviation from mean and resulting upward pull force guarantees the
upward move.
The below picture shows a similar weakening bear wave pattern on spot gold
4H chart. Price rejections at support level guarantee that this is a true
reversal.
2. Head and Shoulders Pattern
Head and shoulders is one of the most frequent and accurate patterns on
financial charts especially stocks and stock futures. The critical challenge in
trading head and shoulders pattern is making sure that it is a true pattern.
One way to do this is checking the right side shoulder for price rejection pin
bars. If there exist such pin bars it means that with a very high probability
(greater than 0.8) the pattern is true and you can open a trade there. Lacking
such price rejection pins is a warning for you that the pattern may be false and
the price heads toward the unwanted direction. On the following pictures you
can find two head and shoulders patterns on gold chart. Pay attention to pins
on the right side shoulders.
3. Triangle Pattern
Another accurate, highly probable chart pattern is triangle pattern. In this
pattern bull and bear bars are followed consequently in a triangle shape. In
trading this pattern the critical point is determining the direction of the move.
Price rejections pin bars and the pressure resulting from deviation from mean
are great signs to predict this direction and enter a profitable trade. The
following example shows a triangle pattern on gold 4H chart. Pay attention to
big deviation from mean.
4. Double and Triple Top/Bottom Patterns
These patterns are very common and fairly accurate to trade especially if they
occur at major support or resistance levels. Price rejection at support or
resistance levels makes these patterns even more reliable. The following is a
double bottom pattern on gold chart. Pay attention to the pins.
The above information is a brief part of this book:
http://learn-forex.awardspace.us/book.html
To learn the best methods of Forex and stock trading including top price
action rules, 90% profitable chart patterns (including sandwich and
abandoned baby patterns), automated and model predictive trading I
highly recommend reading this book.
http://learn-forex.awardspace.us/book.html

The Most Profitable Forex and Stock Chart Patterns

  • 1.
    The Most ProfitableForex and Stock Chart Patterns Two or three chart patterns are responsible for 70% of my successful Forex and stock trades. Learn these amazing chart patterns and use them in your daily trading and start making big money. 1. Weakening Waves Pattern Price always moves as waves. A bull move gets weaken and then reverse to a bear move and vice versa. You can use this property to exploit financial assets chart patterns. The following picture shows a weakening bear wave on FTSE (UK100) stock future 1H chart. Pay attention that each wave gets weaken (narrower range) until a reversal take place. This reversal is an ideal point to buy. Deviation from mean and resulting upward pull force guarantees the upward move.
  • 2.
    The below pictureshows a similar weakening bear wave pattern on spot gold 4H chart. Price rejections at support level guarantee that this is a true reversal. 2. Head and Shoulders Pattern Head and shoulders is one of the most frequent and accurate patterns on financial charts especially stocks and stock futures. The critical challenge in trading head and shoulders pattern is making sure that it is a true pattern. One way to do this is checking the right side shoulder for price rejection pin bars. If there exist such pin bars it means that with a very high probability (greater than 0.8) the pattern is true and you can open a trade there. Lacking such price rejection pins is a warning for you that the pattern may be false and
  • 3.
    the price headstoward the unwanted direction. On the following pictures you can find two head and shoulders patterns on gold chart. Pay attention to pins on the right side shoulders.
  • 4.
    3. Triangle Pattern Anotheraccurate, highly probable chart pattern is triangle pattern. In this pattern bull and bear bars are followed consequently in a triangle shape. In trading this pattern the critical point is determining the direction of the move. Price rejections pin bars and the pressure resulting from deviation from mean are great signs to predict this direction and enter a profitable trade. The following example shows a triangle pattern on gold 4H chart. Pay attention to big deviation from mean.
  • 5.
    4. Double andTriple Top/Bottom Patterns These patterns are very common and fairly accurate to trade especially if they occur at major support or resistance levels. Price rejection at support or resistance levels makes these patterns even more reliable. The following is a double bottom pattern on gold chart. Pay attention to the pins.
  • 7.
    The above informationis a brief part of this book: http://learn-forex.awardspace.us/book.html To learn the best methods of Forex and stock trading including top price action rules, 90% profitable chart patterns (including sandwich and abandoned baby patterns), automated and model predictive trading I highly recommend reading this book. http://learn-forex.awardspace.us/book.html