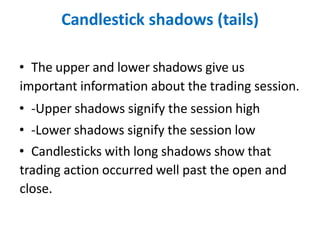
The document discusses candlestick patterns in technical analysis. It explains that candlestick patterns emerge from repeated human behavior in markets. It describes some of the most important candlestick patterns and how to recognize them. Specifically, it covers what a candlestick is in terms of open, high, low and close prices, and how different candlestick formations indicate bullish or bearish market movements based on where the close is in relation to the open. Long bodies and shadows provide additional information about buying and selling pressure. Recognizing these patterns can help traders understand market sentiment.