Download to read offline


![MOVR
ScientiaMobile has published MOVR
to provide the mobileWeb community
with timely information on mobile
Web device usage.
It’s about increasing interest in:
– Mobile device trends
– Device capabilities
– Tools for analyzing and managing
[device] fragmentation
2
TheWhy?
– Based on Data collected from April thru
September, 2014
– Sample size of more than 2.5BN hits
– Sample data includes all types of
devices, but we have extracted and
used mobile related data.
The Data
Excluded
• Desktops and laptops
• Smart TV
• Game Consoles
• Apps
• Robots
Included
• Smartphones
• Tablets
• Feature
Phones
Quick Background](https://image.slidesharecdn.com/mdc14-slides-guda-141219175447-conversion-gate01/85/ModevCon-2014-Presentation-Slides-Krishna-Guda-2-320.jpg)
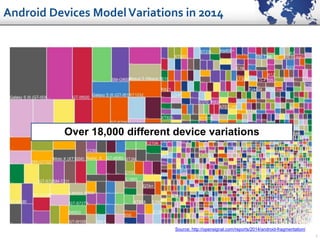

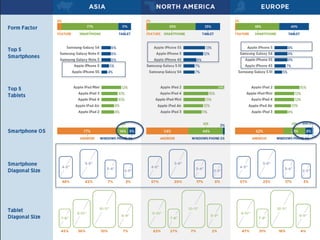
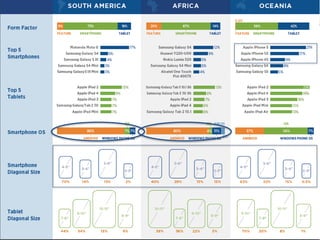
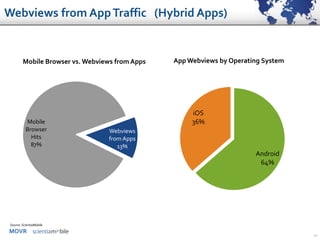
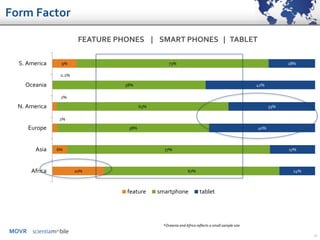
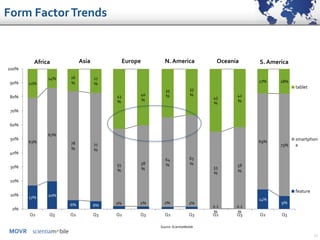


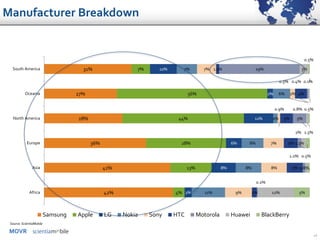
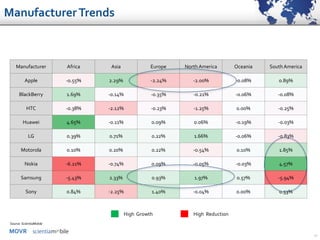
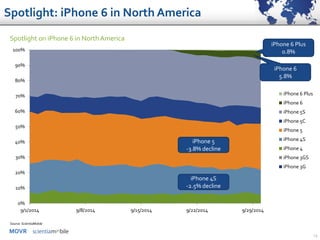
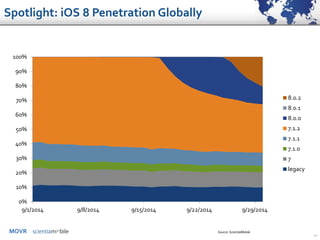
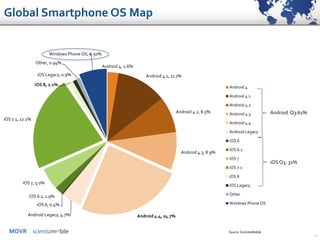
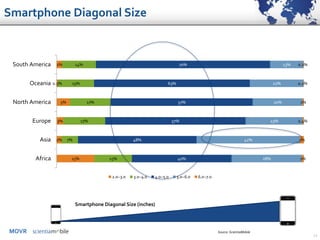

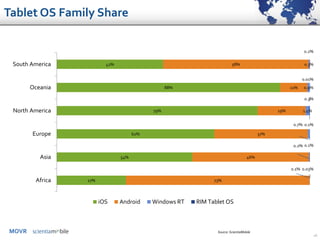
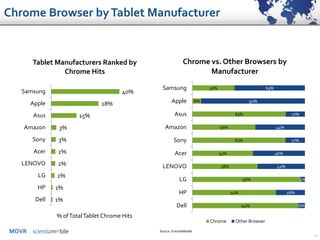


The document provides a summary of global mobile device usage trends based on data from April to September 2014. Some key findings include: - Smartphones accounted for the majority of devices globally, ranging from 65% in North America to 77% in Asia. Tablets accounted for 33-40% and feature phones 2-20%. - The top smartphone manufacturers were Samsung, Apple, and Huawei. Apple dominated the tablet market, comprising over 50% of tablets globally. - Android accounted for over 60% of the global smartphone OS market, while iOS made up 31%. iOS dominated the tablet OS market at over 50% globally.


![[Invbots' Insight] Investment Strategy - Apple Inc./iPhone 8](https://cdn.slidesharecdn.com/ss_thumbnails/05qexklfs0ujw9ltcgak-signature-1a3adf1c2c5278fdc4811c3ad3f696dc8b54184ff1b344a3dde9f7caf17211fc-poli-170923170035-thumbnail.jpg?width=640&height=640&fit=bounds)


