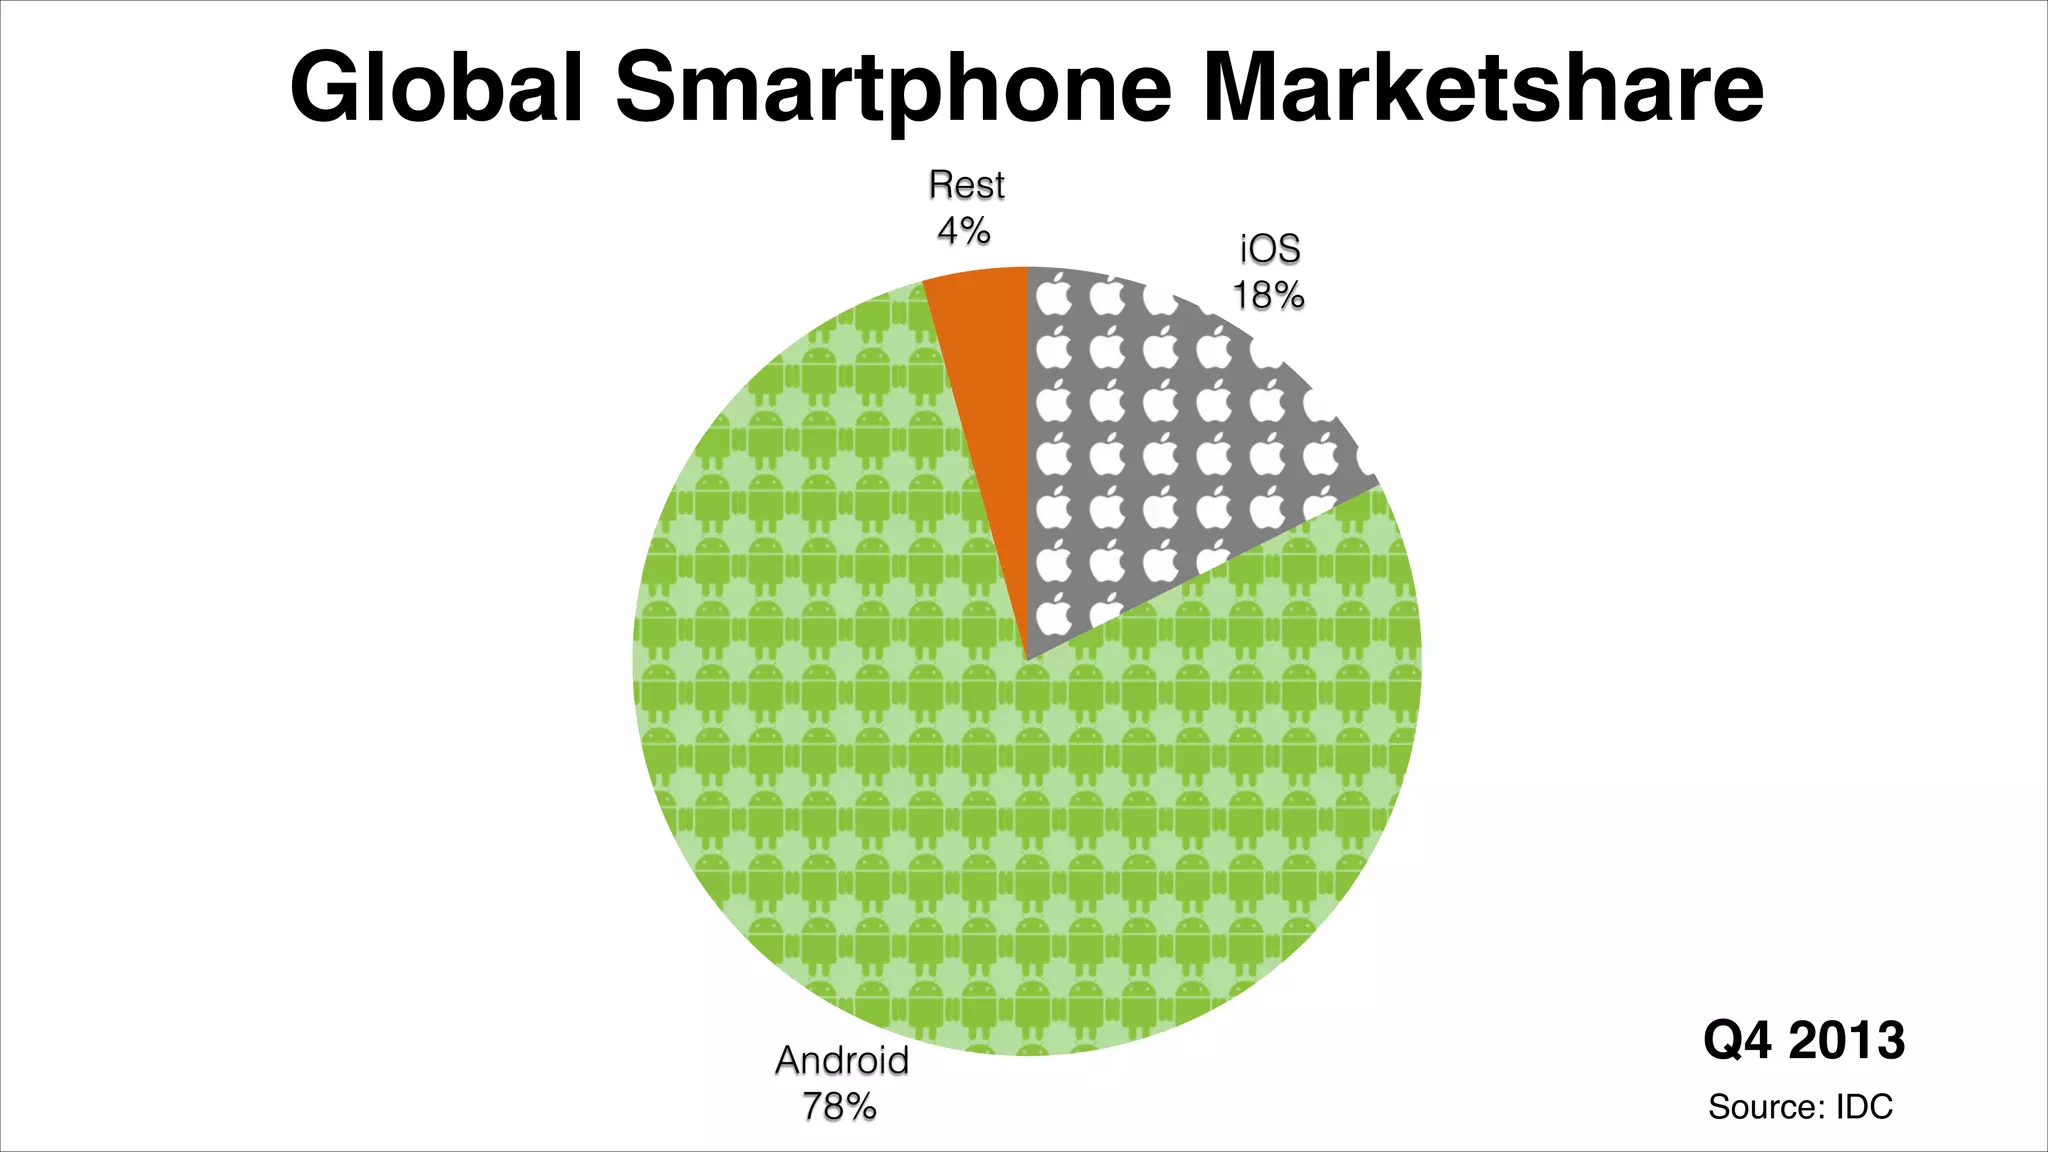
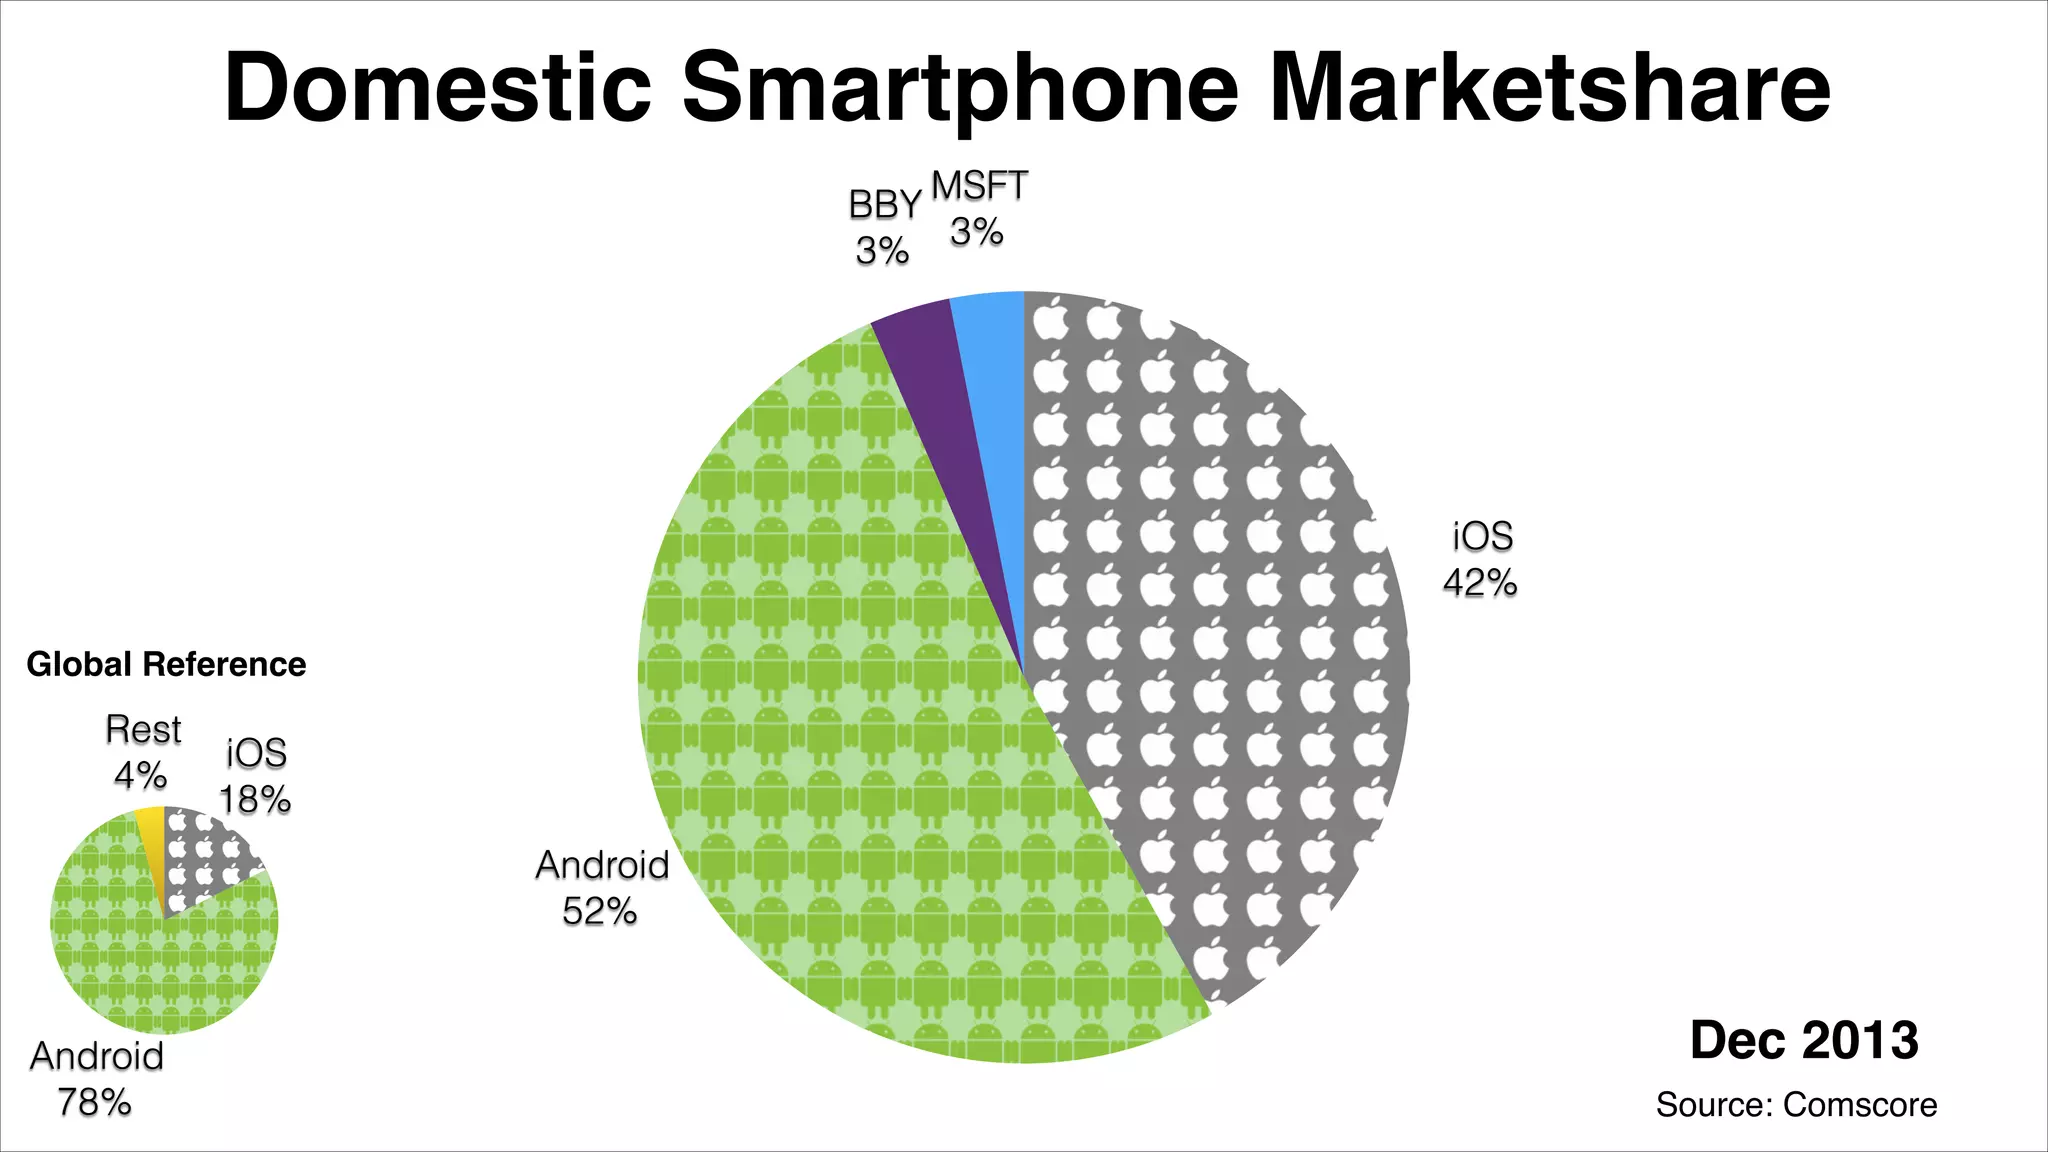
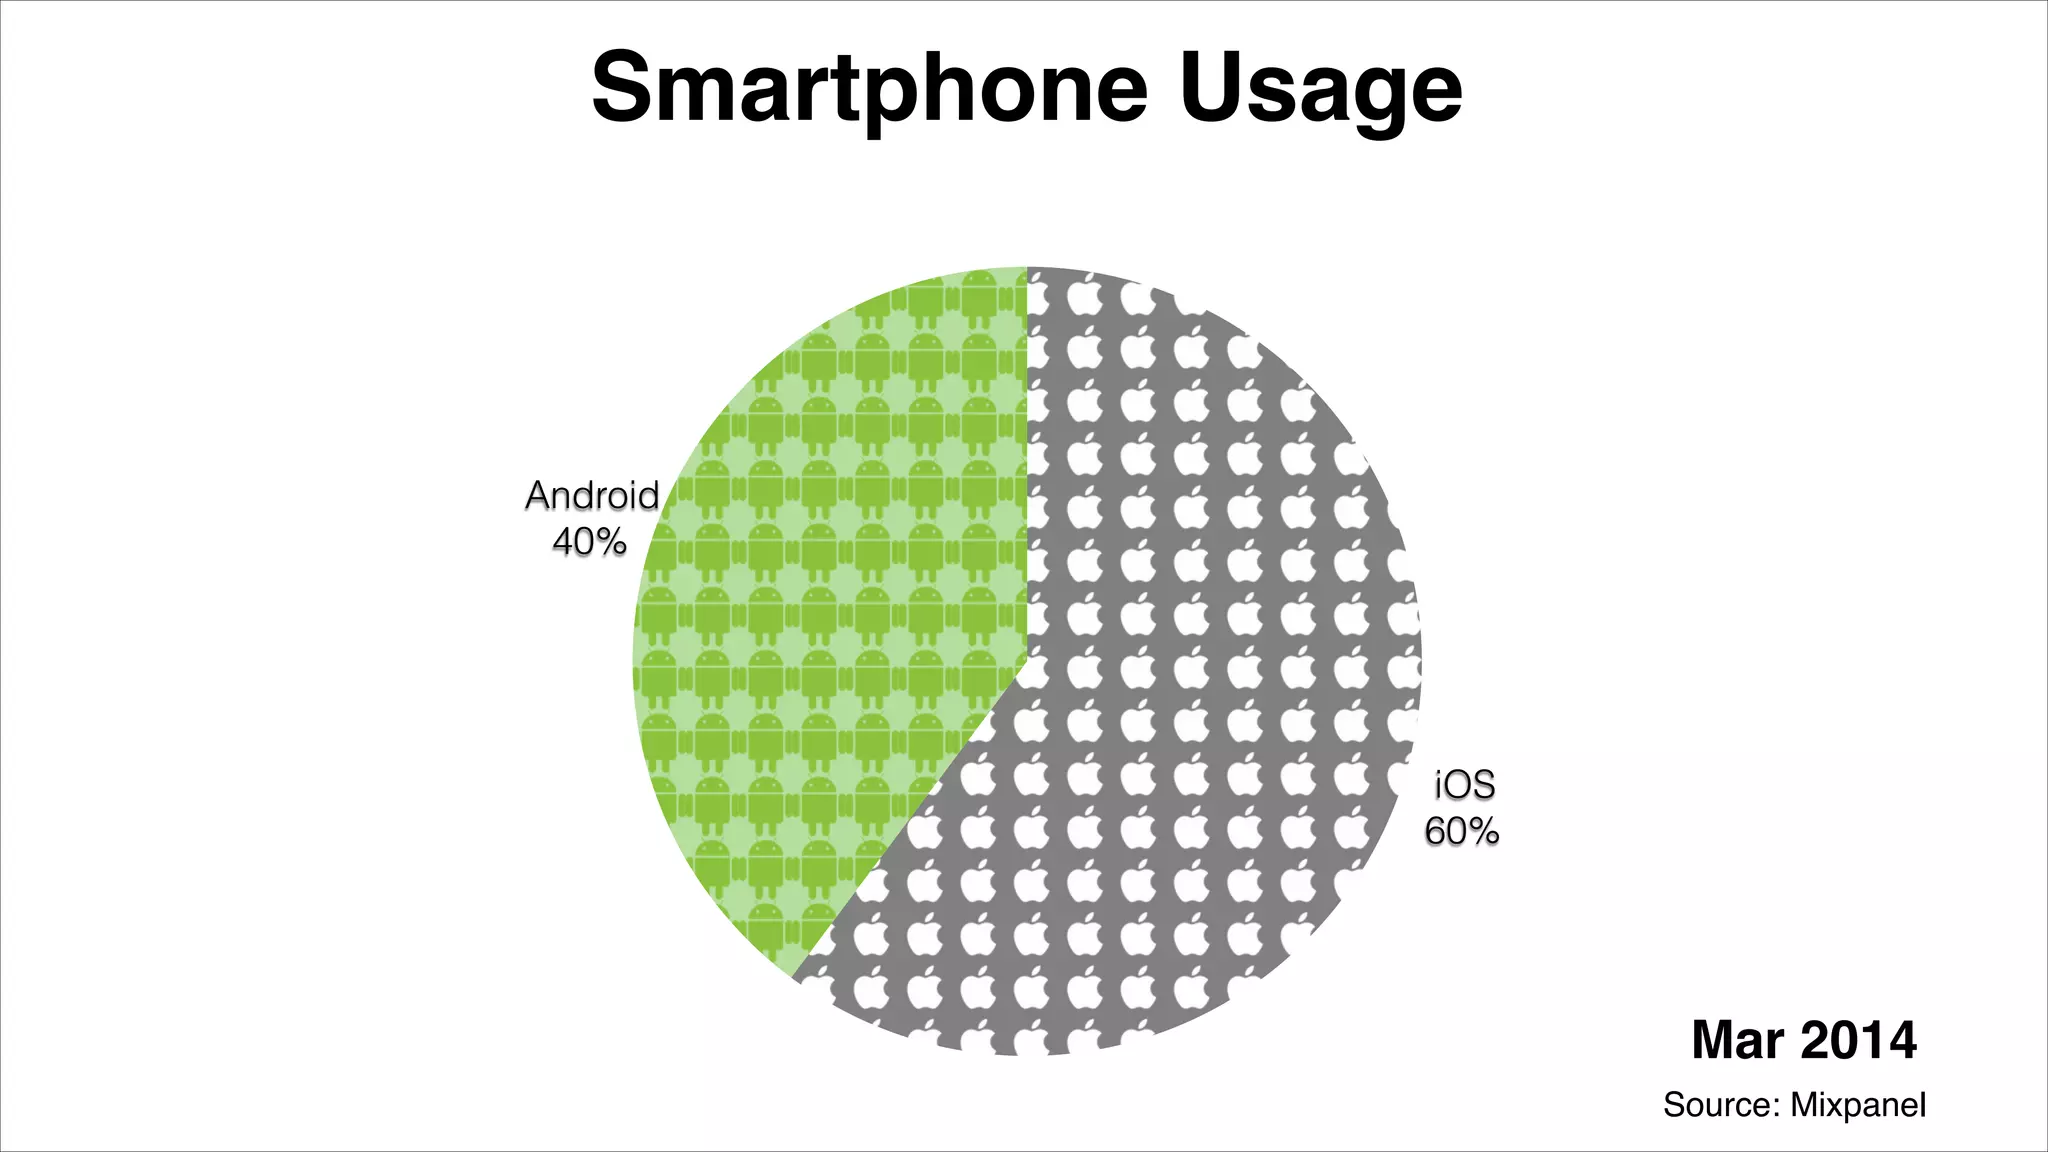
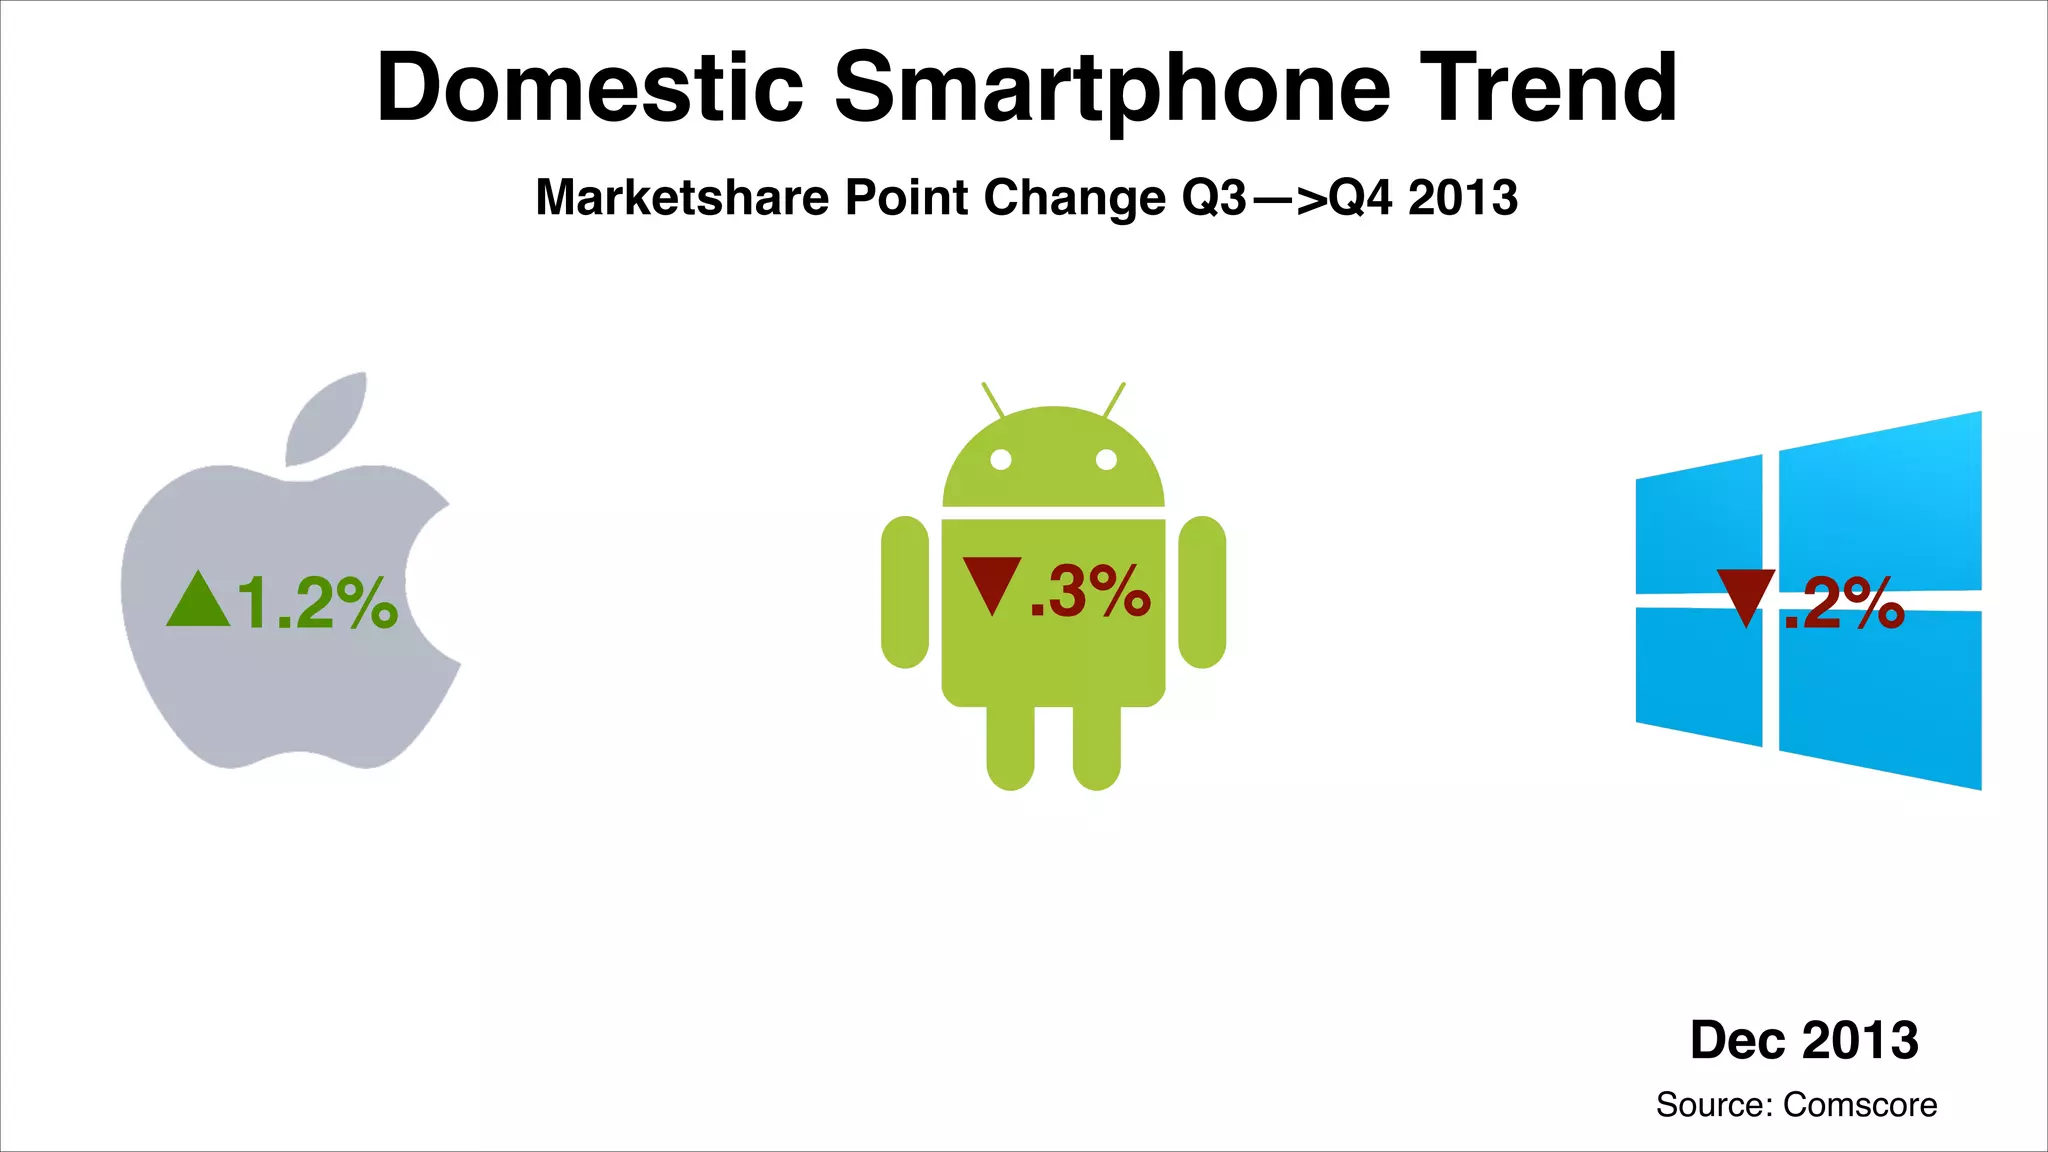
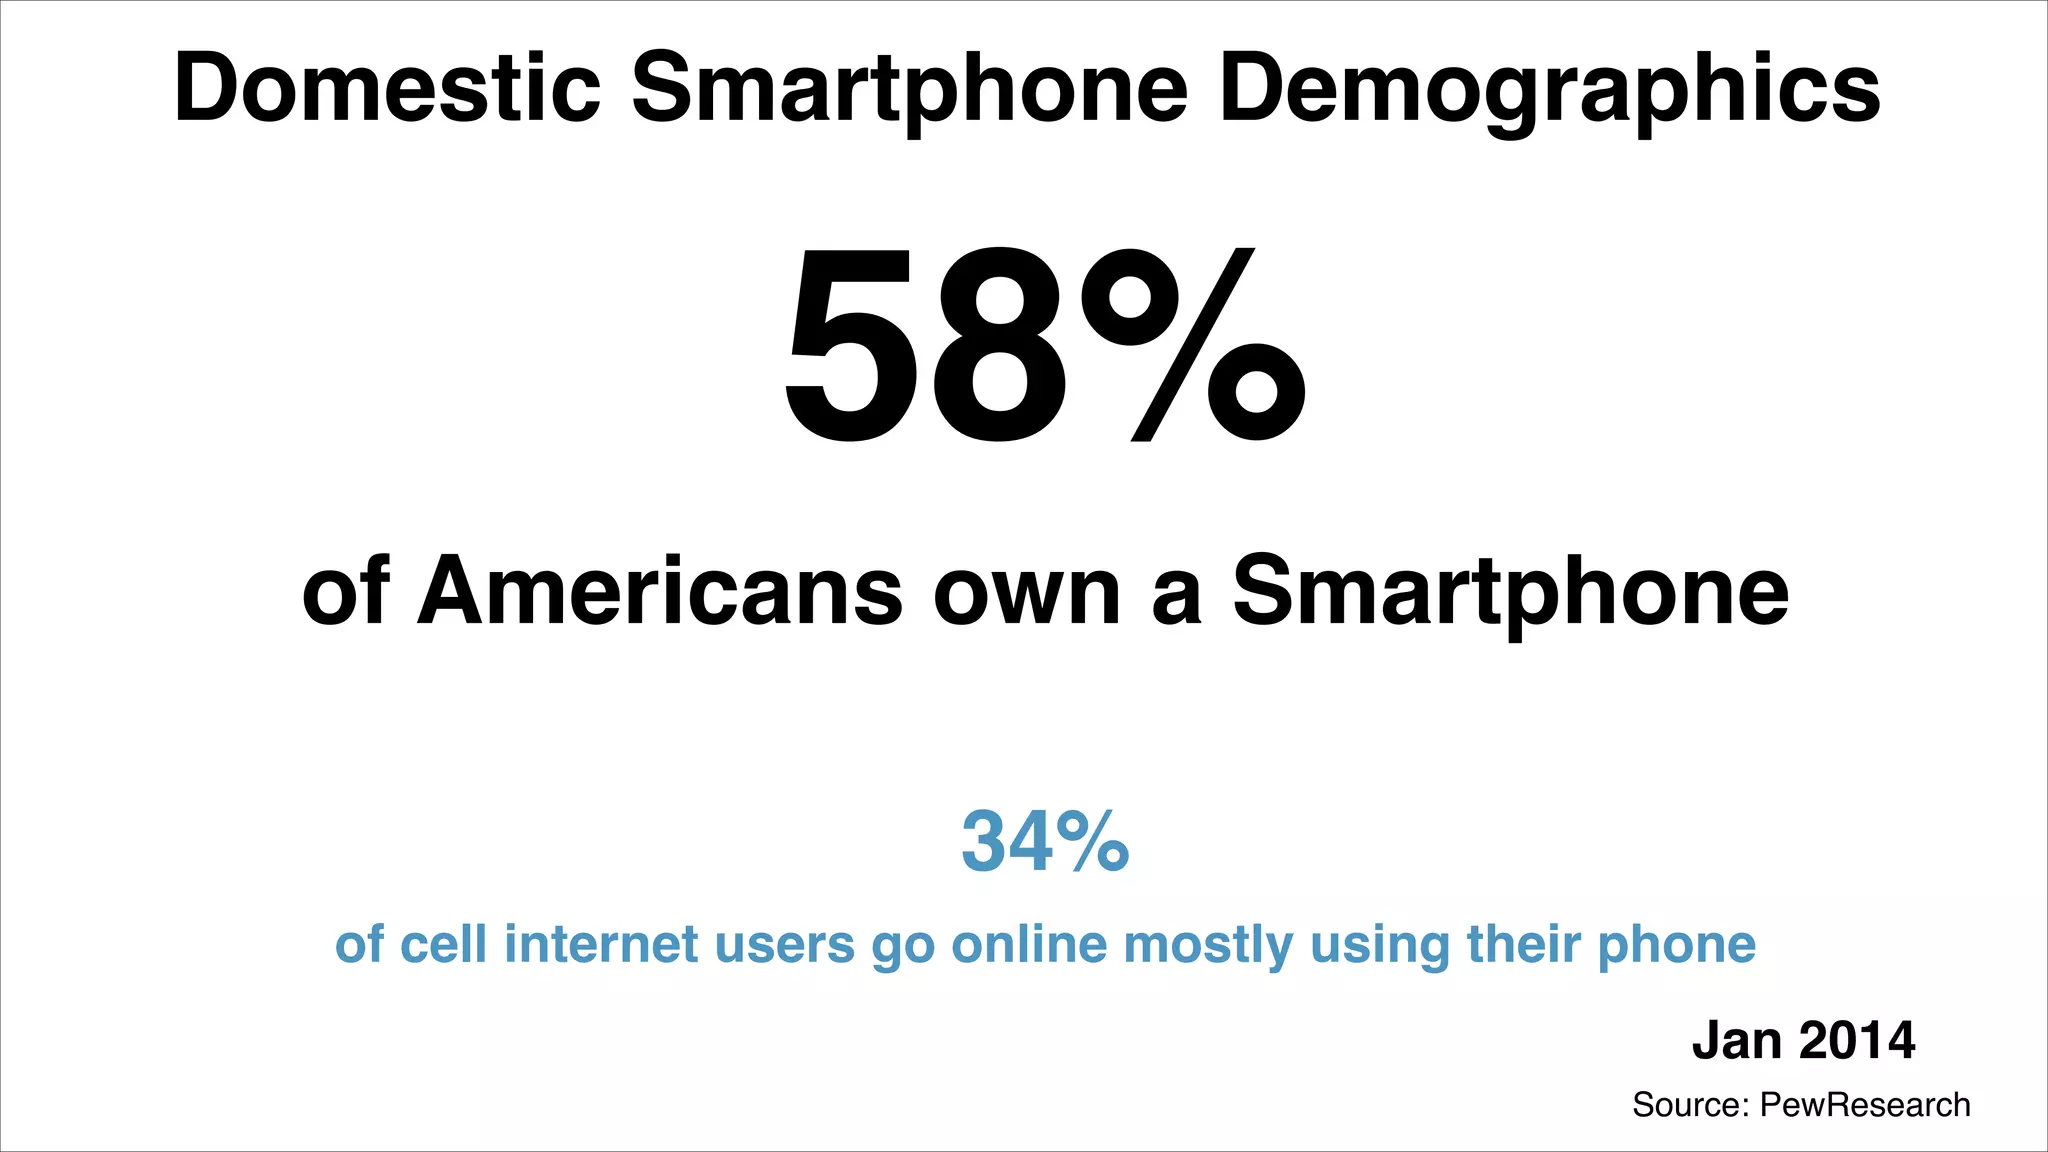
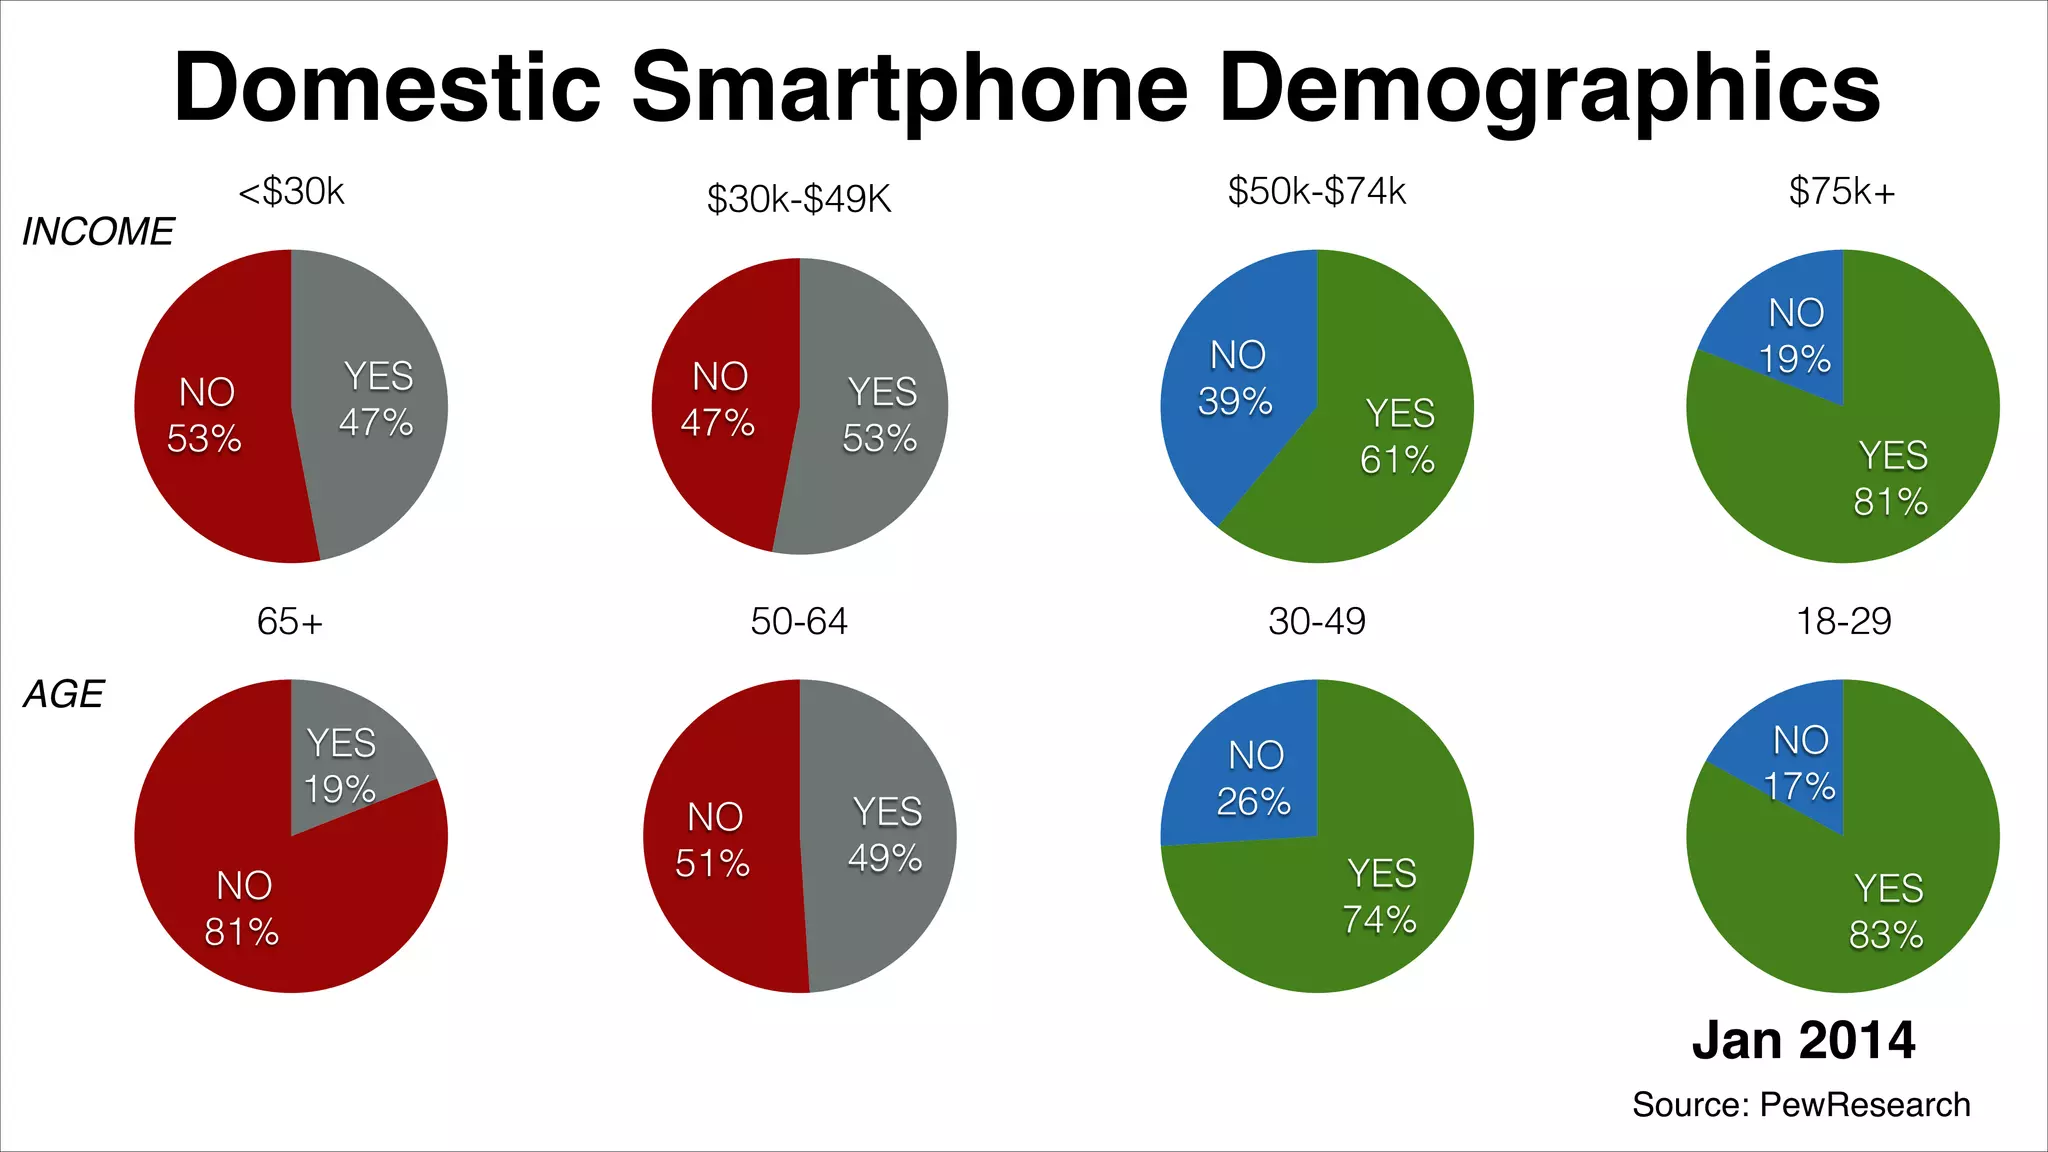
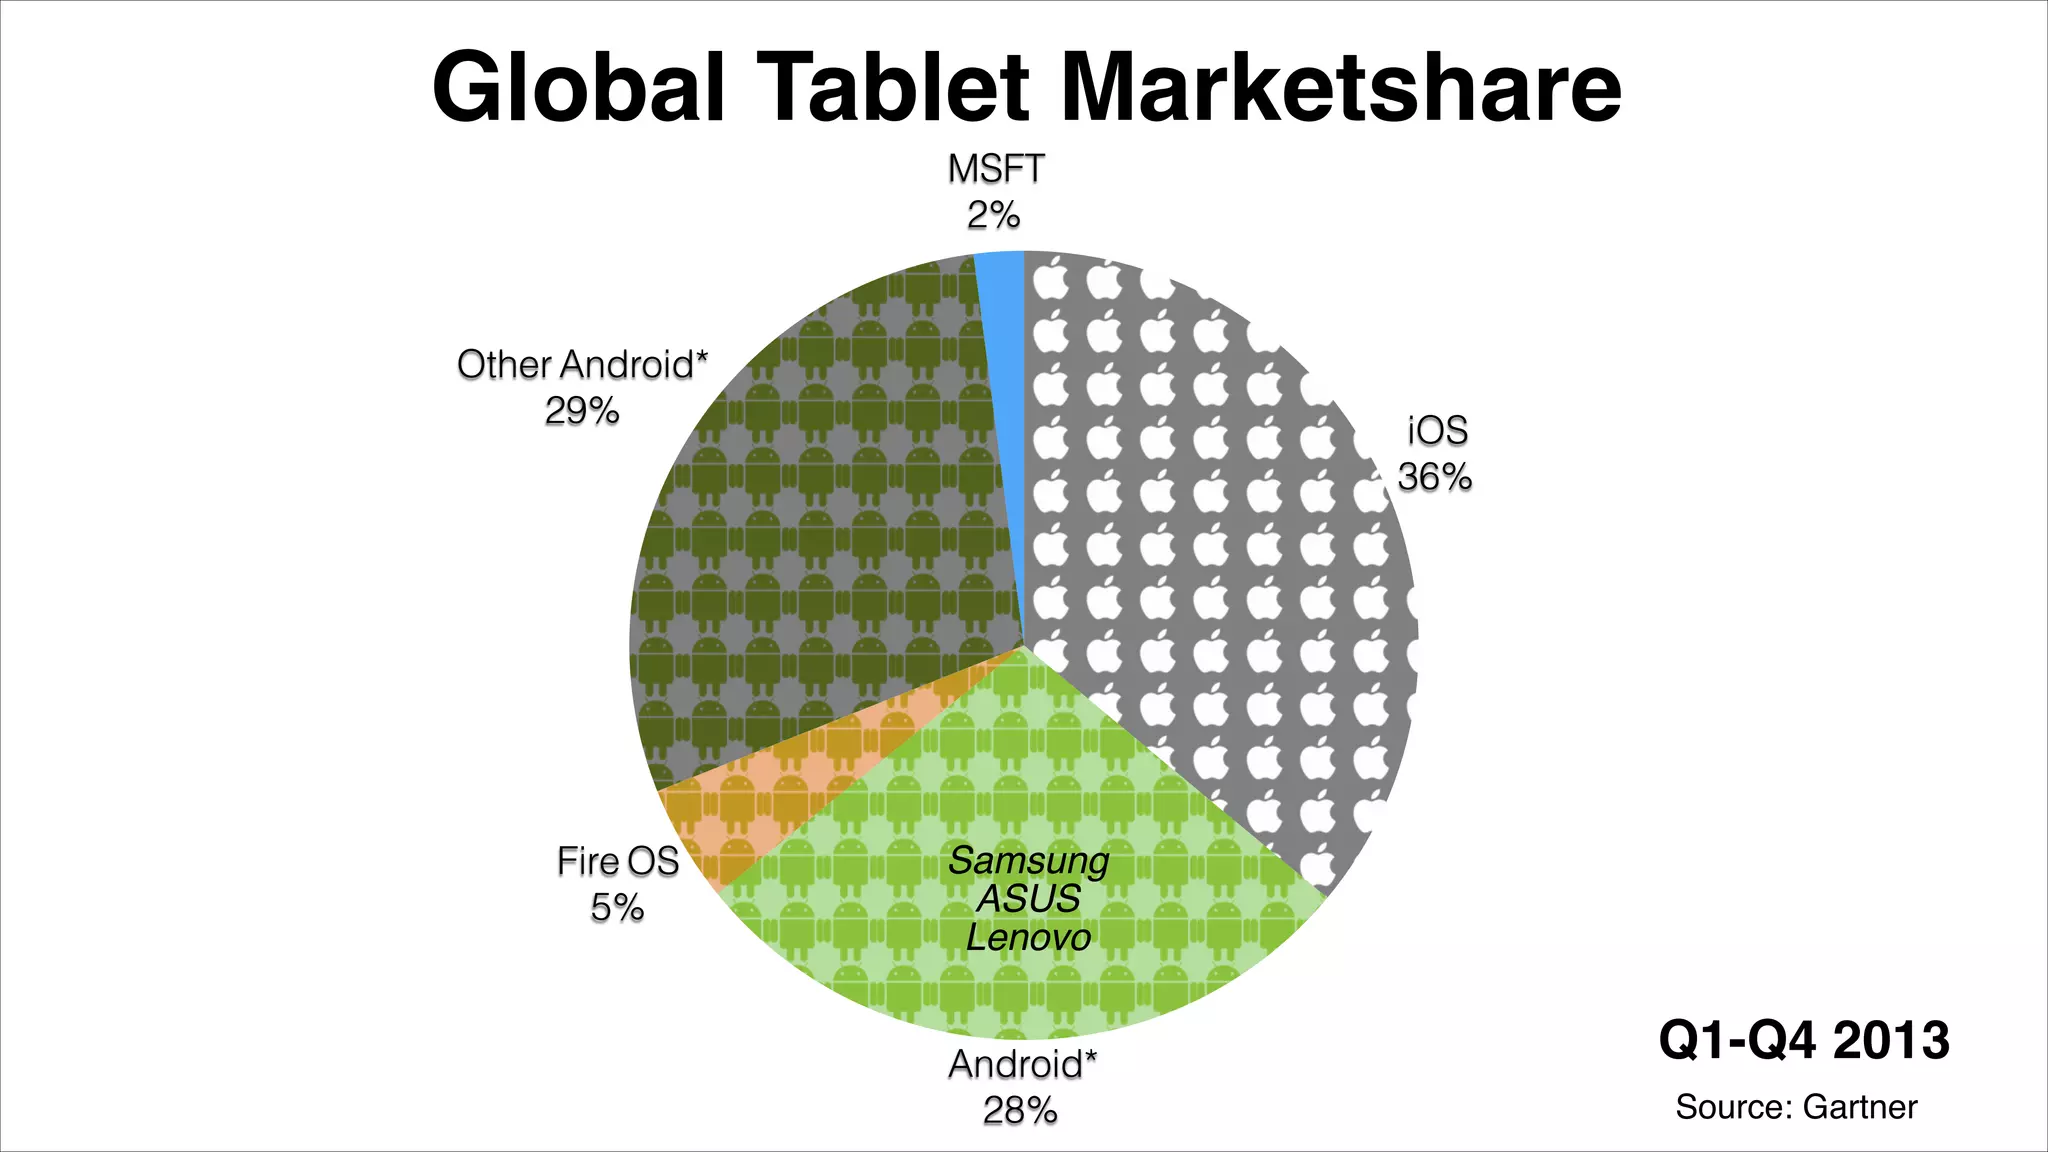
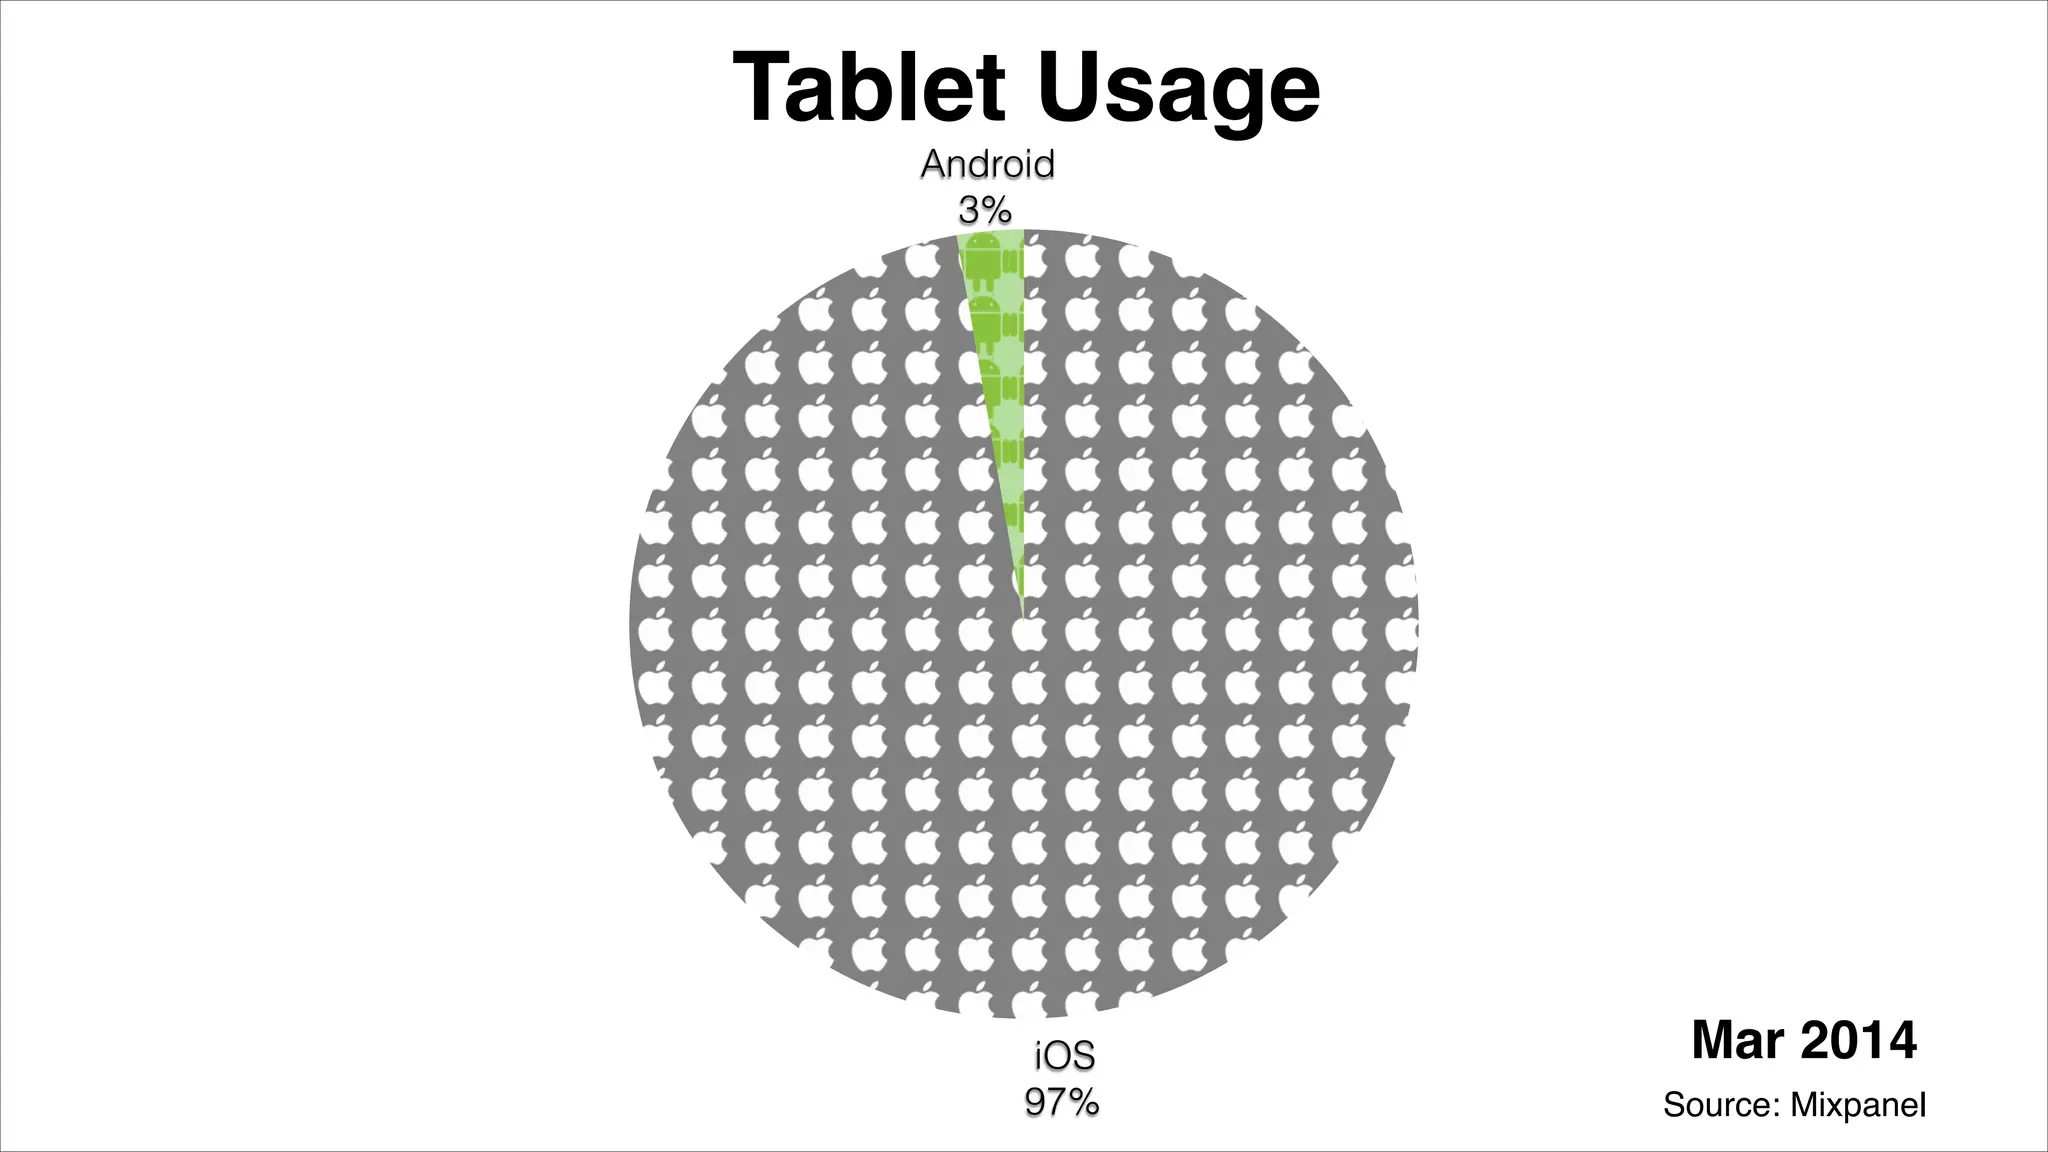
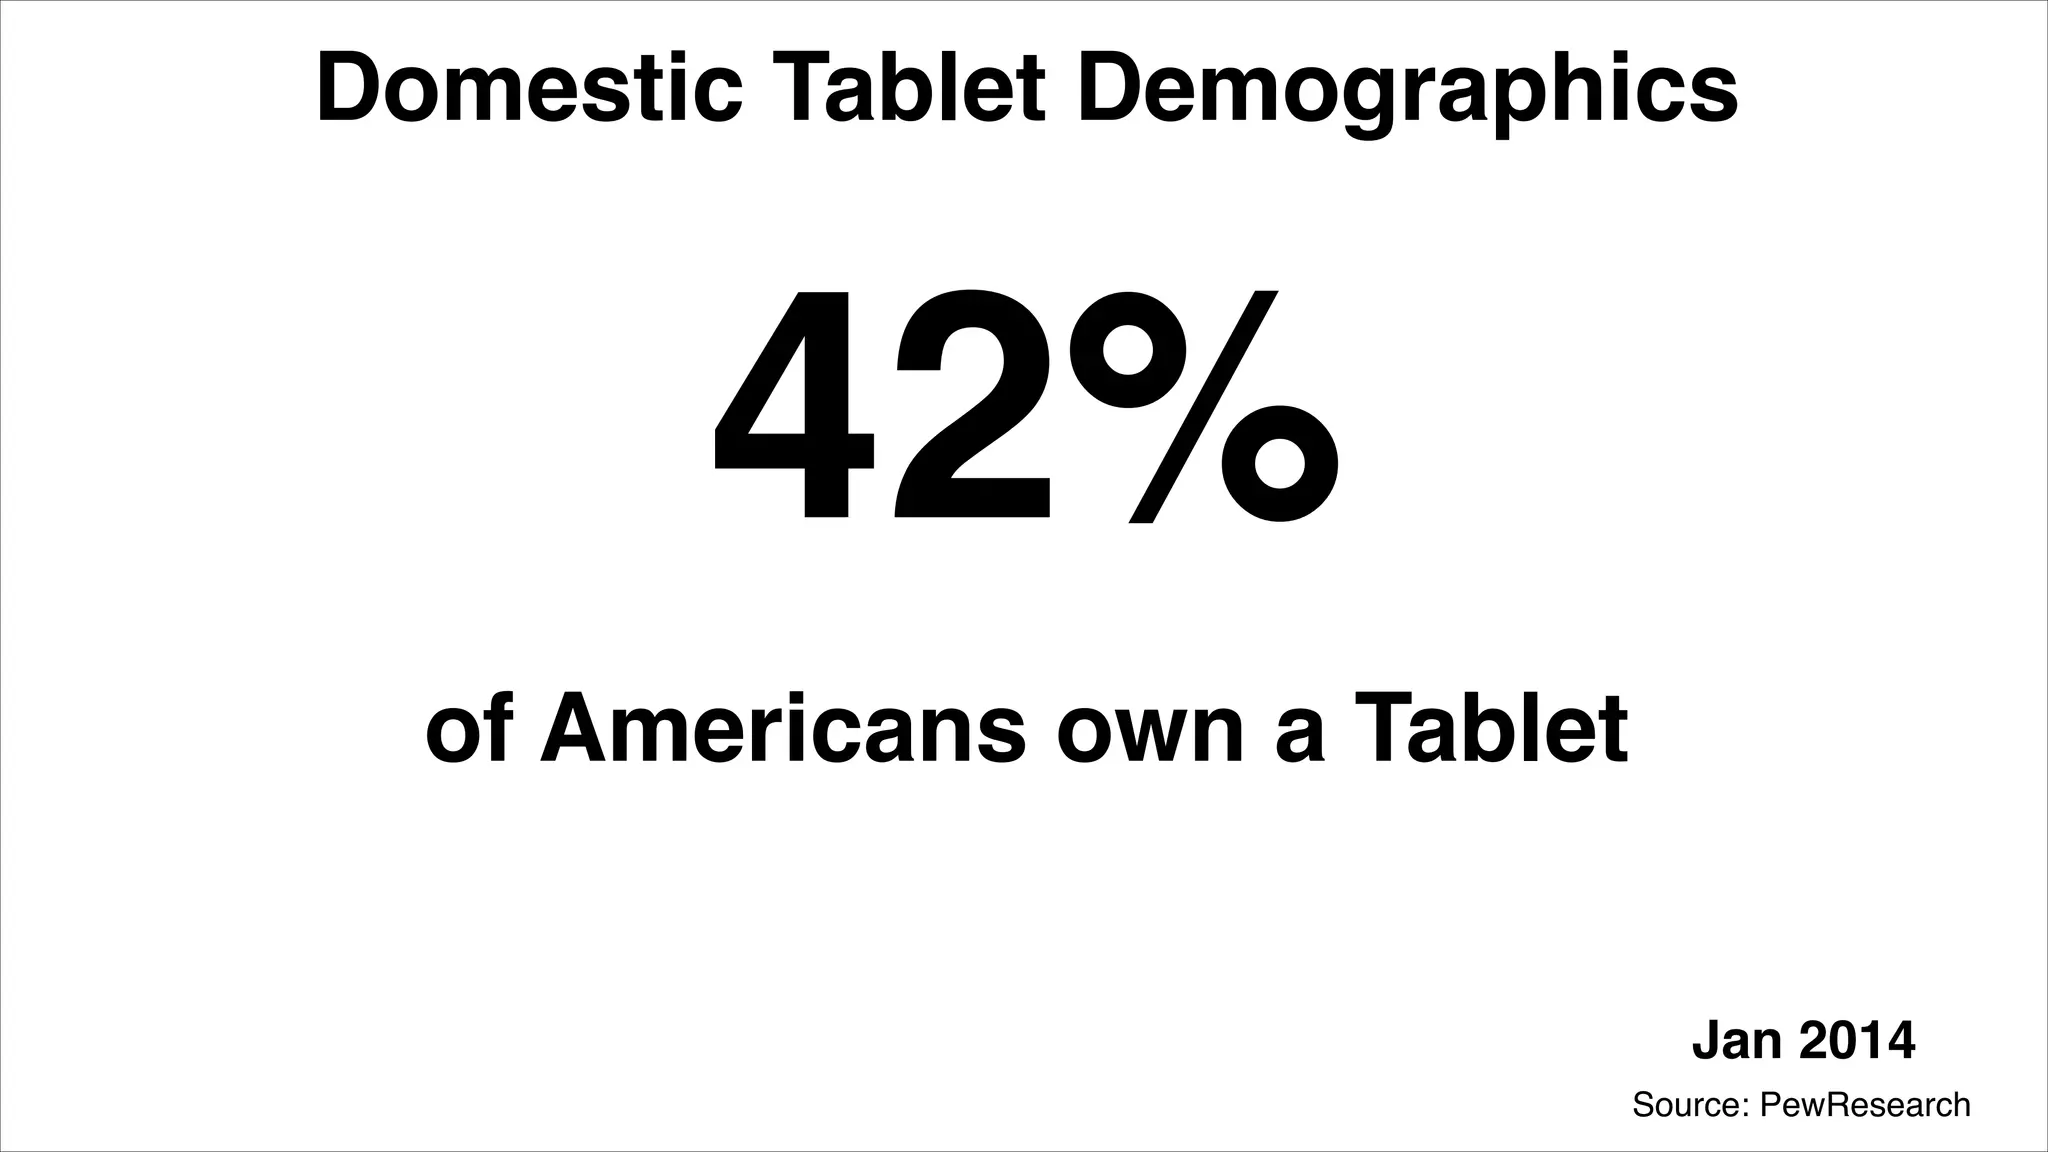
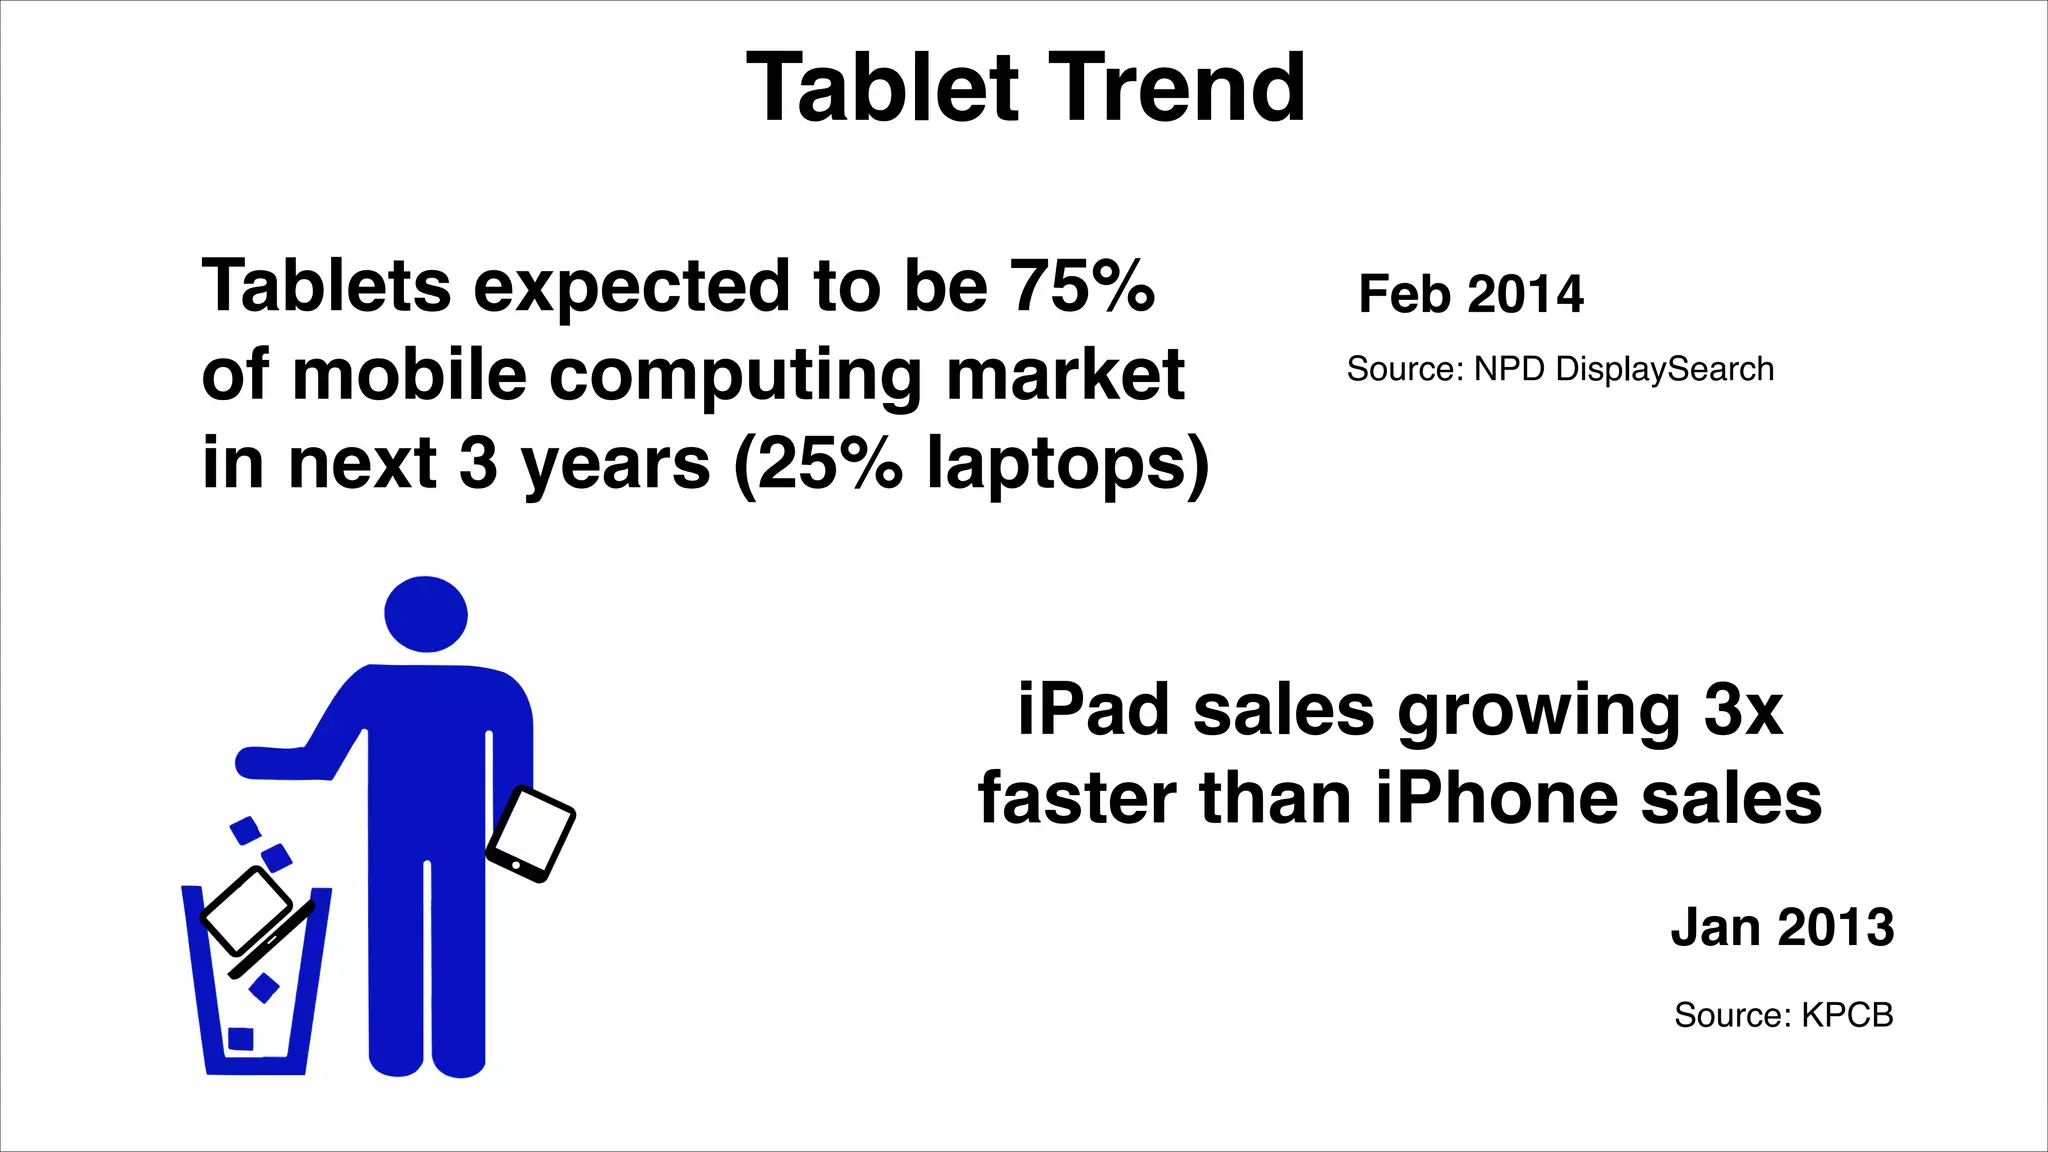
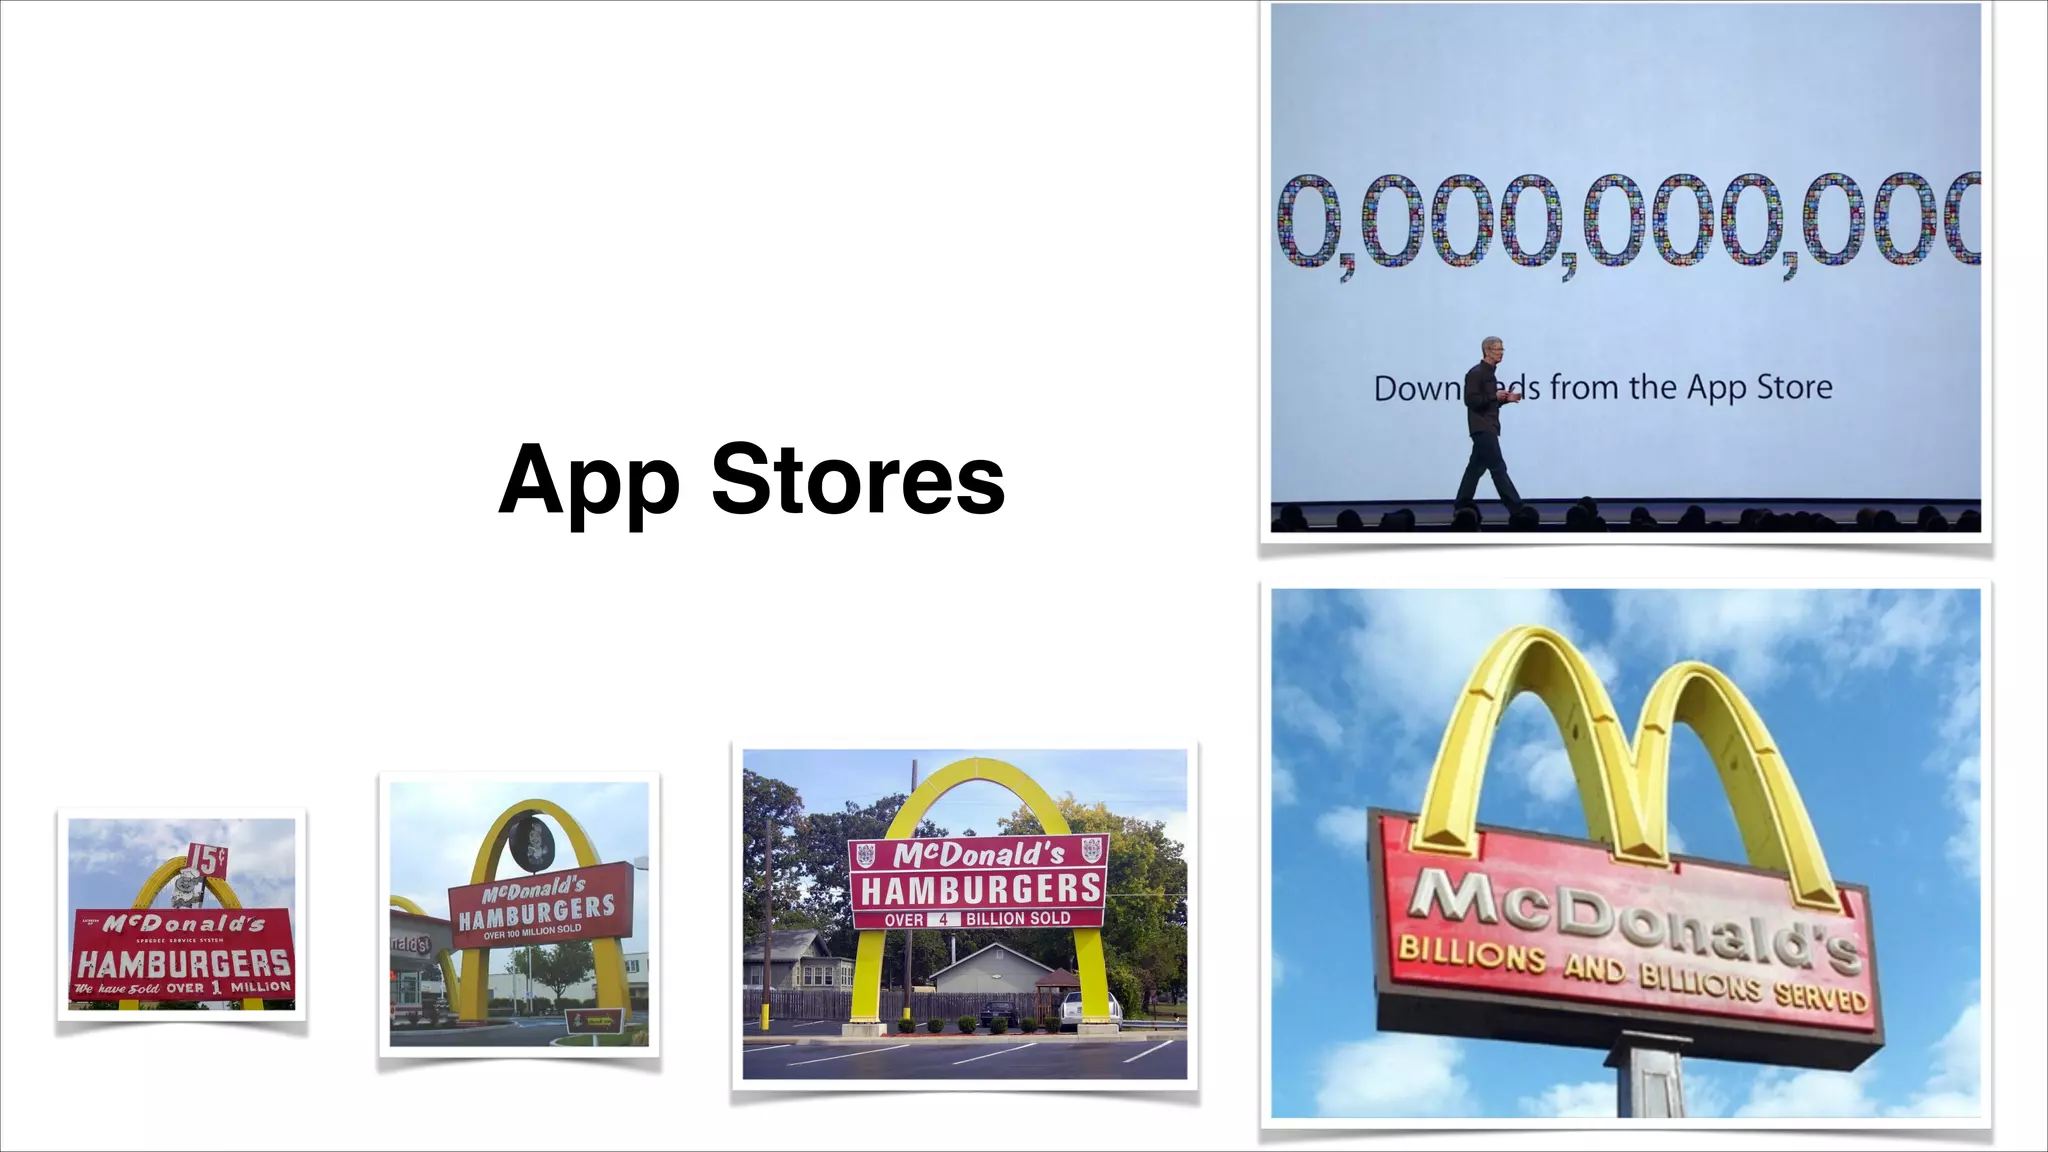
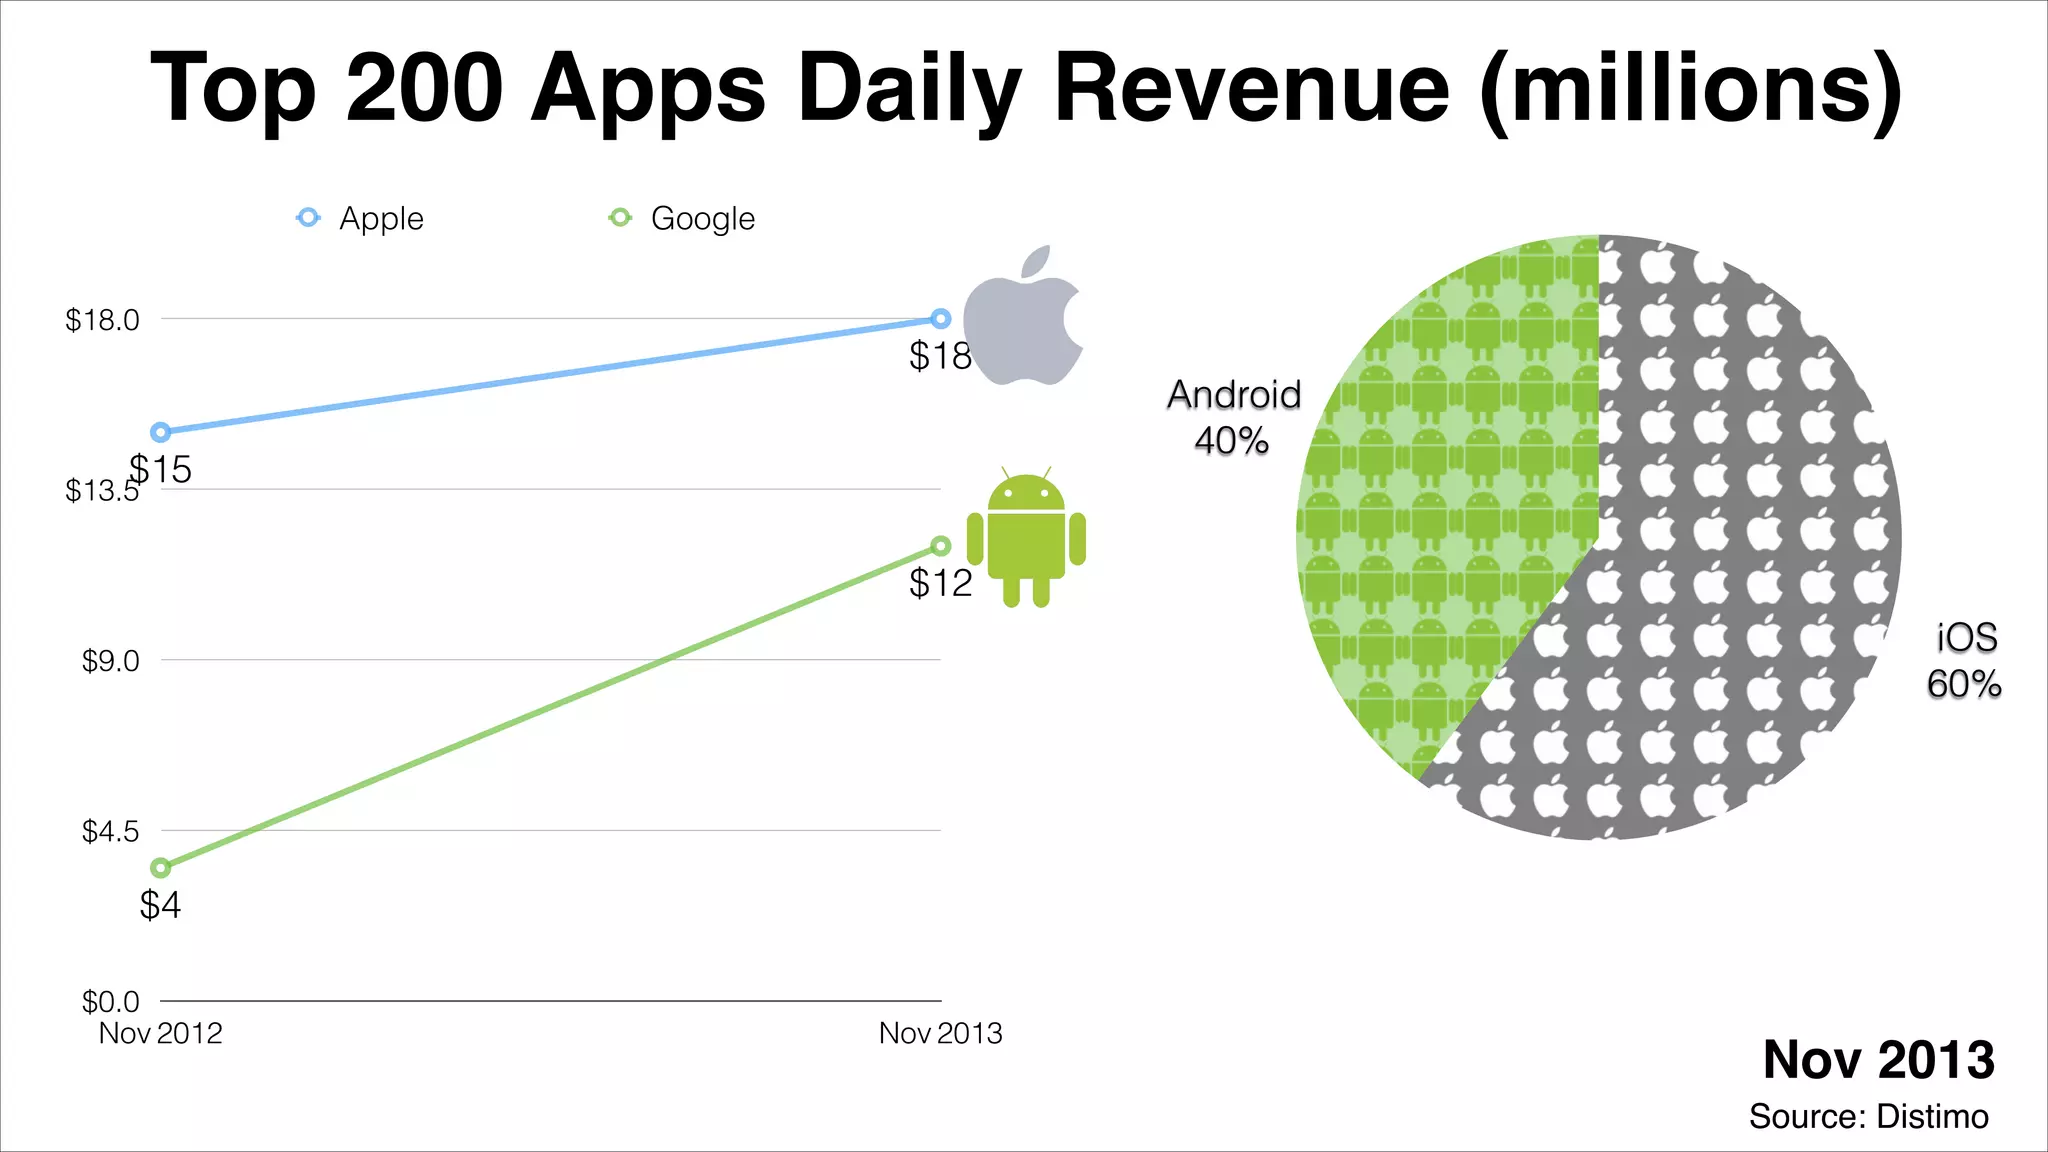
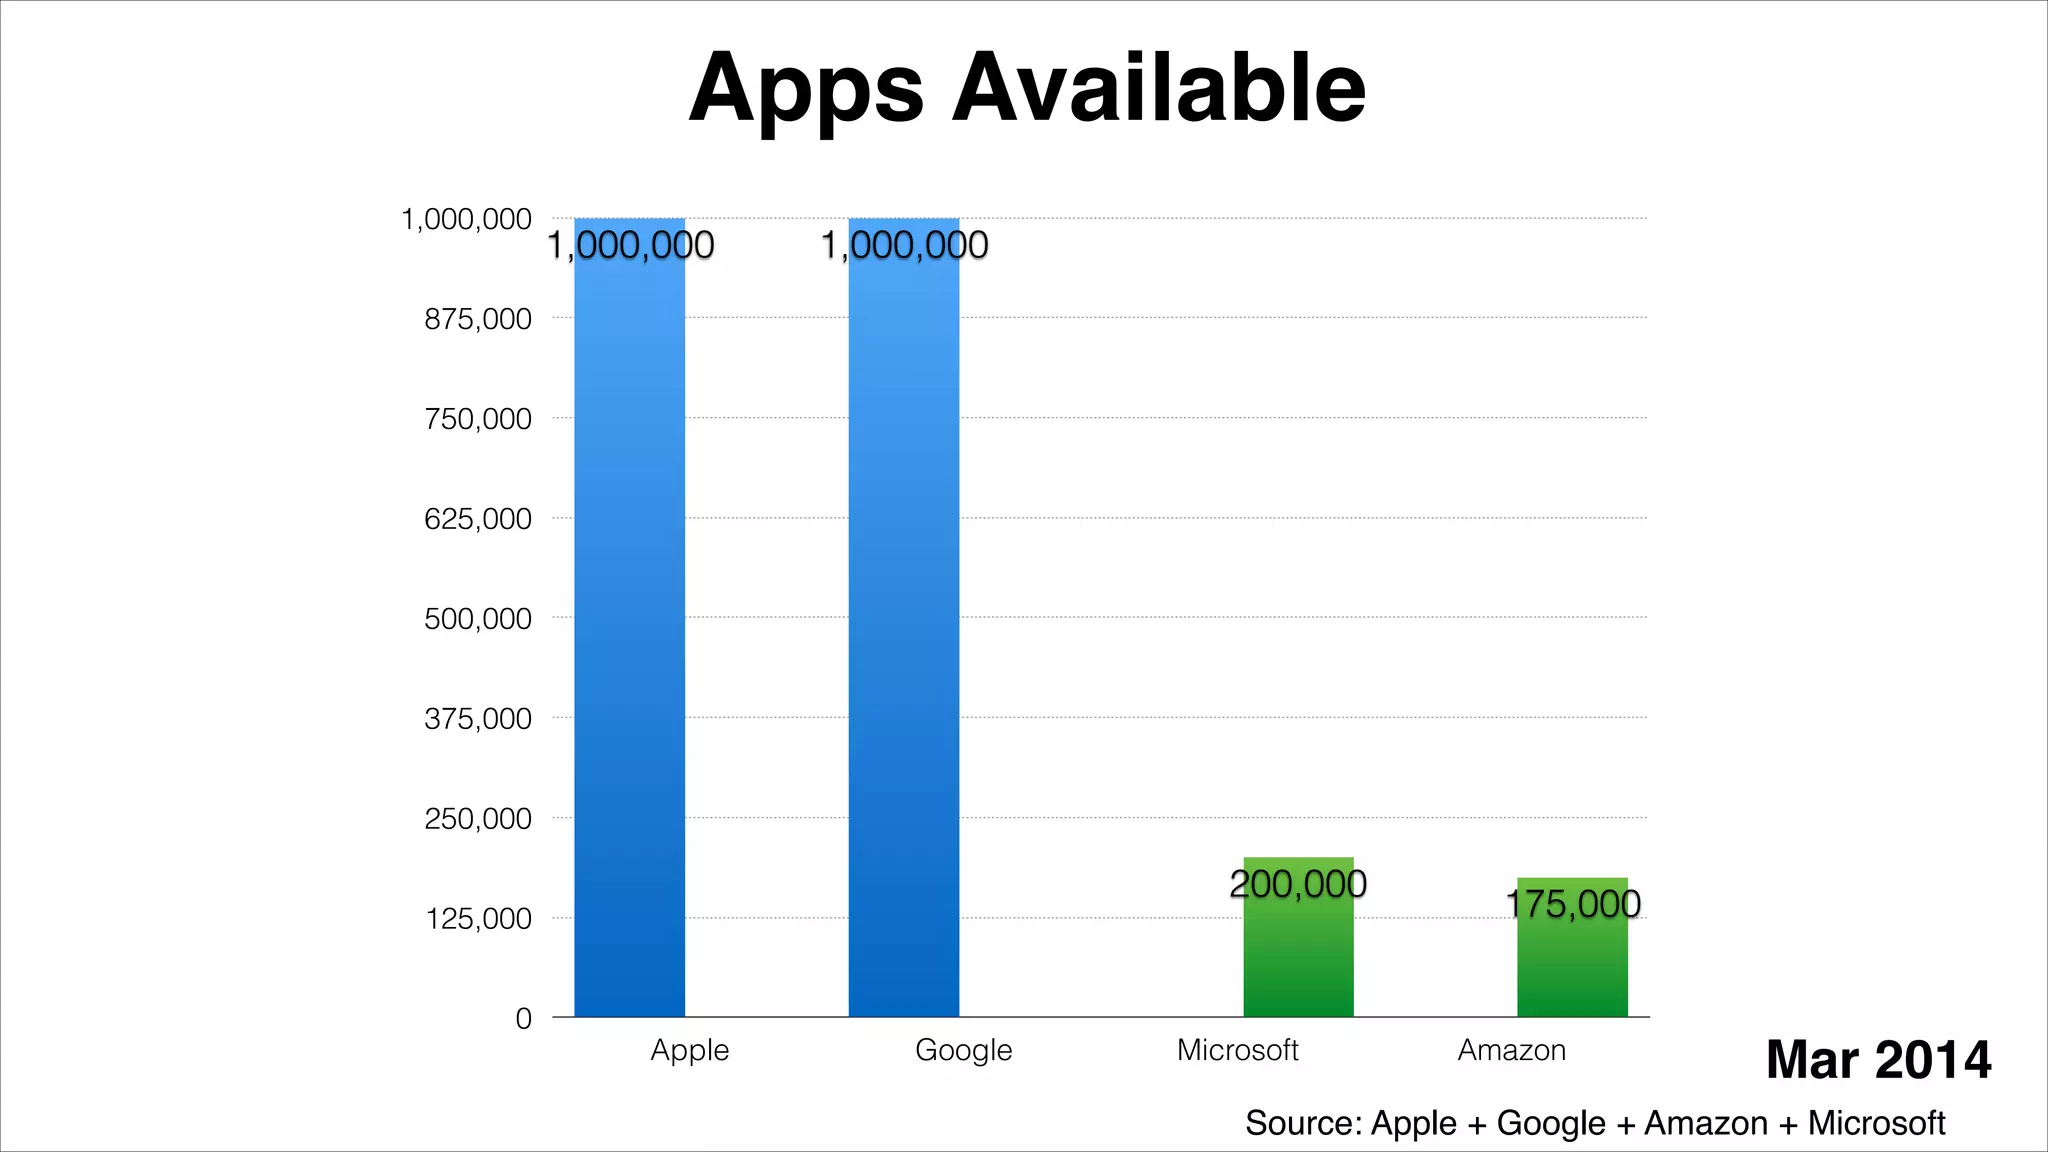
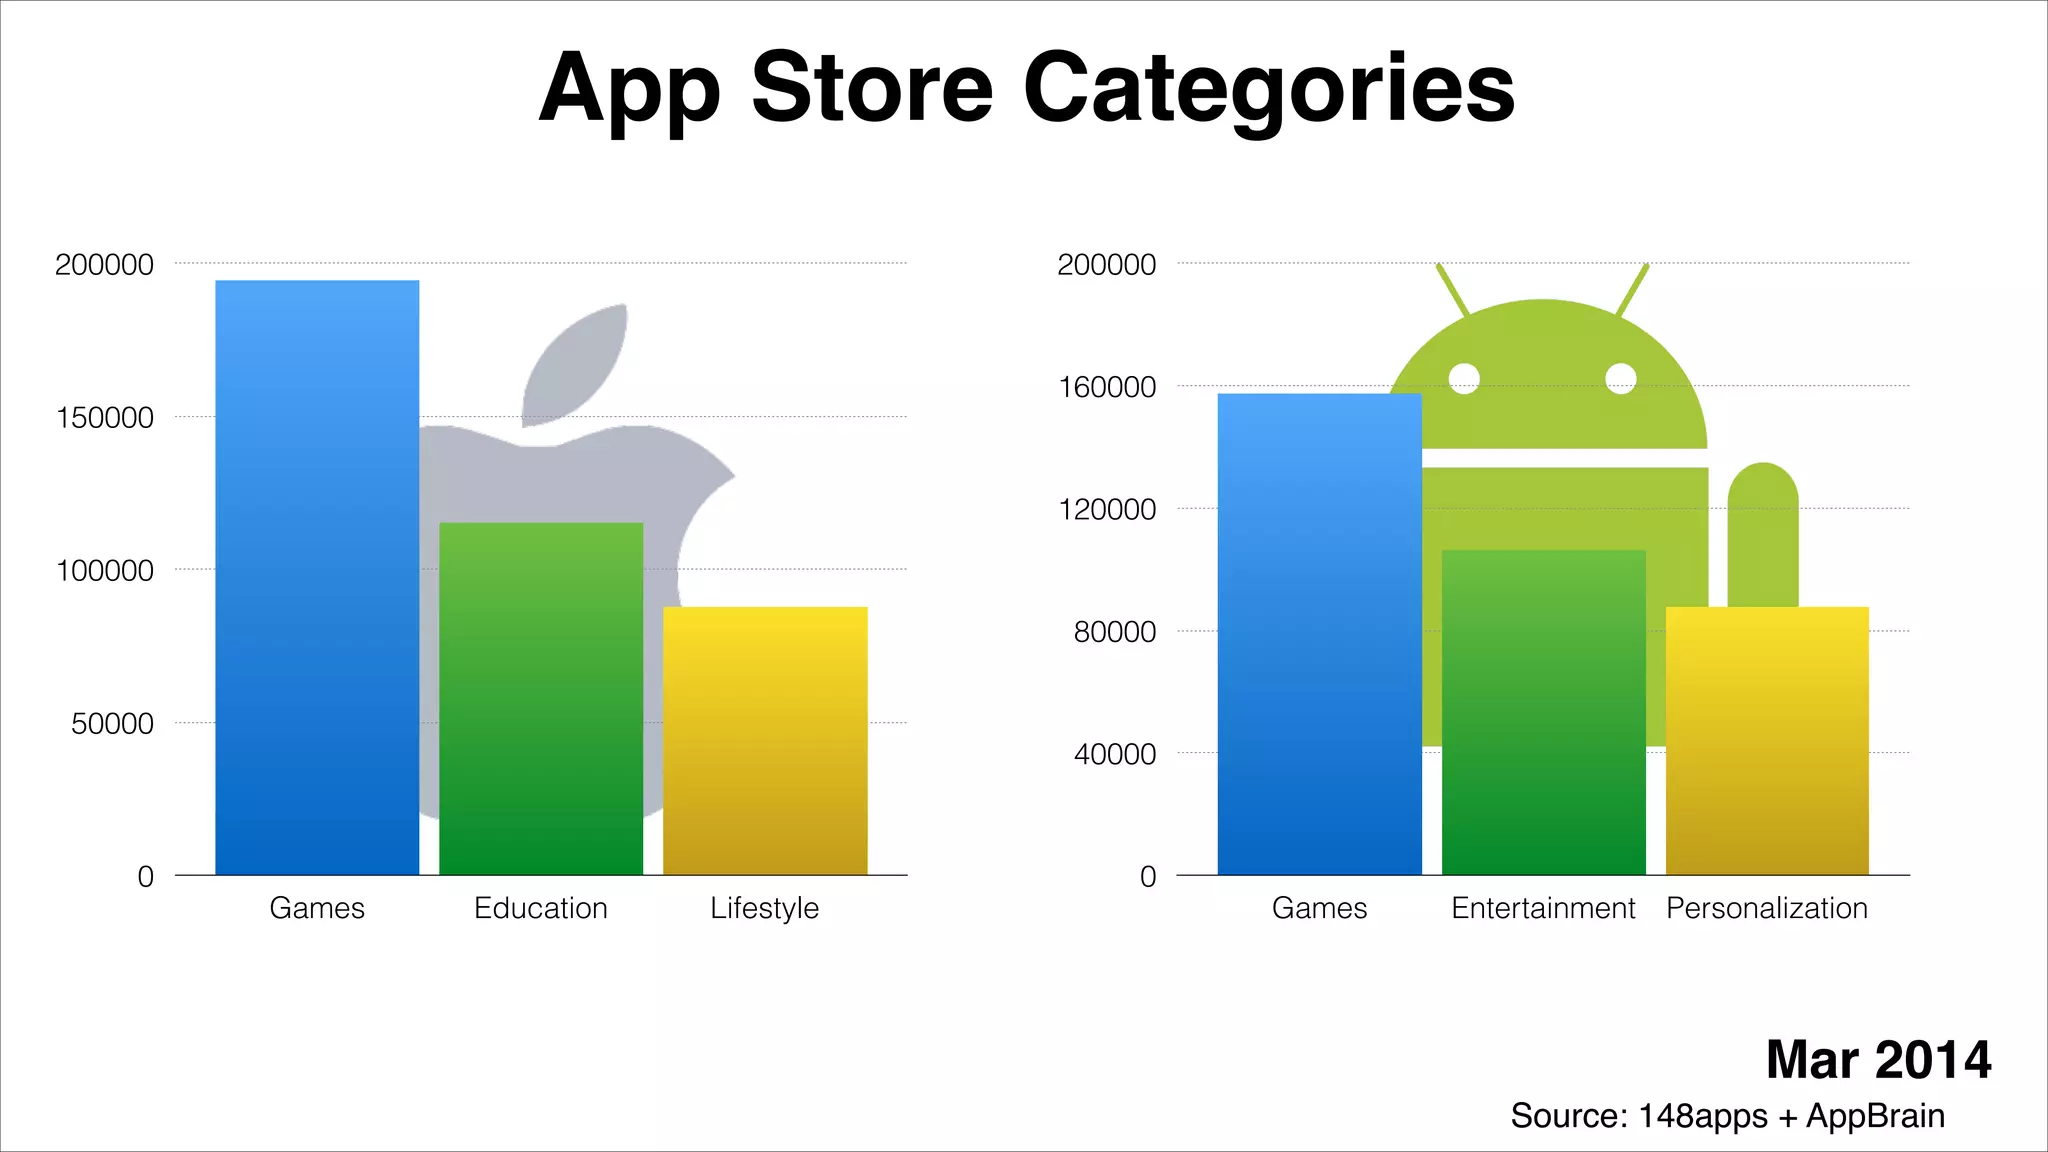
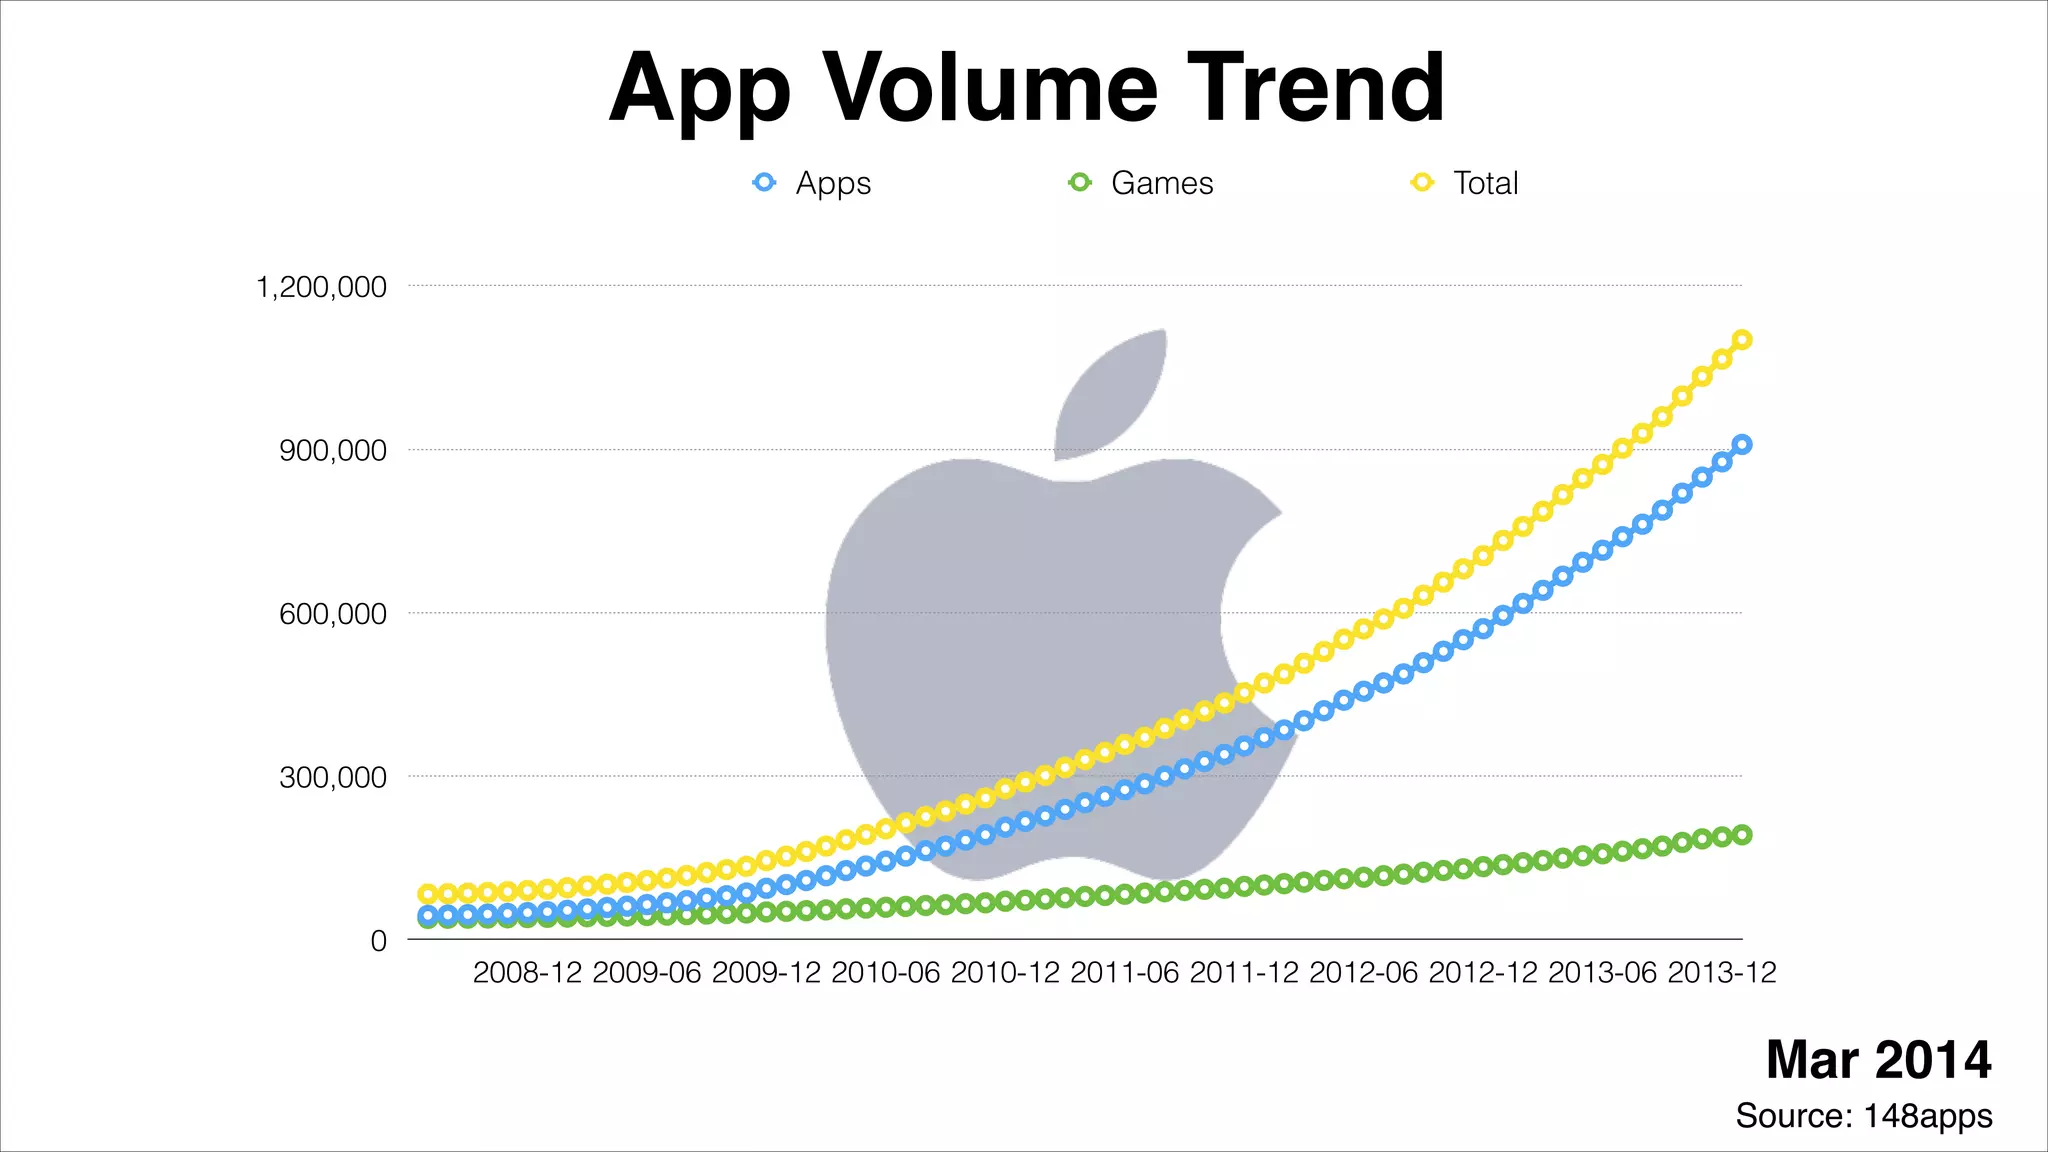
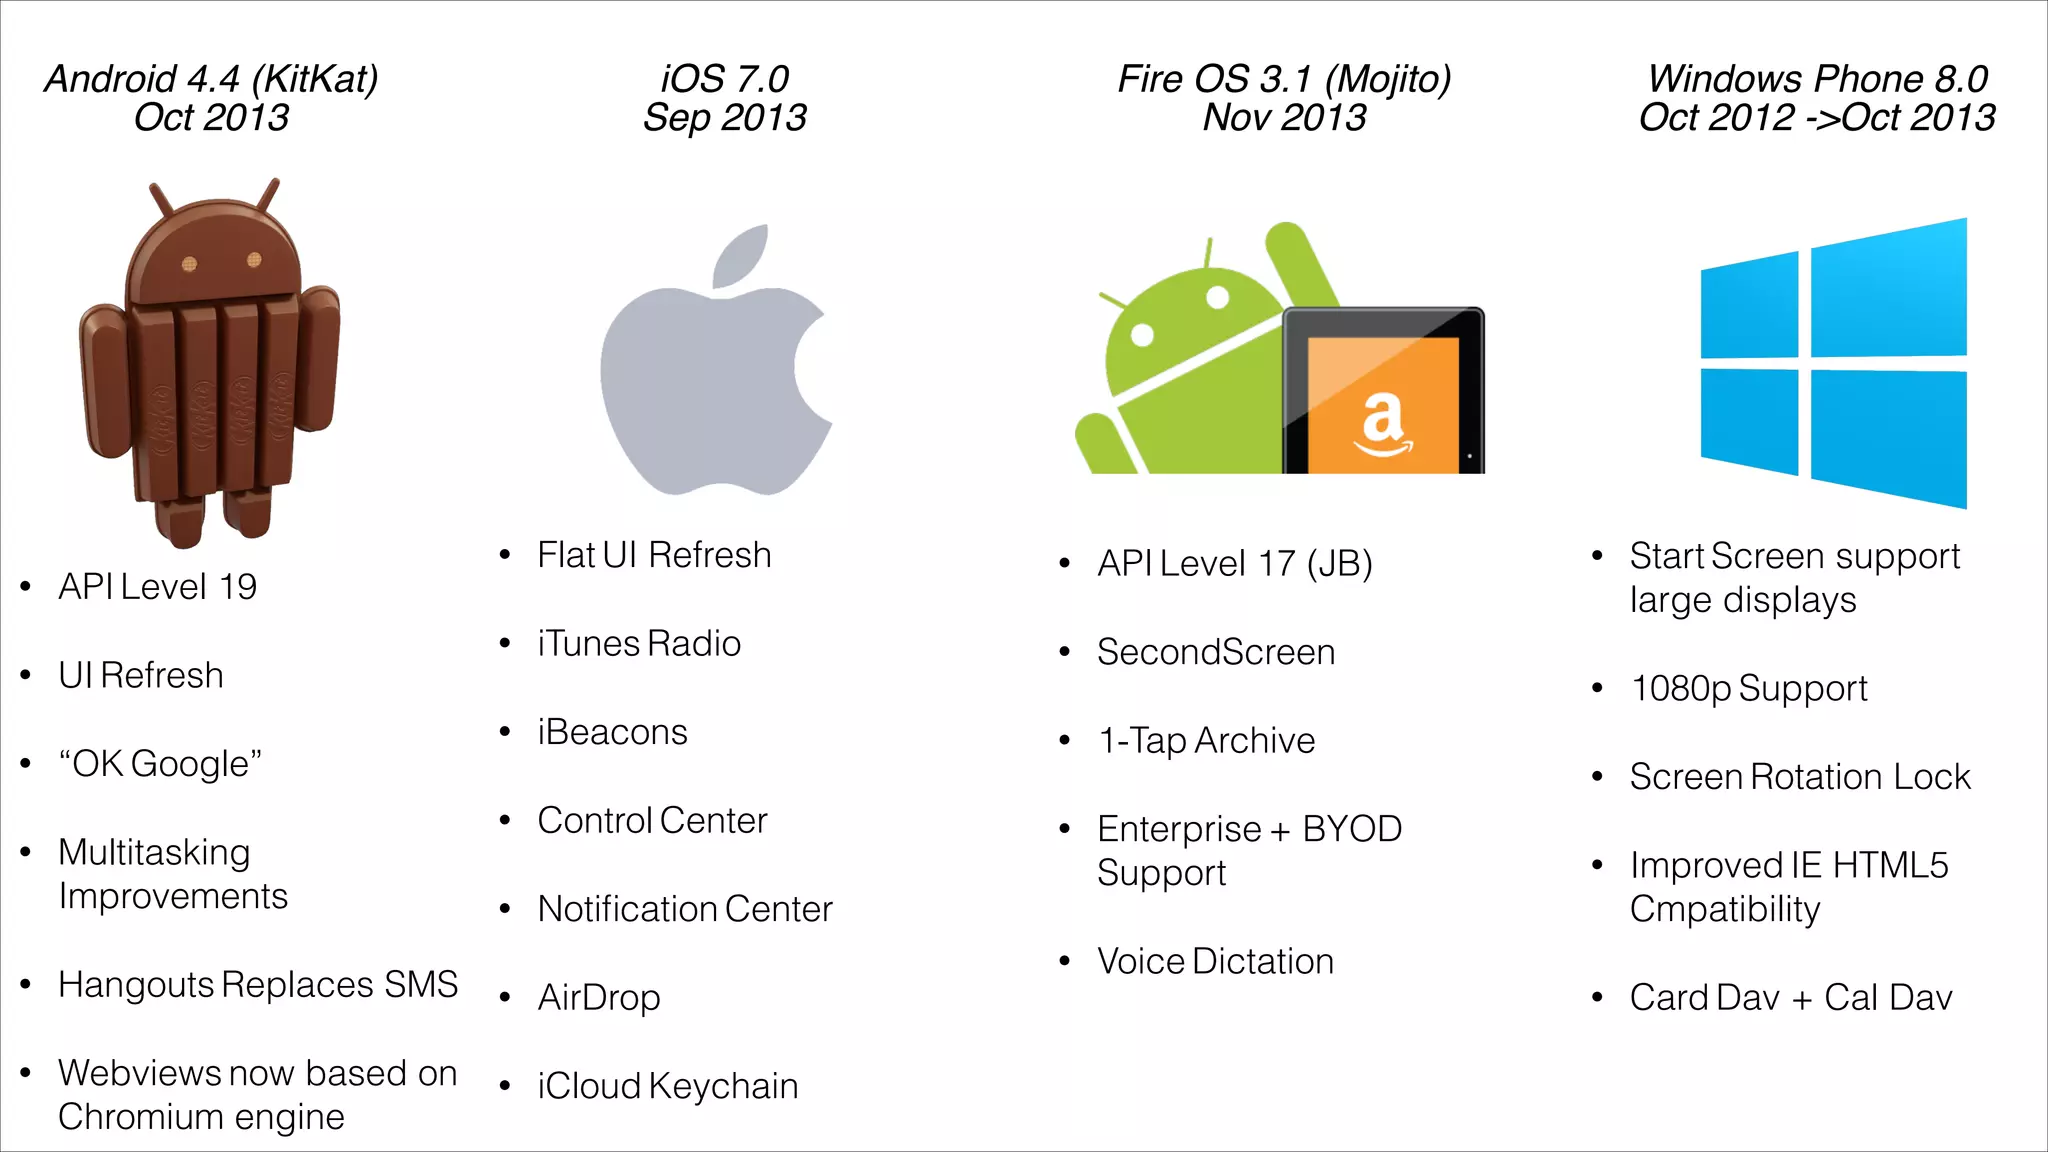
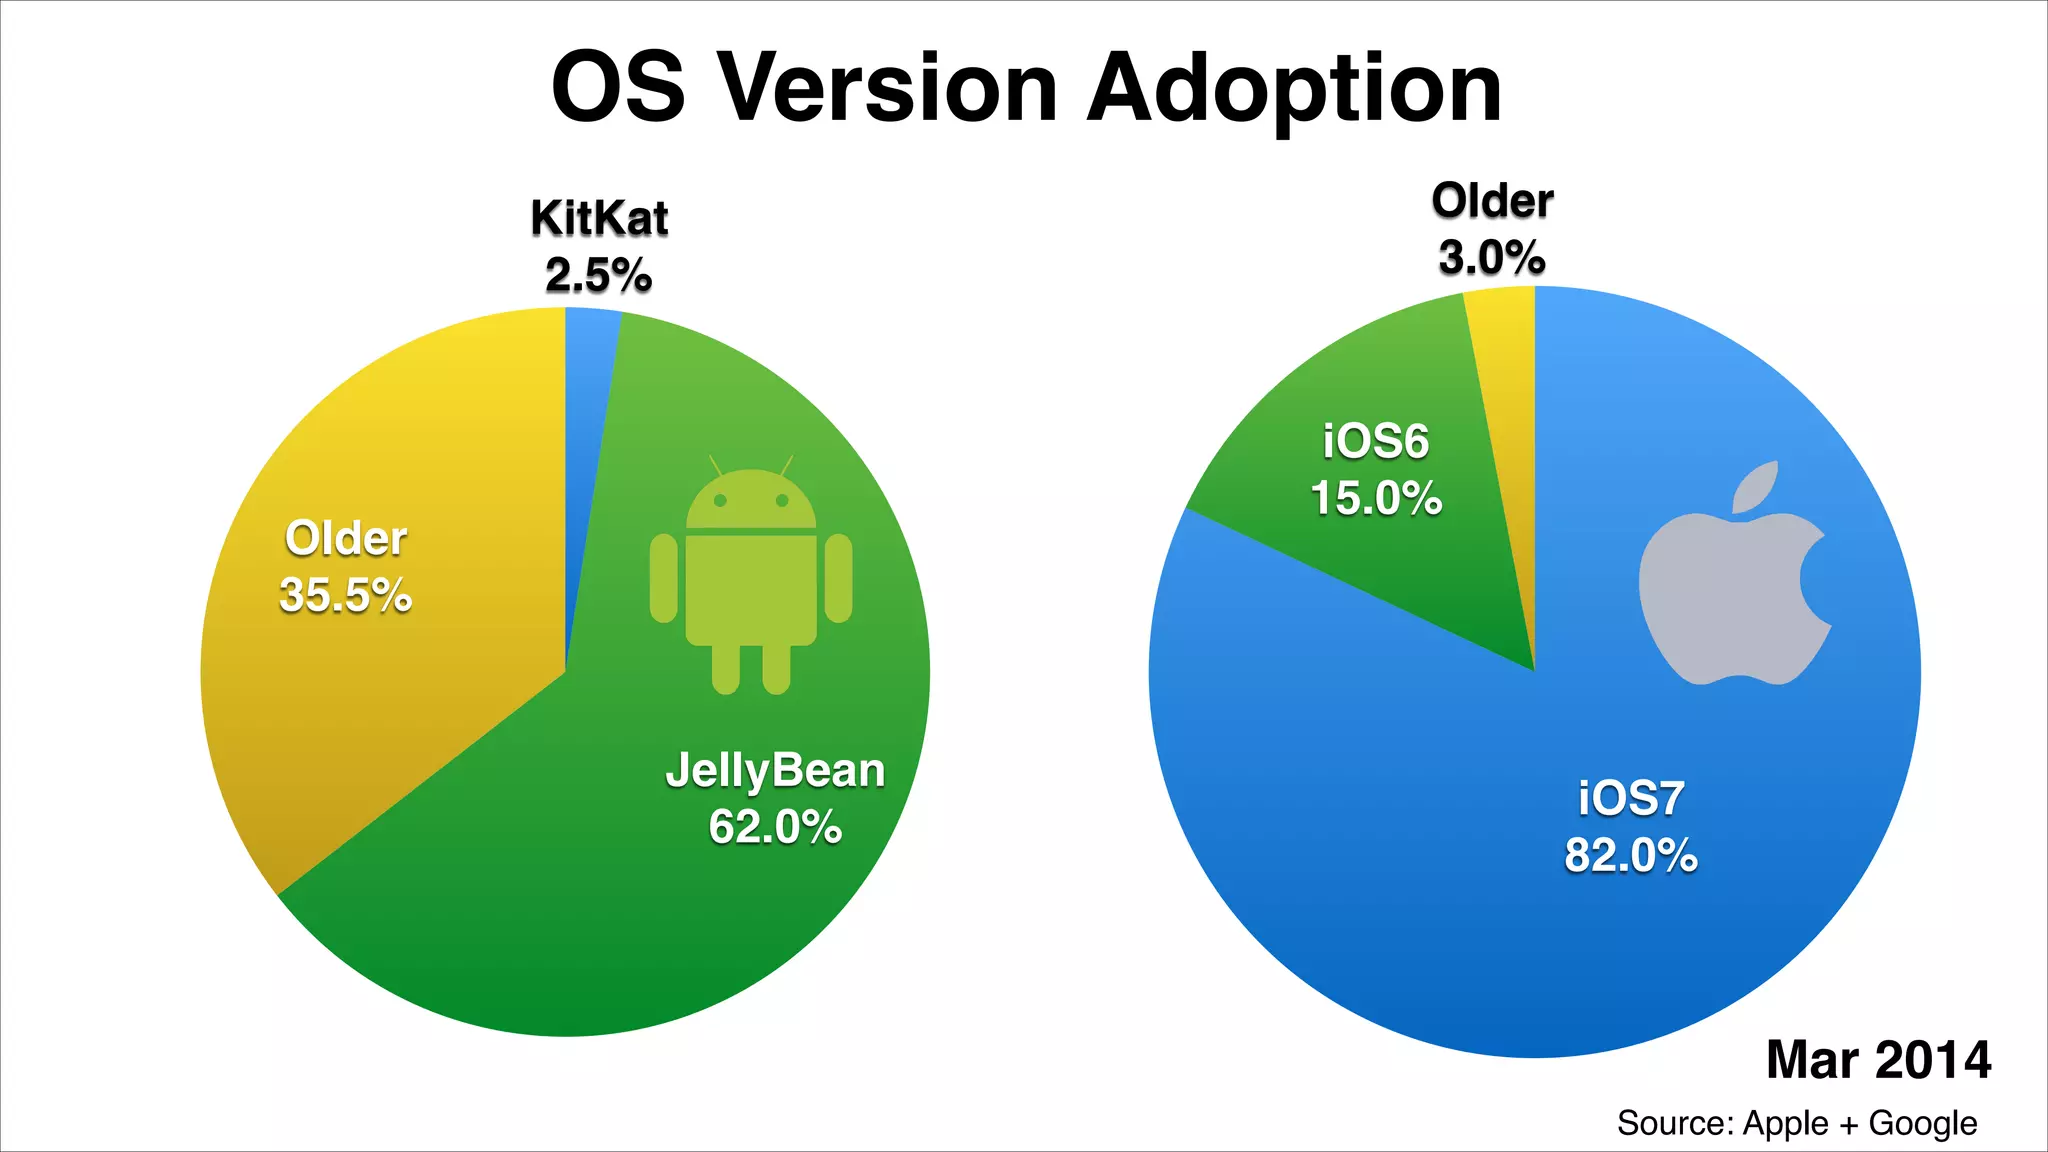
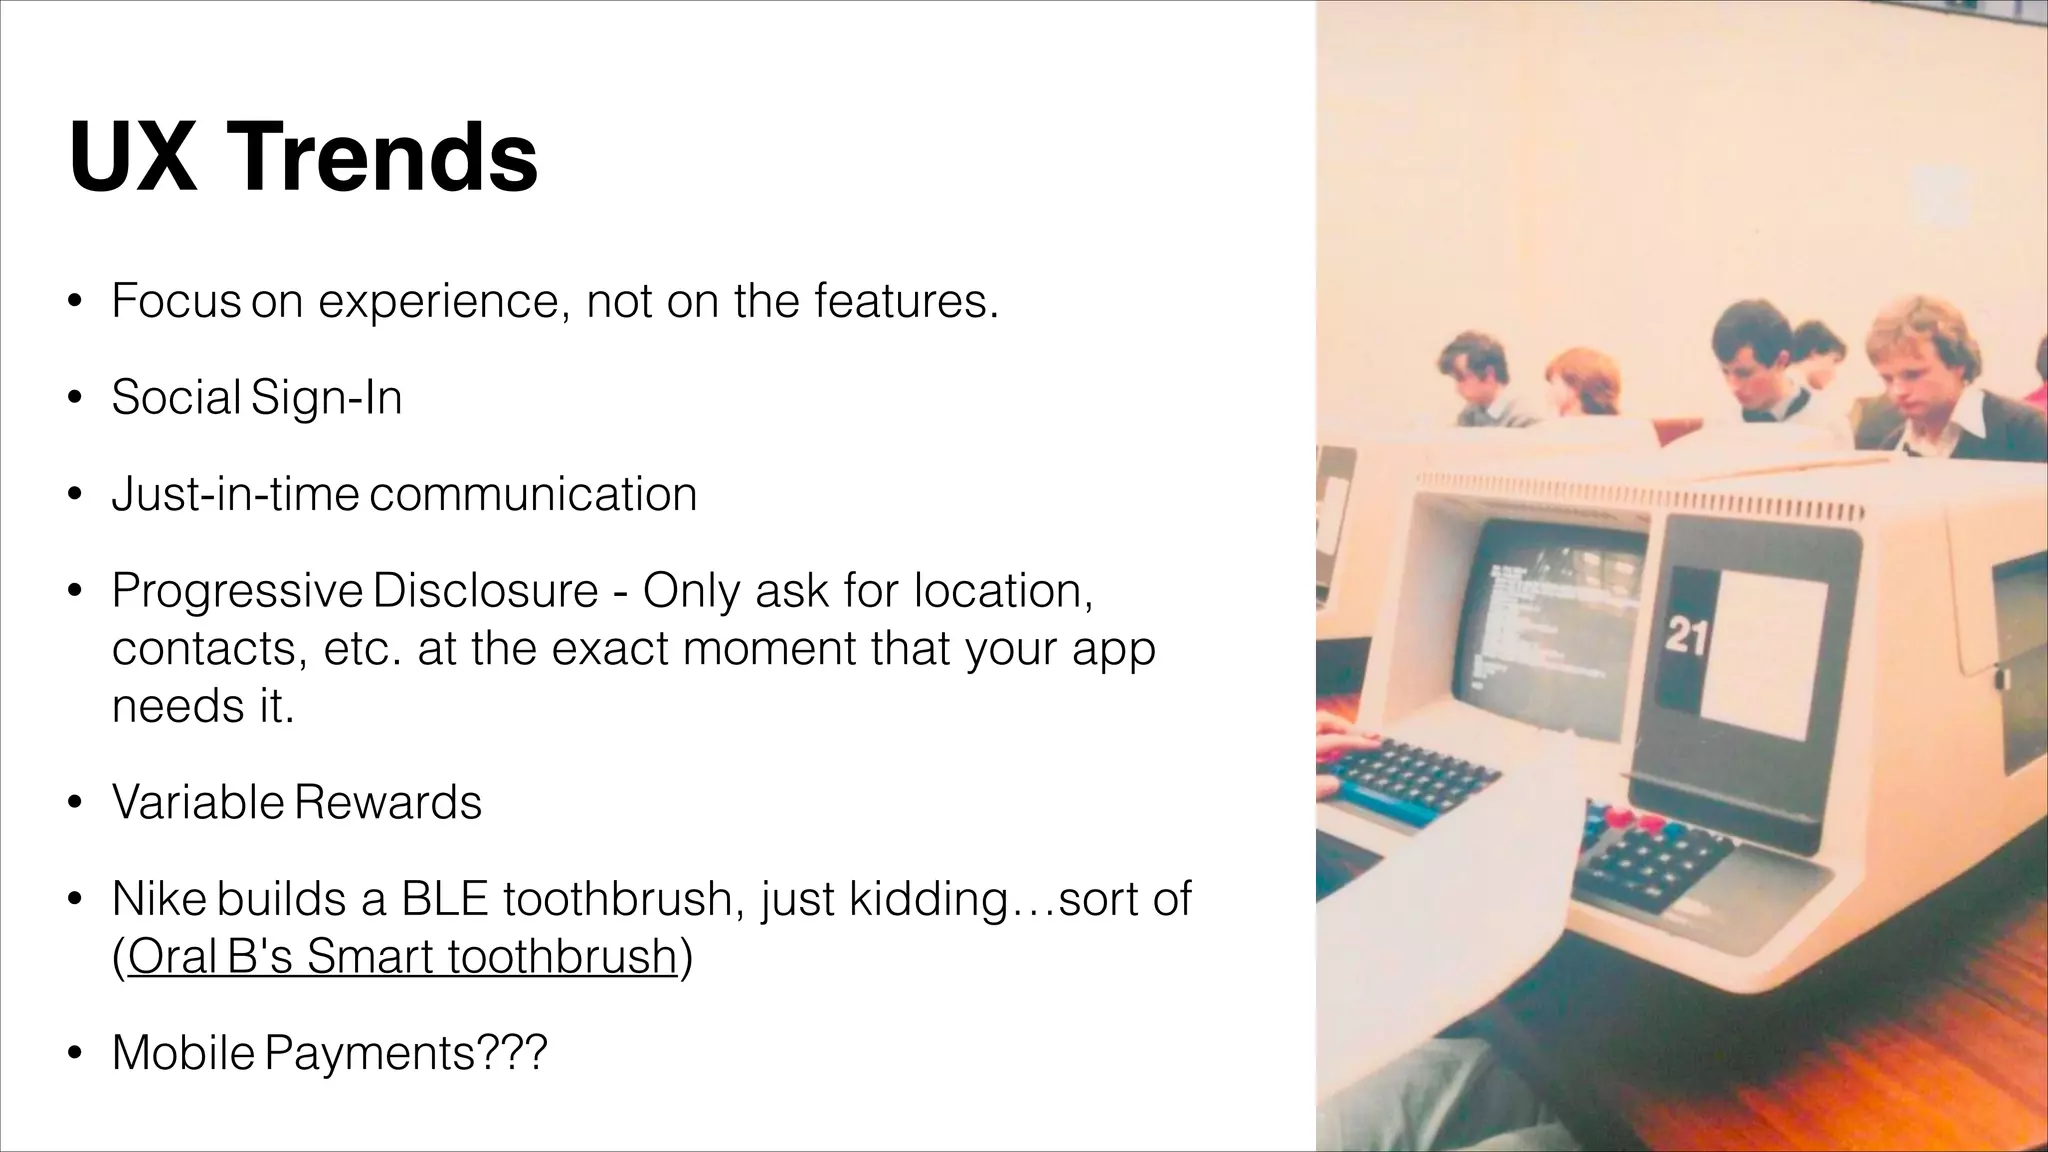
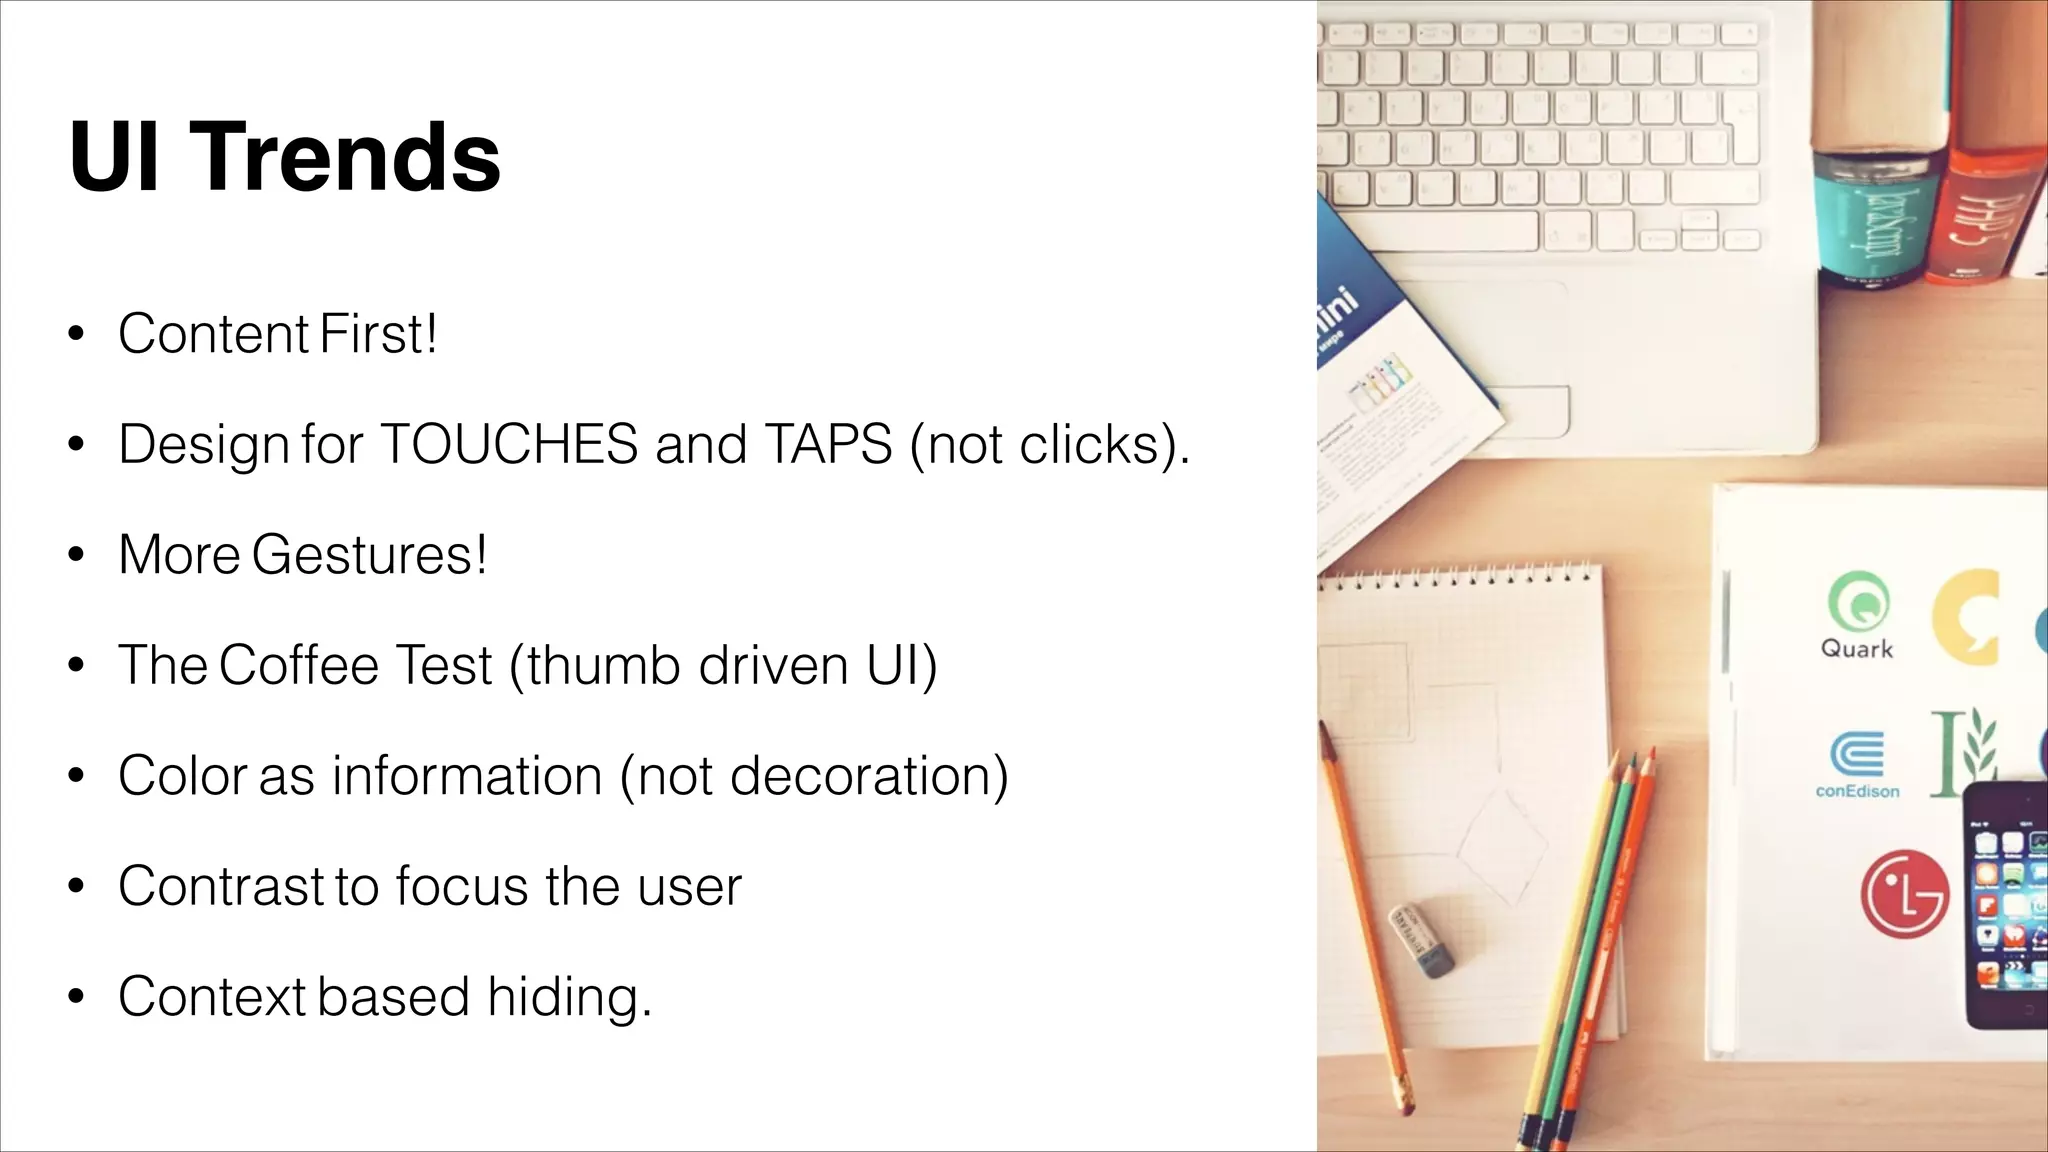
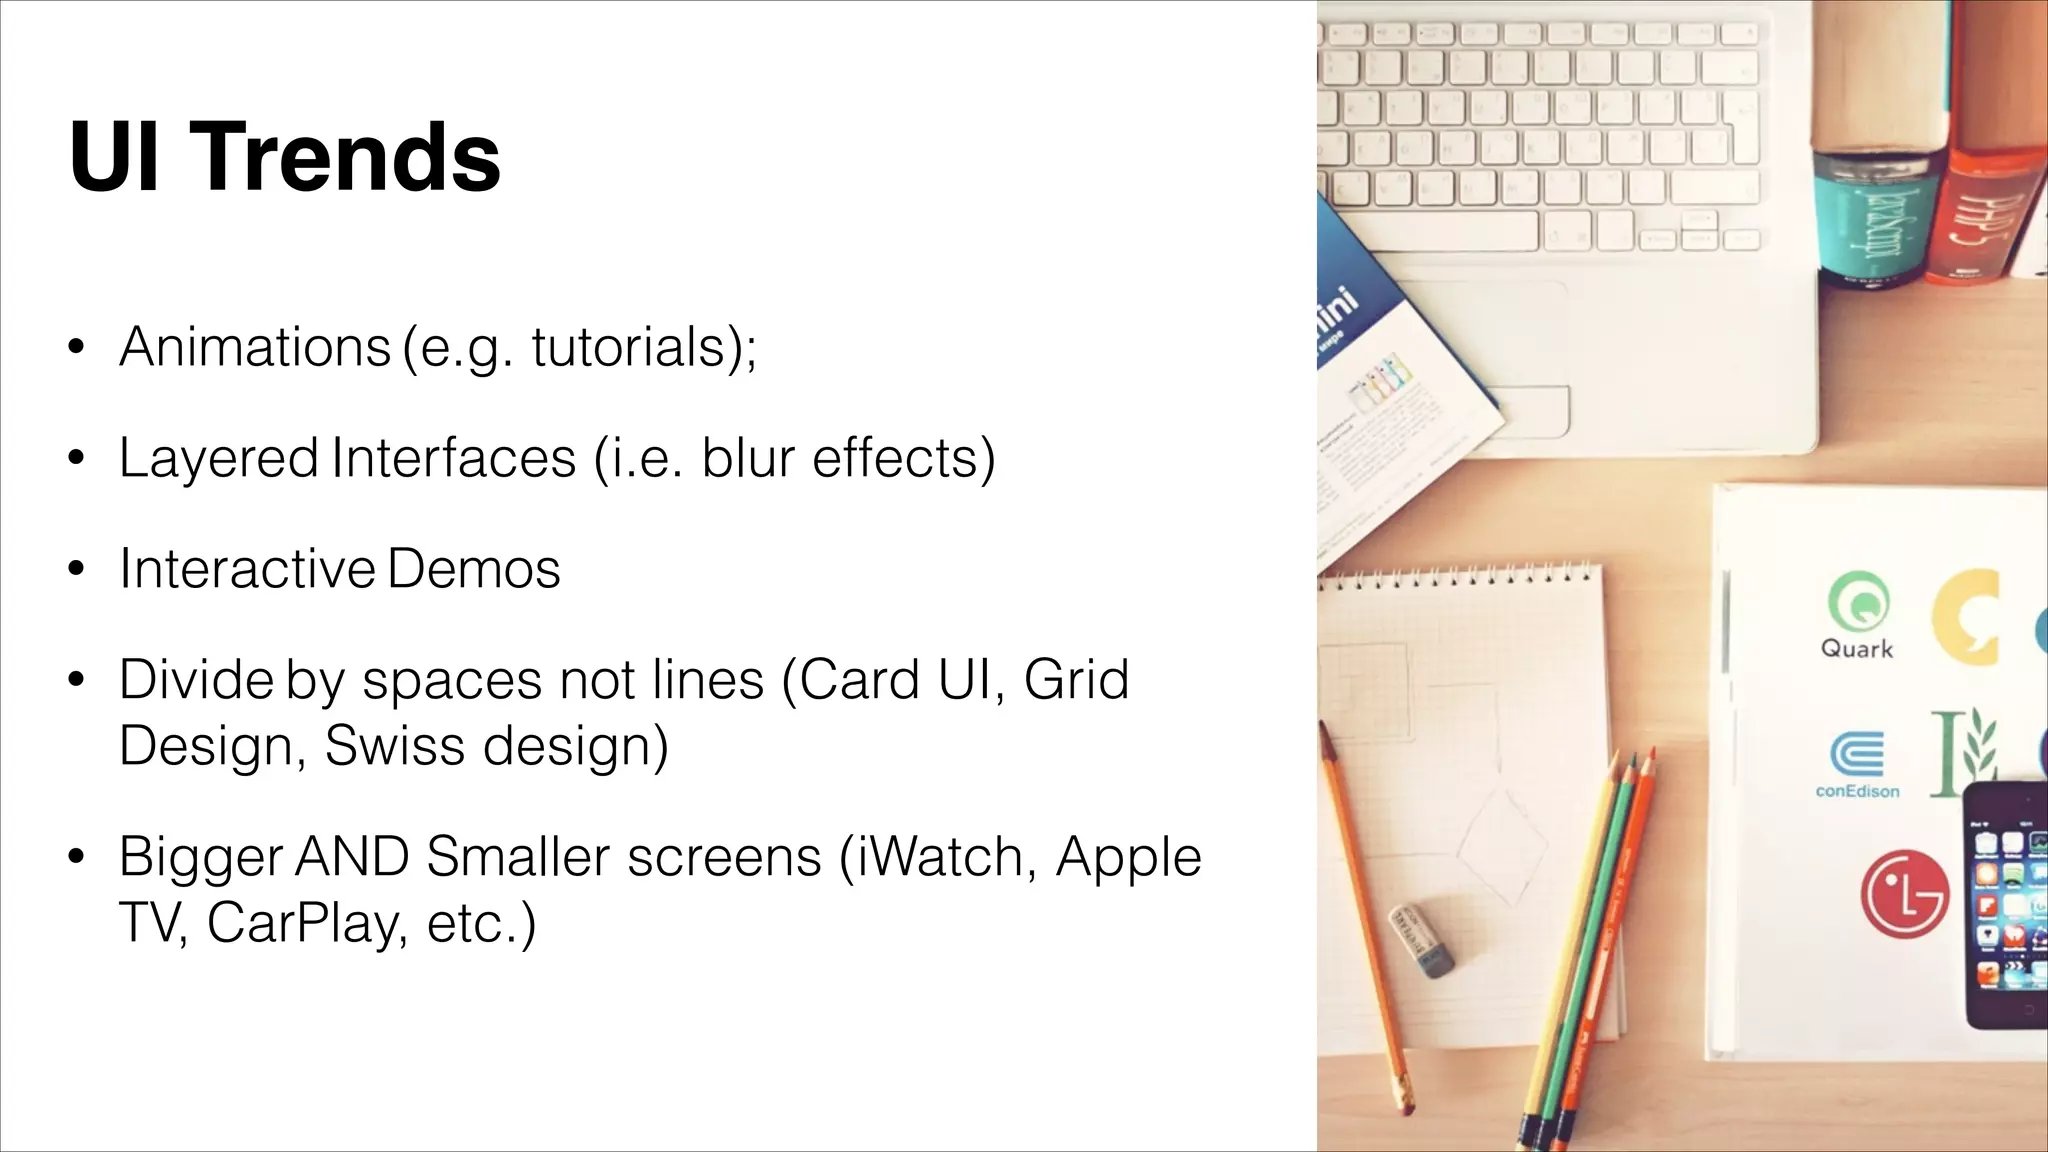
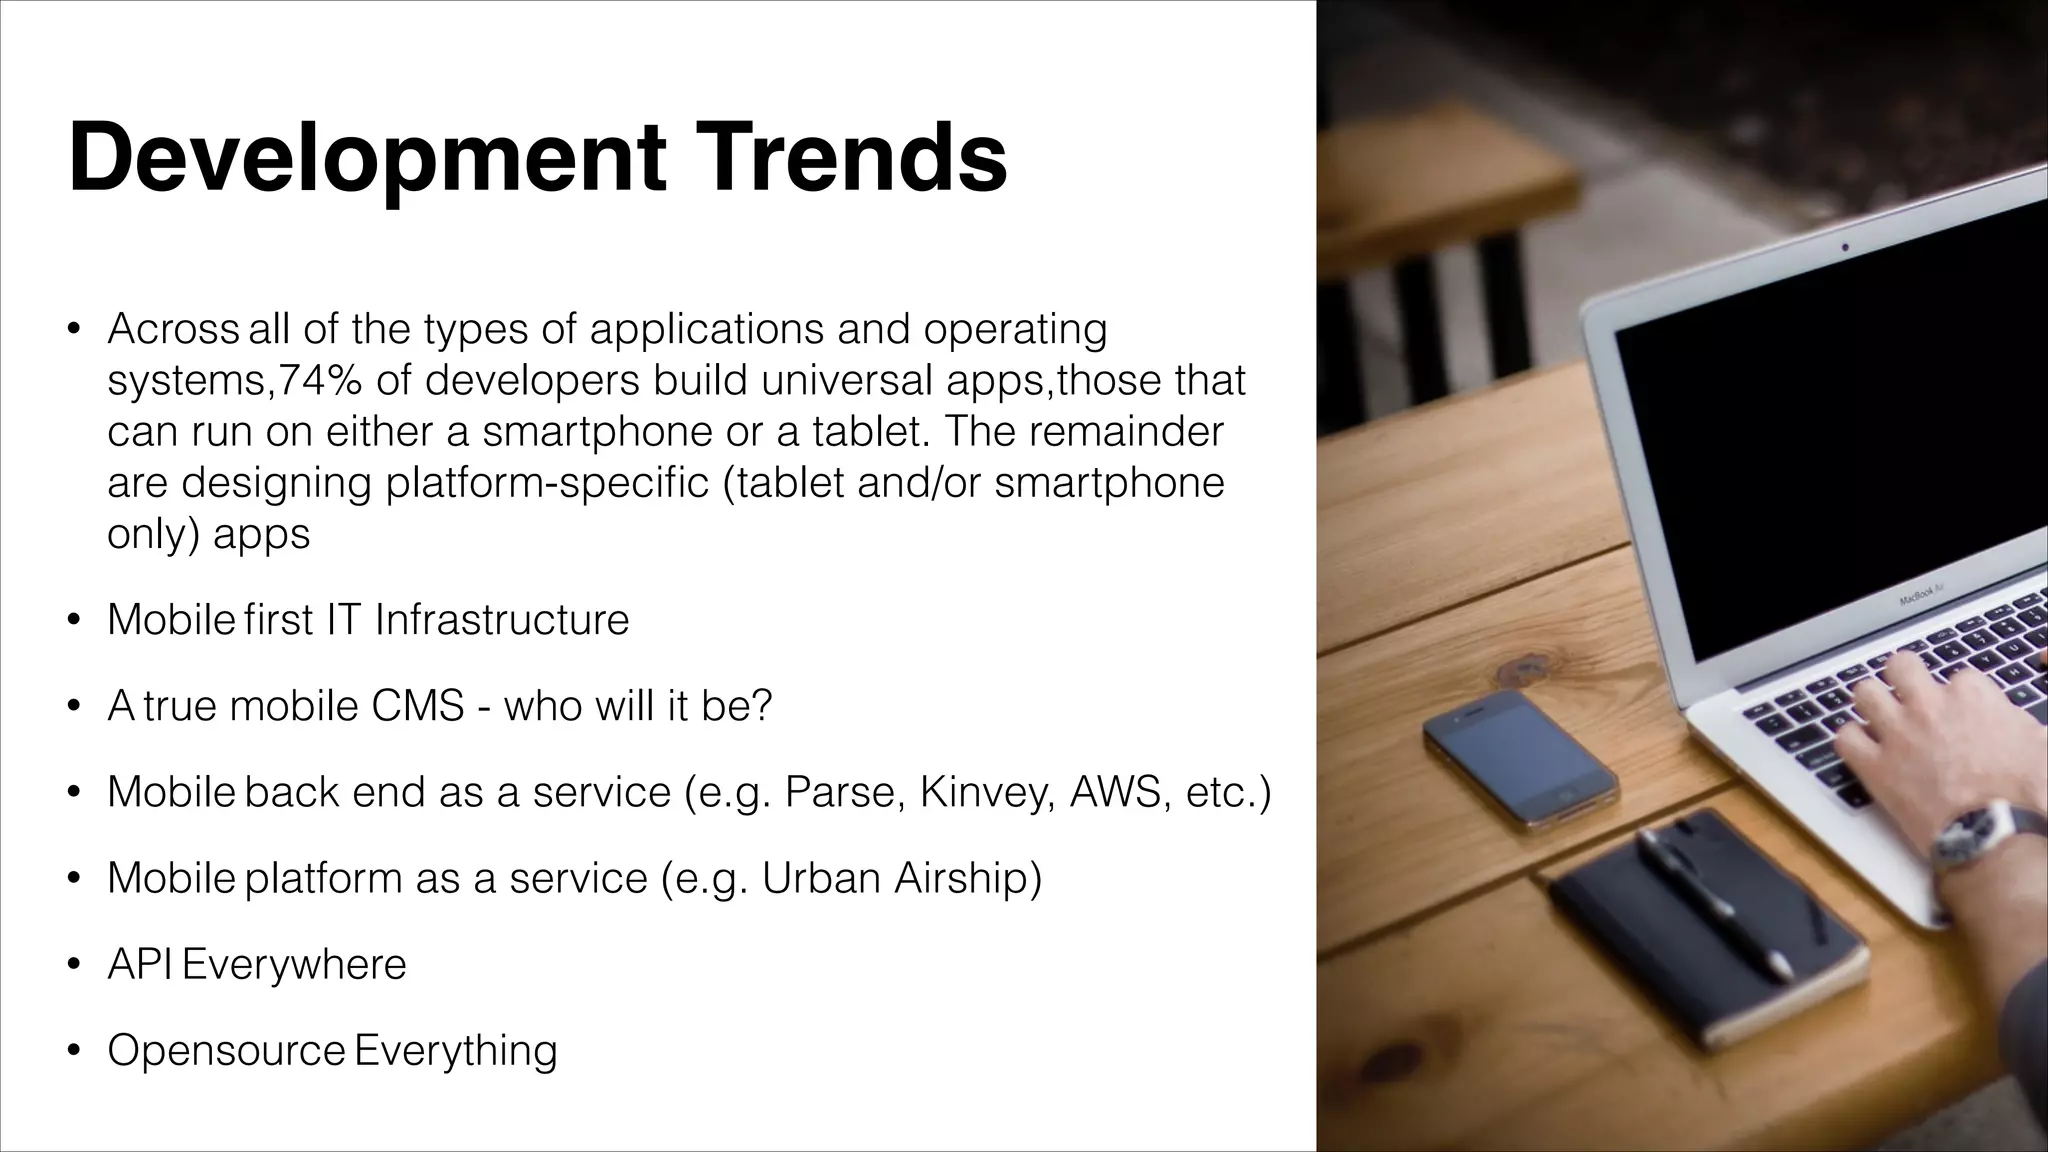
THE STATE OF
MOBILE
And we’re here
because… "
An iPhone and a
Nexus 5 walk into a
bar…
DC should be
talking about
mobile.
@StateOfMobileDC


#StateOfMobile
Smartphone
Breakdown
What are the numbers? "
Why do they matter?"
Rest
4%
Android
78%
iOS
18%
Global Smartphone Marketshare
Source: IDC
Q4 2013
MSFT
3%
BBY
3%
Android
52%
iOS
42%
Domestic Smartphone Marketshare
Global Reference
Rest
4%
Android
78%
iOS
18%
Source: Comscore
Dec 2013
Android
40%
iOS
60%
Smartphone Usage
Source: Mixpanel
Mar 2014
Domestic Smartphone Trend
▼.3%▲1.2% ▼.2%
Marketshare Point Change Q3—>Q4 2013
Source: Comscore
Dec 2013
Domestic Smartphone Demographics
58%


of Americans own a Smartphone"


34%


of cell internet users go online mostly using their phone
Source: PewResearch
Jan 2014
<$30k
NO
53%
YES
47%
$30k-$49K
NO
47%
YES
53%
$50k-$74k
NO
39% YES
61%
$75k+
NO
19%
YES
81%
18-29
NO
17%
YES
83%
65+
NO
81%
YES
19%
30-49
NO
26%
YES
74%
50-64
NO
51%
YES
49%
INCOME
AGE
Domestic Smartphone Demographics
Source: PewResearch
Jan 2014
Domestic Demographic Trend
65+
NO
82%
YES
18%
50-64
NO
55%
YES
45%
Age Reference
81% of adults age 65+ track their weight, diet, 

exercise routine, or other health indicator.


(about 60% for all other age groups)
Source: PewResearch
Dec 2013
…maybe that’s how you 

end up with a built-in HRM?"
Tablet 

Breakdown
What are the numbers? "
Why do they matter?"
MSFT
2%
Other Android*
29%
Fire OS
5%
Android*
28%
iOS
36%
Global Tablet Marketshare
Samsung

ASUS

Lenovo
Source: Gartner
Q1-Q4 2013
Android
3%
iOS
97%
Tablet Usage
Source: Mixpanel
Mar 2014
Domestic Tablet Demographics
42%


of Americans own a Tablet
Source: PewResearch
Jan 2014
Tablet Trend
iPad sales growing 3x "
faster than iPhone sales
Source: KPCB
Jan 2013
Tablets expected to be 75% 

of mobile computing market 

in next 3 years (25% laptops)
Source: NPD DisplaySearch
Feb 2014


App Stores
Top 200 Apps Daily Revenue (millions)
Source: Distimo
Nov 2013
$0.0
$4.5
$9.0
$13.5
$18.0
Nov 2012 Nov 2013
$4
$12
$15
$18
Apple Google
Android
40%
iOS
60%
Apps Available
Source: Apple + Google + Amazon + Microsoft
Mar 2014
0
125,000
250,000
375,000
500,000
625,000
750,000
875,000
1,000,000
Apple Google Microsoft Amazon
175,000
200,000
1,000,0001,000,000
0
50000
100000
150000
200000
Games Education Lifestyle
App Store Categories
Source: 148apps + AppBrain
0
40000
80000
120000
160000
200000
Games Entertainment Personalization
Mar 2014
App Volume Trend
Mar 2014
0
300,000
600,000
900,000
1,200,000
2008-12 2009-06 2009-12 2010-06 2010-12 2011-06 2011-12 2012-06 2012-12 2013-06 2013-12
Apps Games Total
Source: 148apps
Latest 

OS Releases
Features"
Features"
Features..."
• API Level 19
• UI Refresh
• “OK Google”
• Multitasking
Improvements
• Hangouts Replaces SMS
• Webviews now based on
Chromium engine

Android 4.4 (KitKat)"
Oct 2013
iOS 7.0"
Sep 2013
Fire OS 3.1 (Mojito)"
Nov 2013
Windows Phone 8.0"
Oct 2012 ->Oct 2013
• Flat UI Refresh
• iTunes Radio
• iBeacons
• Control Center
• Notification Center
• AirDrop
• iCloud Keychain
• API Level 17 (JB)
• SecondScreen
• 1-Tap Archive
• Enterprise + BYOD
Support
• Voice Dictation
• Start Screen support
large displays
• 1080p Support
• Screen Rotation Lock
• Improved IE HTML5
Cmpatibility
• Card Dav + Cal Dav
Older"
35.5%
JellyBean"
62.0%
KitKat"
2.5%
Older"
3.0%
iOS6"
15.0%
iOS7"
82.0%
OS Version Adoption
Source: Apple + Google
Mar 2014
UX Trends
• Focus on experience, not on the features.
• Social Sign-In
• Just-in-time communication
• Progressive Disclosure - Only ask for location,
contacts, etc. at the exact moment that your app
needs it.
• Variable Rewards
• Nike builds a BLE toothbrush, just kidding…sort of
(Oral B's Smart toothbrush)
• Mobile Payments???
• Content First!
• Design for TOUCHES and TAPS (not clicks).
• More Gestures!
• The Coffee Test (thumb driven UI)
• Color as information (not decoration)
• Contrast to focus the user
• Context based hiding.
UI Trends
• Animations (e.g. tutorials);
• Layered Interfaces (i.e. blur effects)
• Interactive Demos
• Divide by spaces not lines (Card UI, Grid
Design, Swiss design)
• Bigger AND Smaller screens (iWatch, Apple
TV, CarPlay, etc.)
UI Trends
• Across all of the types of applications and operating
systems,74% of developers build universal apps,those that
can run on either a smartphone or a tablet. The remainder
are designing platform-specific (tablet and/or smartphone
only) apps
• Mobile first IT Infrastructure
• A true mobile CMS - who will it be?
• Mobile back end as a service (e.g. Parse, Kinvey, AWS, etc.)
• Mobile platform as a service (e.g. Urban Airship)
• API Everywhere
• Opensource Everything
Development Trends
• Mobile in manufacturing
✴ A survey conducted by Motorola concluded that
“manufacturers with mobile applications saved a daily
average of 42 minutes per employee.”
• Construction Industry
• Energy Industry
• Over 90% of companies are using tablet devices in their
sales organization (CSO)
• Healthcare
✴ Boston Children’s hospital doctors use tablets to for
patient exam report
• Military - Air Force replacing Blackberries with iPhones;
15k iPads.
• Delta Terminal at La Guardia
Business Trends
of smartphone users
use their phone to
help them!
while shopping
75%
Share of Black Friday
eCommerce Traffic
Non-mobile
60%
Tablets
15%
Smartphones
25%
Source: IBM
Nov 2013"
• Genentech - Employee tools
• PC replacement
• While Android is gaining enterprise market share on
the device side, iOS dominates as platform of choice
for enterprise app deployment, with 98 percent and
95 percent of total app activations in Q2 and Q3
respectively. (GOOD Technology)
• End-to-end mobile integration (POS, Kiosk, CRM,
backoffice, etc.)
• Companies are adopting mobile-first approach. Both
Walmart and Linked in are reporting that ~50% of their
traffic is now coming from mobile.
• iBeacons: MLB, Macy’s, Urban Airship, Automatic
(Car), American Eagle, World Cup, Apple Store,
Business Trends
@StateOfMobileDC


#StateOfMobile

The State of Mobile: Q1 2014