Download to read offline

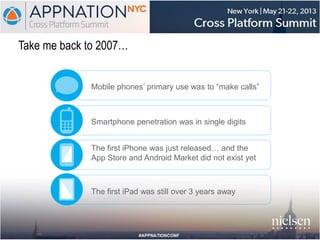

The document describes the mobile technology landscape in 2007, before the introduction of the iPhone and app stores: - Smartphone penetration was only in the single digits and mobile phones were primarily used to make calls. - Tablet adoption did not exist yet and the first iPad was still over 3 years away. - Social media engagement from mobile devices was non-existent at the time.


