Download as PDF, PPTX
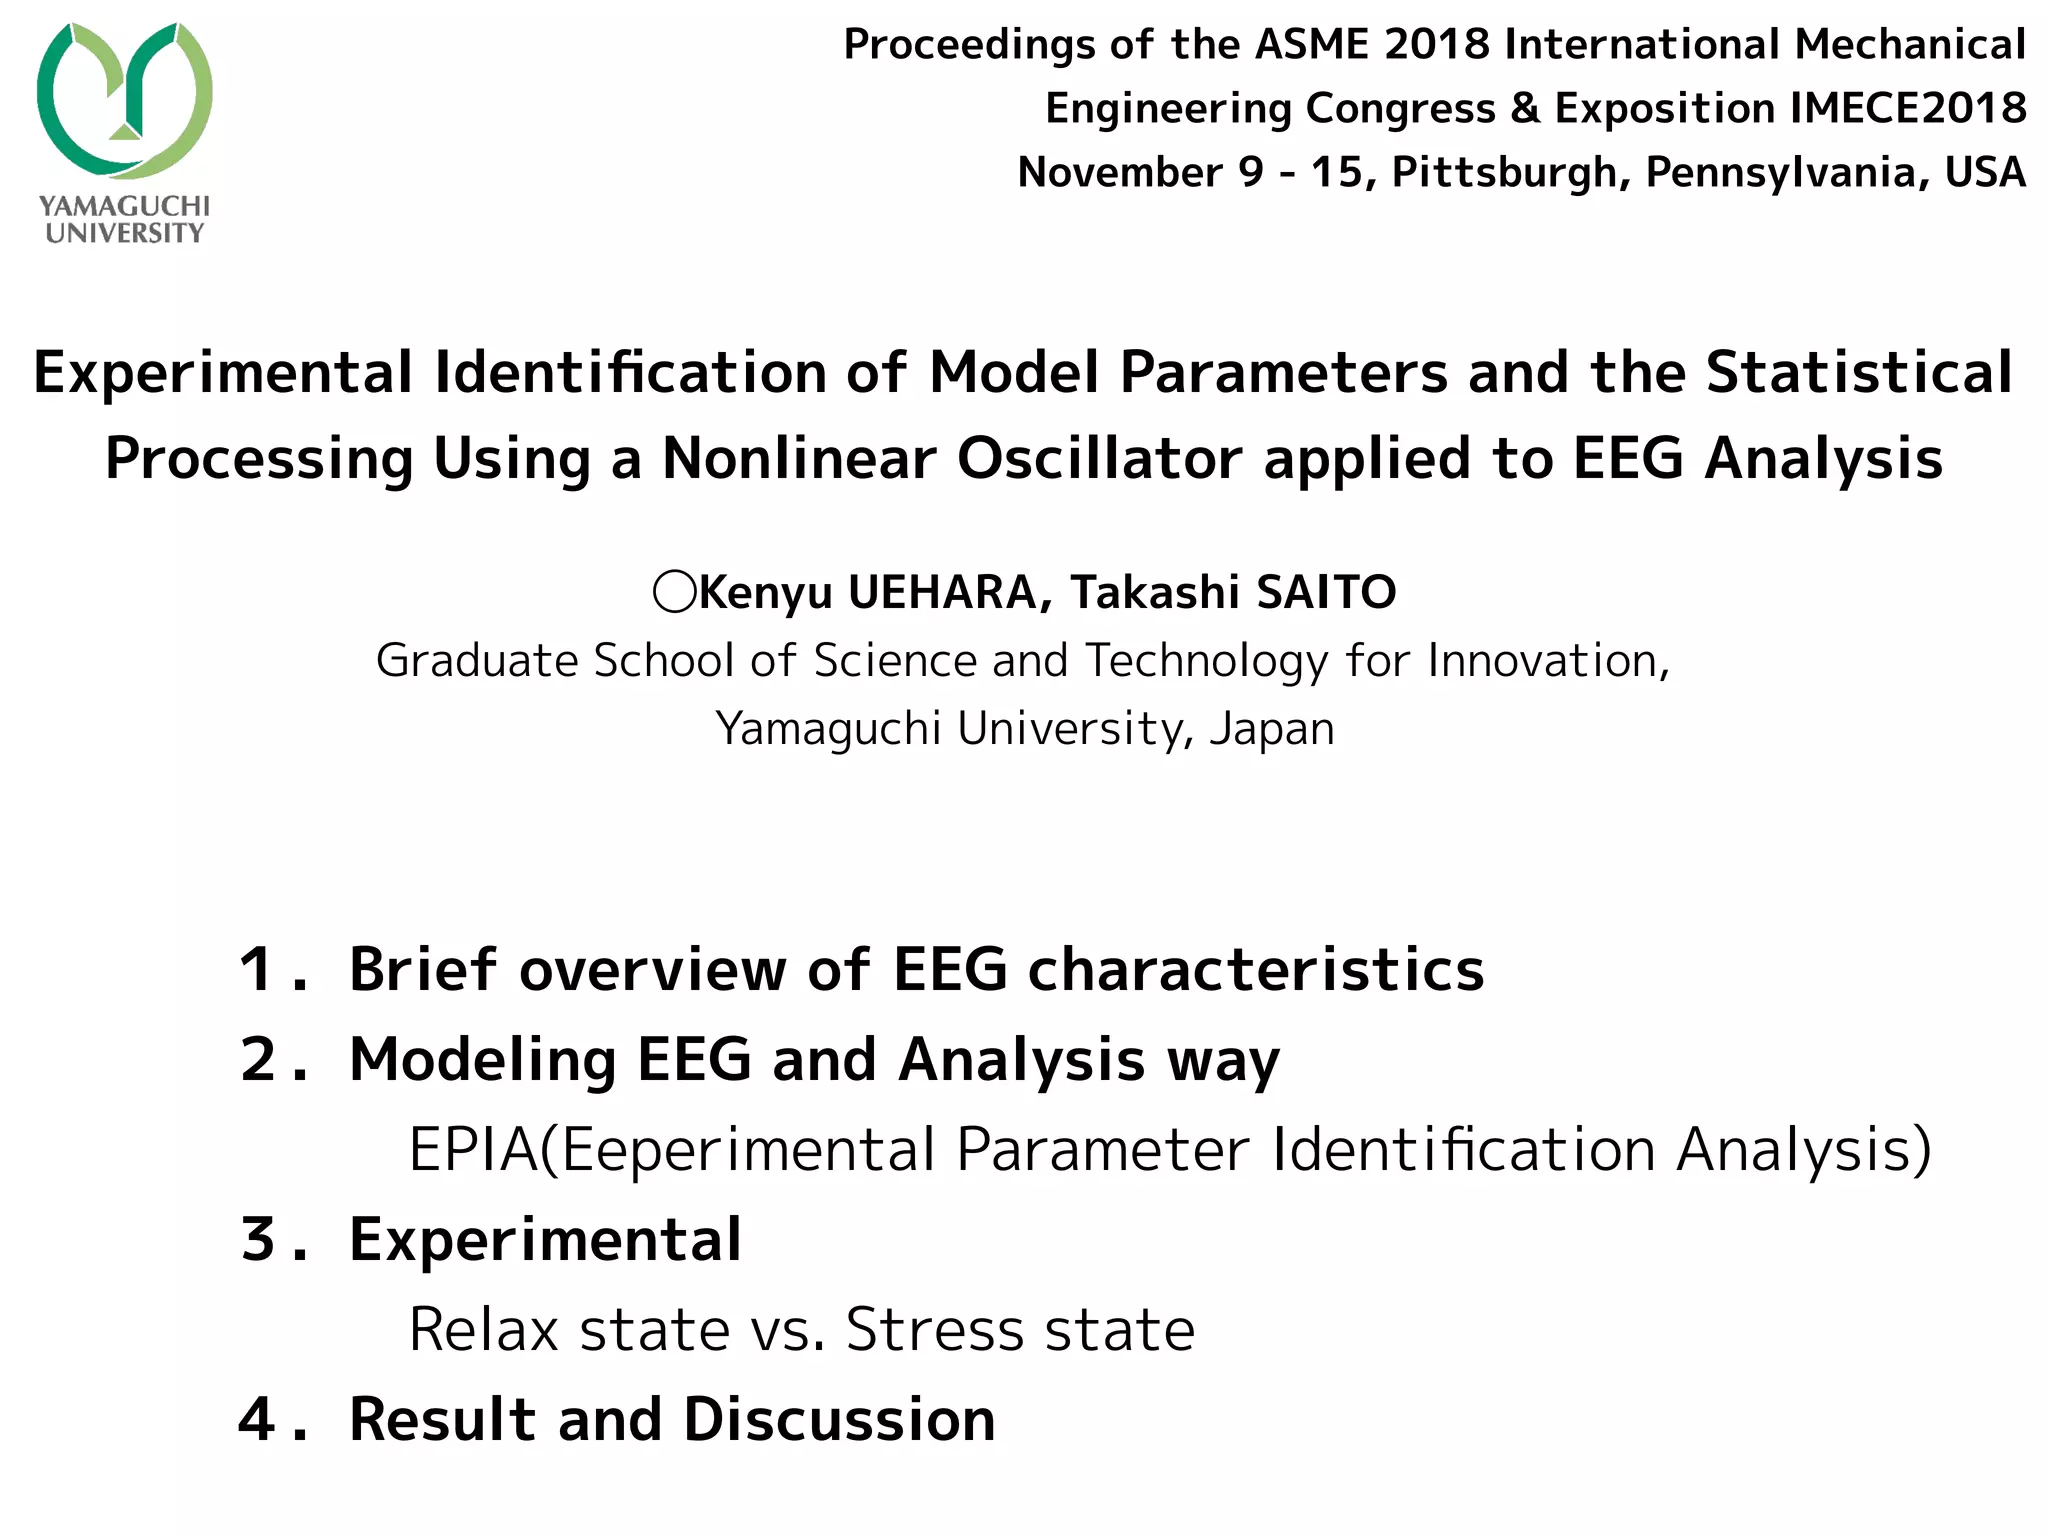


The document discusses the experimental identification of model parameters in EEG analysis using a nonlinear oscillator approach to understand brain activity under different mental states, particularly relaxation and stress. It highlights the chaotic nature of EEG signals and the significant variations in model parameters like 'a', 'b', and 'c' in response to stress. The study finds critical insights regarding the relationships between these parameters and their potential use in visualizing EEG states.
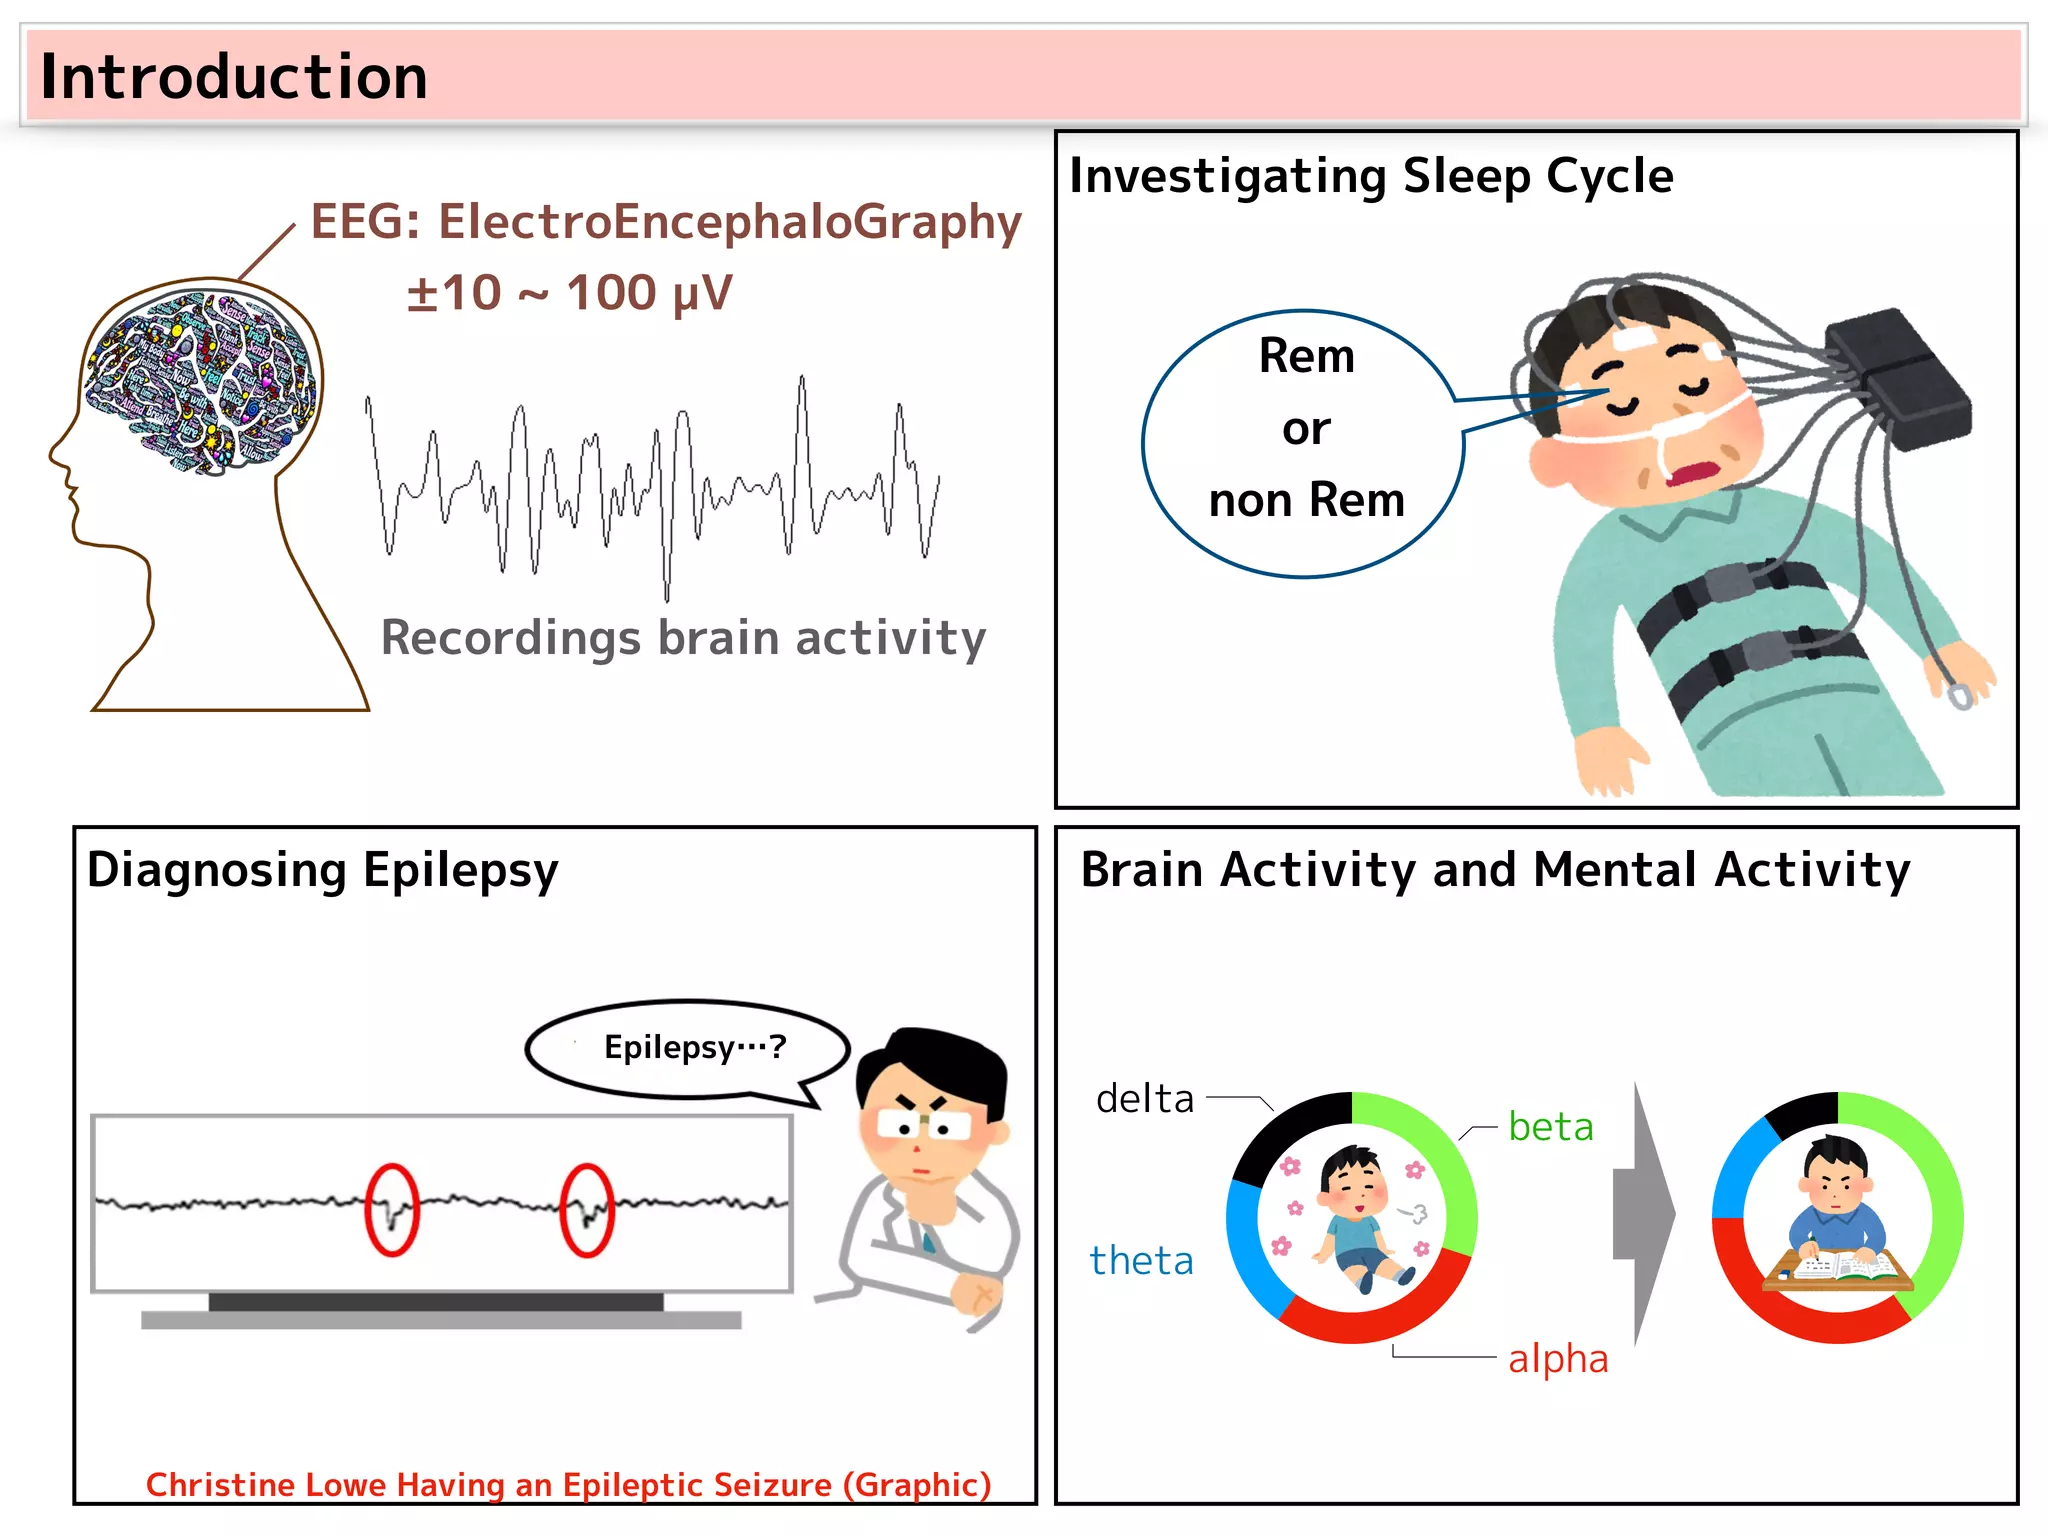
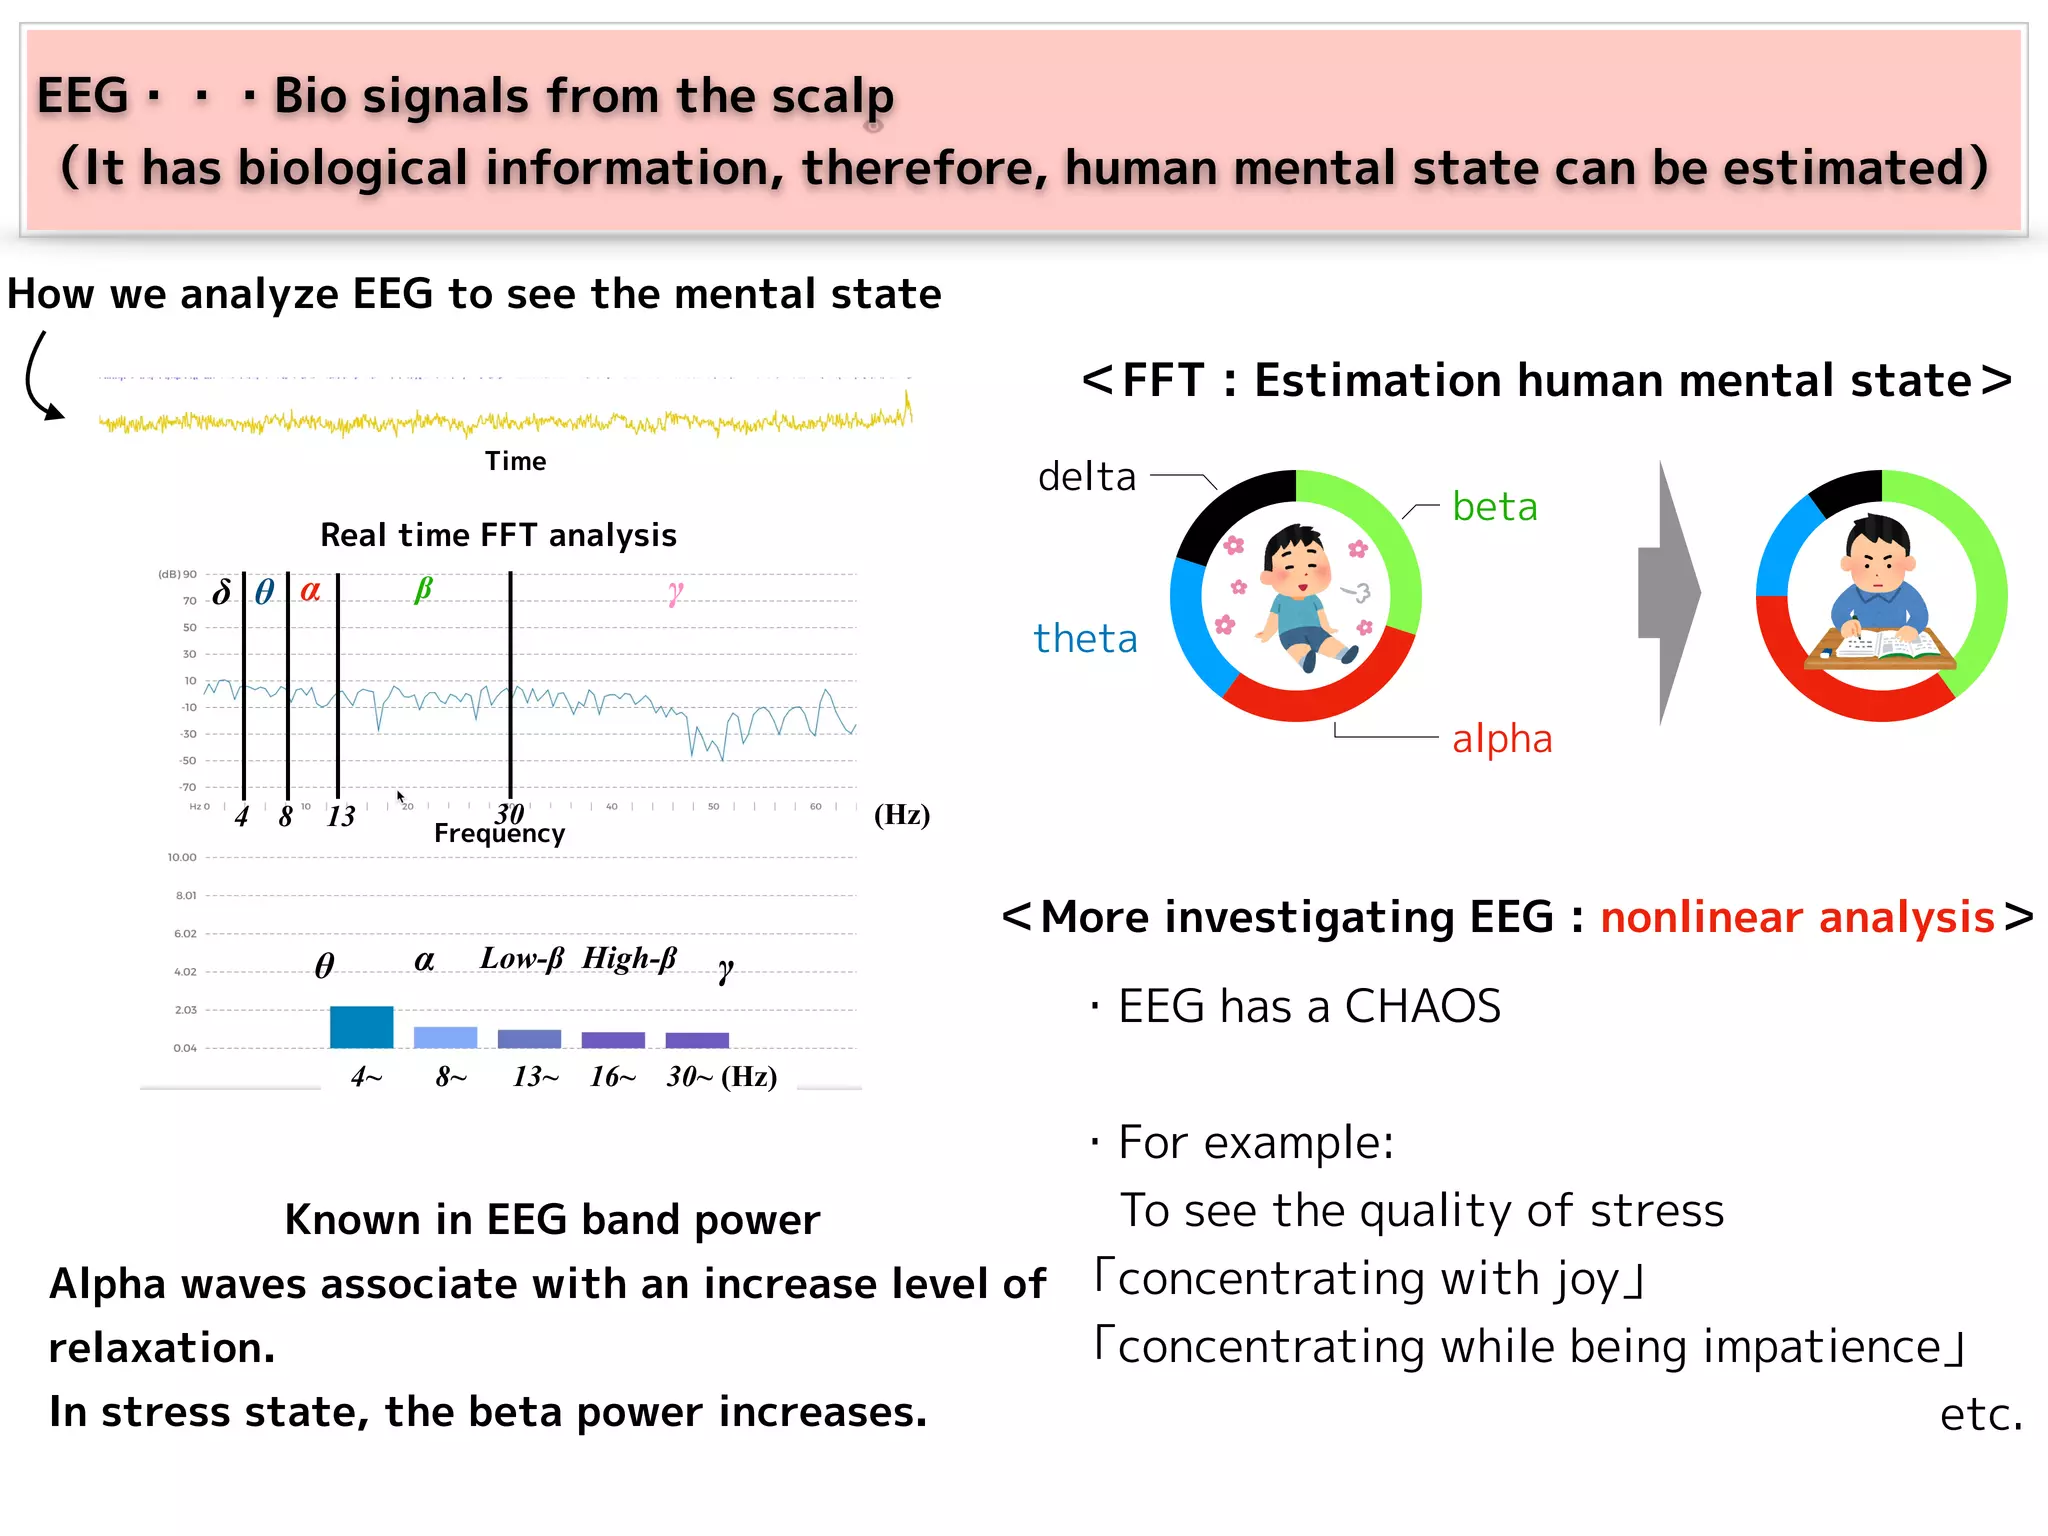
Introduction to EEG analysis, its applications in sleep and epilepsy, and key characteristics such as frequency ranges and wave types.
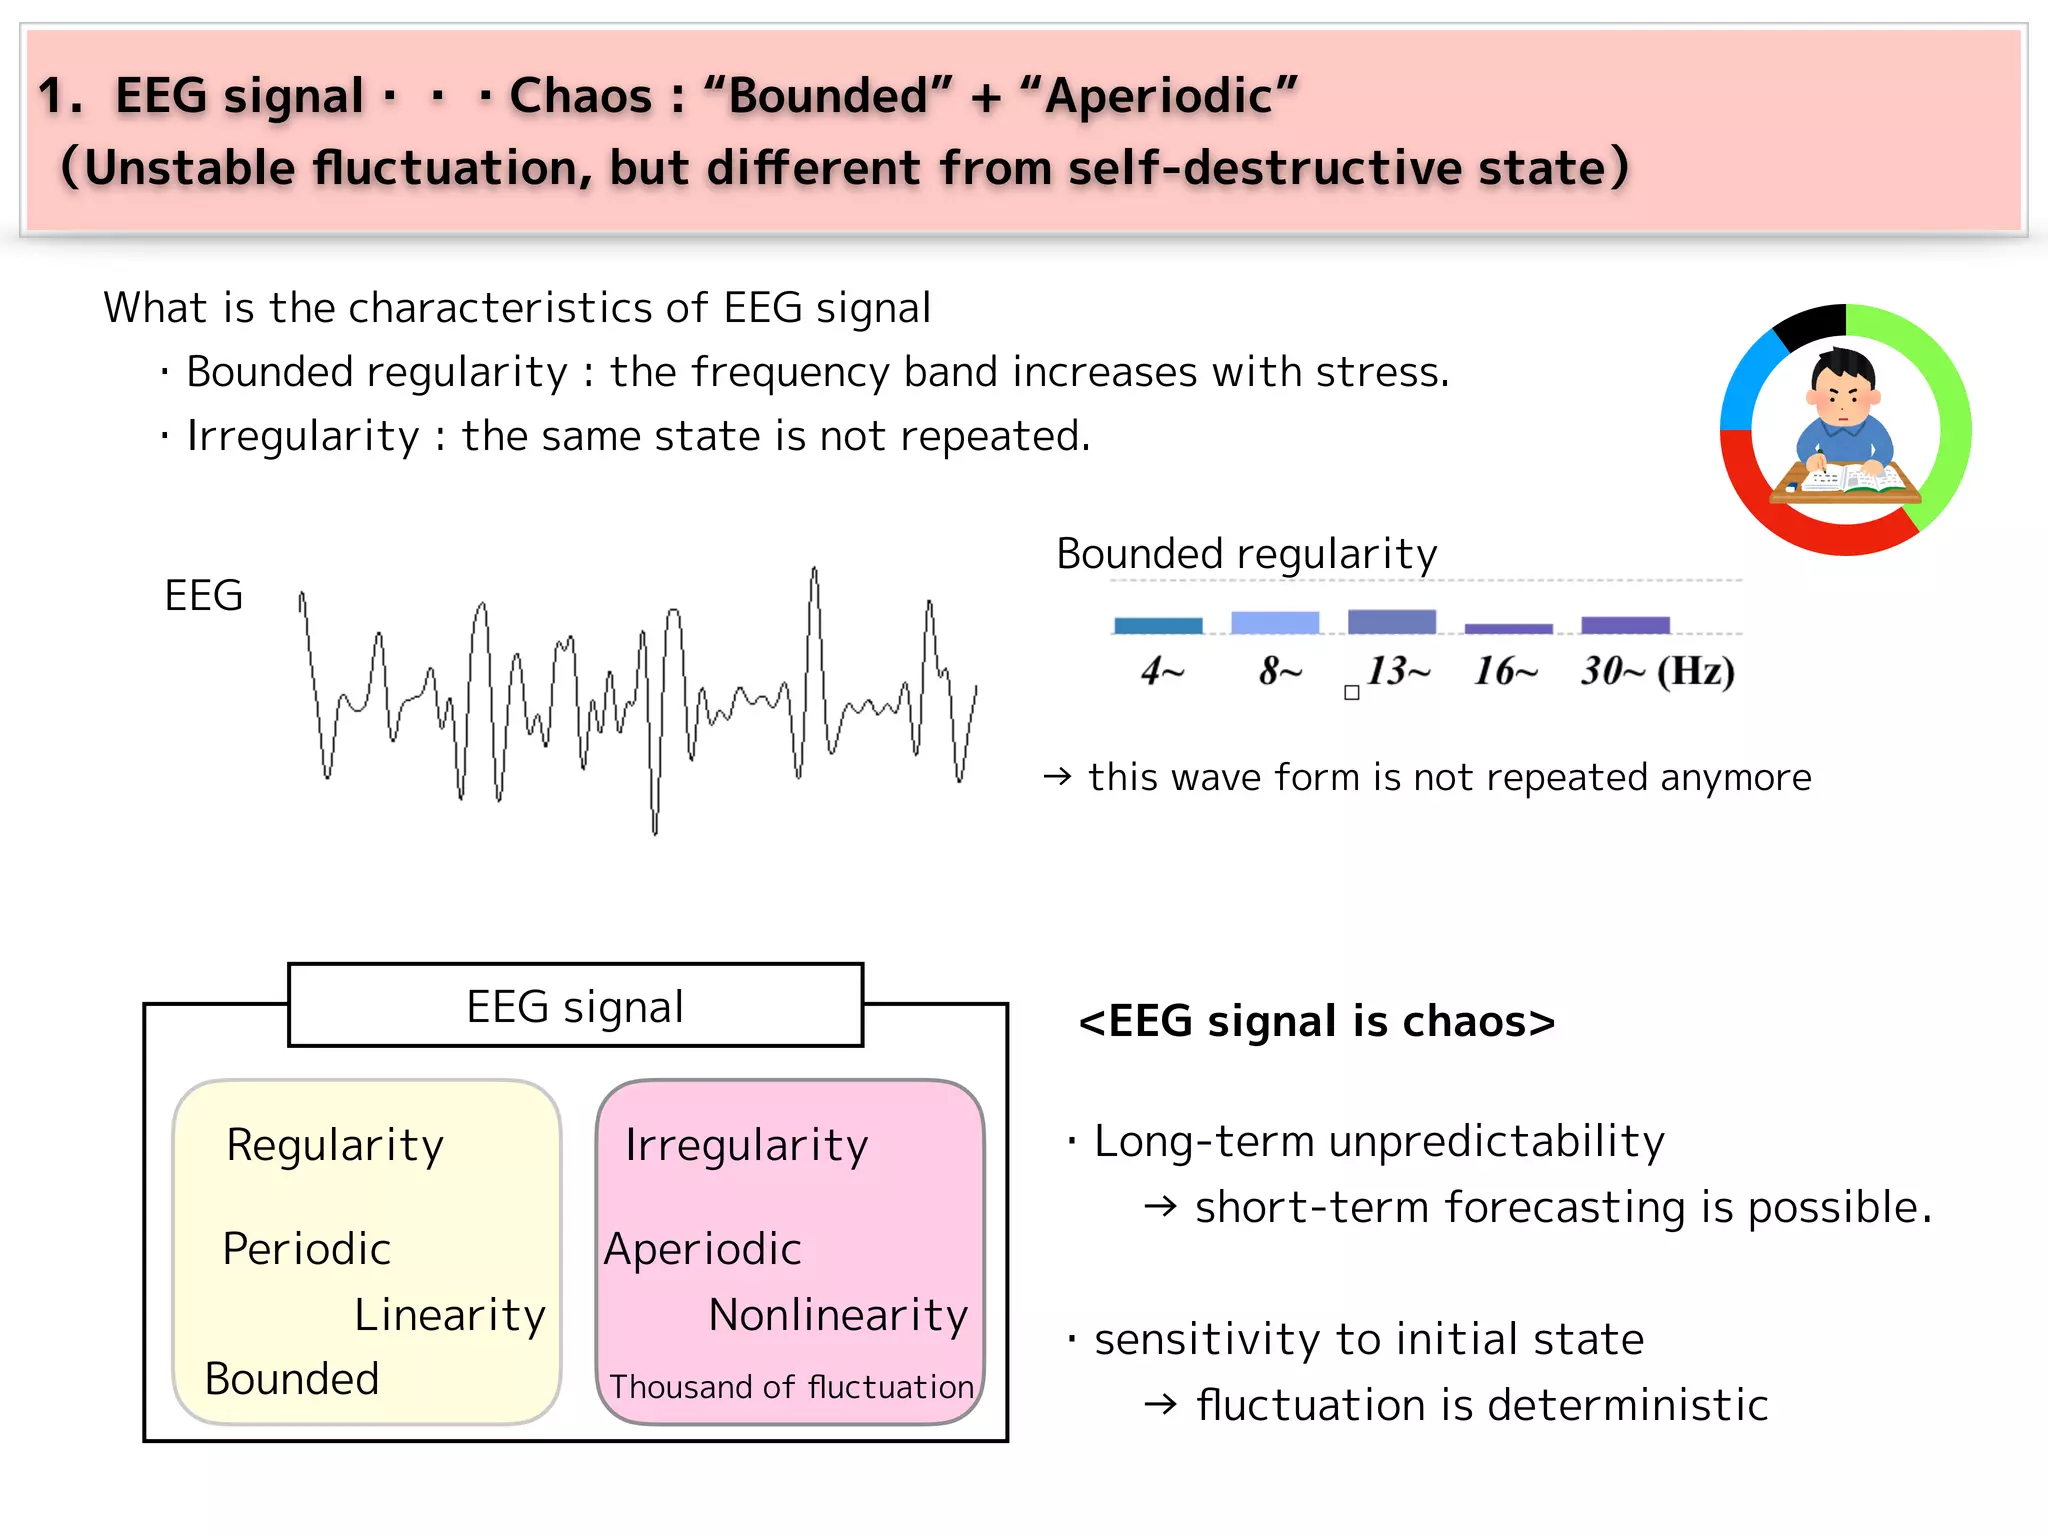
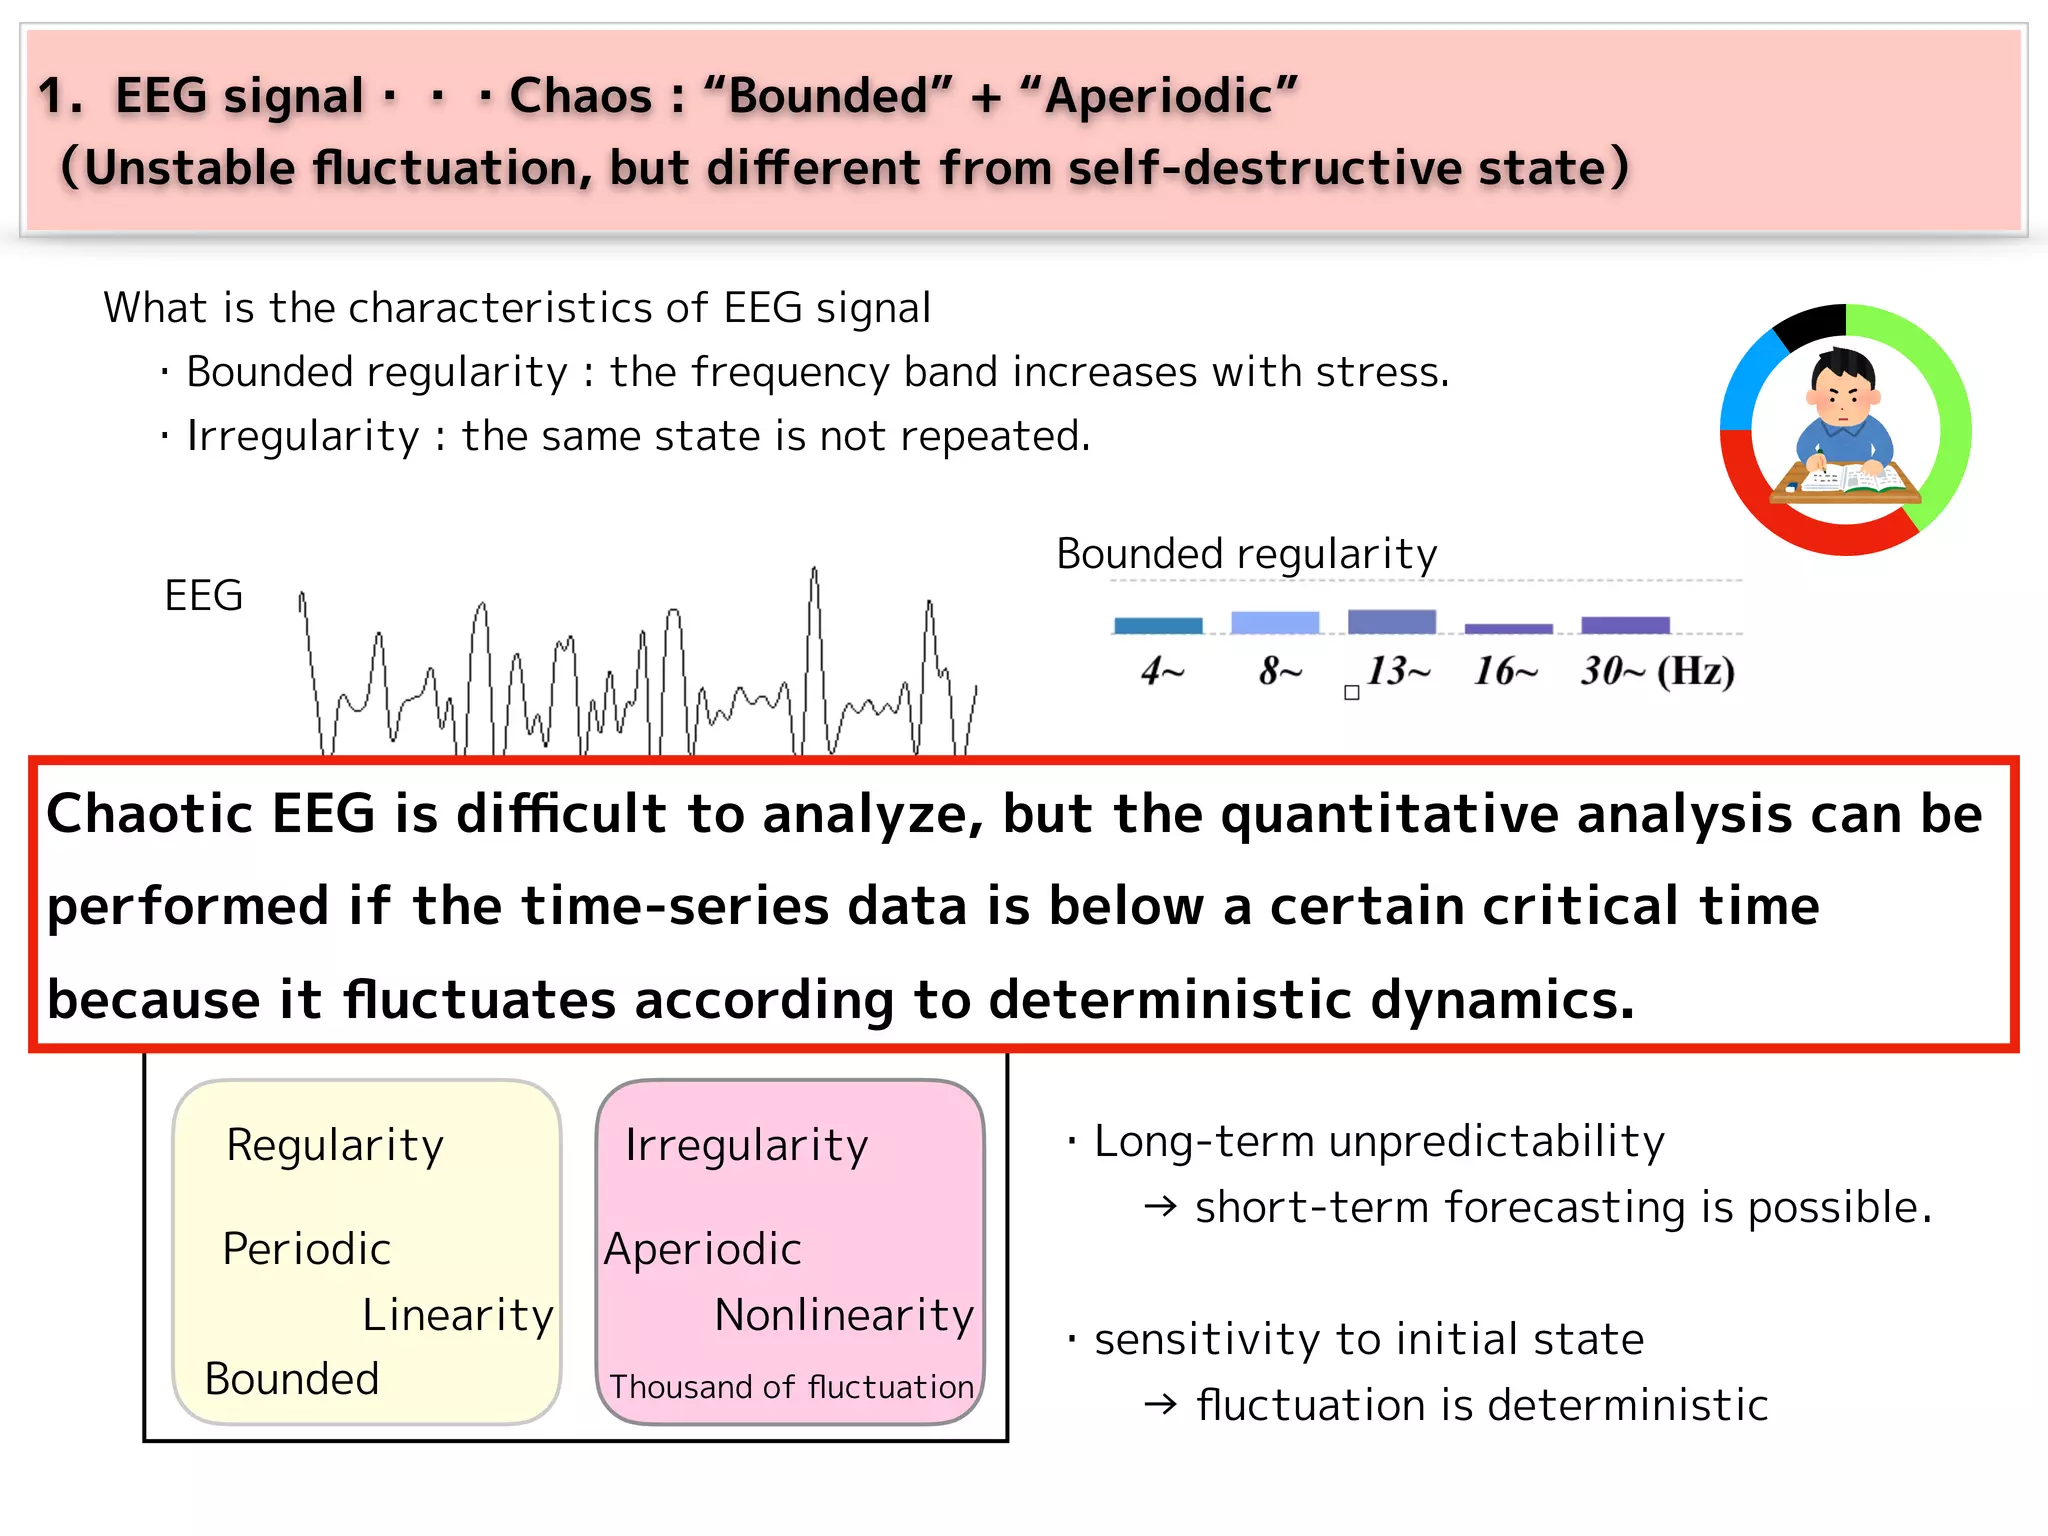
Exploration of EEG analysis methods like FFT and nonlinear analysis, emphasizing chaos and predictability in EEG signals.
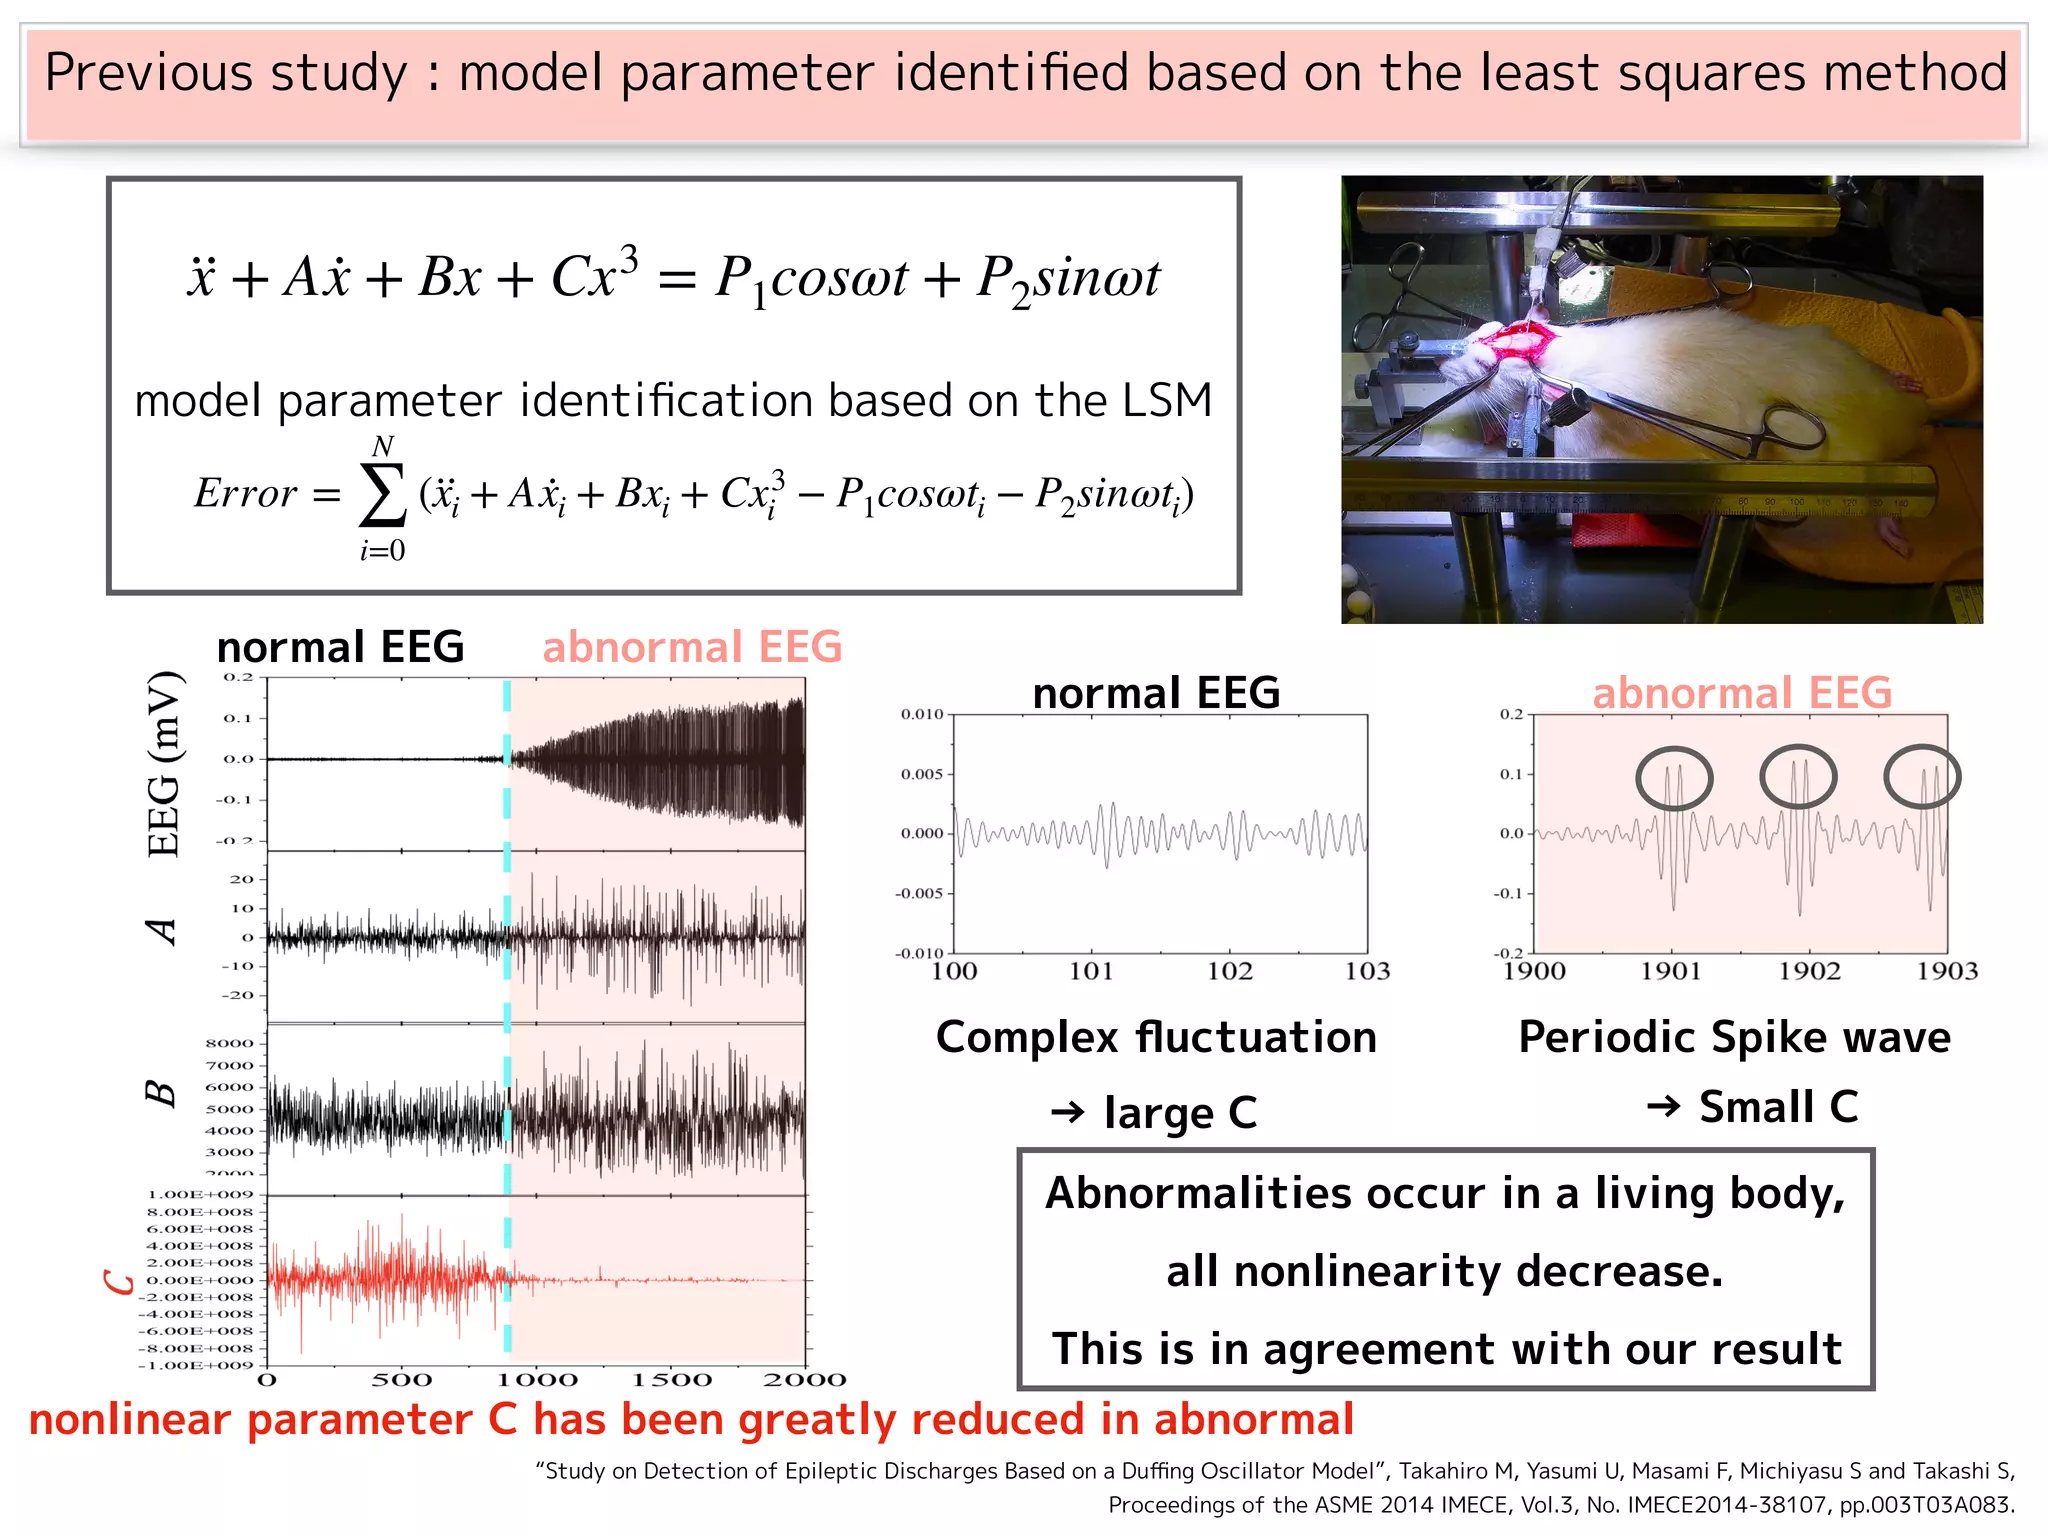
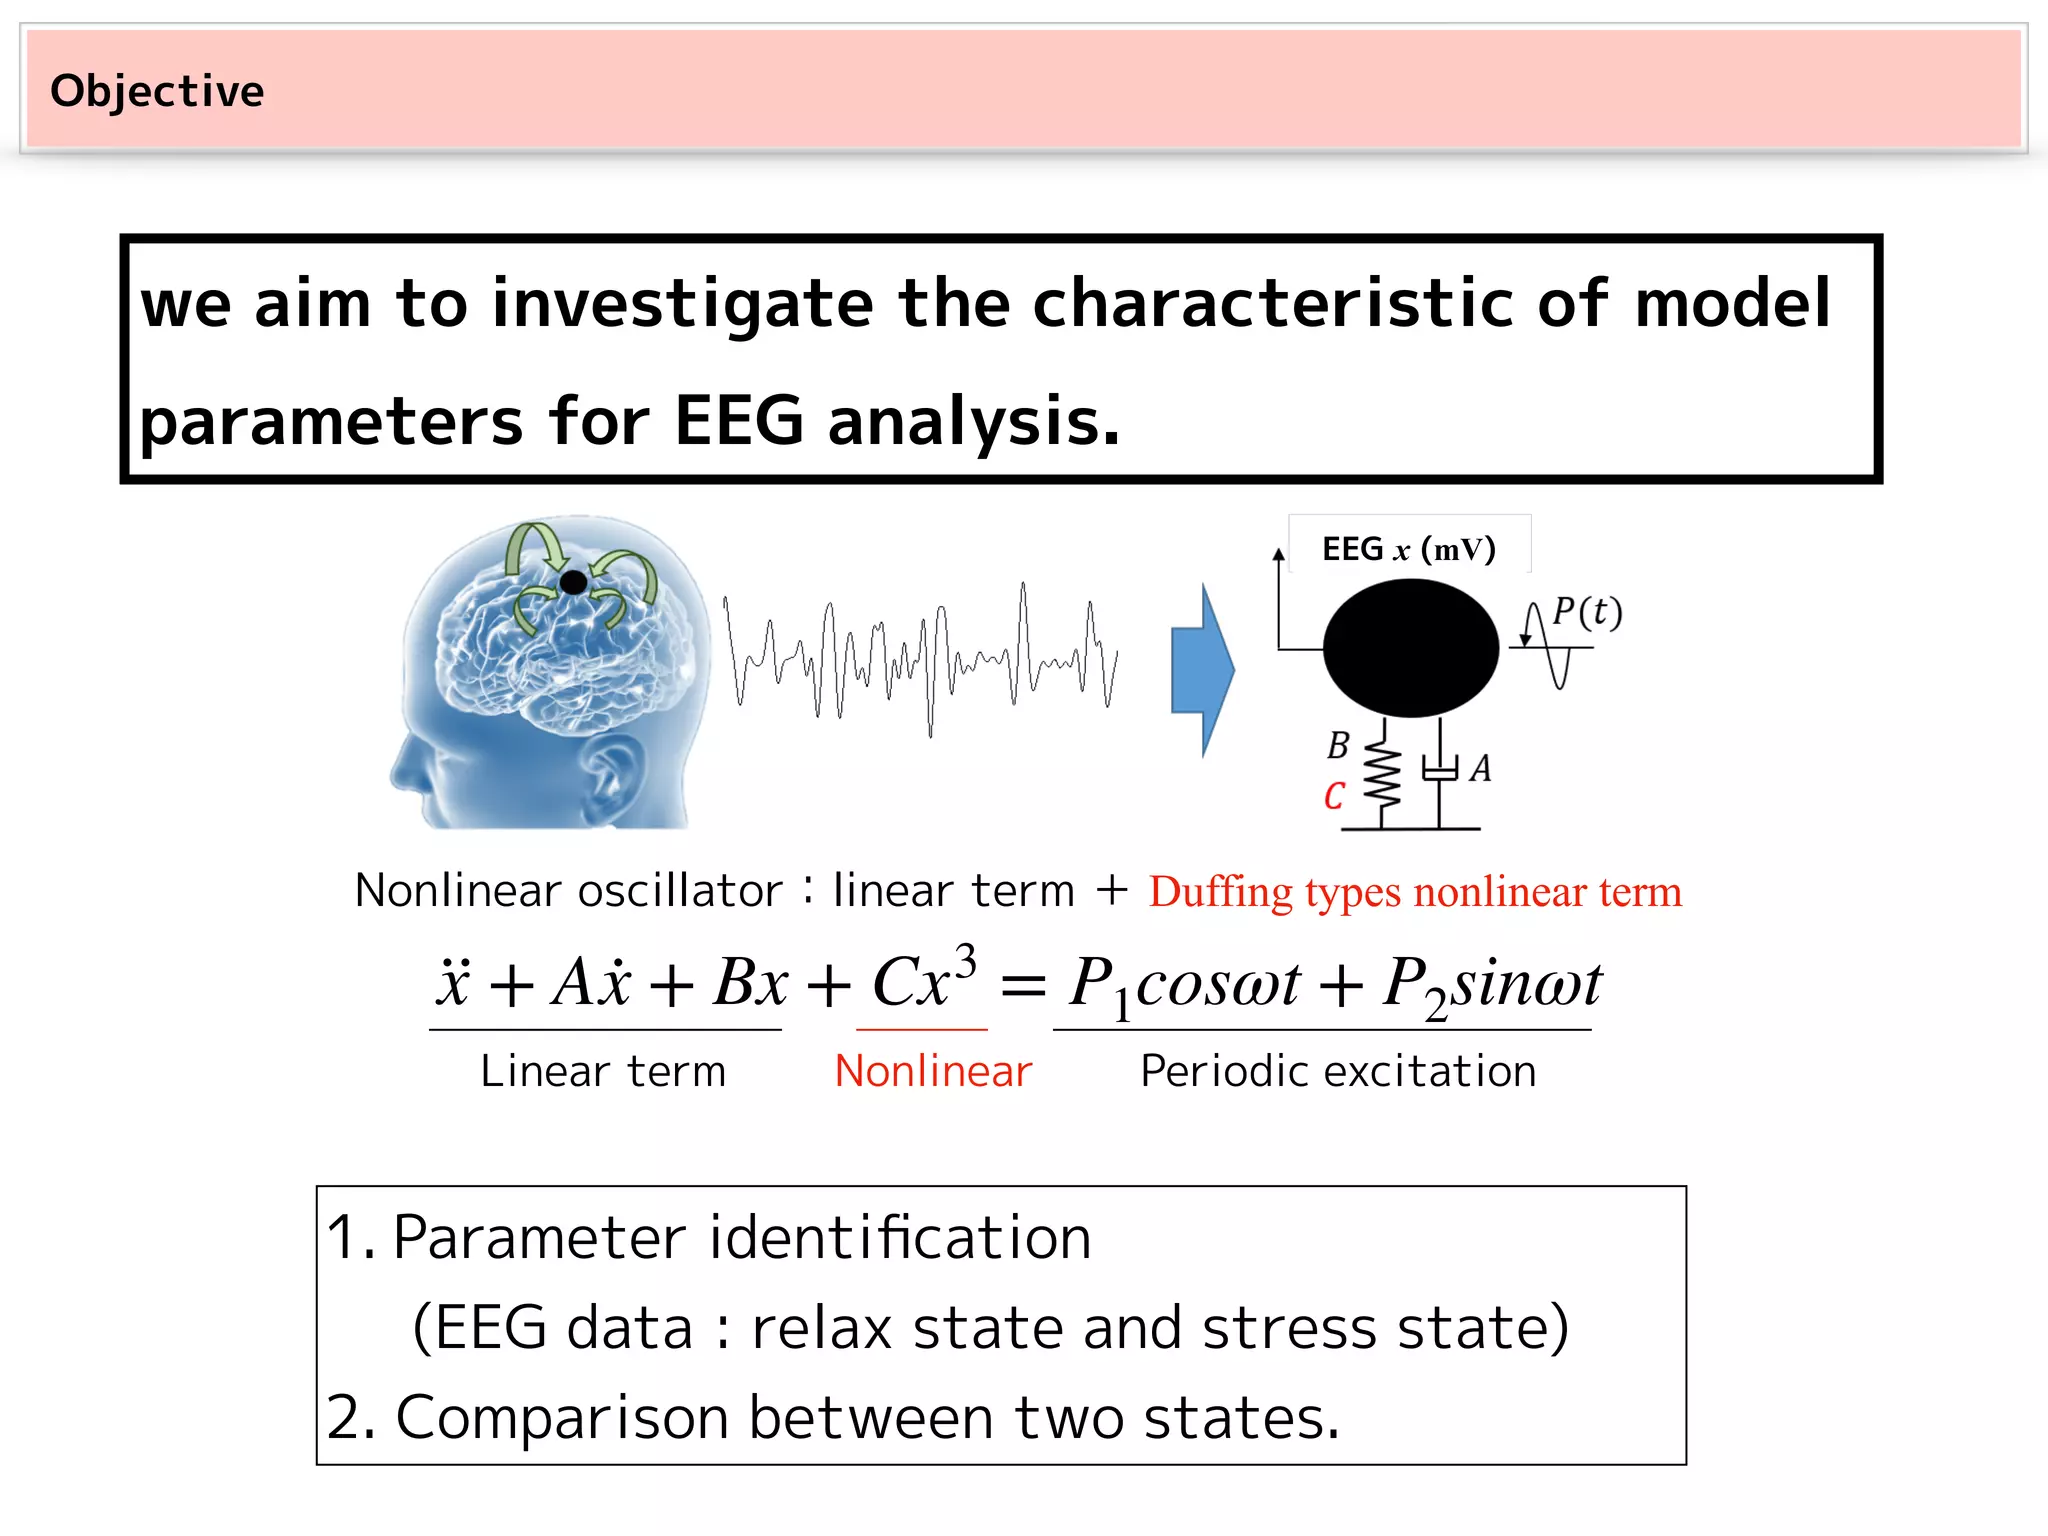
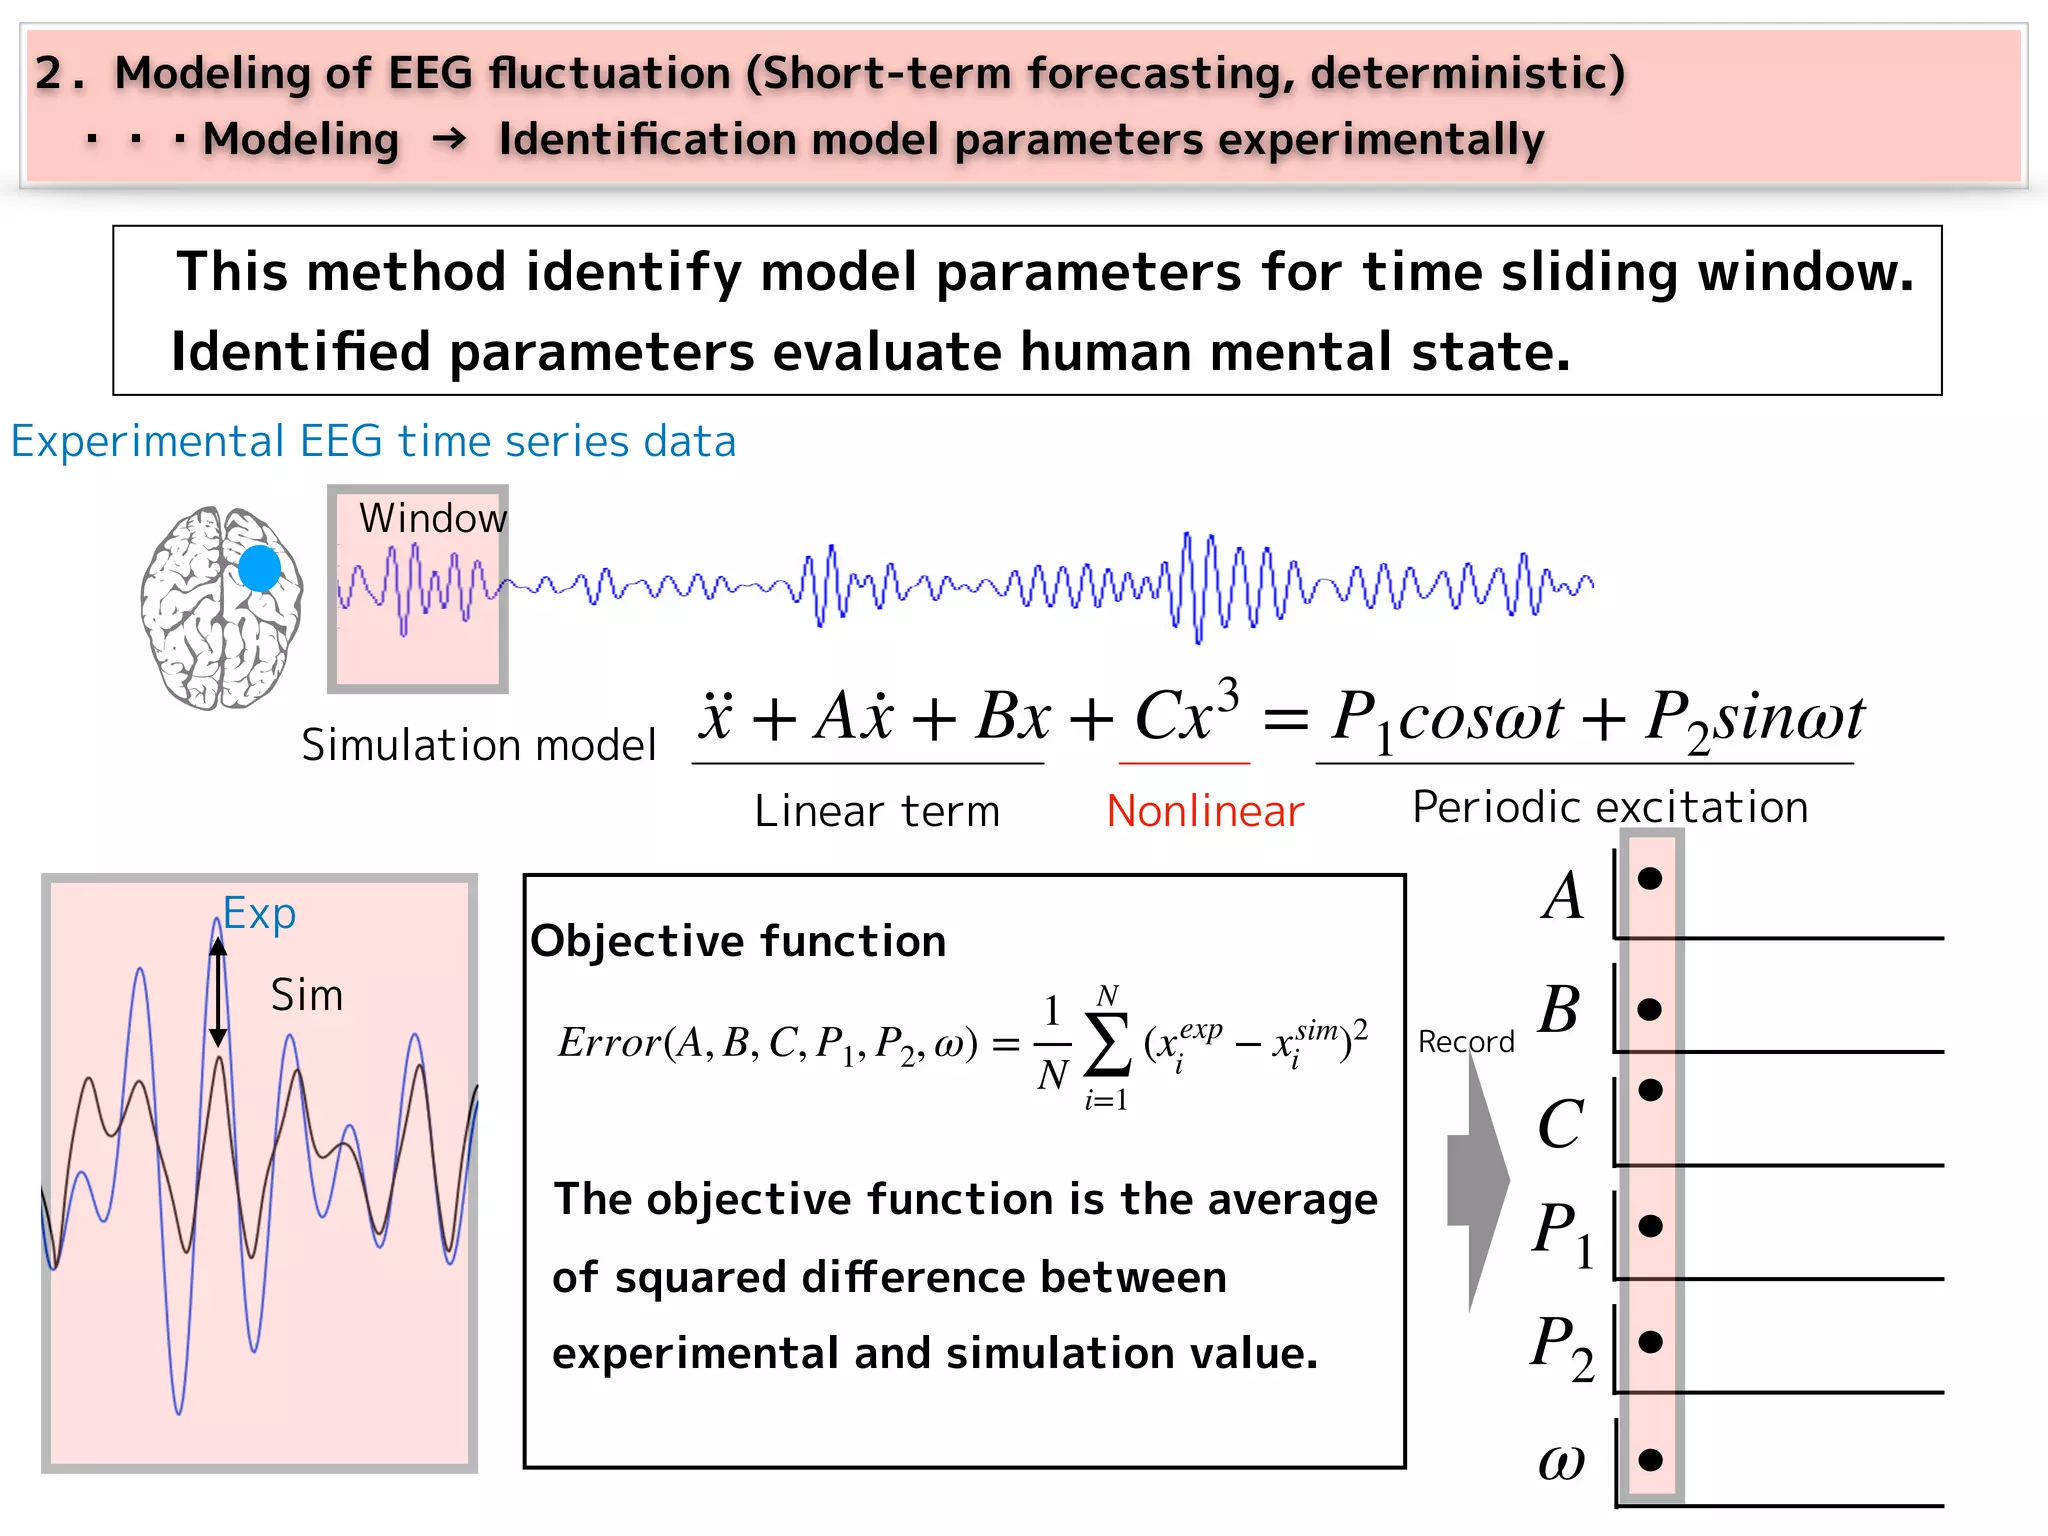
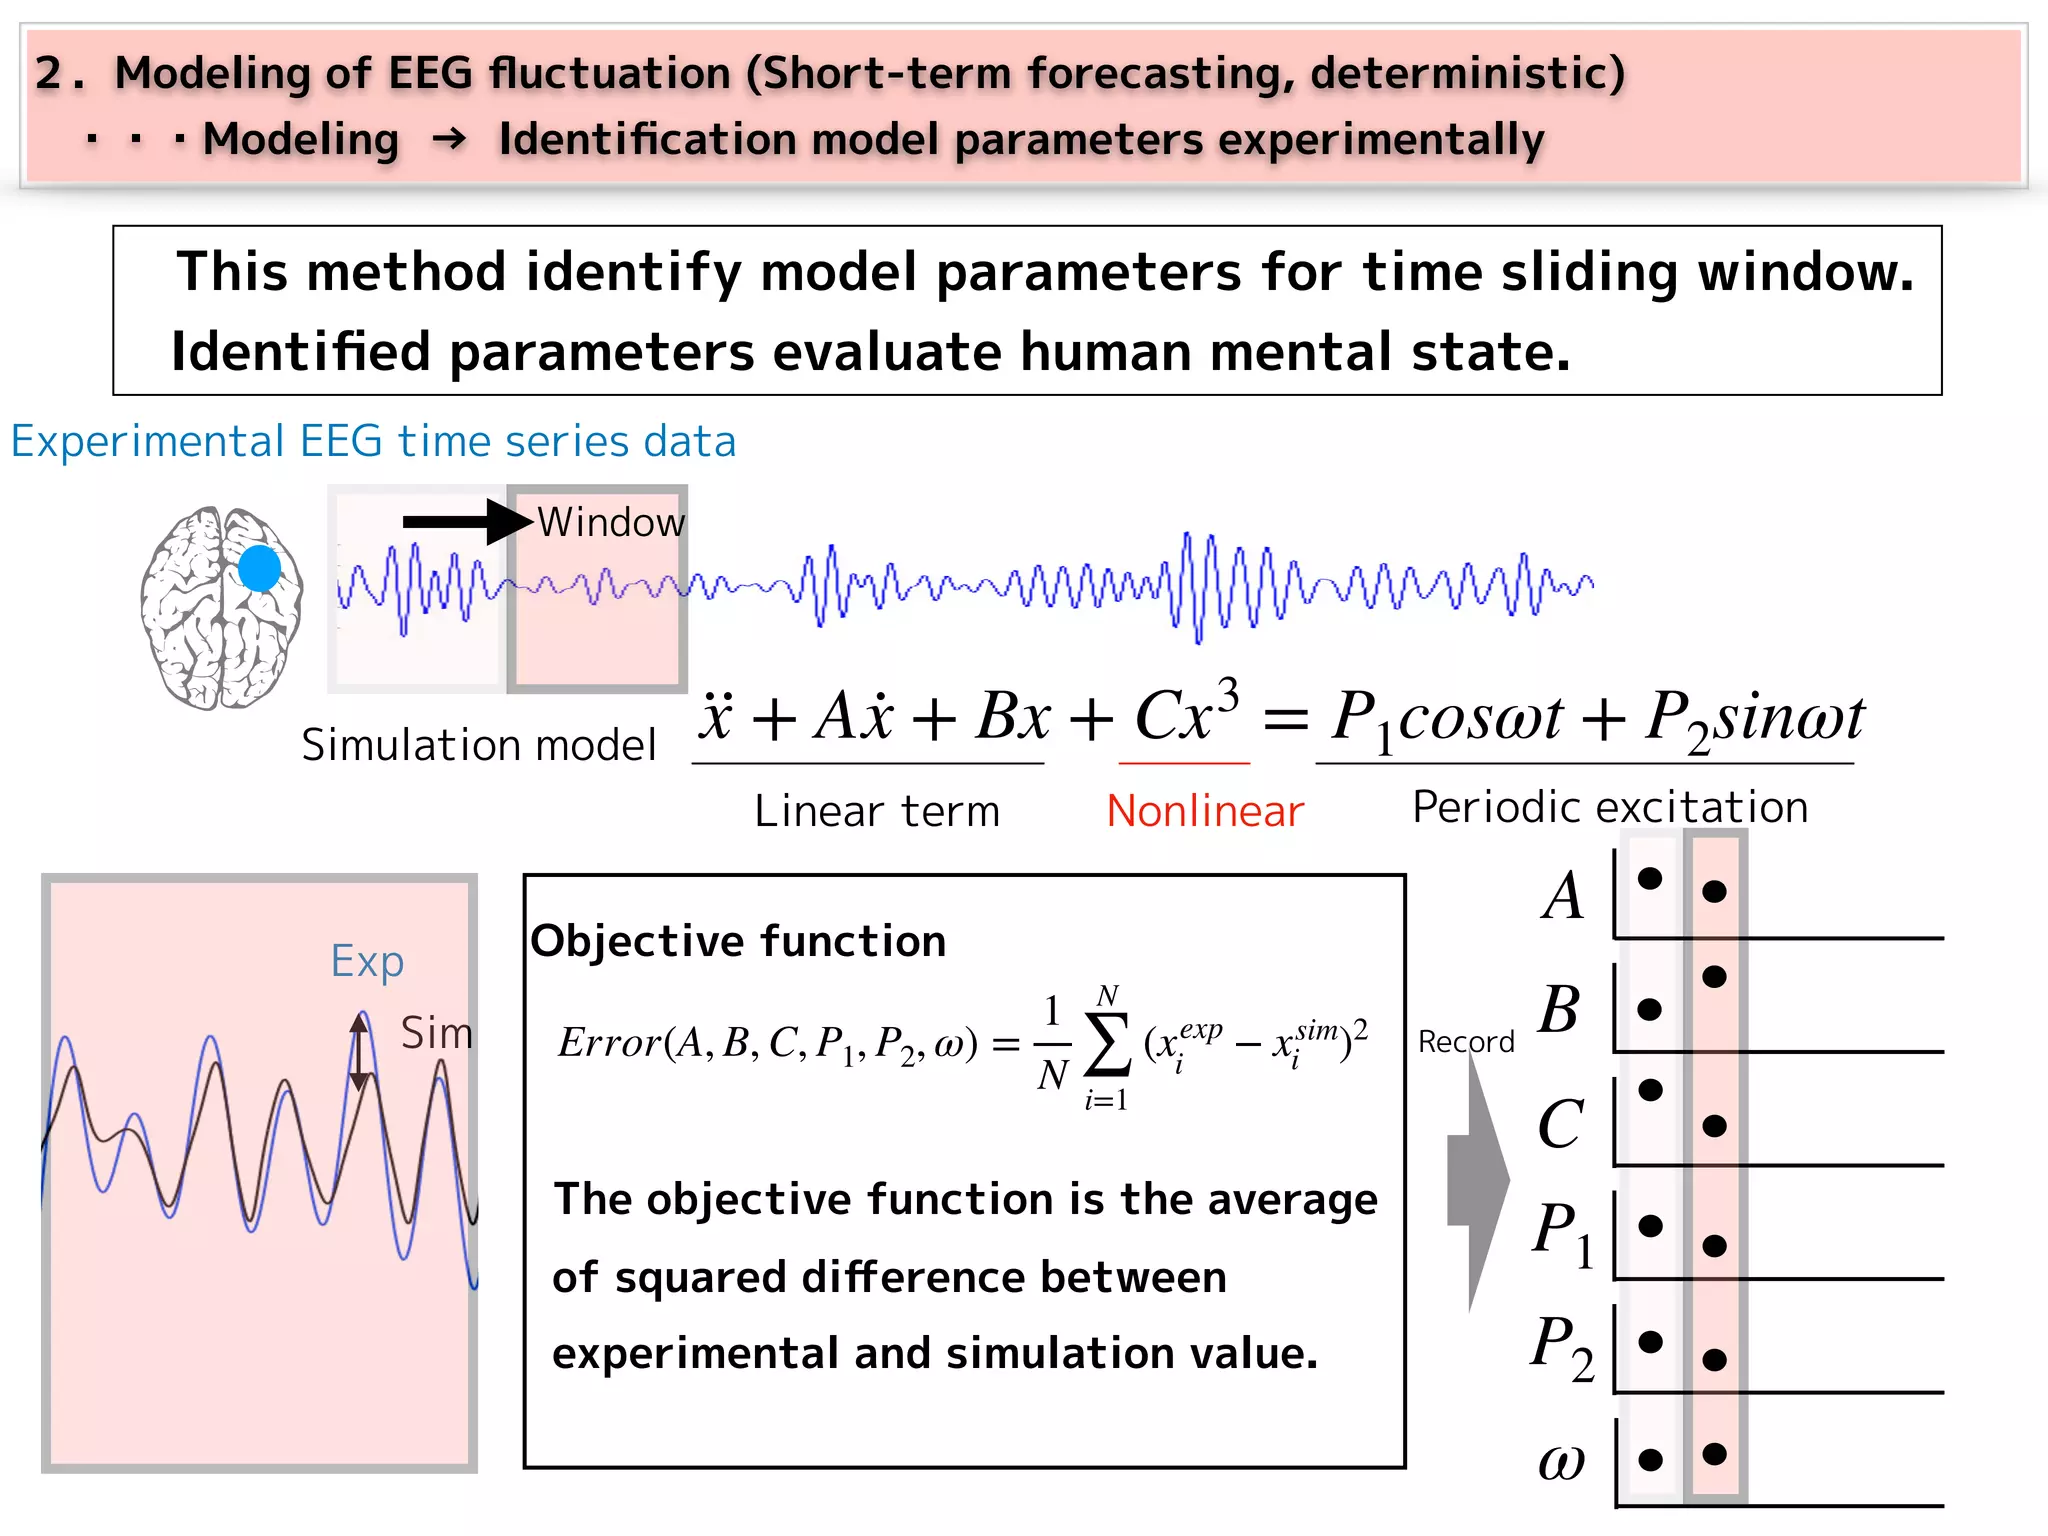
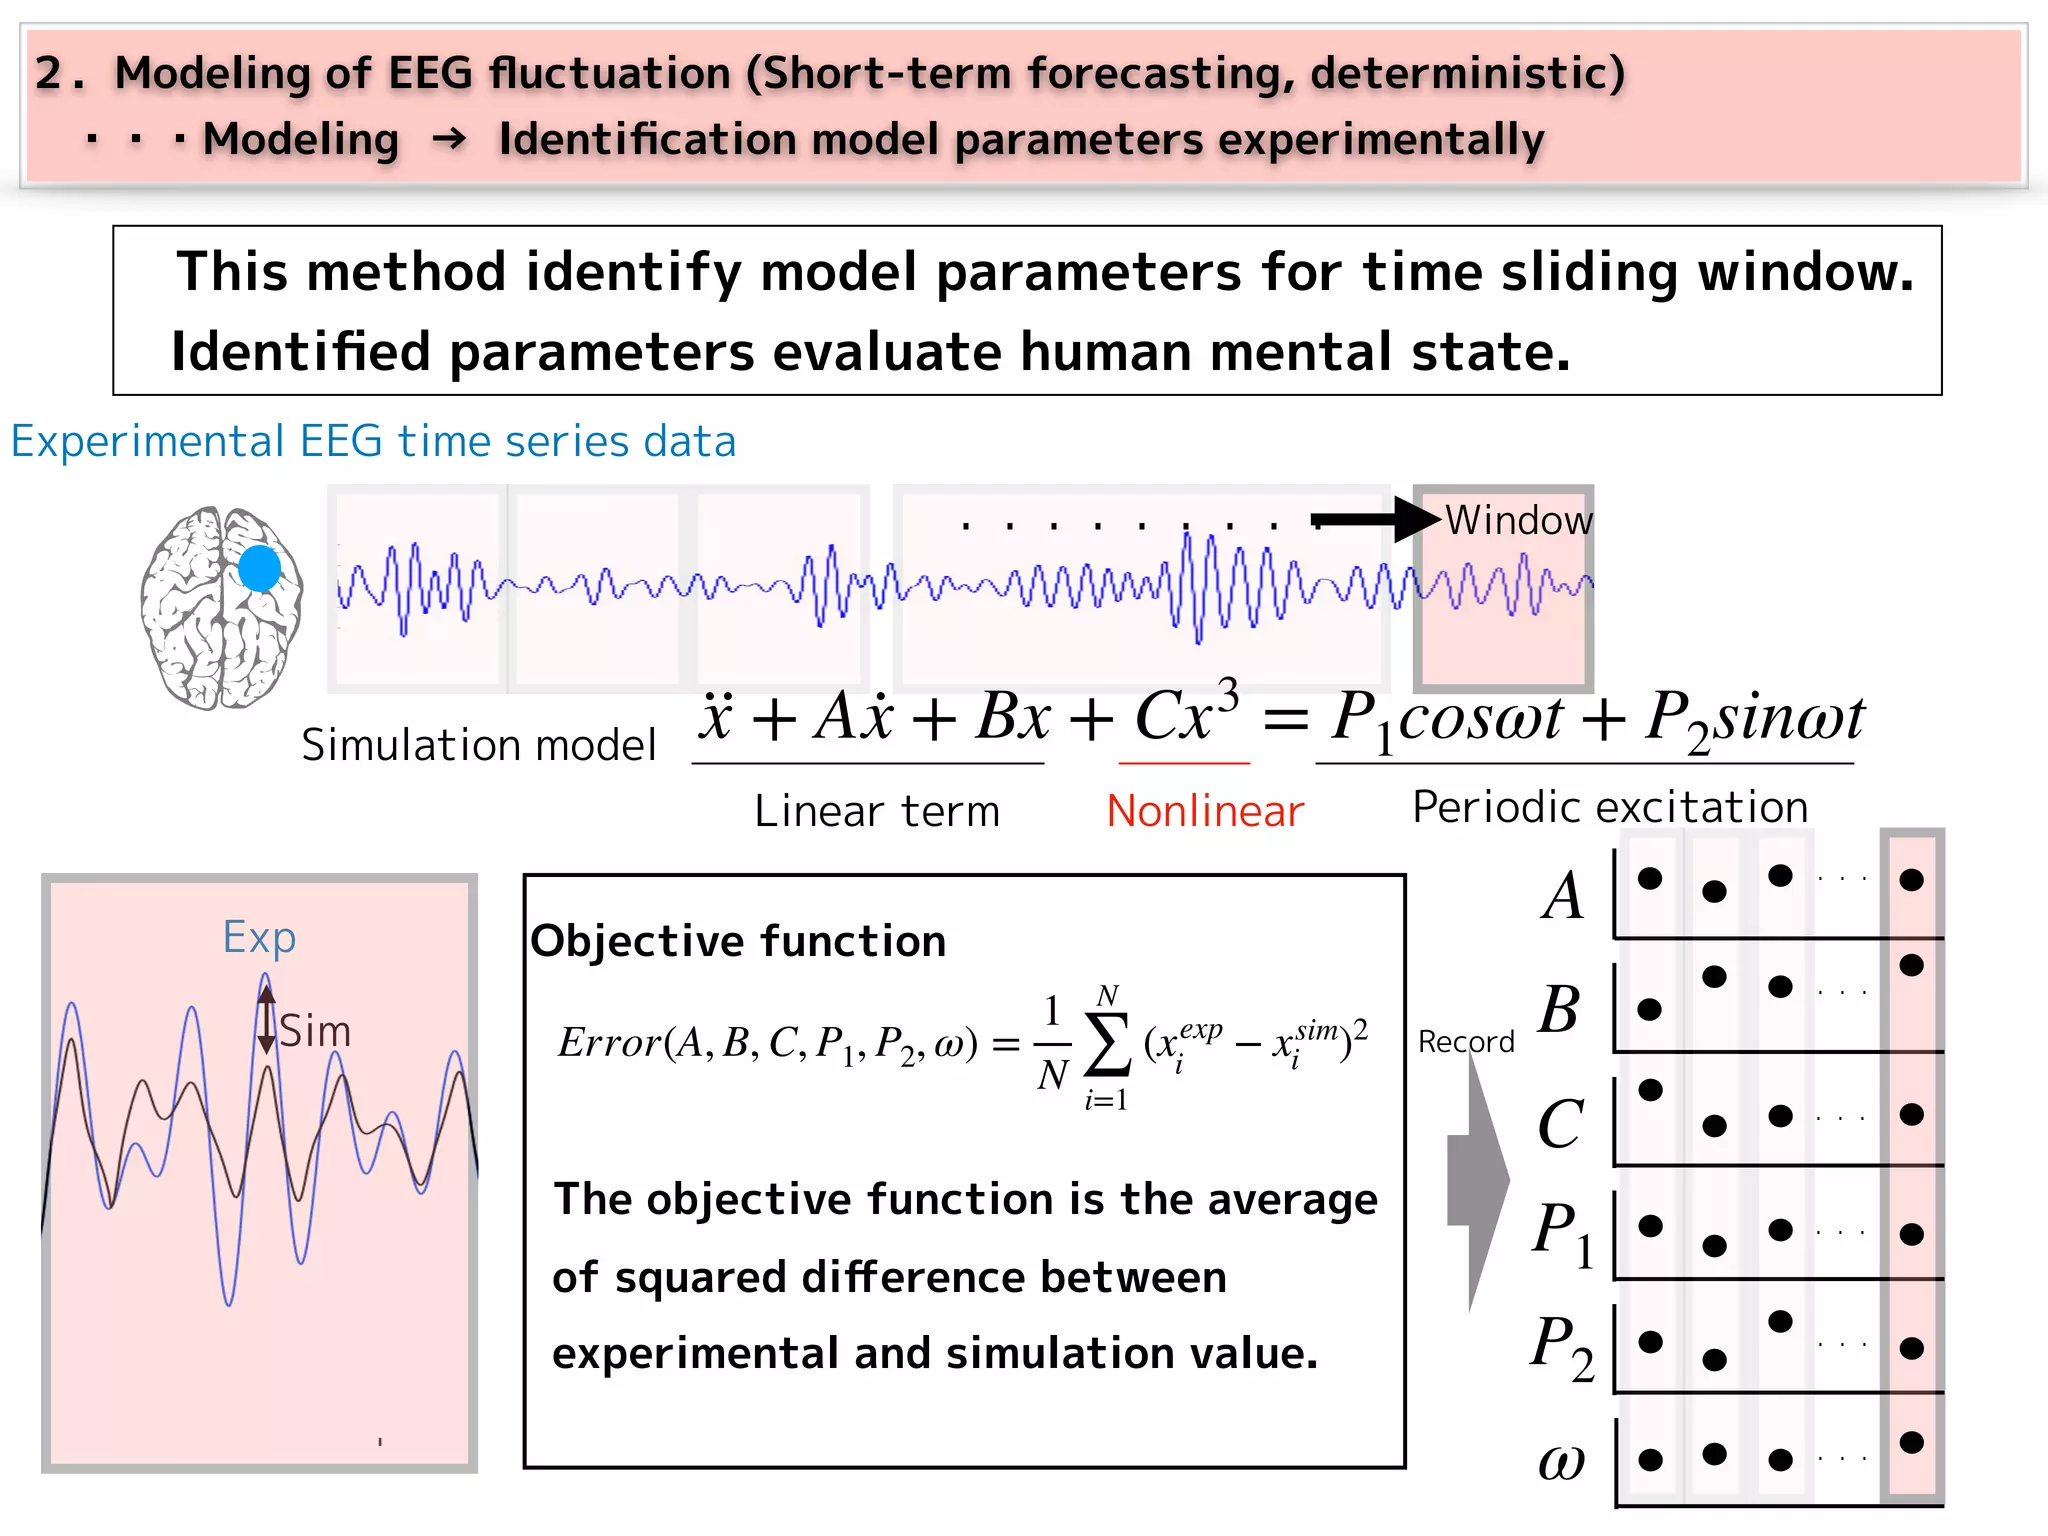
Modeling EEG fluctuations using nonlinear oscillators, experimental identification of parameters, and the framework for EEG analysis.
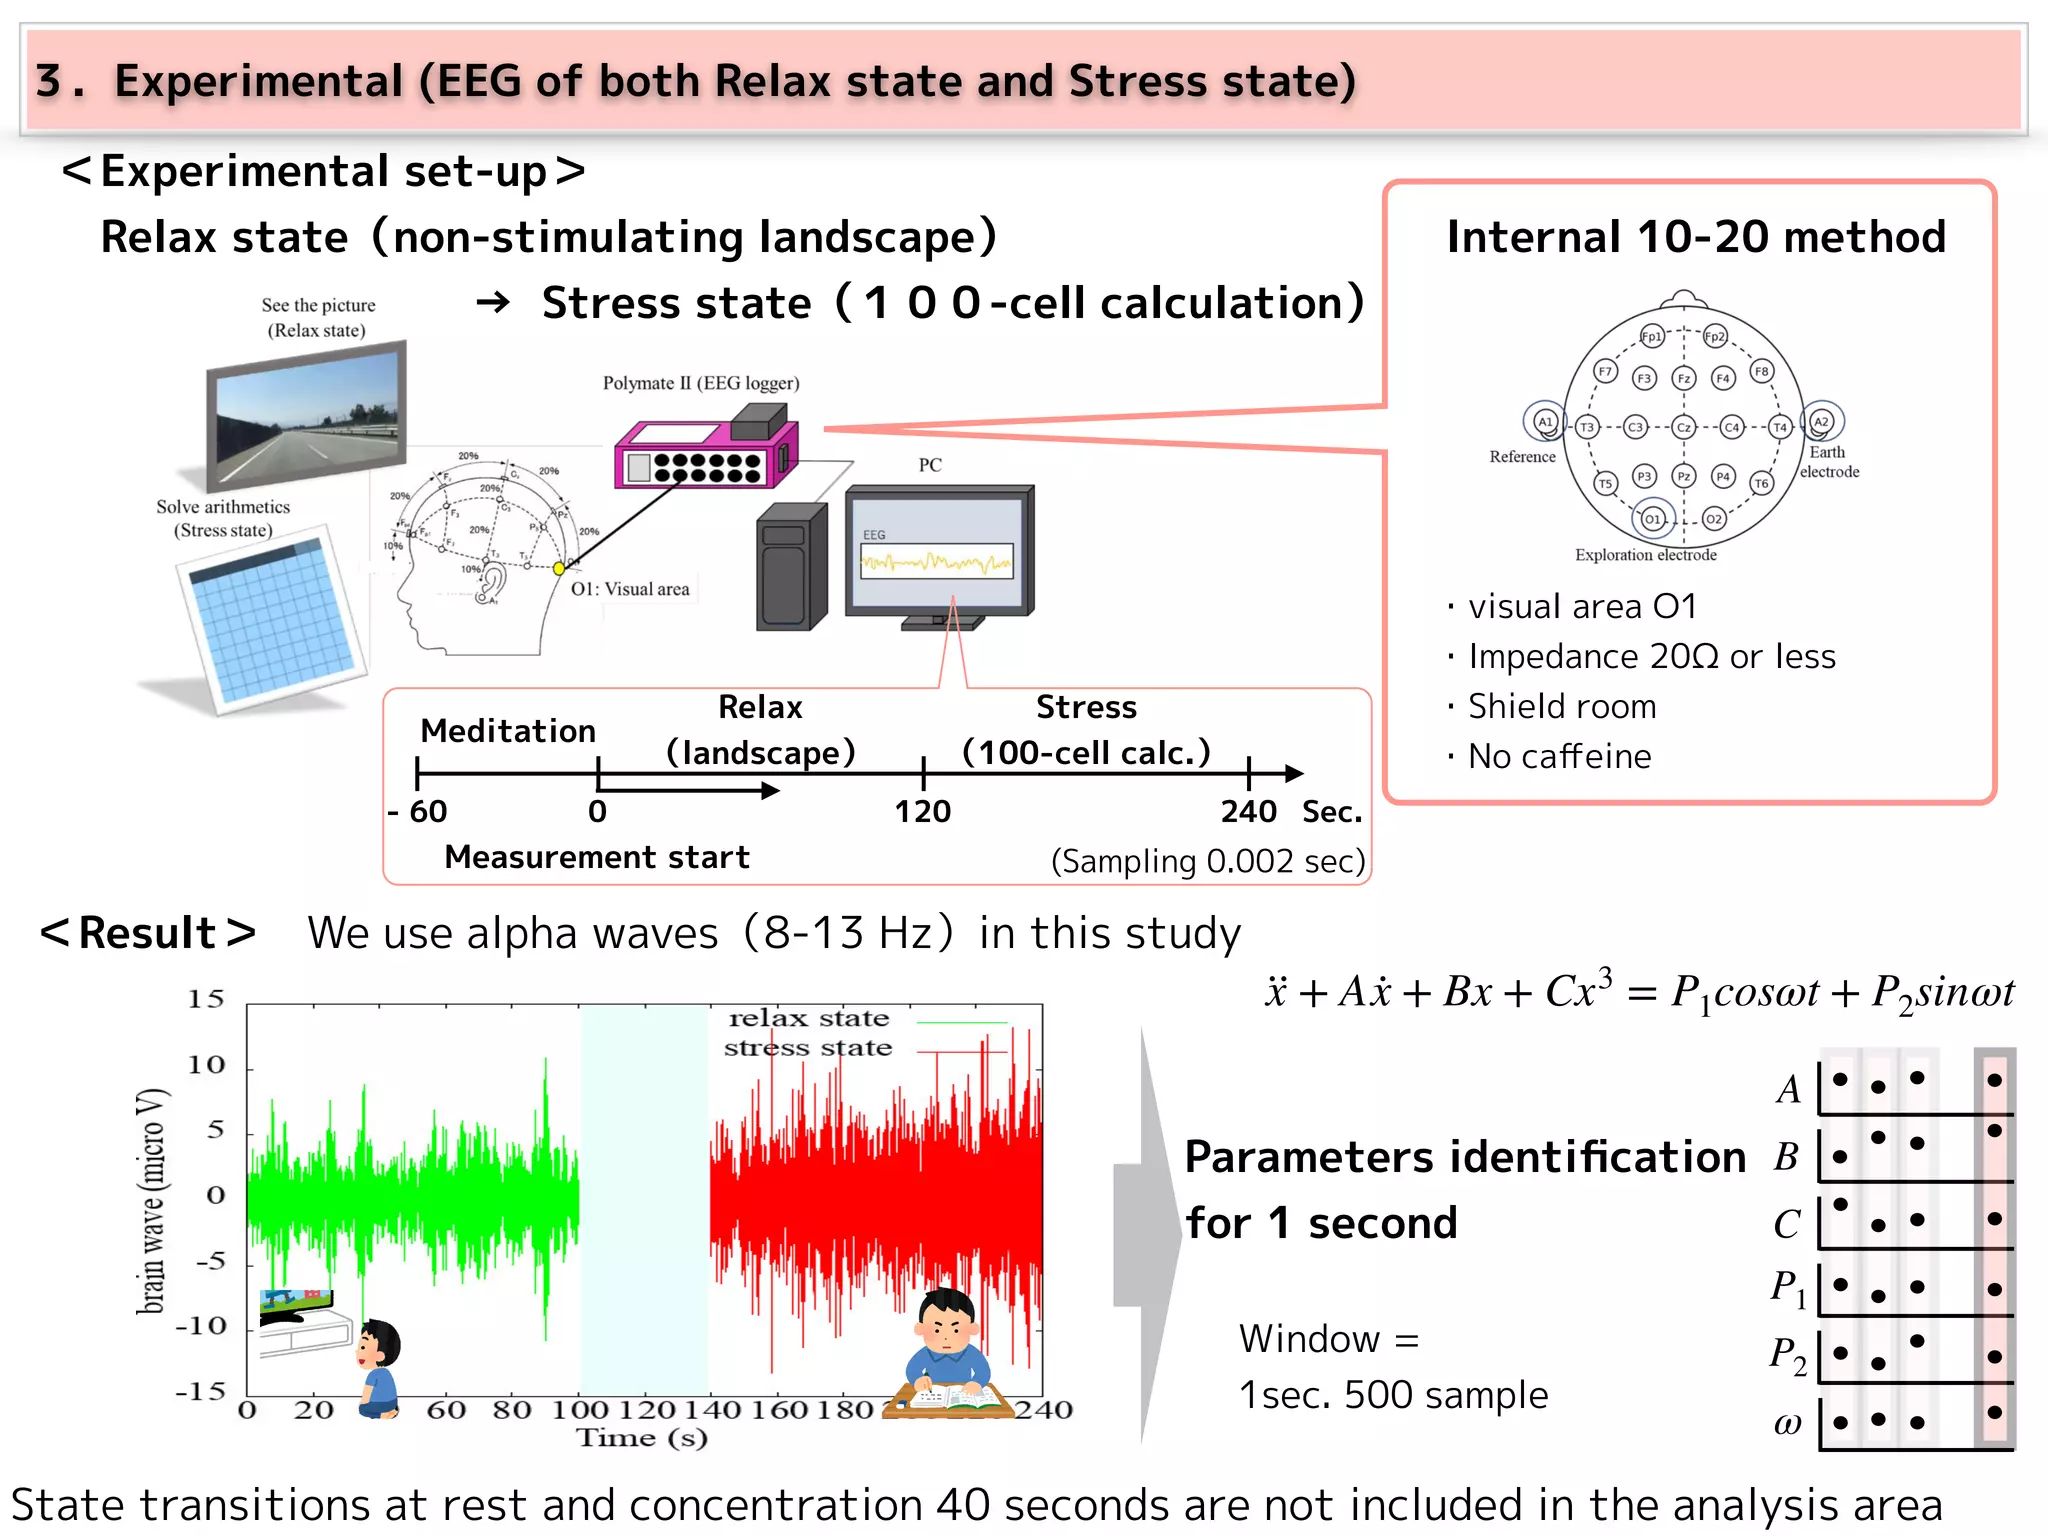
Experimental methodology for data collection from EEG in relaxed and stressed states, parameters identification, evaluation, and error analysis.
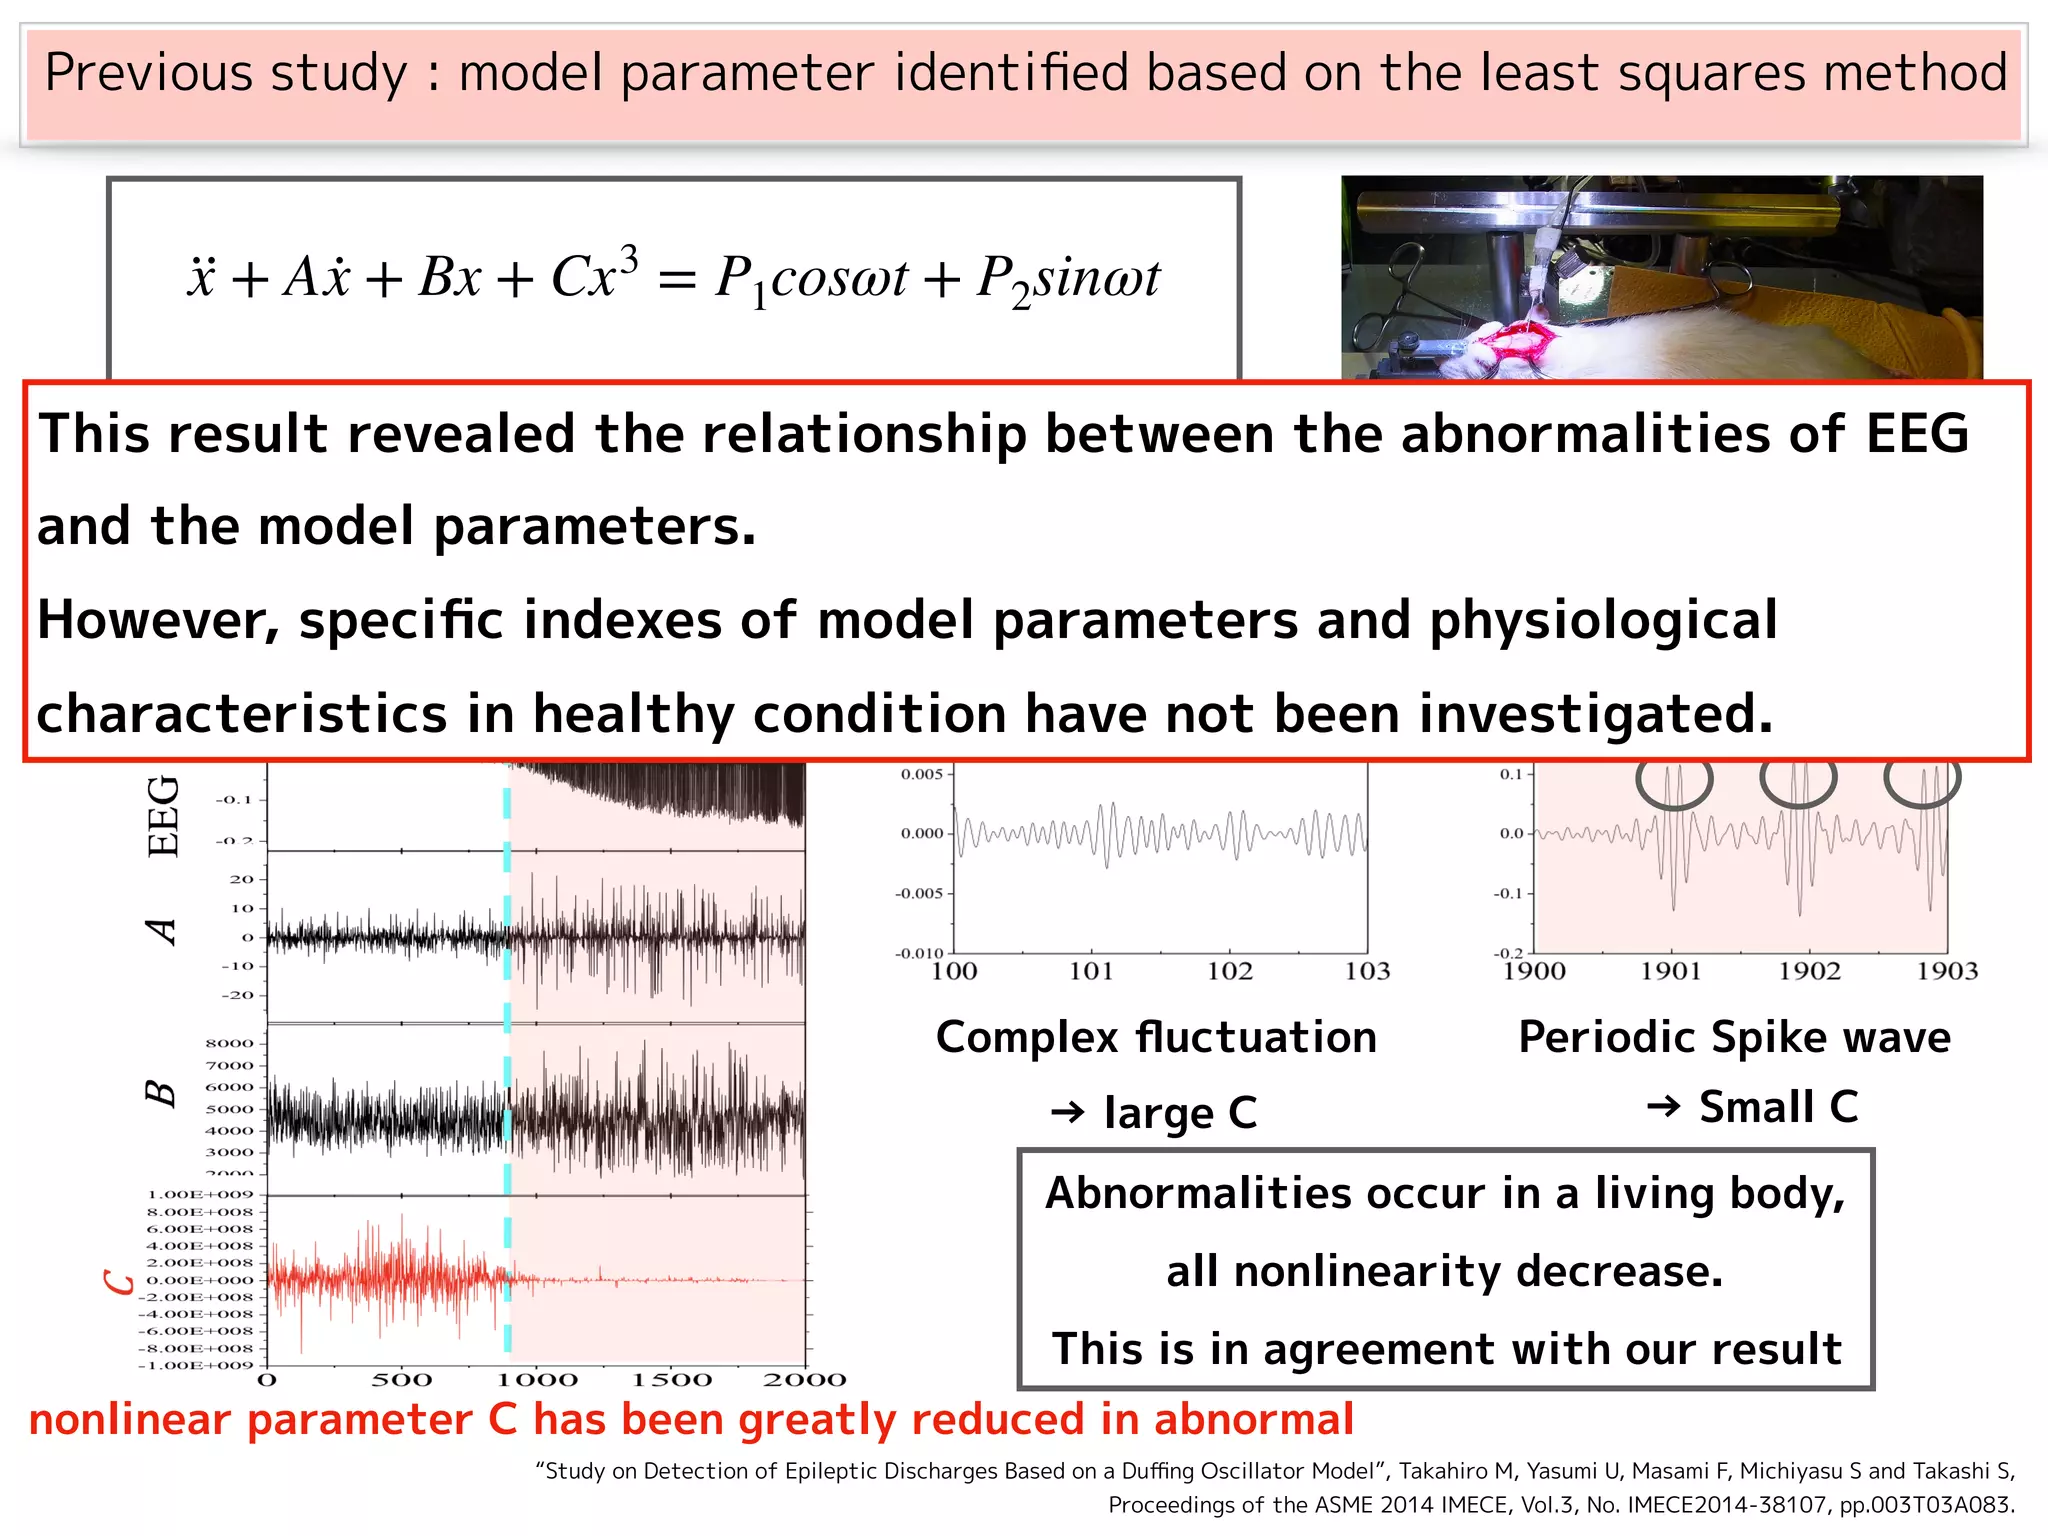
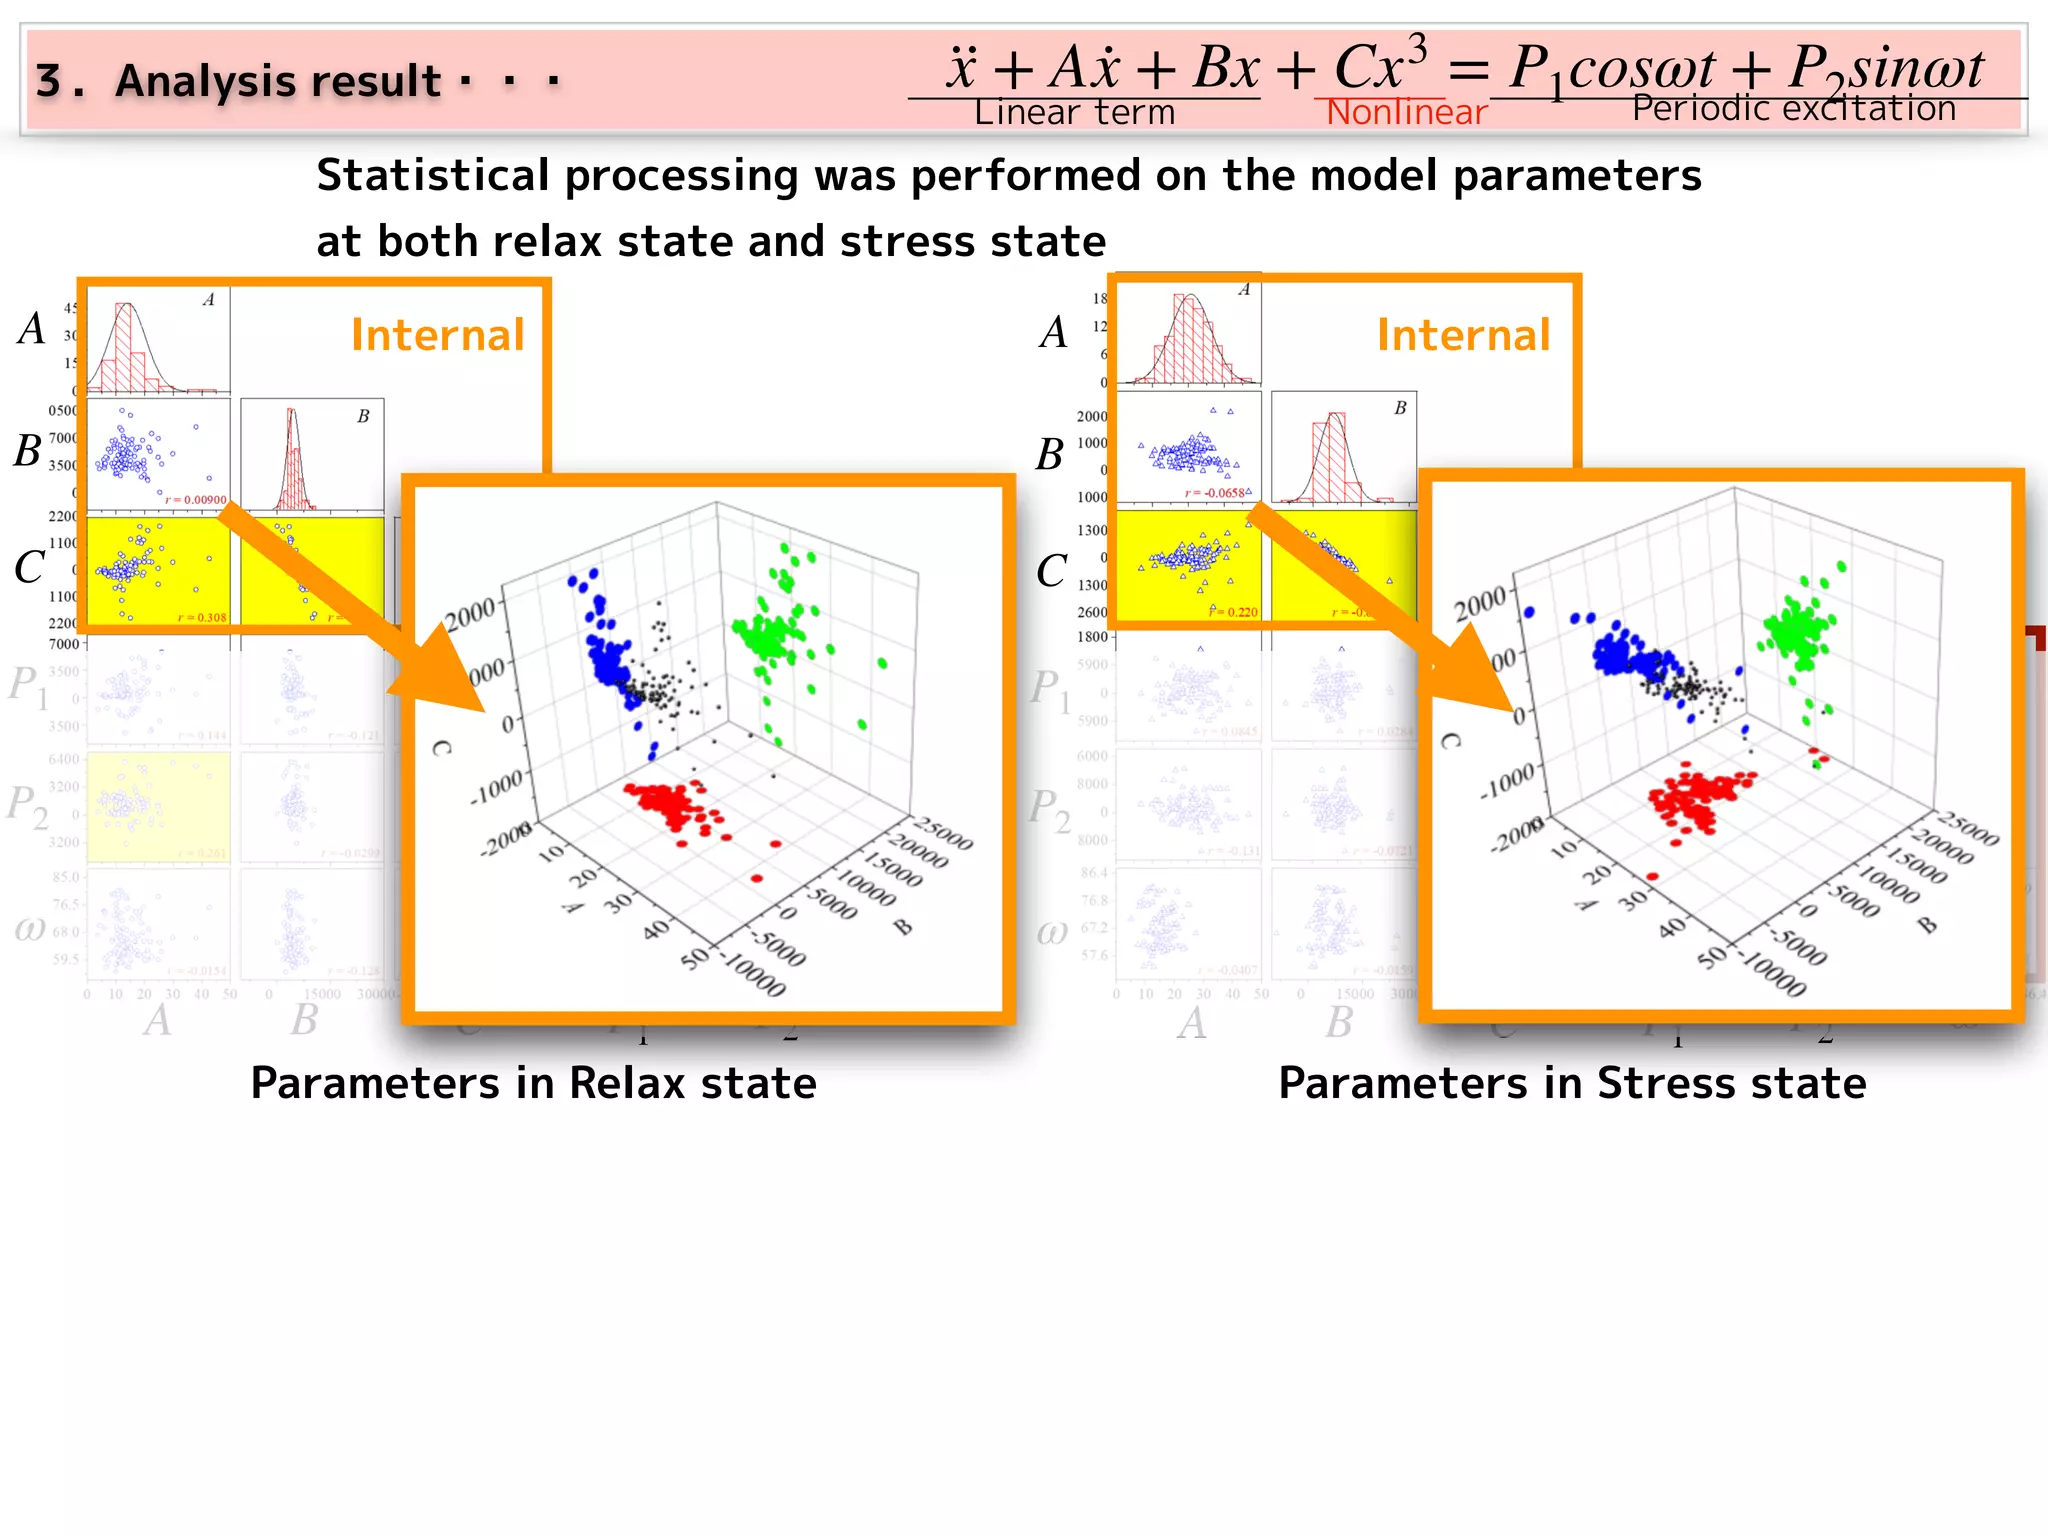
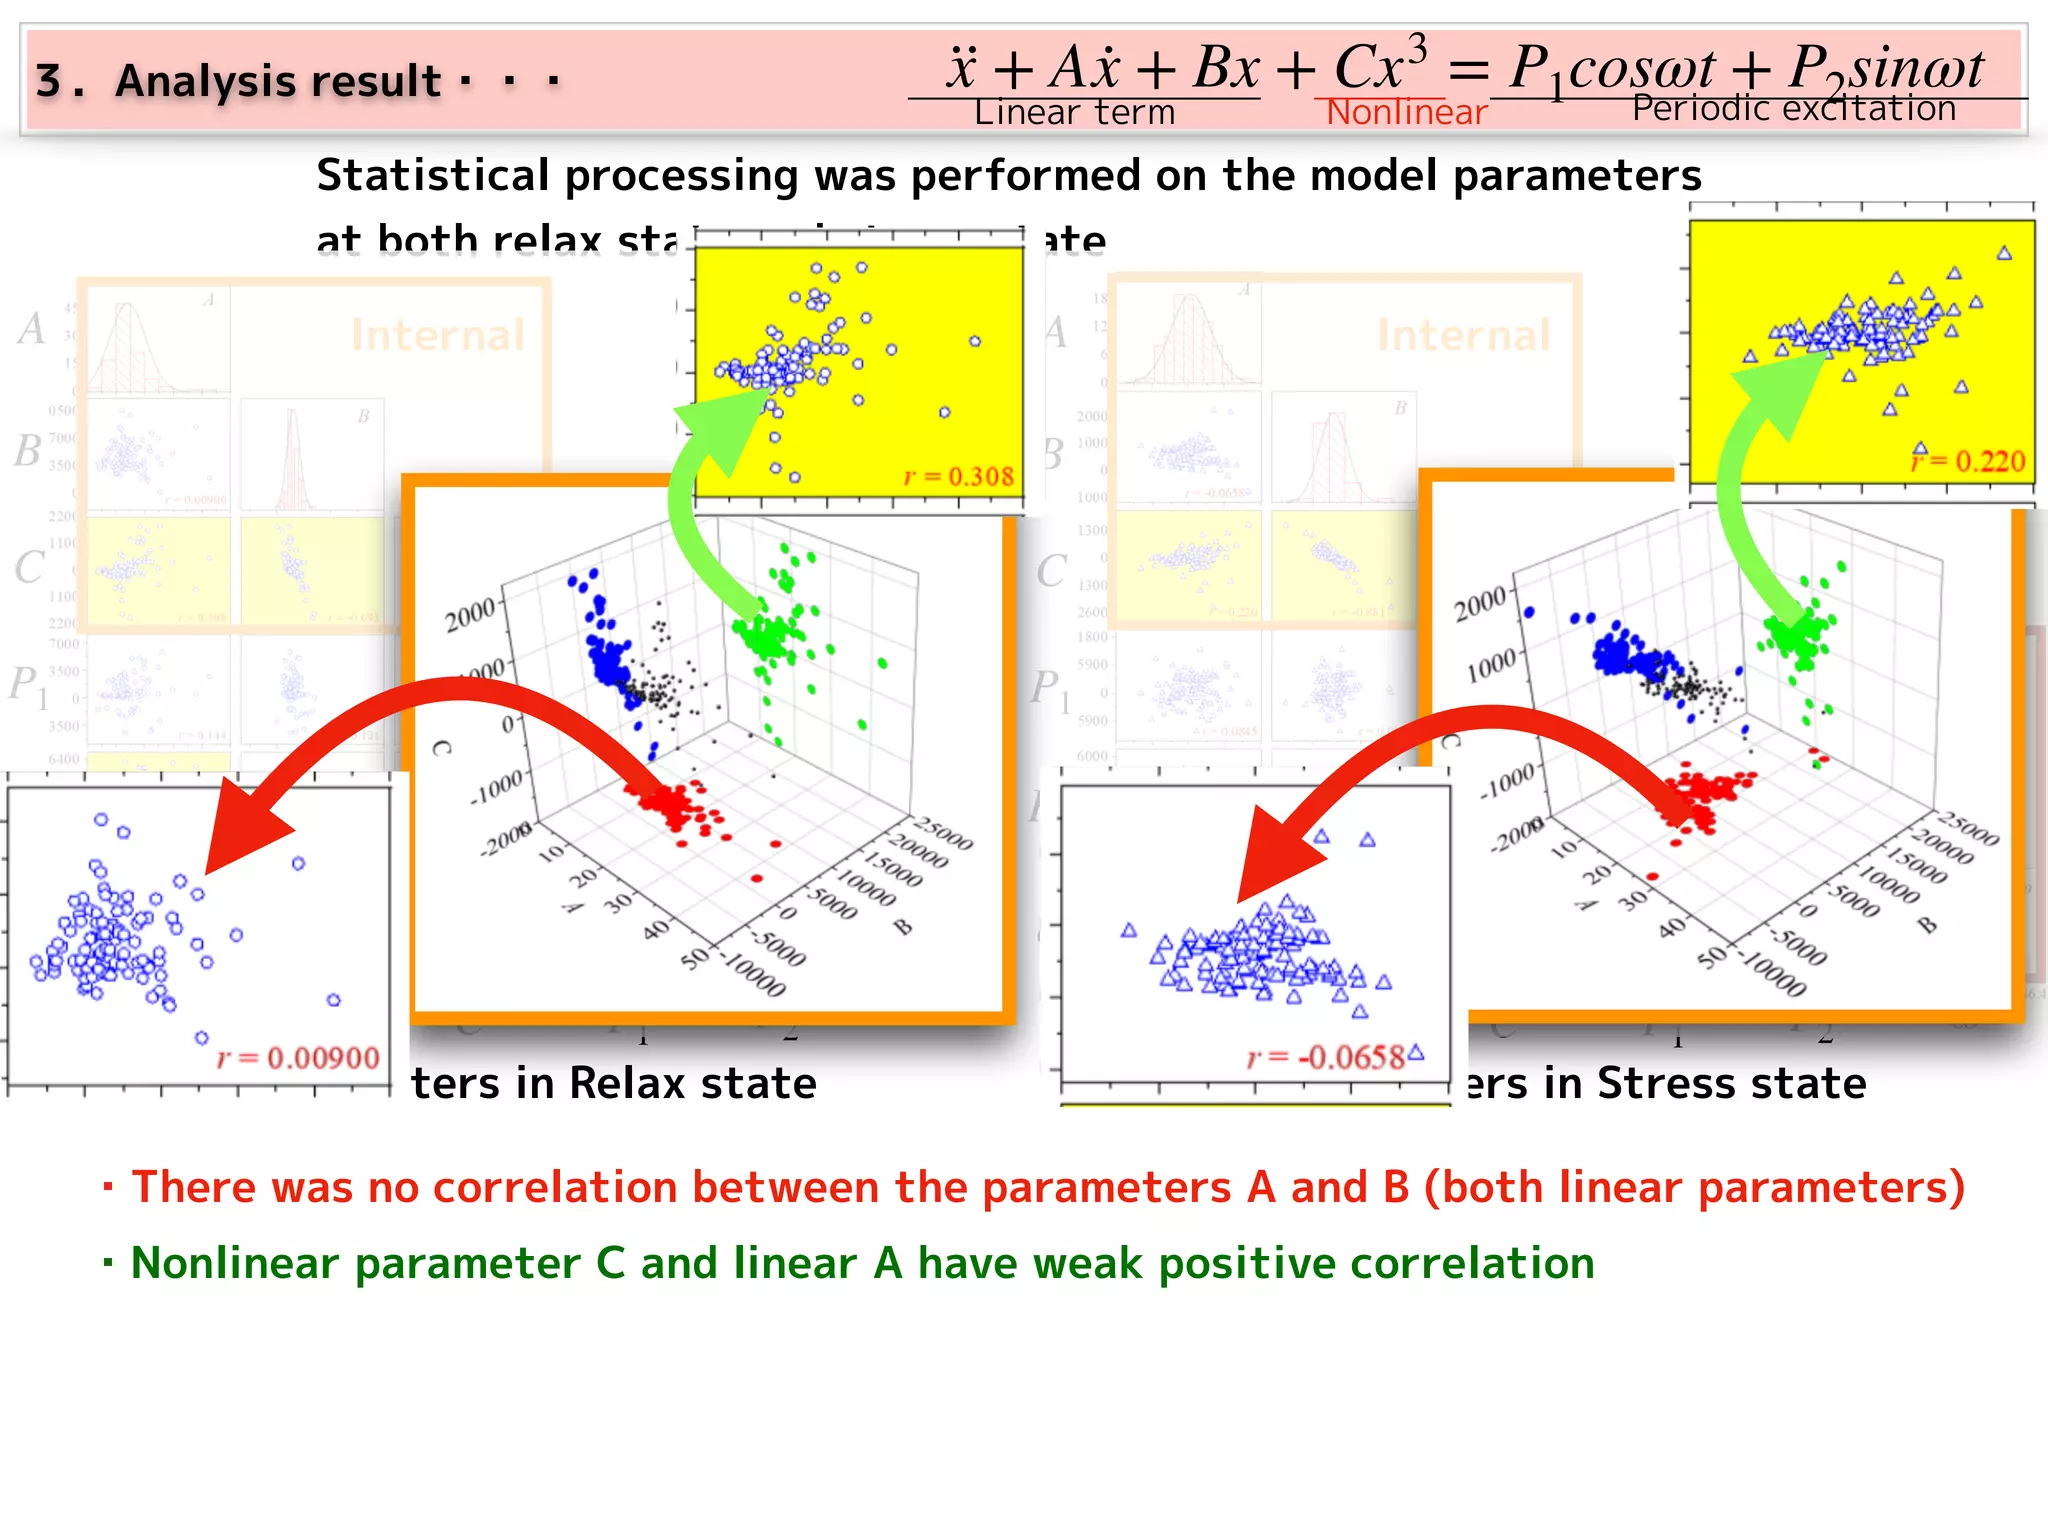
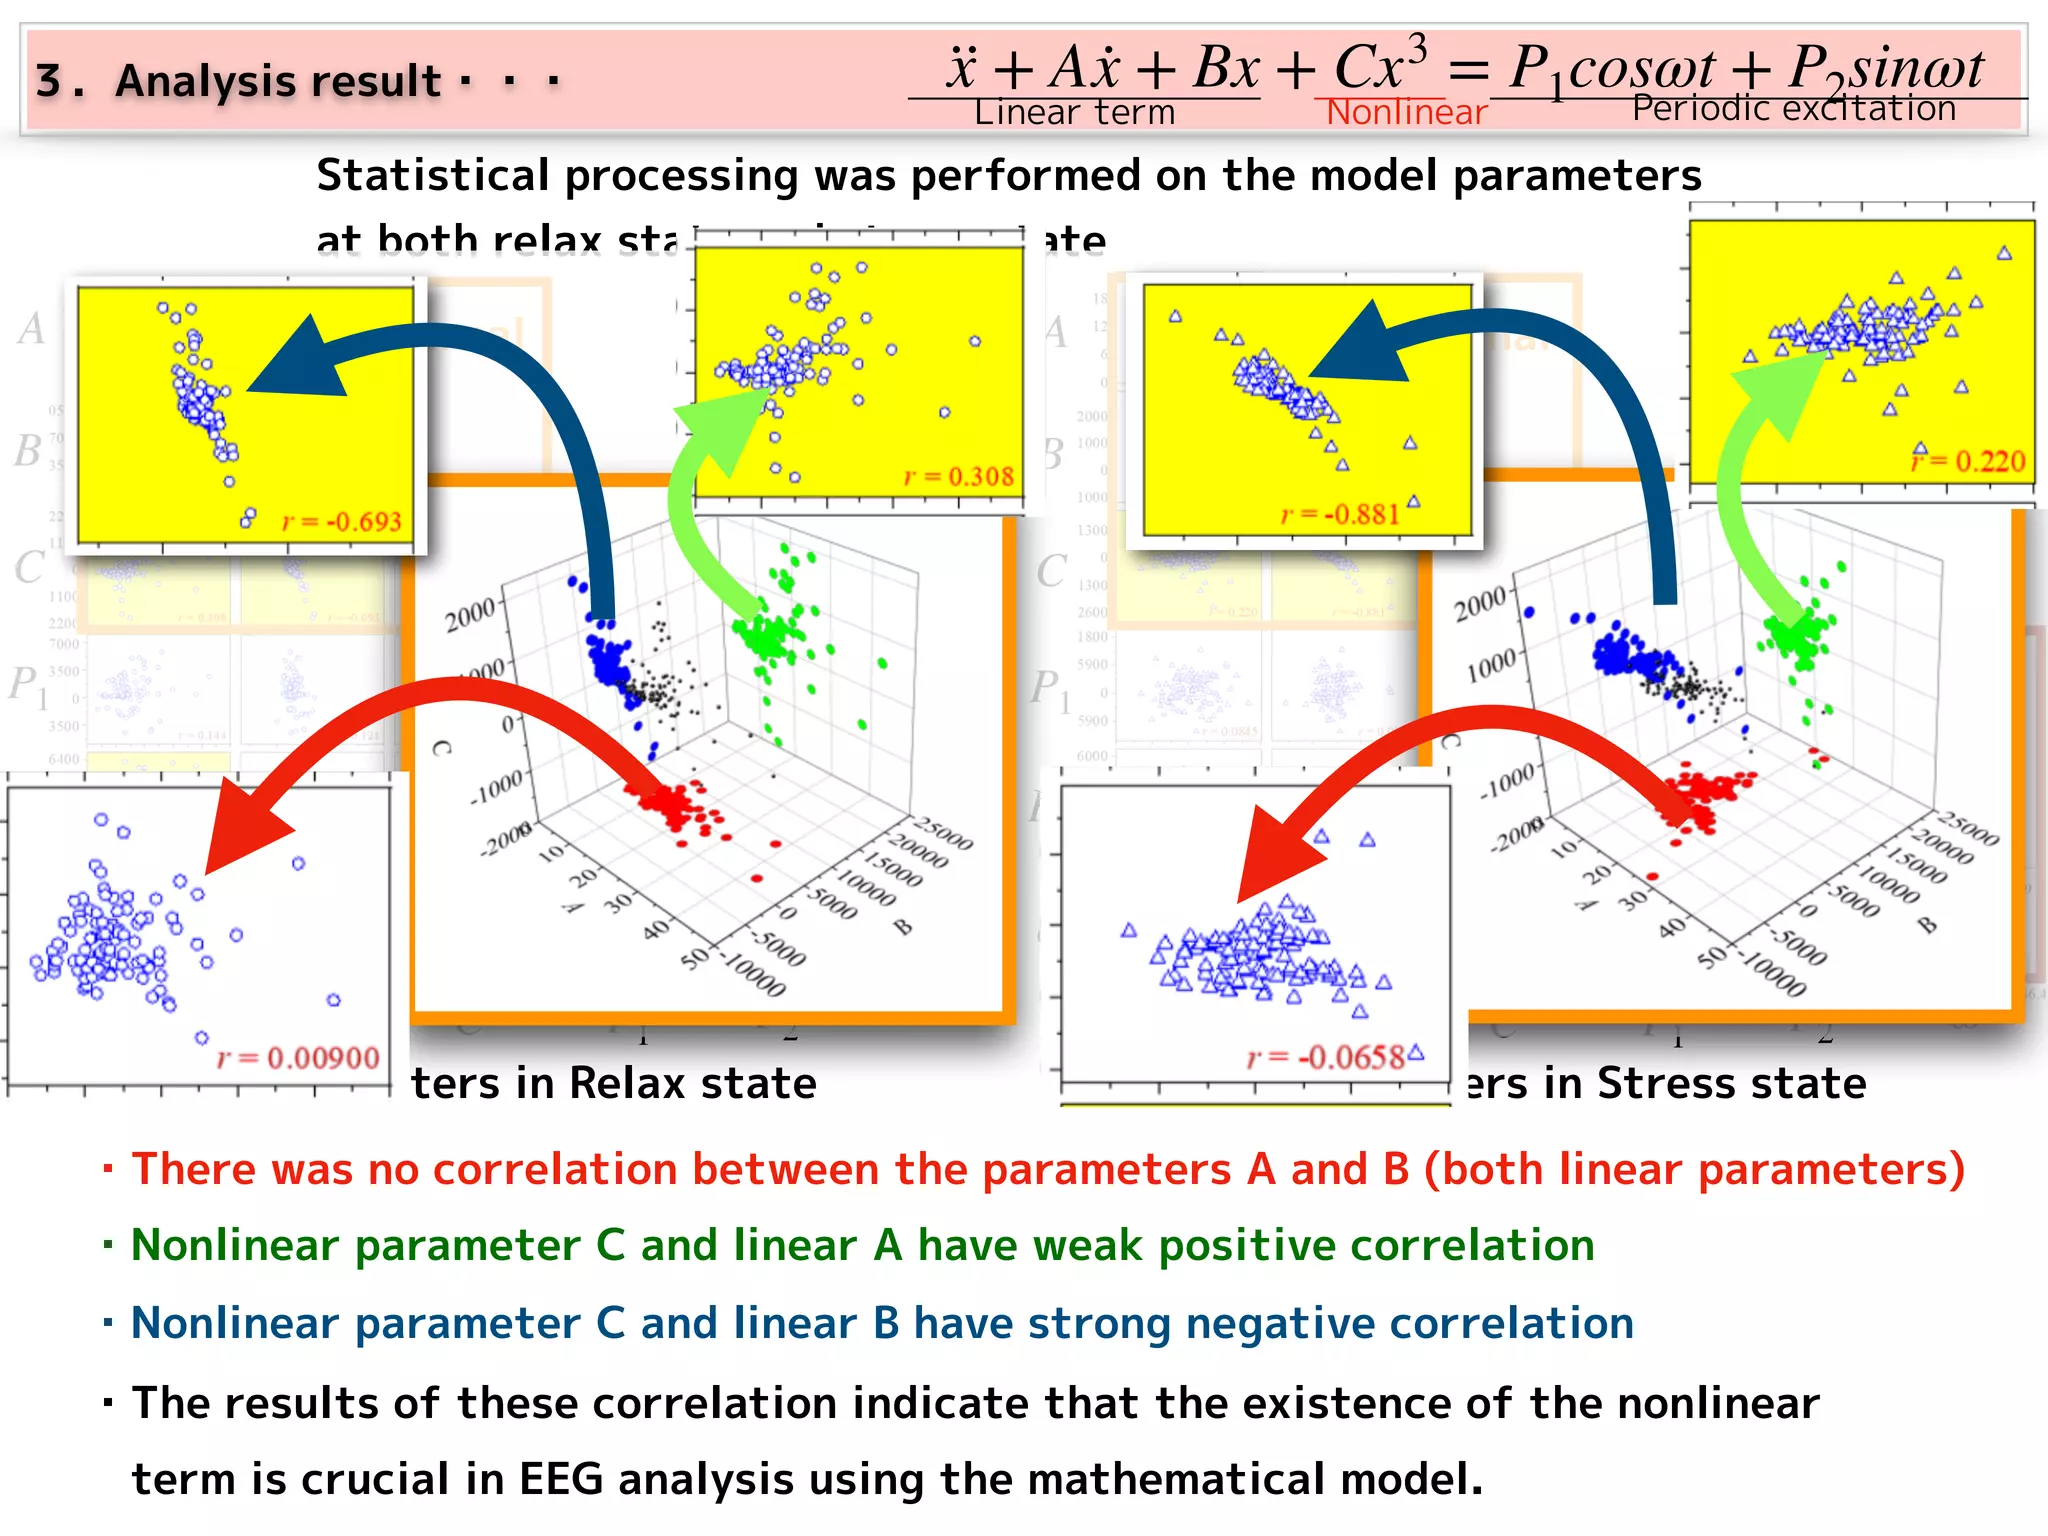
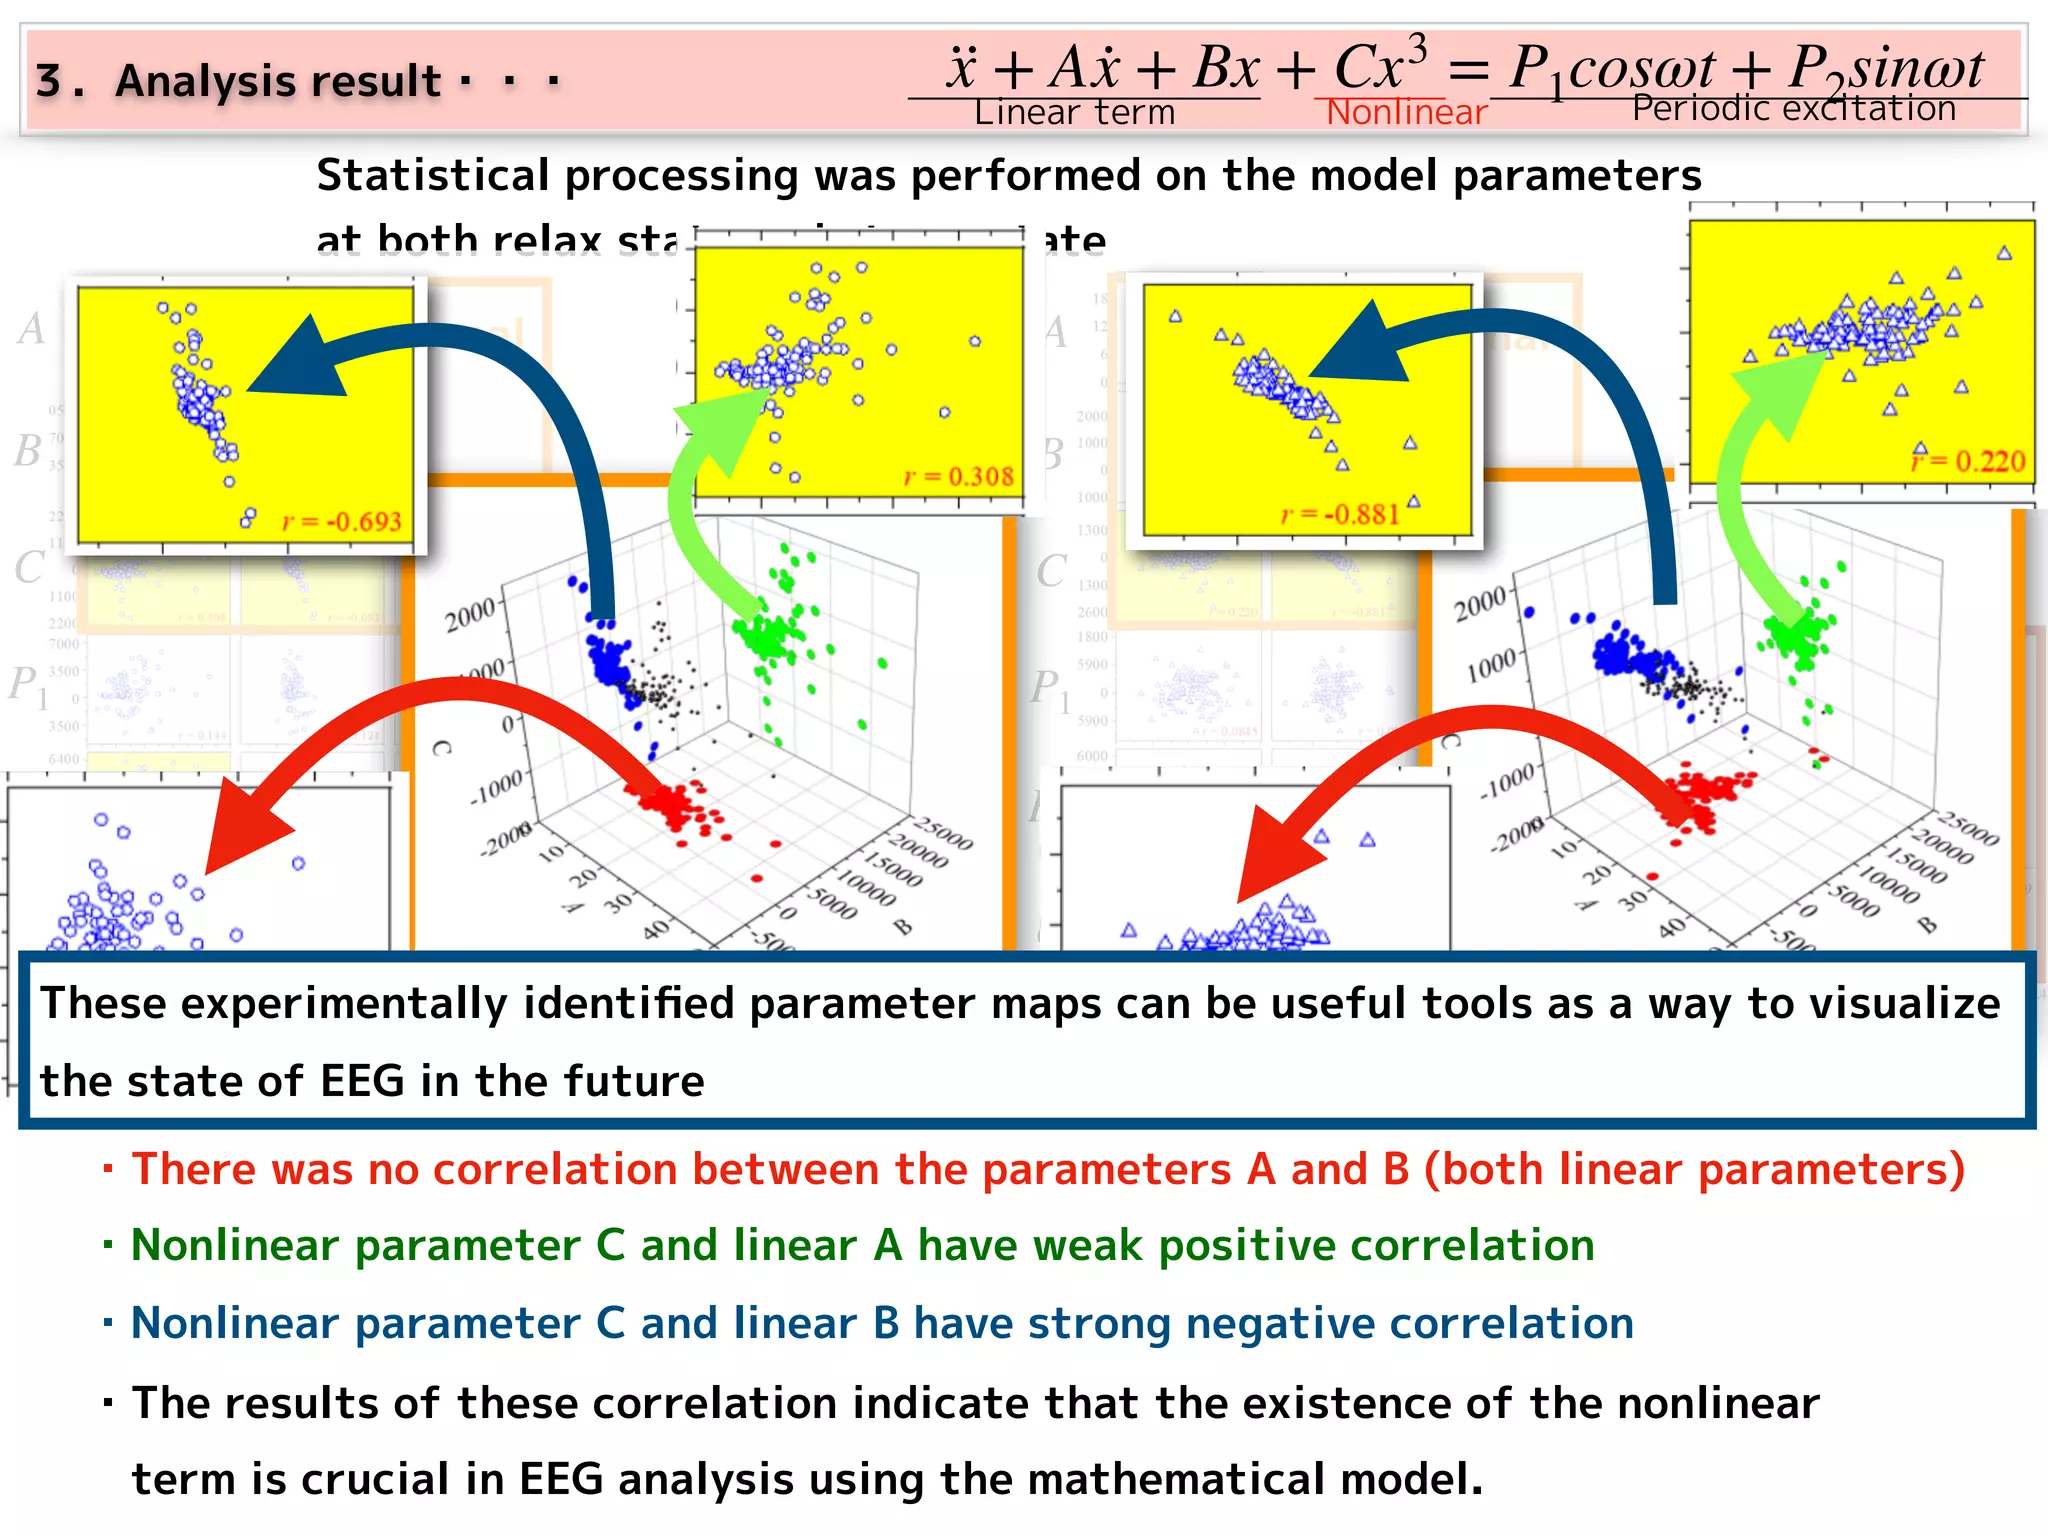
Findings on parameter relationships in stress vs. relaxed states, statistical processing results, and the importance of nonlinear parameters in EEG analysis.