Dimensional Modeling
Datamodeling for Data Warehouses
Based on
Fact tables
Dimension tables
F. Radulescu - Data warehousing - Dimensional modeling 2
3.
Fact Tables
Representa business process
Contain the measurements or metrics or facts of
business processes
monthly sales number in the Sales business process
most are additive (sales this month), some are semi-
F. Radulescu - Data warehousing - Dimensional modeling 3
most are additive (sales this month), some are semi-
additive (balance as of), some are not additive (unit
price)
the level of detail is called the “grain” of the table
contain foreign keys for the dimension tables
4.
Dimension Tables
Representthe who, what, where, when and how of a
measurement/artifact
Represent real-world entities not business processes
Give the context of a measurement (subject)
For example for the Sales fact table, the characteristics
of the 'monthly sales number' measurement can be a
F. Radulescu - Data warehousing - Dimensional modeling 4
of the 'monthly sales number' measurement can be a
Location (Where), Time (When), Product Sold (What).
The Dimension Attributes are the various columns in a
dimension table.
5.
Dimension Tables
Inthe Location dimension, the attributes can be Location
Code, State, Country, Zip code.
Generally the Dimension Attributes are used in report
labels, and query constraints such as where
Country='USA'. The dimension attributes also contain
one or more hierarchical relationships.
F. Radulescu - Data warehousing - Dimensional modeling 5
one or more hierarchical relationships.
Before designing your data warehouse, you need to
decide what this data warehouse contains. Say if you
want to build a data warehouse containing monthly sales
numbers across multiple store locations, across time and
across products then your dimensions are: Location,
Time and Product
6.
Star Schemas
Select themeasurements
SELECT P.Name, SUM(F.Sales) . . .
JOIN the FACT table with Dimensions
FROM Sales F, Time T, Product P,
Location L
WHERE F.TM_Dim_Id = T.Dim_Id
AND F.PR_Dim_Id = P.Dim_Id
F. Radulescu - Data warehousing - Dimensional modeling 6
AND F.PR_Dim_Id = P.Dim_Id
AND F.LOC_Dim_Id = L.Dim_Id
Constrain the Dimensions
AND T.Month='Jan' AND T.Year='2003' AND
L.Country_Name='USA'
‘Group by' for the aggregation level
GROUP BY P.Category
Advantages:
-easy to understand
-better performance
-extensible
7.
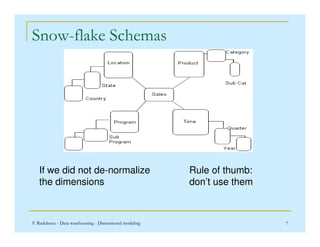
Snow-flake Schemas
F. Radulescu- Data warehousing - Dimensional modeling 7
If we did not de-normalize
the dimensions
Rule of thumb:
don’t use them
8.
Four-Step Dimensional DesignProcess
Objective: design of a dimensional database
by considering four steps in a particular order:
1. Select the business process to model
2. Declare the grain of the business process
F. Radulescu - Data warehousing - Dimensional modeling 8
3. Choose the dimensions that apply to each
fact table row.
4. Identify the numeric facts that will populate
each fact table row
(Presentation based on Ralph Kimball, Margy Ross - The Data Warehouse Toolkit,
Second Edition, Wiley Sons, 2002, pp.29-65)
9.
1. Select thebusiness process
A process is a natural business activity
performed in the organization
Typically is supported by a source data-
collection system.
Example business processes include:
F. Radulescu - Data warehousing - Dimensional modeling 9
Example business processes include:
raw materials purchasing,
orders,
shipments,
invoicing,
inventory,
general ledger
10.
1. Select thebusiness process – cont.
It is not an organizational business
department or function.
For example, we build a single dimensional
model to handle orders data rather than
building separate models for the sales and
F. Radulescu - Data warehousing - Dimensional modeling 10
building separate models for the sales and
marketing departments, which both want to
access orders data.
11.
1. Select thebusiness process – cont.
If we establish departmentally bound
dimensional models, we’ll inevitably duplicate
data with different labels and terminology.
Multiple data flows into separate dimensional
models will make us vulnerable to data
F. Radulescu - Data warehousing - Dimensional modeling 11
models will make us vulnerable to data
inconsistencies.
The best way to ensure consistency is to
publish the data once.
A single publishing reduces the extract-
transformation-load development effort
12.
2. Declare thegrain
Declaring the grain means specifying exactly
what an individual fact table row represents.
The grain conveys the level of detail
associated with the fact table measurements.
F. Radulescu - Data warehousing - Dimensional modeling 12
associated with the fact table measurements.
It provides the answer to the question, “How
do you describe a single row in the fact
table?”
13.
2. Declare thegrain – cont.
Example grain declarations include:
An individual line item on a customer’s retail
sales ticket as measured by a scanner device
A line item on a bill received from a doctor
F. Radulescu - Data warehousing - Dimensional modeling 13
A line item on a bill received from a doctor
An individual boarding pass to get on a flight
A daily snapshot of the inventory levels for
each product in a warehouse
A monthly snapshot for each bank account
14.
2. Declare thegrain – cont.
An inappropriate grain declaration will haunt
a data warehouse implementation.
Declaring the grain is a critical step that can’t
be taken lightly.
If in steps 3 or 4 we see that the grain
F. Radulescu - Data warehousing - Dimensional modeling 14
If in steps 3 or 4 we see that the grain
statement is wrong we must return to step 2,
redeclare the grain correctly, and revisit steps
3 and 4 again.
15.
3. Choose thedimensions
If we are clear about the grain, then the
dimensions typically can be identified quite
easily.
Represent all possible descriptions that take
on single values in the context of each
F. Radulescu - Data warehousing - Dimensional modeling 15
on single values in the context of each
measurement.
16.
3. Choose thedimensions – cont.
Examples of common dimensions include:
date,
product,
customer,
F. Radulescu - Data warehousing - Dimensional modeling 16
transaction type,
status.
17.
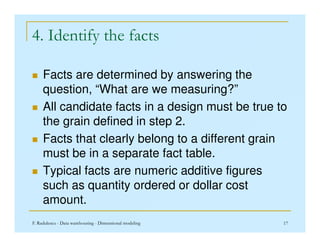
4. Identify thefacts
Facts are determined by answering the
question, “What are we measuring?”
All candidate facts in a design must be true to
the grain defined in step 2.
F. Radulescu - Data warehousing - Dimensional modeling 17
the grain defined in step 2.
Facts that clearly belong to a different grain
must be in a separate fact table.
Typical facts are numeric additive figures
such as quantity ordered or dollar cost
amount.
18.
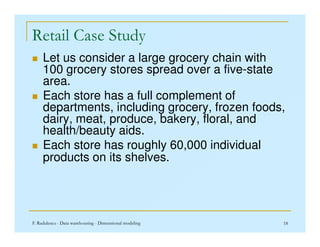
Retail Case Study
Let us consider a large grocery chain with
100 grocery stores spread over a five-state
area.
Each store has a full complement of
departments, including grocery, frozen foods,
dairy, meat, produce, bakery, floral, and
F. Radulescu - Data warehousing - Dimensional modeling 18
dairy, meat, produce, bakery, floral, and
health/beauty aids.
Each store has roughly 60,000 individual
products on its shelves.
19.
Retail Case Study
The individual products are called stock
keeping units (SKUs).
About 55,000 of the SKUs come from outside
manufacturers and have bar codes imprinted
on the product package. These bar codes are
called universal product codes (UPCs).
F. Radulescu - Data warehousing - Dimensional modeling 19
called universal product codes (UPCs).
UPCs are at the same grain as individual
SKUs.
Each different package variation of a product
has a separate UPC and hence is a separate
SKU.
20.
Retail Case Study
The remaining 5,000 SKUs come from
departments such as meat, produce, bakery,
or floral.
While these products don’t have nationally
recognized UPCs, the grocery chain assigns
SKU numbers to them.
F. Radulescu - Data warehousing - Dimensional modeling 20
SKU numbers to them.
Since our grocery chain is highly automated,
we stick scanner labels on many of the items
in these other departments.
21.
Retail Case Study
Although the bar codes are not UPCs, they
are certainly SKU numbers.
Data is collected at several places in a
grocery store. Some of the most useful data
is collected at the cash registers as
customers purchase products.
F. Radulescu - Data warehousing - Dimensional modeling 21
customers purchase products.
The POS system is at the front door of the
grocery store where consumer takeaway is
measured.
The back door, where vendors make
deliveries, is another interesting data-
collection point.
22.
Retail Case Study
Both store management and headquarters
marketing spend a great deal of time
tinkering with pricing and promotions.
Promotions in a grocery store include
F. Radulescu - Data warehousing - Dimensional modeling 22
Promotions in a grocery store include
temporary price reductions, ads in
newspapers and newspaper inserts, displays
in the grocery store (including end-aisle
displays), and coupons.
23.
Retail Case Study
The most direct and effective way to create a surge in the
volume of product sold is to lower the price dramatically.
A 50-cent reduction in the price of paper towels, especially
when coupled with an ad and display, can cause the sale of
the paper towels to jump by a factor of 10.
Unfortunately, such a big price reduction usually is not
sustainable because the towels probably are being sold at
F. Radulescu - Data warehousing - Dimensional modeling 23
sustainable because the towels probably are being sold at
a loss.
Based on this business case study, we’ll
begin to design the dimensional model.
24.
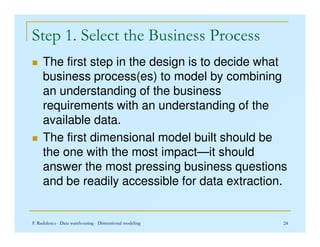
Step 1. Selectthe Business Process
The first step in the design is to decide what
business process(es) to model by combining
an understanding of the business
requirements with an understanding of the
available data.
F. Radulescu - Data warehousing - Dimensional modeling 24
available data.
The first dimensional model built should be
the one with the most impact—it should
answer the most pressing business questions
and be readily accessible for data extraction.
25.
Step 1. Selectthe Business Process
In retail case study, management wants to
better understand customer purchases as
captured by the POS system.
Thus the business process we’re going to
F. Radulescu - Data warehousing - Dimensional modeling 25
Thus the business process we’re going to
model is POS retail sales.
This data will allow us to analyze what
products are selling in which stores on what
days under what promotional conditions.
26.
Step 2. Declarethe Grain
Preferably you should develop dimensional
models for the most atomic information
captured by a business process.
Atomic data is the most detailed information
collected; such data cannot be subdivided
further.
F. Radulescu - Data warehousing - Dimensional modeling 26
further.
Atomic data is highly dimensional – so is a
perfect match for the dimensional approach.
The less granular model is vulnerable to
unexpected user requests to drill down into
the details.
27.
Step 2. Declarethe Grain
Aggregated summary data plays an important role
as a performance-tuning tool, but it is not a
substitute for giving users access to the lowest-level
details.
A data warehouse almost always demands data
expressed at the lowest possible grain of each
F. Radulescu - Data warehousing - Dimensional modeling 27
expressed at the lowest possible grain of each
dimension not because queries want to see
individual low-level rows, but because queries need
to cut through the details in very precise ways.
In our case study, the most granular data is an
individual line item on a POS transaction.
28.
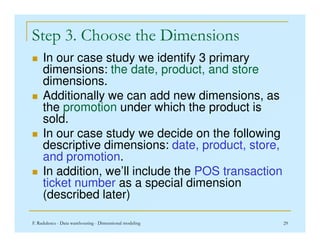
Step 3. Choosethe Dimensions
A careful grain statement determines the
primary dimensionality of the fact table.
It is then often possible to add more
dimensions to the basic grain of the fact
table, where these additional dimensions
naturally take on only one value under each
F. Radulescu - Data warehousing - Dimensional modeling 28
naturally take on only one value under each
combination of the primary dimensions.
If the additional dimension violates the grain
by causing additional fact rows to be
generated, then the grain statement must be
revised to accommodate this dimension.
29.
Step 3. Choosethe Dimensions
In our case study we identify 3 primary
dimensions: the date, product, and store
dimensions.
Additionally we can add new dimensions, as
the promotion under which the product is
sold.
F. Radulescu - Data warehousing - Dimensional modeling 29
sold.
In our case study we decide on the following
descriptive dimensions: date, product, store,
and promotion.
In addition, we’ll include the POS transaction
ticket number as a special dimension
(described later)
30.
Step 3. Choosethe Dimensions
POS Retail Sales
Transaction Fact
Date Key (FK)
Product Key (FK)
Store Key (FK)
Date Dimension
Date Key (PK)
Date Attributes TBD
Product Dimension
Product Key (PK)
Product Attributes TBD
F. Radulescu - Data warehousing - Dimensional modeling 30
TBD – To be determined
Store Key (FK)
Promotion Key (FK)
POS Transaction Number
Facts TBD
Store Dimension
Store Key (PK)
Store Attributes TBD
Promotion Dimension
Promotion Key (PK)
Promotion Attributes TBD
31.
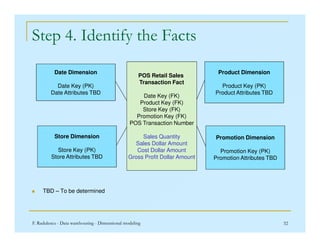
Step 4. Identifythe Facts
The facts must be true to the grain (in this
case the individual line item on the POS
transaction).
The facts collected by the POS system
include the sales quantity, per unit sales price
F. Radulescu - Data warehousing - Dimensional modeling 31
include the sales quantity, per unit sales price
and the sales dollar amount (=sales quantity
* unit price).
Some POS systems provide a standard dollar
cost for the product as delivered to the store
by the vendor.
32.
Step 4. Identifythe Facts
POS Retail Sales
Transaction Fact
Date Key (FK)
Product Key (FK)
Store Key (FK)
Promotion Key (FK)
POS Transaction Number
Date Dimension
Date Key (PK)
Date Attributes TBD
Product Dimension
Product Key (PK)
Product Attributes TBD
F. Radulescu - Data warehousing - Dimensional modeling 32
TBD – To be determined
POS Transaction Number
Sales Quantity
Sales Dollar Amount
Cost Dollar Amount
Gross Profit Dollar Amount
Store Dimension
Store Key (PK)
Store Attributes TBD
Promotion Dimension
Promotion Key (PK)
Promotion Attributes TBD
33.
Step 4. Identifythe Facts
The gross profit is obtained by subtracting the cost
dollar amount from the sales dollar amount.
All these facts (sales quantity, sales dollar amount,
cost dollar amount and gross profit dollar amount) are
additive across all the dimensions.
Percentages and ratios, such as gross margin, are
nonadditive (gross margin = gross profit / dollar
F. Radulescu - Data warehousing - Dimensional modeling 33
nonadditive (gross margin = gross profit / dollar
revenue)
The numerator and denominator should be stored in
the fact table.
The ratio can be calculated in a data access tool for
any slice of the fact table by remembering to calculate
the ratio of the sums, not the sum of the ratios.
Unit price is also a nonadditive fact (is a ratio)
34.
Dimension Table Attributes
The date dimension is the one dimension
nearly guaranteed to be in every data mart
because virtually every data mart is a time
series.
The time-of-day dimension is different from
F. Radulescu - Data warehousing - Dimensional modeling 34
The time-of-day dimension is different from
the date dimension.
35.
Date dimension: Partiallist of columns
Date Key (PK)
Date
Full Date Description
Day of Week
Day Number in Epoch
Week Number in Epoch
Month Number in Epoch
Day Number in Calendar Month
Day Number in Calendar Year
Calendar Quarter
Calendar Year-Quarter
Calendar Half Year
Calendar Year
Fiscal Week
Fiscal Week Number in Year
Fiscal Month
Fiscal Month Number in Year
Fiscal Year-Month
F. Radulescu - Data warehousing - Dimensional modeling 35
Day Number in Calendar Year
Day Number in Fiscal Month
Day Number in Fiscal Year
Last Day in Week Indicator
Last Day in Month Indicator
Calendar Week Ending Date
Calendar Week Number in Year
Calendar Month Name
Calendar Month Number in Year
Calendar Year-Month (YYYY-MM)
Fiscal Year-Month
Fiscal Quarter
Fiscal Year-Quarter
Fiscal Half Year
Fiscal Year
Holiday Indicator
Weekday Indicator
Selling Season
Major Event
SQL Date Stamp
36.
Date dimension –cont.
The holiday indicator takes on the values of Holiday
or Non-holiday.
Weekday indicator have a value of Weekday or
Weekend.
The selling season column is set to the name of the
retailing season, if any. Examples in the United
F. Radulescu - Data warehousing - Dimensional modeling 36
retailing season, if any. Examples in the United
States could include Christmas, Thanksgiving,
Easter, Valentine’s Day, Fourth of July, or None.
The major event column is similar to the season
column and can be used to mark special outside
events such as Super Bowl Sunday or Labor Strike.
37.
Date dimension –cont.
Data warehouses always need an explicit date
dimension table.
There are many date attributes not supported by the
SQL date function, including fiscal periods, seasons,
holidays, and weekends.
Rather than attempting to determine these
F. Radulescu - Data warehousing - Dimensional modeling 37
Rather than attempting to determine these
nonstandard calendar calculations in a query, we
should look them up in a date dimension table.
Date and time are almost completely independent.
If we combined the two dimensions, the date
dimension would grow significantly.
38.
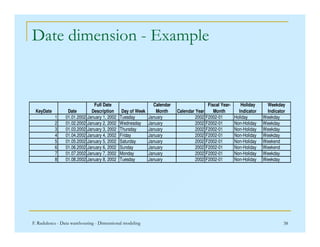
Date dimension -Example
KeyDate Date
Full Date
Description Day of Week
Calendar
Month Calendar Year
Fiscal Year-
Month
Holiday
Indicator
Weekday
Indicator
1 01.01.2002 January 1, 2002 Tuesday January 2002 F2002-01 Holiday Weekday
2 01.02.2002 January 2, 2002 Wednesday January 2002 F2002-01 Non-Holiday Weekday
F. Radulescu - Data warehousing - Dimensional modeling 38
2 01.02.2002 January 2, 2002 Wednesday January 2002 F2002-01 Non-Holiday Weekday
3 01.03.2002 January 3, 2002 Thursday January 2002 F2002-01 Non-Holiday Weekday
4 01.04.2002 January 4, 2002 Friday January 2002 F2002-01 Non-Holiday Weekday
5 01.05.2002 January 5, 2002 Saturday January 2002 F2002-01 Non-Holiday Weekend
6 01.06.2002 January 6, 2002 Sunday January 2002 F2002-01 Non-Holiday Weekend
7 01.07.2002 January 7, 2002 Monday January 2002 F2002-01 Non-Holiday Weekday
8 01.08.2002 January 8, 2002 Tuesday January 2002 F2002-01 Non-Holiday Weekday
39.
Product Dimension
Theproduct dimension describes every SKU in the
grocery store.
A typical store in the chain may stock 60,000 SKUs,
but when we account for different merchandising
schemes across the chain and historical products
that are no longer available, the product dimension
F. Radulescu - Data warehousing - Dimensional modeling 39
that are no longer available, the product dimension
would have at least 150,000 rows and perhaps as
many as a million rows.
The product dimension is almost always sourced
from the operational product master file.
40.
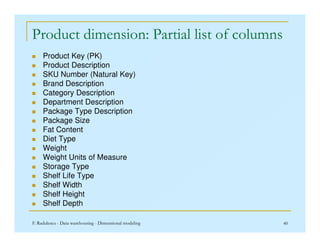
Product dimension: Partiallist of columns
Product Key (PK)
Product Description
SKU Number (Natural Key)
Brand Description
Category Description
Department Description
Package Type Description
Package Size
F. Radulescu - Data warehousing - Dimensional modeling 40
Package Size
Fat Content
Diet Type
Weight
Weight Units of Measure
Storage Type
Shelf Life Type
Shelf Width
Shelf Height
Shelf Depth
Product dimension –cont.
A reasonable product dimension table would
have 50 or more descriptive attributes.
Each attribute is a rich source for constraining
and constructing row headers.
Viewed in this manner, we see that drilling down
is nothing more than asking for a row header
that provides more information.
F. Radulescu - Data warehousing - Dimensional modeling 42
that provides more information.
Drilling down in a data mart is nothing more than
adding row headers from the dimension tables.
Drilling up is removing row headers.
We can drill down or up on attributes from more
than one explicit hierarchy and with attributes
that are part of no hierarchy.
43.
Store Dimension
Thestore dimension describes every store in our grocery
chain.
The store dimension is the primary geographic dimension
in our case study.
Each store can be thought of as a location. Because of this,
we can roll stores up to any geographic attribute, such as
ZIP code, county, and state in the United States.
F. Radulescu - Data warehousing - Dimensional modeling 43
Stores usually also roll up to store districts and regions.
These two different hierarchies are both easily represented
in the store dimension because both the geographic and
store regional hierarchies are well defined for a single store
row.
It is not uncommon to represent multiple hierarchies in a
dimension table. Ideally, the attribute names and values
should be unique across the multiple hierarchies.
44.
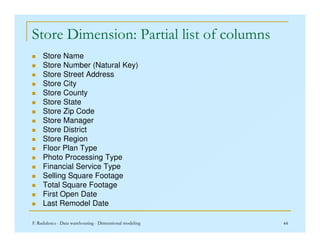
Store Dimension: Partiallist of columns
Store Name
Store Number (Natural Key)
Store Street Address
Store City
Store County
Store State
Store Zip Code
Store Manager
F. Radulescu - Data warehousing - Dimensional modeling 44
Store Manager
Store District
Store Region
Floor Plan Type
Photo Processing Type
Financial Service Type
Selling Square Footage
Total Square Footage
First Open Date
Last Remodel Date
45.
Promotion Dimension
Thepromotion dimension describes the
promotion conditions under which a product
was sold.
Promotion conditions include temporary price
reductions, end-aisle displays, newspaper
F. Radulescu - Data warehousing - Dimensional modeling 45
reductions, end-aisle displays, newspaper
ads, and coupons.
This dimension is often called a causal
dimension (as opposed to a casual
dimension) because it describes factors
thought to cause a change in product sales.
46.
Promotion Dimension -columns
Promotion Key (PK)
Promotion Name
Price Reduction Type
Promotion Media Type
Ad Type
Display Type
F. Radulescu - Data warehousing - Dimensional modeling 46
Display Type
Coupon Type
Ad Media Name
Display Provider
Promotion Cost
Promotion Begin Date
Promotion End Date ...........
47.
Transaction Number: Degenerate
Dimension
Operational control numbers such as order
numbers, invoice numbers, and bill-oflading
numbers usually give rise to empty
dimensions and are represented as
degenerate dimensions (that is, dimension
F. Radulescu - Data warehousing - Dimensional modeling 47
degenerate dimensions (that is, dimension
keys without corresponding dimension tables)
in fact tables where the grain of the table is
the document itself or a line item in the
document.
48.
Bibliography
1. W.H. Inmon- Building The Data Warehouse. Third
Edition, Wiley Sons, 2002
2. Ralph Kimball, Margy Ross - The Data Warehouse
Toolkit, Second Edition, Wiley Sons, 2002
3. Dimitra Vista, CS 680 Course notes
4. Wikipedia – Pages on Data Warehouse, etc.
F. Radulescu - Data warehousing - Dimensional modeling 48
4. Wikipedia – Pages on Data Warehouse, etc.
5. http://searchsqlserver.techtarget.com/
6. Vincent Rainardi, Building a Data Warehouse with
Examples in SQL Server, Springer, 2008


![[DSC Europe 25] Elena Menshikova - AI-Powered Operational Excellence: Revolut...](https://cdn.slidesharecdn.com/ss_thumbnails/es6nholbqy3zaao2c2yd-2-elena-menshikova-data-ai-in-decision-making-260115093812-4fba8b38-thumbnail.jpg?width=640&height=640&fit=bounds)


![[DSC Europe 25] Stefan Brankovic - #ResumeIsDead. AI-Powered Interviews and C...](https://cdn.slidesharecdn.com/ss_thumbnails/qnmbsv0xq3uysdrq3sev-2-stefan-brankovic-job-bolt-260114111931-a065aa3d-thumbnail.jpg?width=640&height=640&fit=bounds)


![[DSC Europe 25] Ivica Milaric - The Future of Gaming and AI Tools.pptx](https://cdn.slidesharecdn.com/ss_thumbnails/tijgzsmgse2kj2y5pzzp-5-ivica-milaric-the-future-of-gaming-x-ai-tools-260114111931-87c2b3ac-thumbnail.jpg?width=640&height=640&fit=bounds)
![[DSC Europe 25] Dragan Jerosimovic - The Anatomy of a Narrative Simulation.pdf](https://cdn.slidesharecdn.com/ss_thumbnails/vzputuprdqr6zwbrwdcw-1-dragan-jerosimovic-the-anatomy-of-a-narrative-simulation-260114111931-9d04fba2-thumbnail.jpg?width=640&height=640&fit=bounds)


![[DSC Europe 25] Nikola Vasiljevic - Player segmentation by combat playstyles ...](https://cdn.slidesharecdn.com/ss_thumbnails/mnvbf0yvrwaqsipzrrv3-2-nikola-vasiljevic-player-segmentation-by-playstyles-in-action-shooter-games-260114111931-b4d766cd-thumbnail.jpg?width=640&height=640&fit=bounds)


