Download to read offline
![Native Inspect - HelpNative Inspect - Help
help [<topic>]
(eInspect 2,372):help
Native Inspect help
The following are major topics from which you can
choose:
all -- List all Native Inspect commands.
help -- Help on help
source -- Source in a Tcl script file.
target process -- Commands that support process
debugging.
target snapshot -- Commands that support snapshot
analysis.
Type "help" followed by the keyword of the topic or
Native Inspect command you want to browse.
4 - Debuggers 13](https://image.slidesharecdn.com/mod04debuggers-130509072849-phpapp02/75/Mod04-debuggers-13-2048.jpg)
![Native Inspect – BreakpointsNative Inspect – Breakpoints
◦ Setting:
break {function | paragraph | [source-file:]line#} [if cond-exp]
(eInspect 2,372):break get_second_number
Breakpoint 2 at 0x70000ba0:1: file DAGGER.$DATA00.TERRYG.CALLC,
line 6.
(eInspect 2,372):b callc:8 if second_number== 99
Breakpoint 3 at 0x70000bf0:1: file DAGGER.$DATA00.TERRYG.CALLC,
line 8.
◦ Displaying:
info break
(eInspect 2,372):info b
Num Type Disp Enb Glb Address What
2 breakpoint keep y n 0x70000ba1 in get_second_number
at DAGGER.$DATA00.TERRYG.CALLC:6 breakpoint already hit 1 time
3 breakpoint keep y n 0x70000bf1 in get_second_number
at DAGGER.$DATA00.TERRYG.CALLC:8 stop only if second_number == 99
◦ Clearing:
delete [breakpoint#] - Deletes all breakpoints if no number given
4 - Debuggers 14](https://image.slidesharecdn.com/mod04debuggers-130509072849-phpapp02/75/Mod04-debuggers-14-2048.jpg)
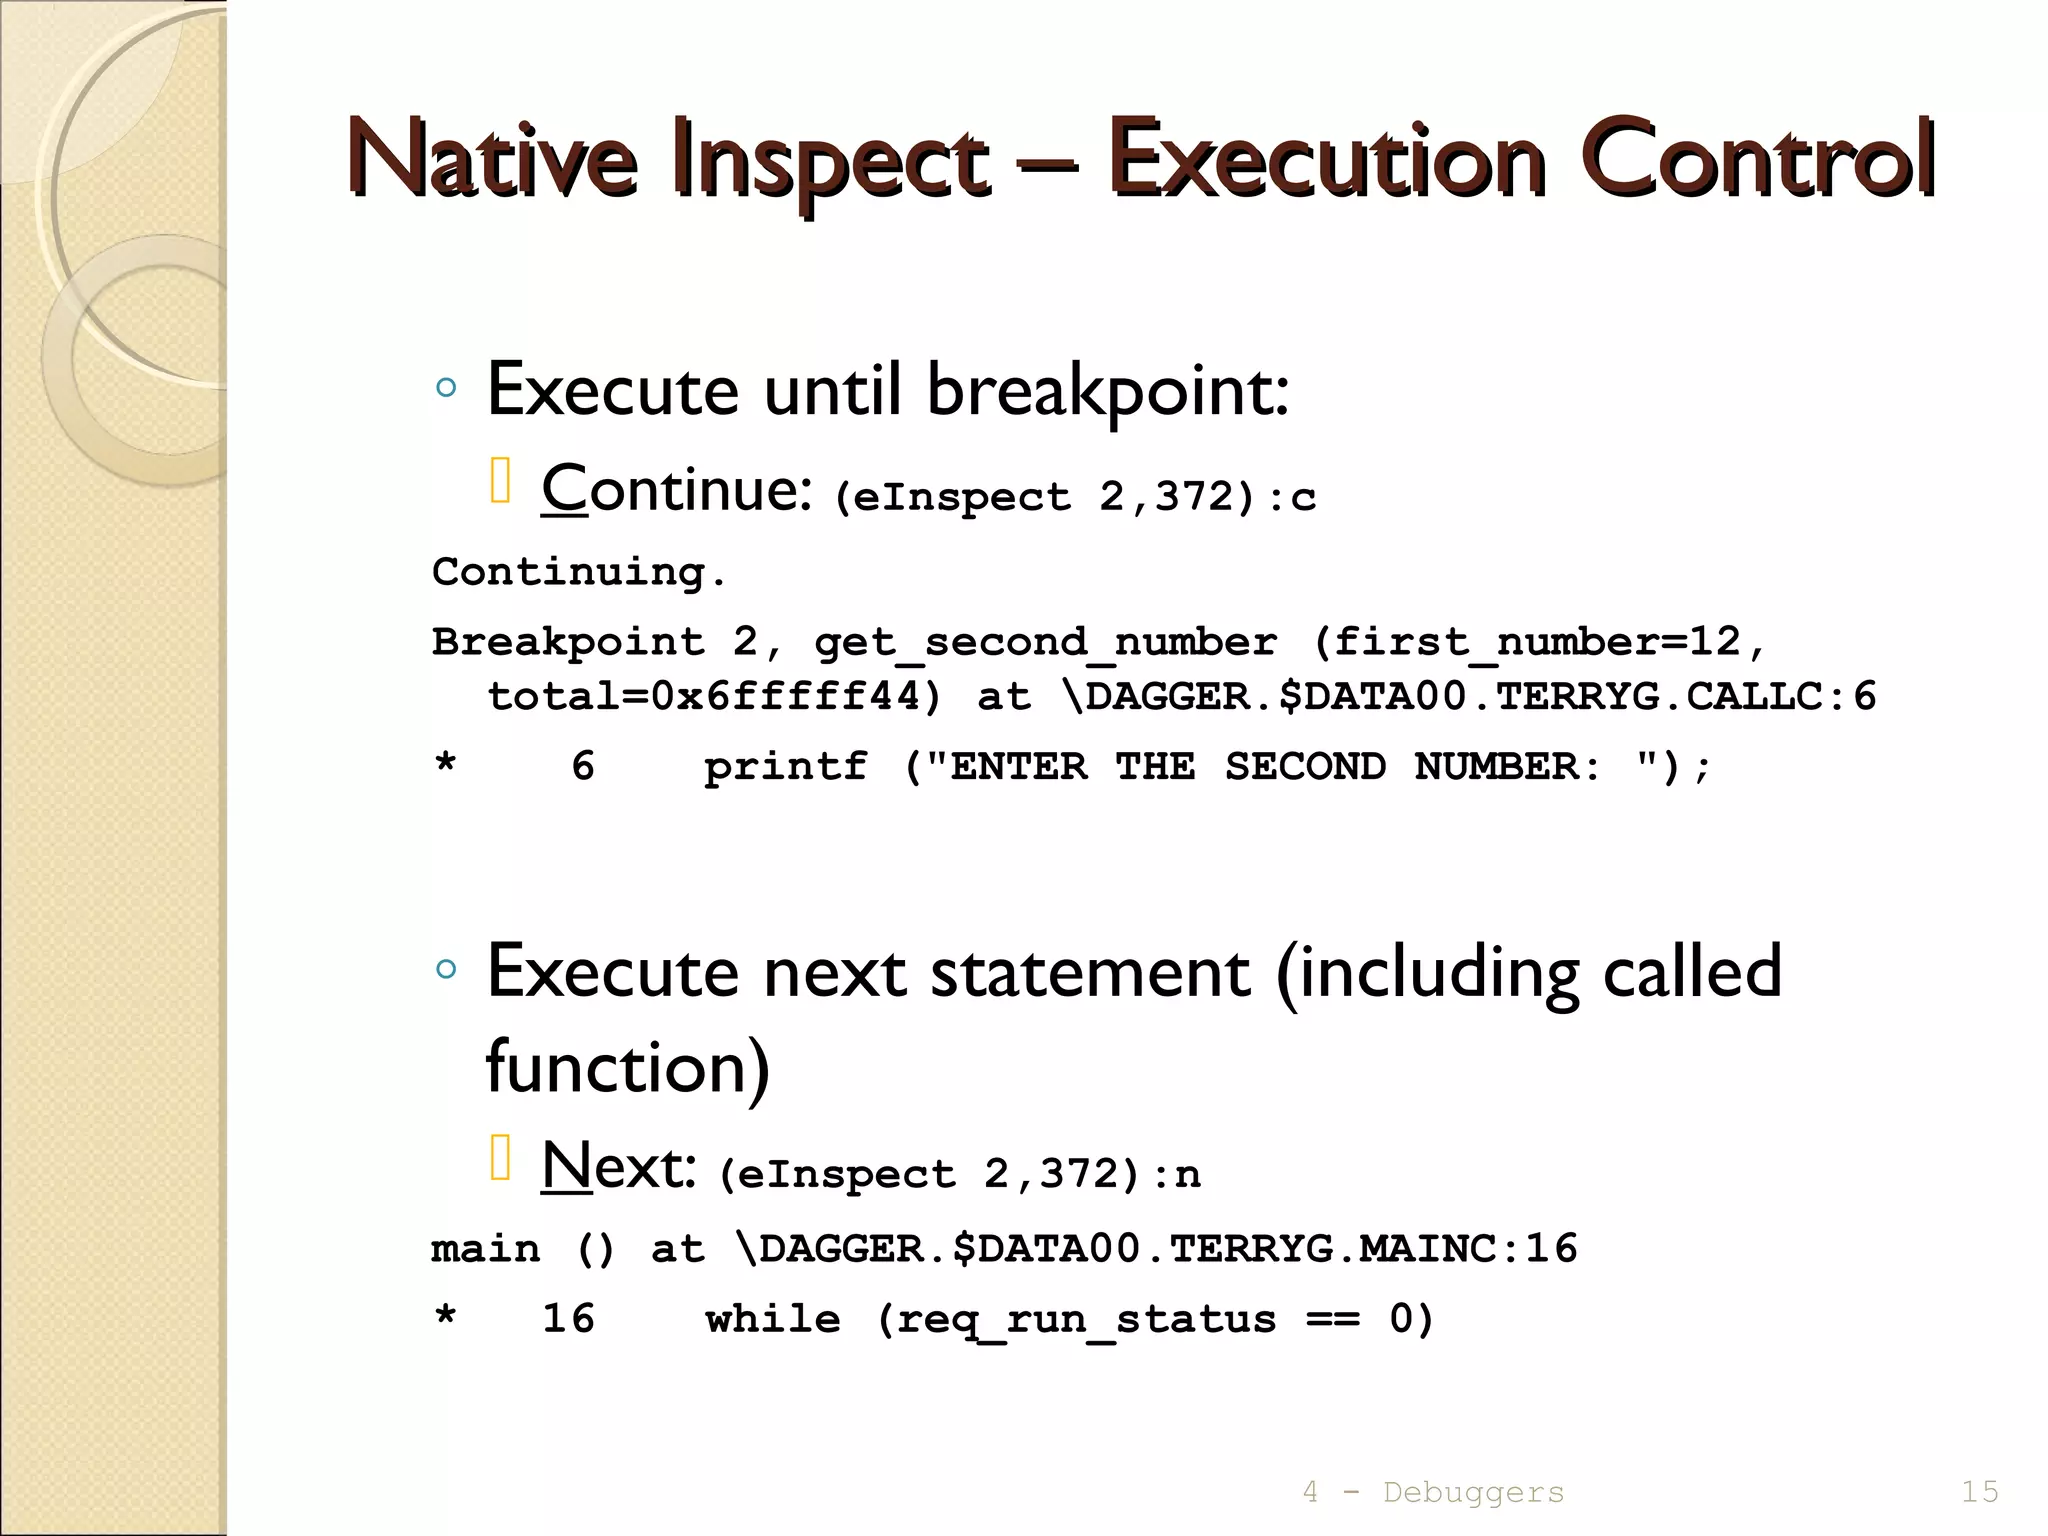
![Native Inspect – Execution ControlNative Inspect – Execution Control
◦ Execute to a specified location:
until function | paragraph | [source-file:]line#
◦ Execute the remainder of a function (stop on
return to calling function):
fin[ish]
(eInspect 2,372):finish
Run till exit from #0 get_second_number (first_number=12,
total=0x6fffff44)
at DAGGER.$DATA00.TERRYG.CALLC:6
ENTER THE SECOND NUMBER: 34
THE NUMBERS ENTERED WERE: 12 & 34
0x70000af0:0 in main () at DAGGER.$DATA00.TERRYG.MAINC:24
* 24 get_second_number (first_number, &total);
Value returned is $1 = 34
4 - Debuggers 16](https://image.slidesharecdn.com/mod04debuggers-130509072849-phpapp02/75/Mod04-debuggers-16-2048.jpg)
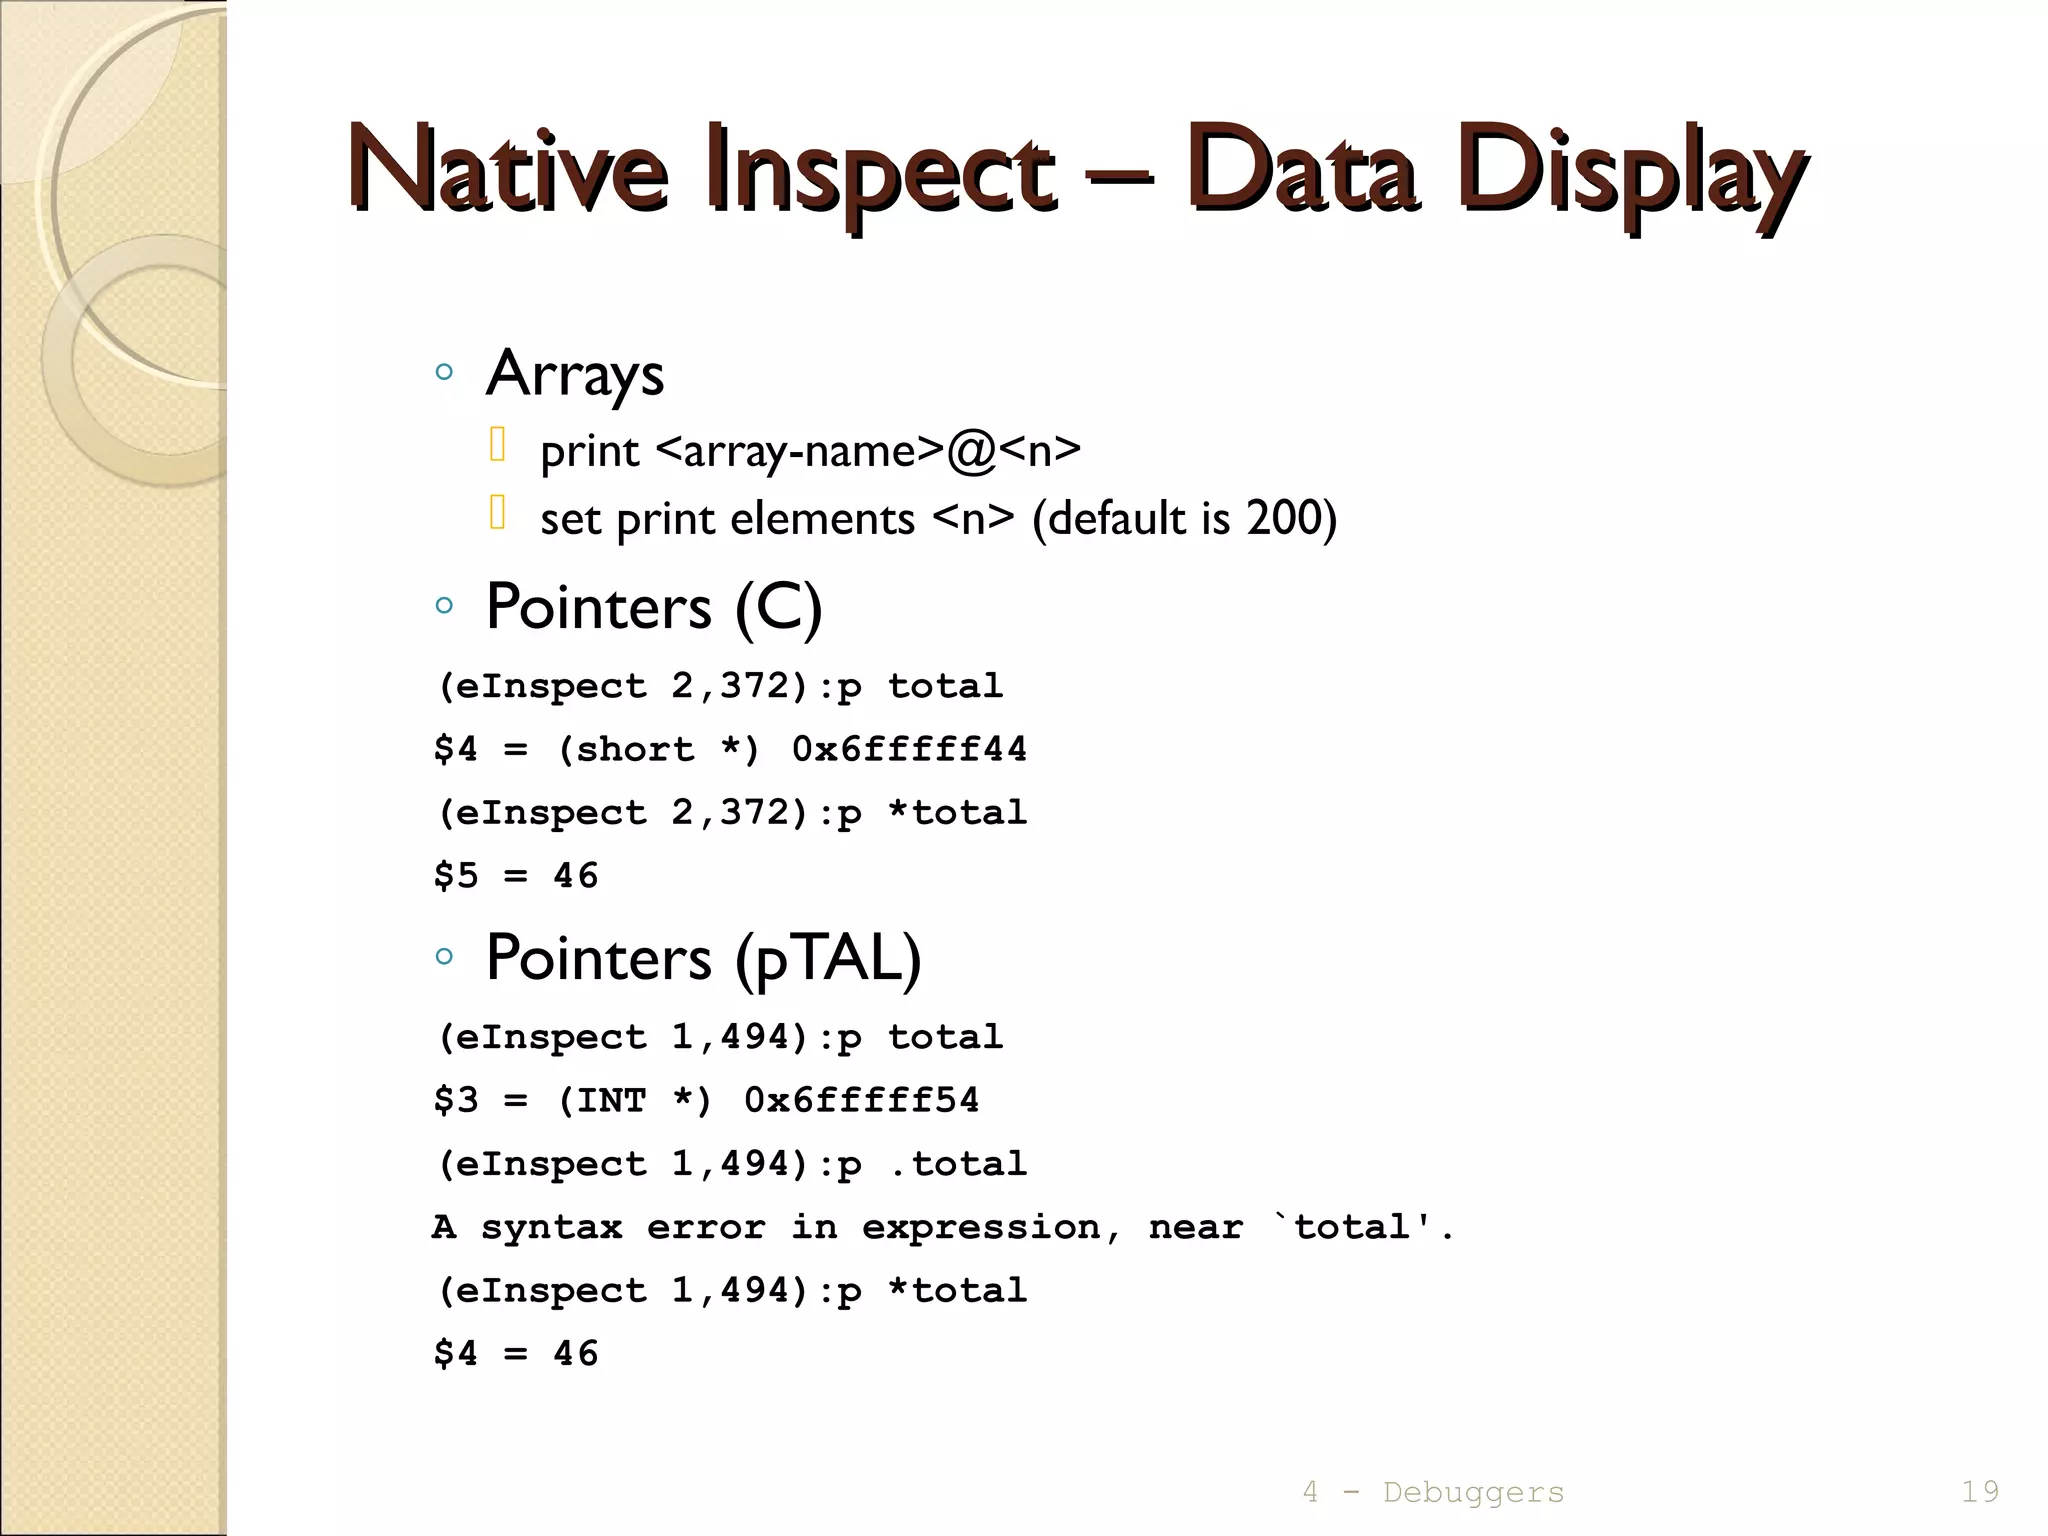
![Native Inspect – Data DisplayNative Inspect – Data Display
◦ Local variables orWorking Storage
info locals
(eInspect 2,372):info locals
req_run_status = 0
first_number = 12
total = 46
(eInspect 0,779):info locals
REQ-RUN-STATUS = 0
warning: Invalid or Uninitialized zoned decimal value: FIRST-NUMBER = 000
◦ Other variables
print [/format-letter] <variable-name > | <condition-name>
format-letter is o(octal), x(hex), d(decimal), u(unsigned decimal),
t(binary), f(float), a(address), i(instruction), c(char) and s(string).
(eInspect 2,372):p total
$2 = 46
(eInspect 2,372):p /x total
$3 = 0x2e
4 - Debuggers 18](https://image.slidesharecdn.com/mod04debuggers-130509072849-phpapp02/75/Mod04-debuggers-18-2048.jpg)
![Native Inspect – Data ModificationNative Inspect – Data Modification
◦ Modifying variable or pointer
set [variable] <variable-name>=<new-value>
(eInspect 2,372):set *total=999
4 - Debuggers 21](https://image.slidesharecdn.com/mod04debuggers-130509072849-phpapp02/75/Mod04-debuggers-21-2048.jpg)
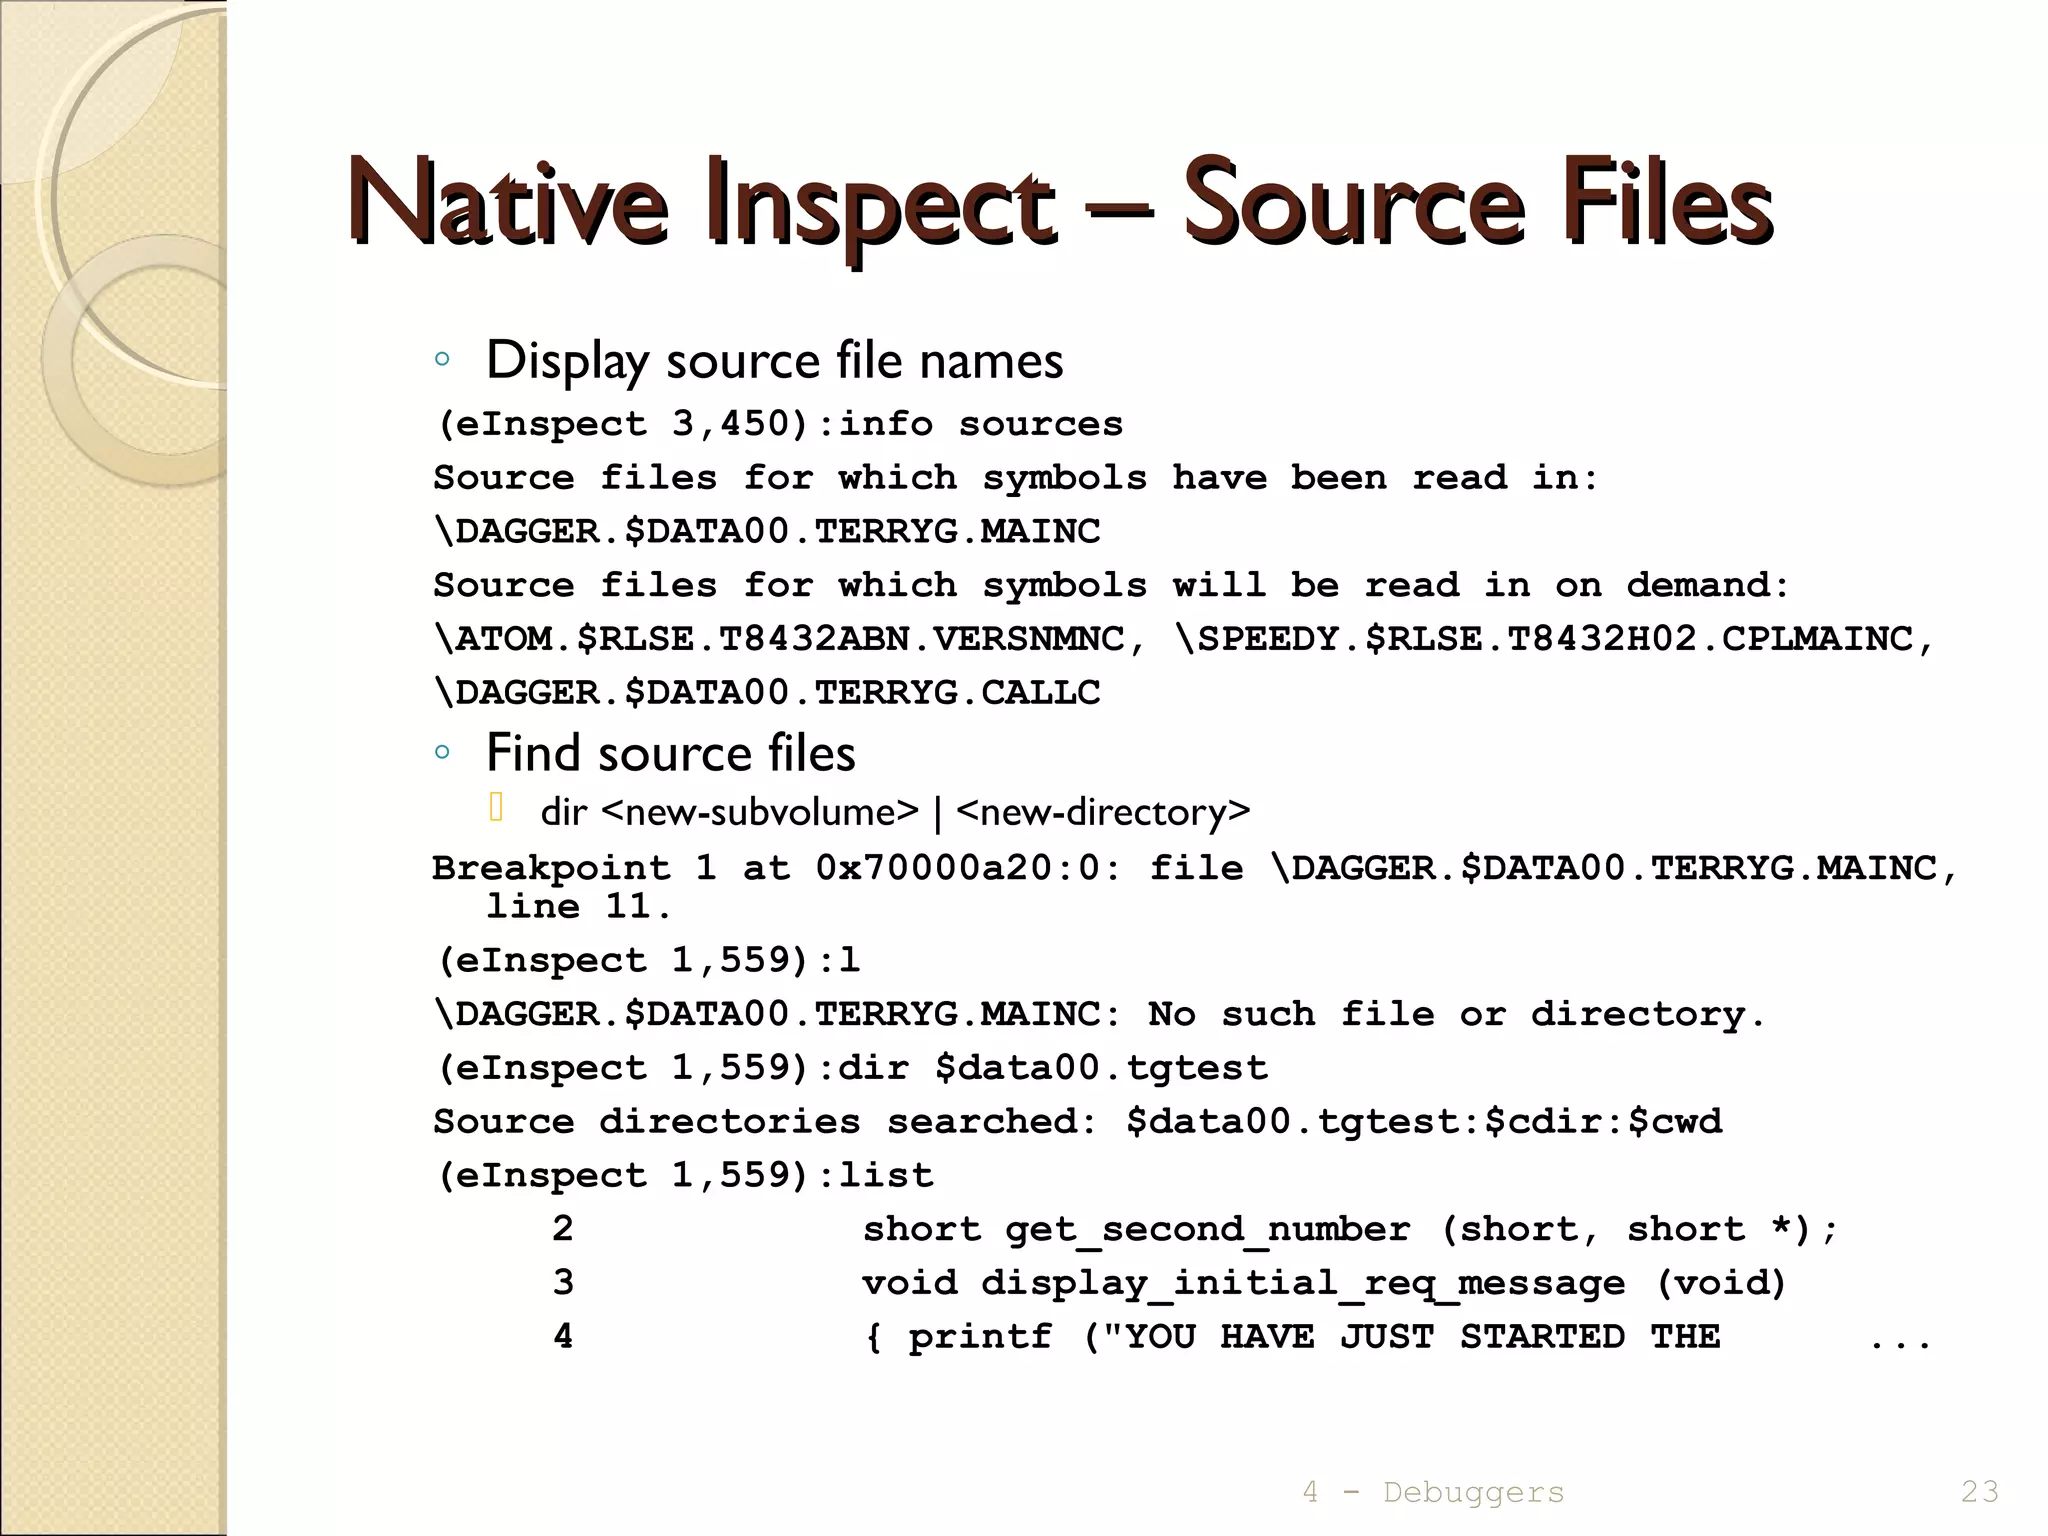
![Native Inspect – Source Statements DisplayNative Inspect – Source Statements Display
◦ list [ [<source-file>:]line#
| [<source-file>:]function ]
eInspect 2,372):l
15 display_initial_req_message ();
16 while (req_run_status == 0)
17 {
18 printf ("ENTER FIRST NUMBER [or 0 to stop]: ");
19 scanf ("%hi", &first_number);
* 20 if (first_number == 0)
21 req_run_status = 1;
22 else
23 {
24 get_second_number (first_number, &total);
(eInspect 2,372):l
25 printf ("THE TOTAL IS: %hin", total);
26 }
27 } /* end while */
28 } /* end main */
4 - Debuggers 22](https://image.slidesharecdn.com/mod04debuggers-130509072849-phpapp02/75/Mod04-debuggers-22-2048.jpg)
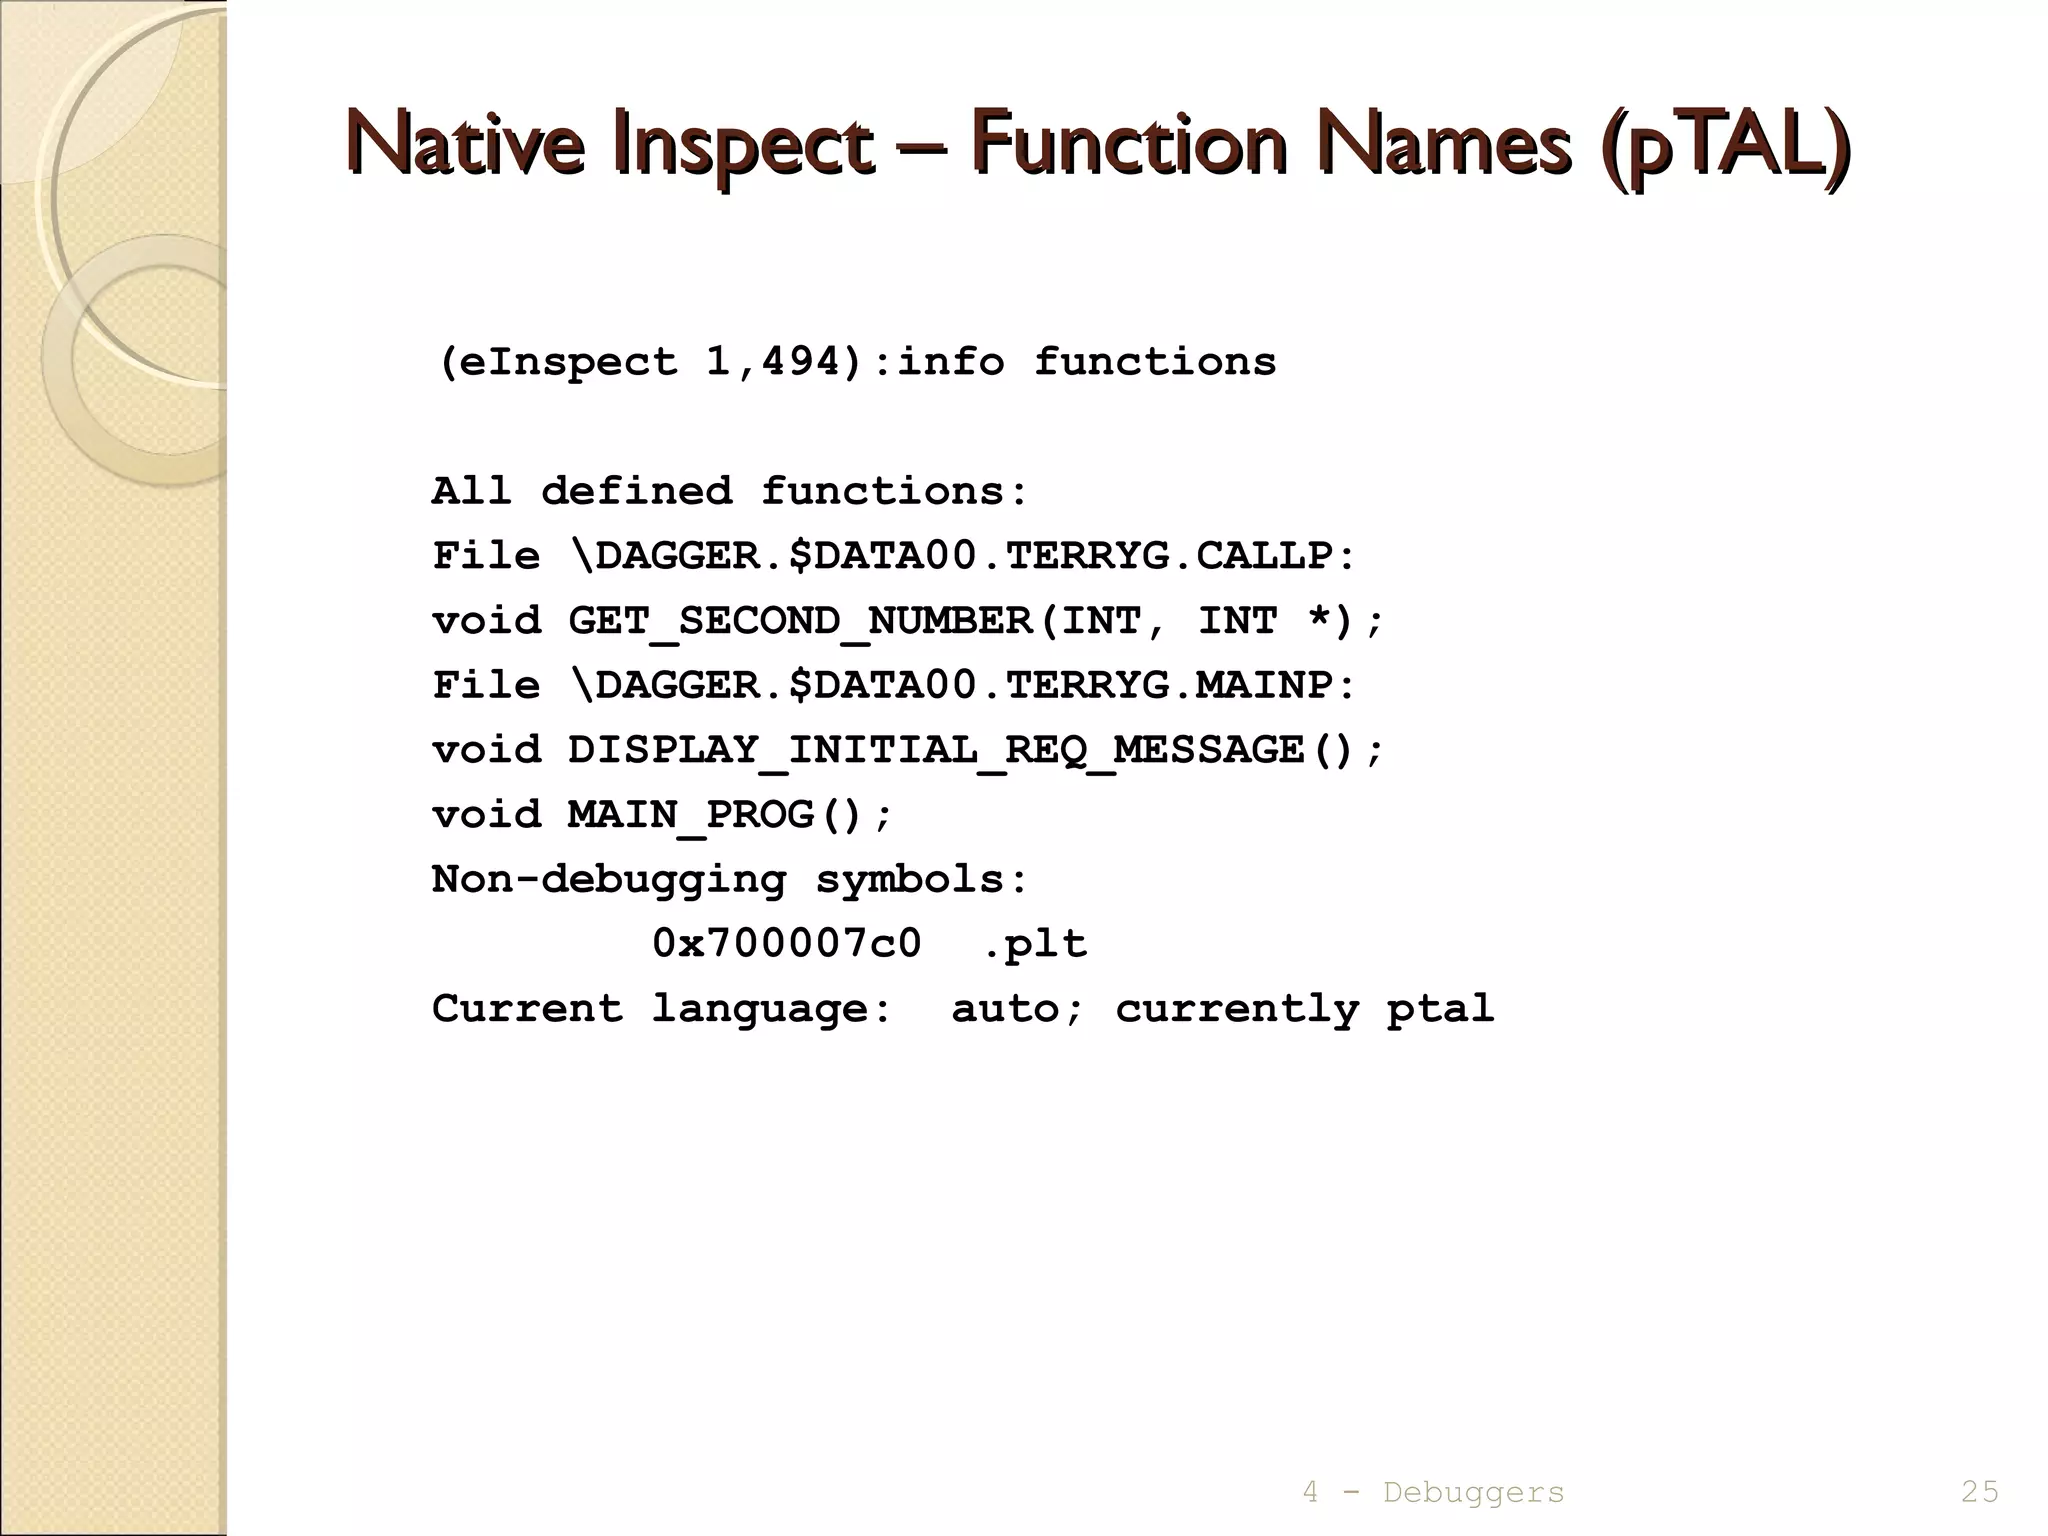
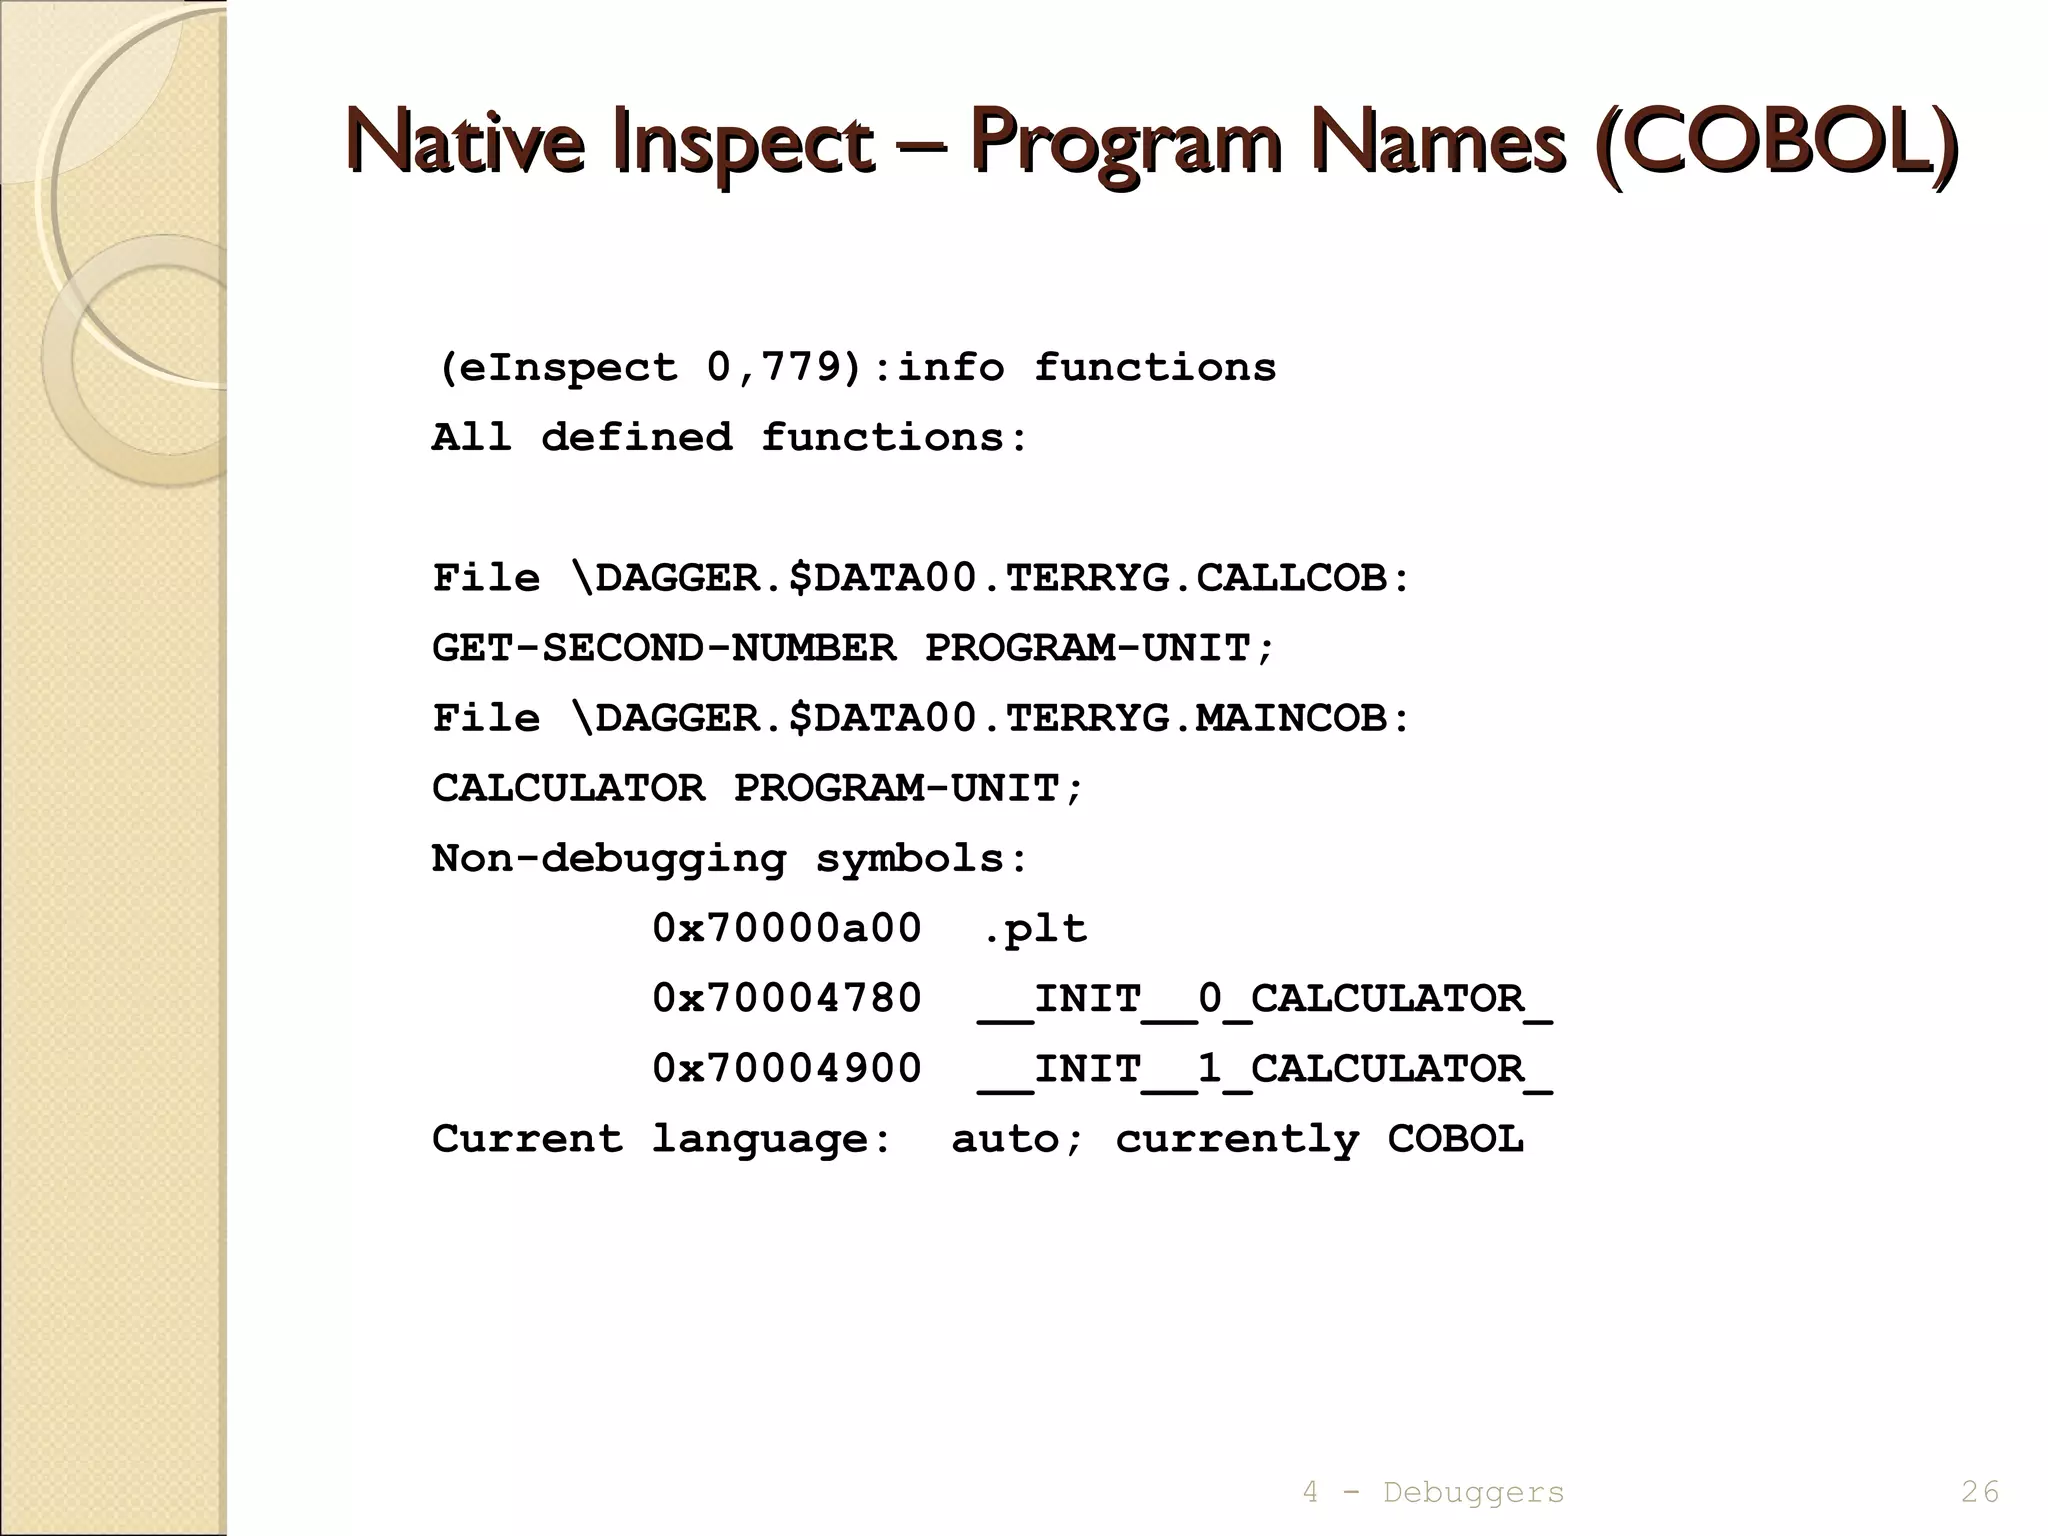
![Native Inspect – Function Names (C)Native Inspect – Function Names (C)
◦ info functions [<wildcard-string>]
(eInspect 12,372):info functions
All defined functions:
File ATOM.$RLSE.T8432ABN.VERSNMNC:
void T8432H02_21MAY2008_CCPLMAIN();
File SPEEDY.$RLSE.T8432H02.CPLMAINC:
void _MAIN();
void __INIT__1_C();
File DAGGER.$DATA00.TERRYG.CALLC:
short get_second_number(short, short *);
File DAGGER.$DATA00.TERRYG.MAINC:
void display_initial_req_message();
int main();
Non-debugging symbols:
0x700008e0 .plt
4 - Debuggers 24](https://image.slidesharecdn.com/mod04debuggers-130509072849-phpapp02/75/Mod04-debuggers-24-2048.jpg)
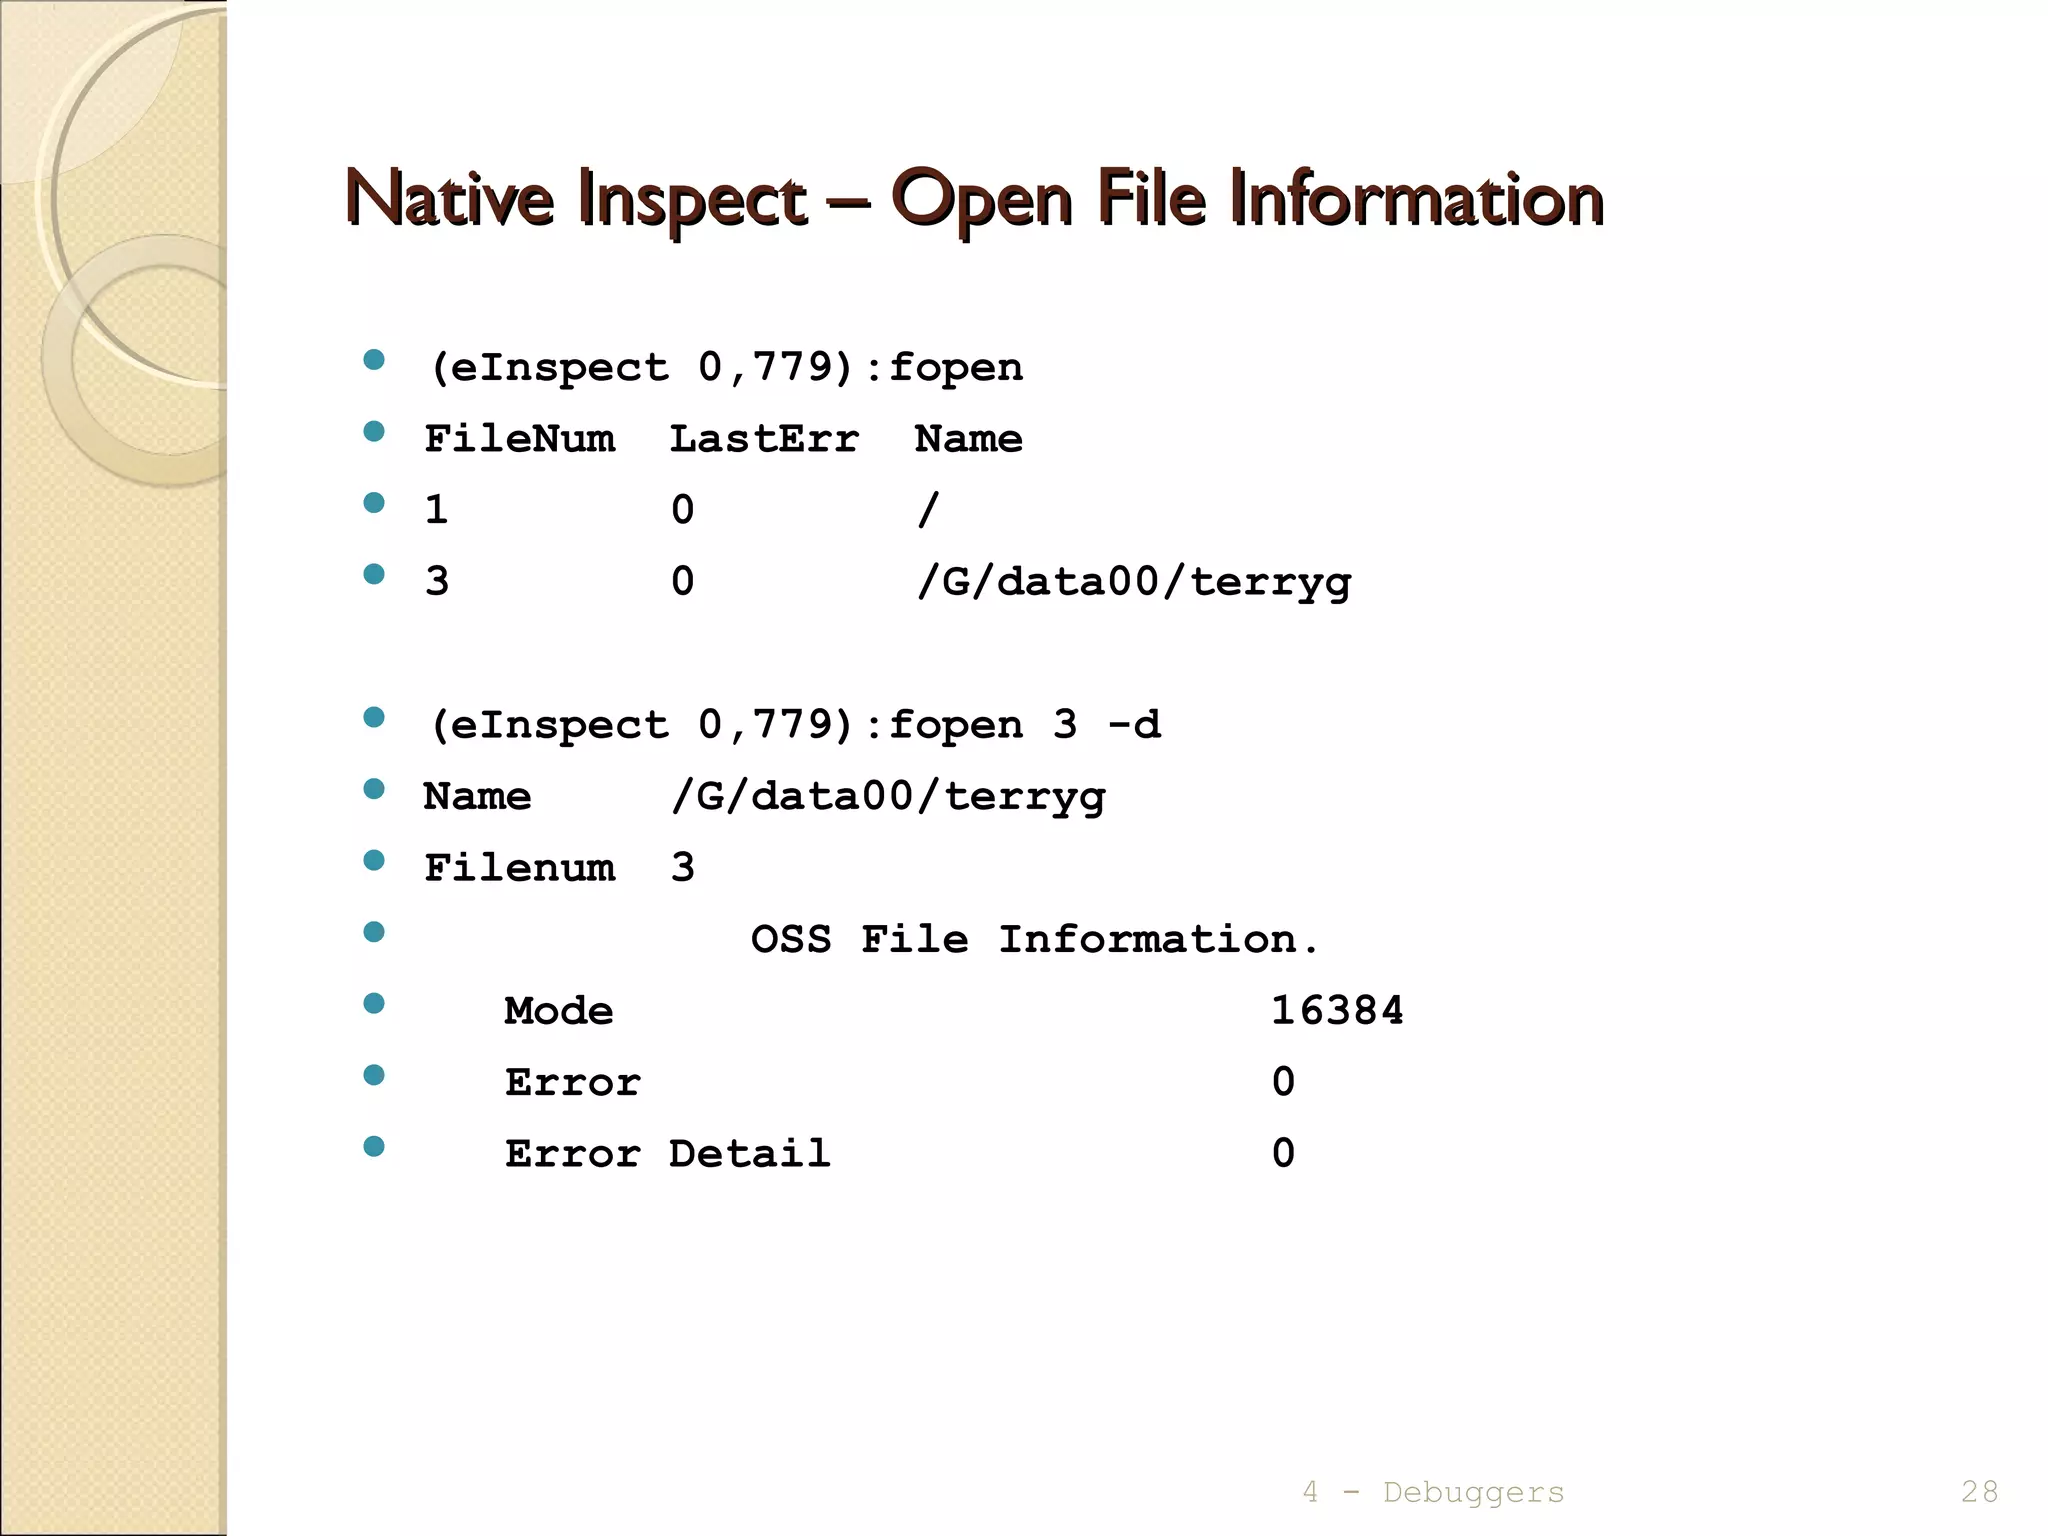
![Native Inspect – Open File InformationNative Inspect – Open File Information
fopen [<filenum> [-d] ]
(eInspect 2,372):fopen
FileNum LastErr Name
1 0 DAGGER.$ZTN0.#PTWNEAK
(eInspect 2,372):fopen 1 -d
Name DAGGER.$ZTN0.#PTWNEAK
Filenum 1
General File Information.
Device Type 0
Device Subtype 30
Object Type -1
Logical Device Number -1
Open Access 0
Open Exclusion 0
Open Nowait Depth 0
Open Sync Depth 1
Open Options 0
Physical Record Length 132 Bytes
Outstanding Requests 0
Error 0
Error Detail 0
4 - Debuggers 27](https://image.slidesharecdn.com/mod04debuggers-130509072849-phpapp02/75/Mod04-debuggers-27-2048.jpg)
![Miscellaneous CommandsMiscellaneous Commands
◦ Change to a different debugger
switch
ChangesTNS/E process toVisual Inspect
ChangesTNS process to Inspect
◦ Create a snapshot/saveabend file
save <filename[!]>
◦ Open a snapshot/saveabend file
snapshot <filename>
4 - Debuggers 30](https://image.slidesharecdn.com/mod04debuggers-130509072849-phpapp02/75/Mod04-debuggers-30-2048.jpg)


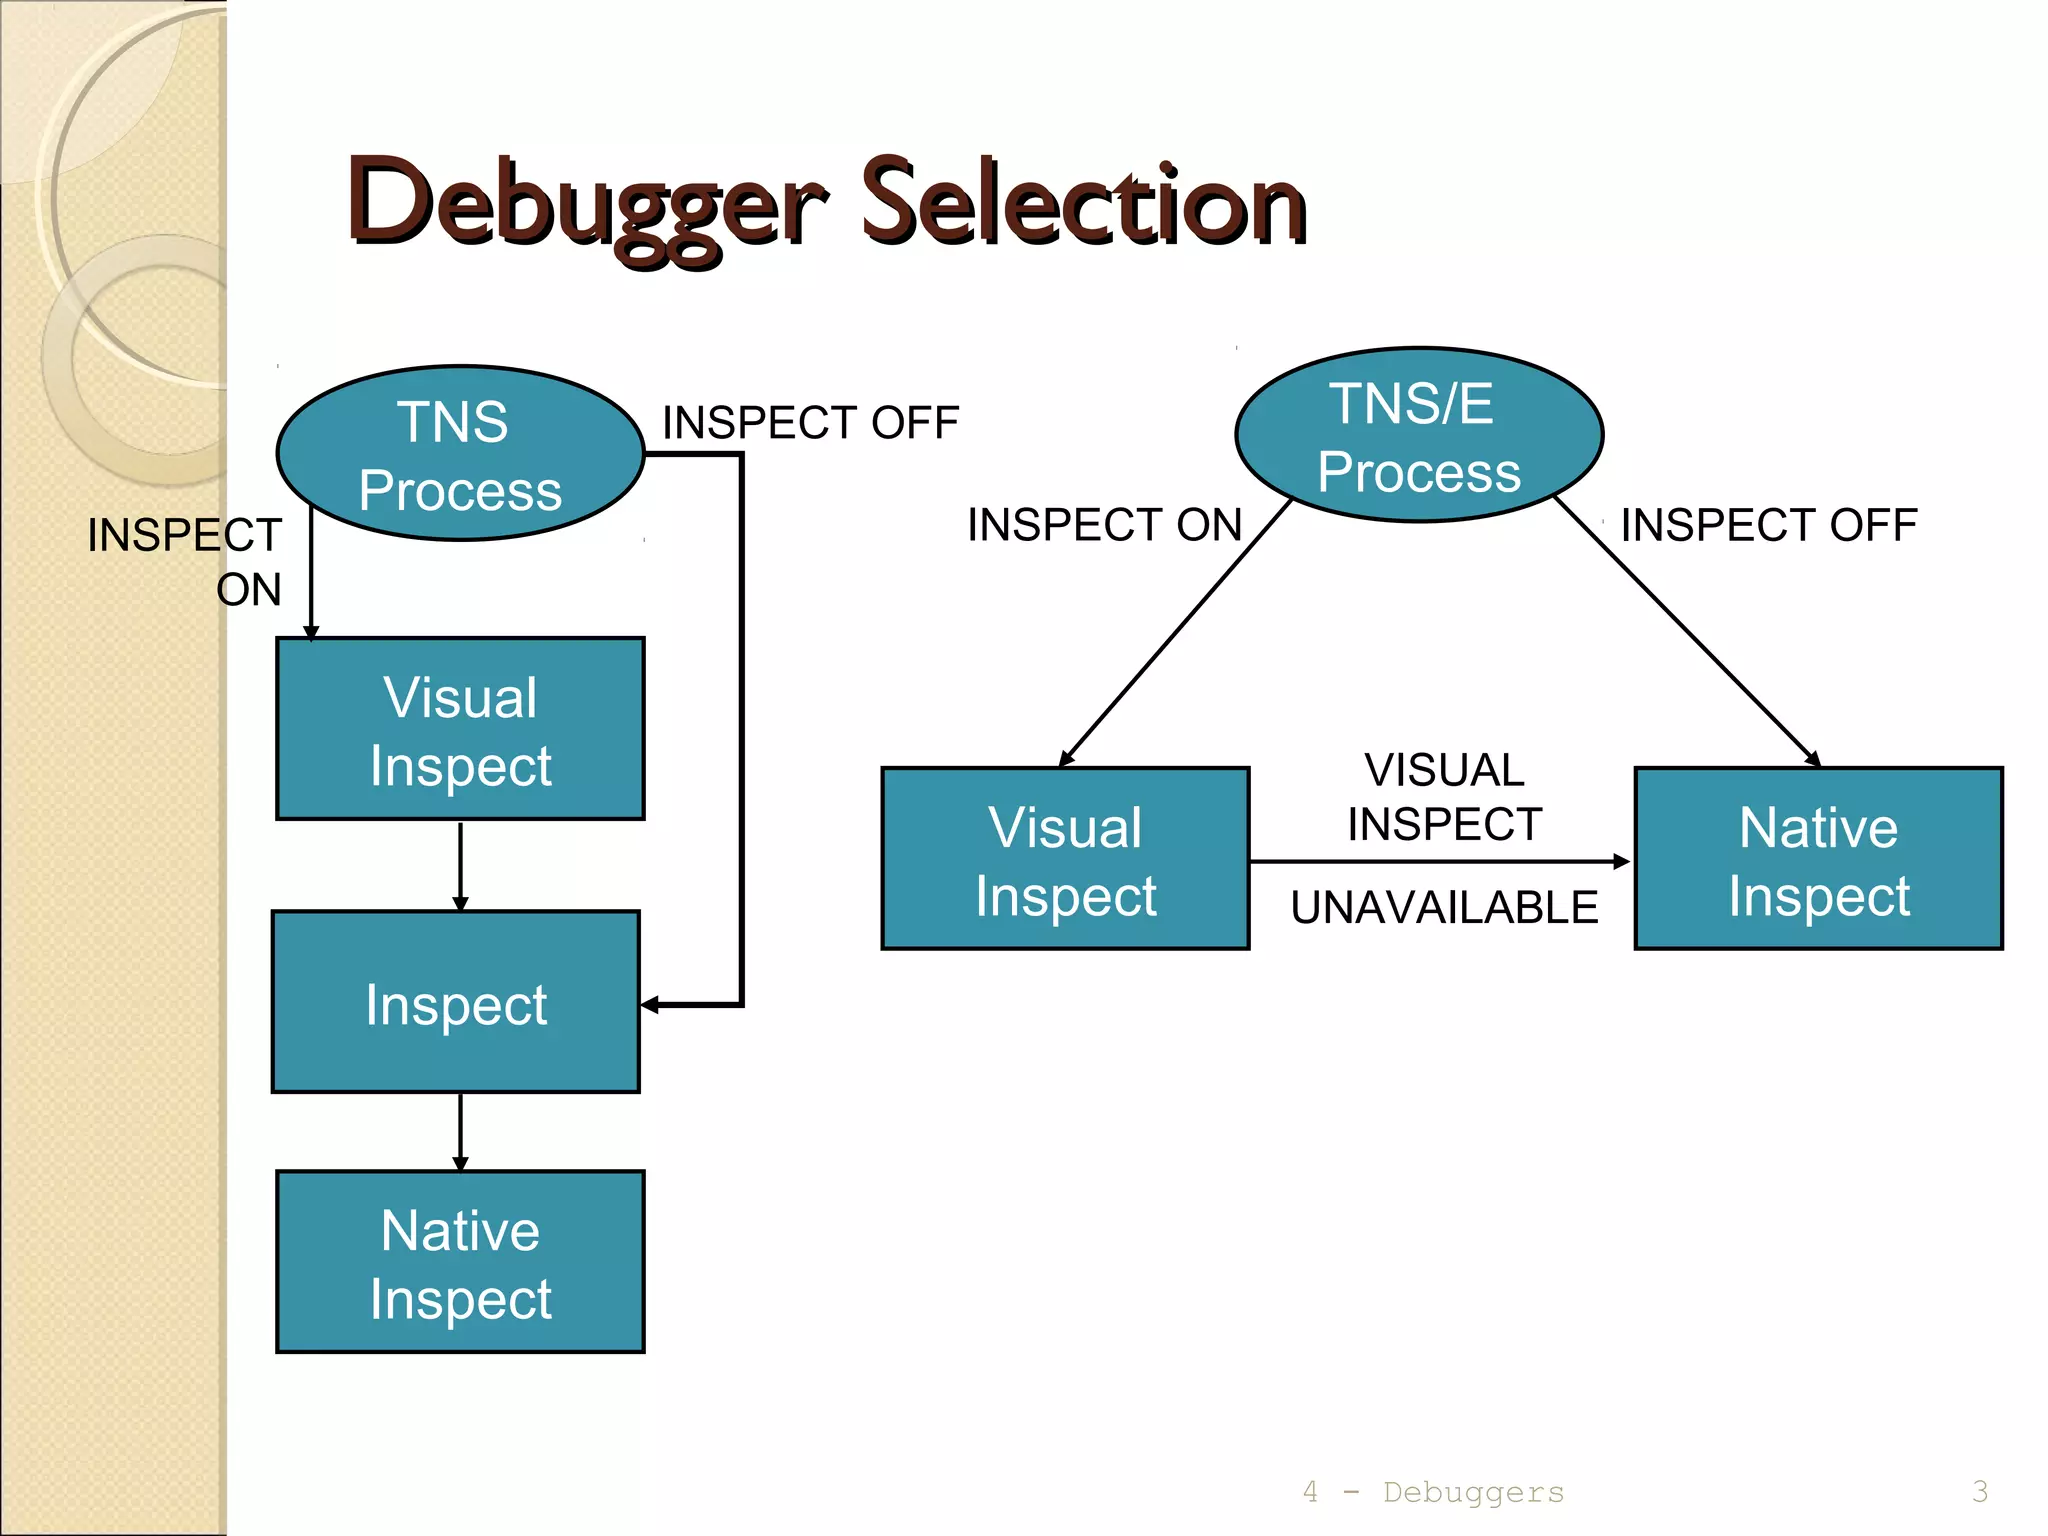
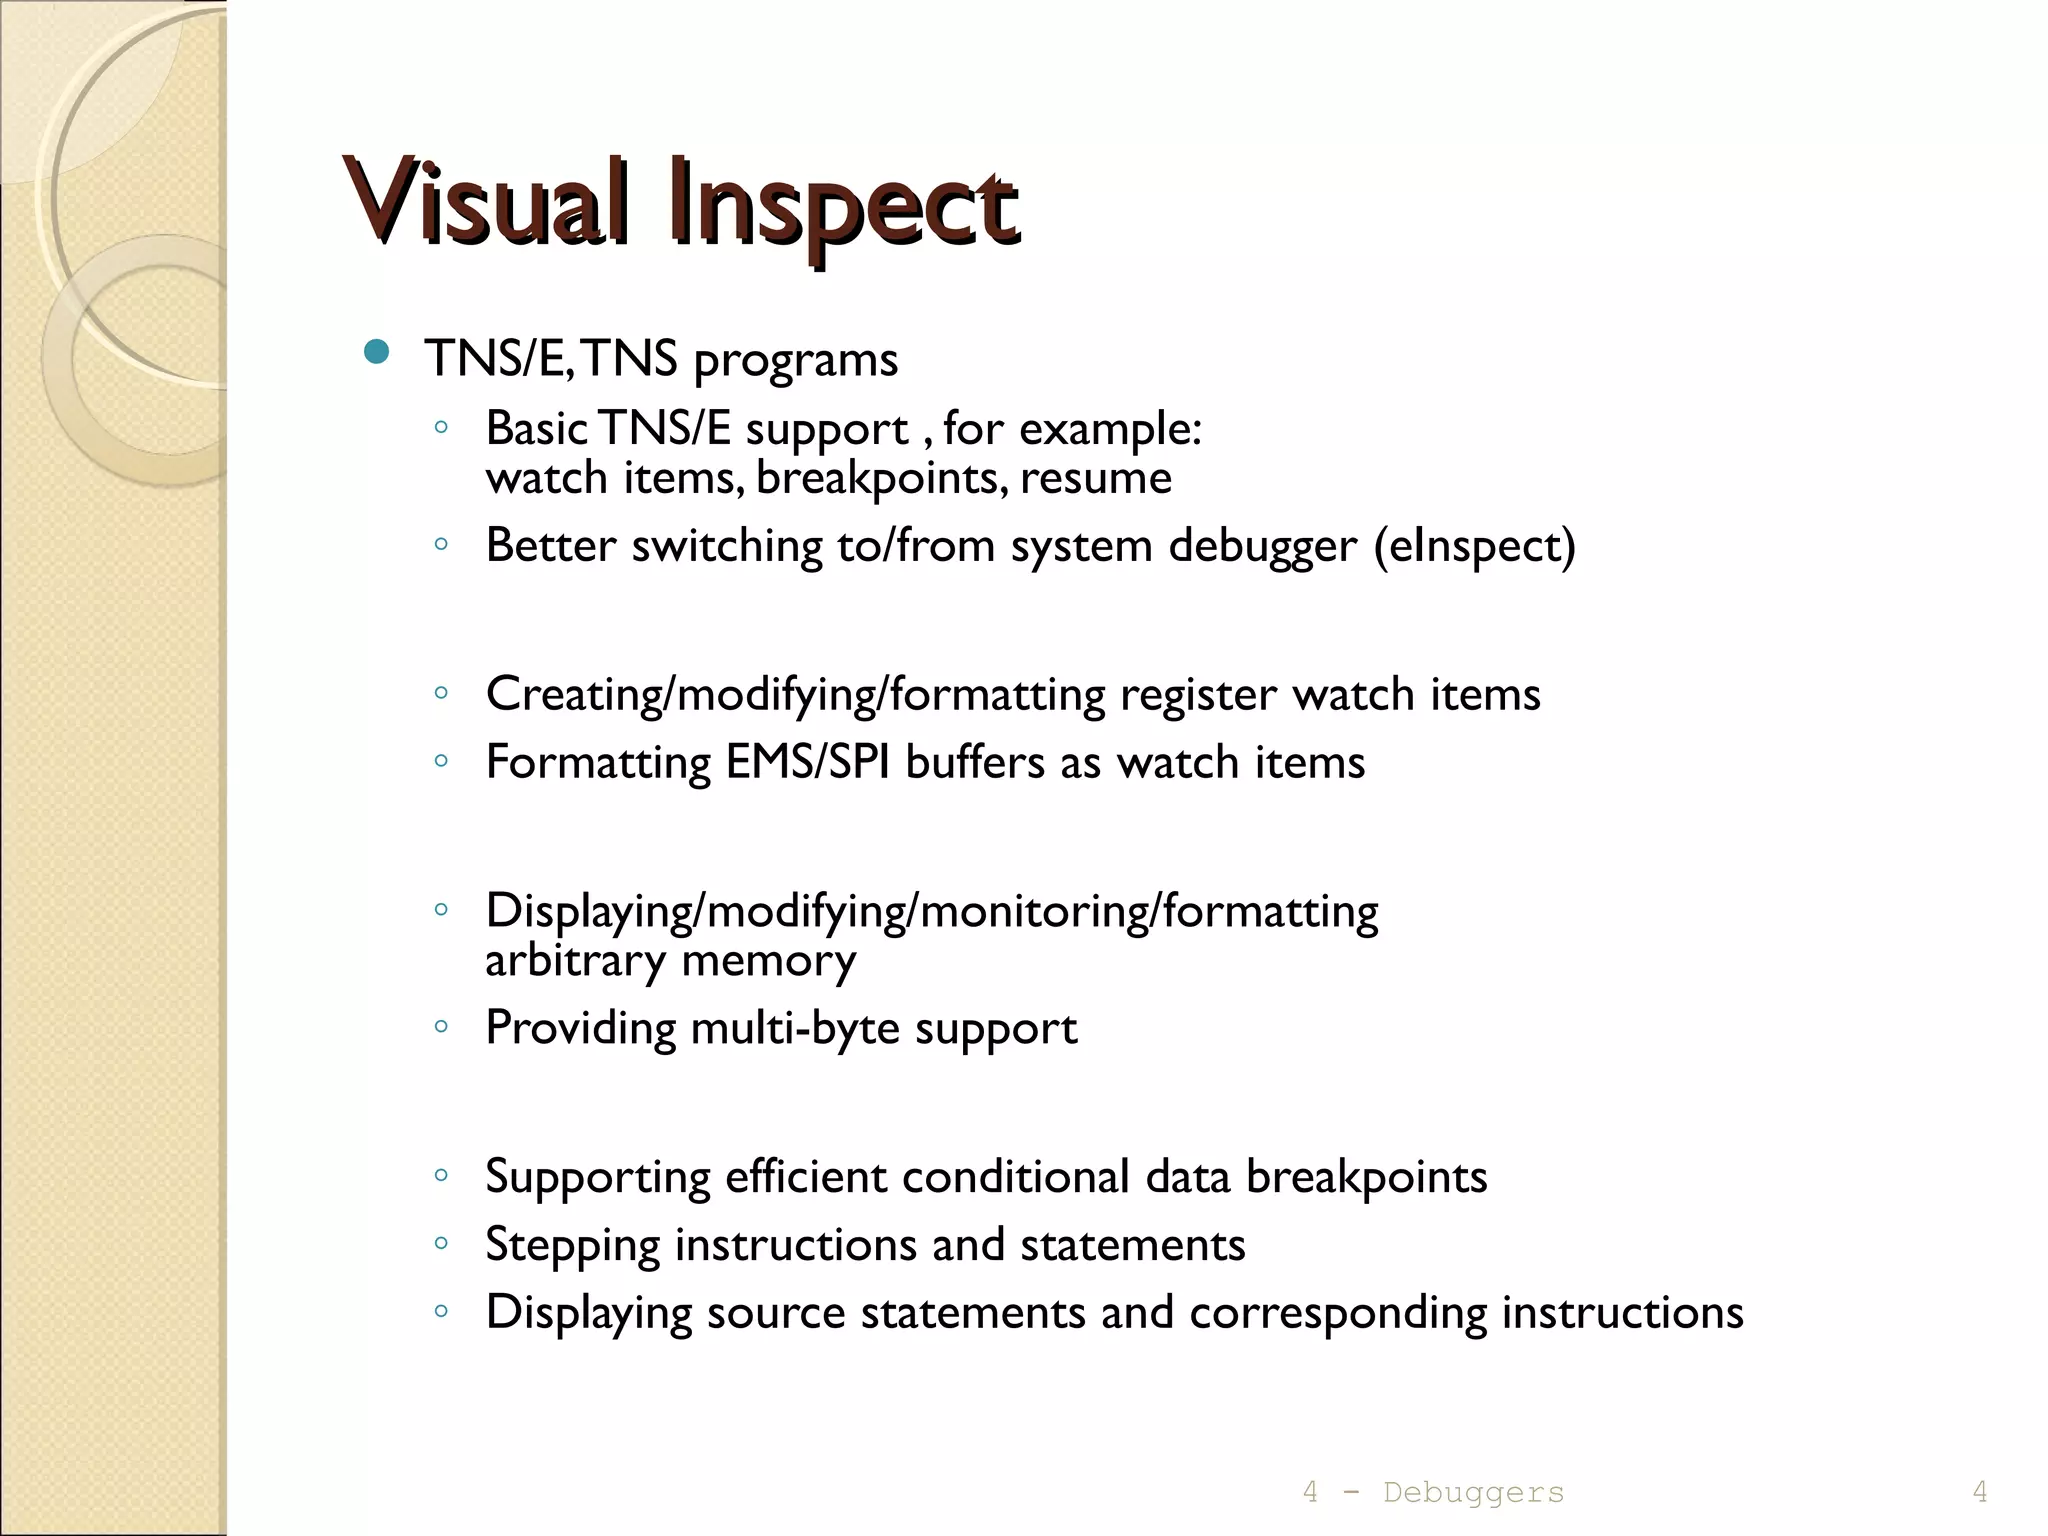
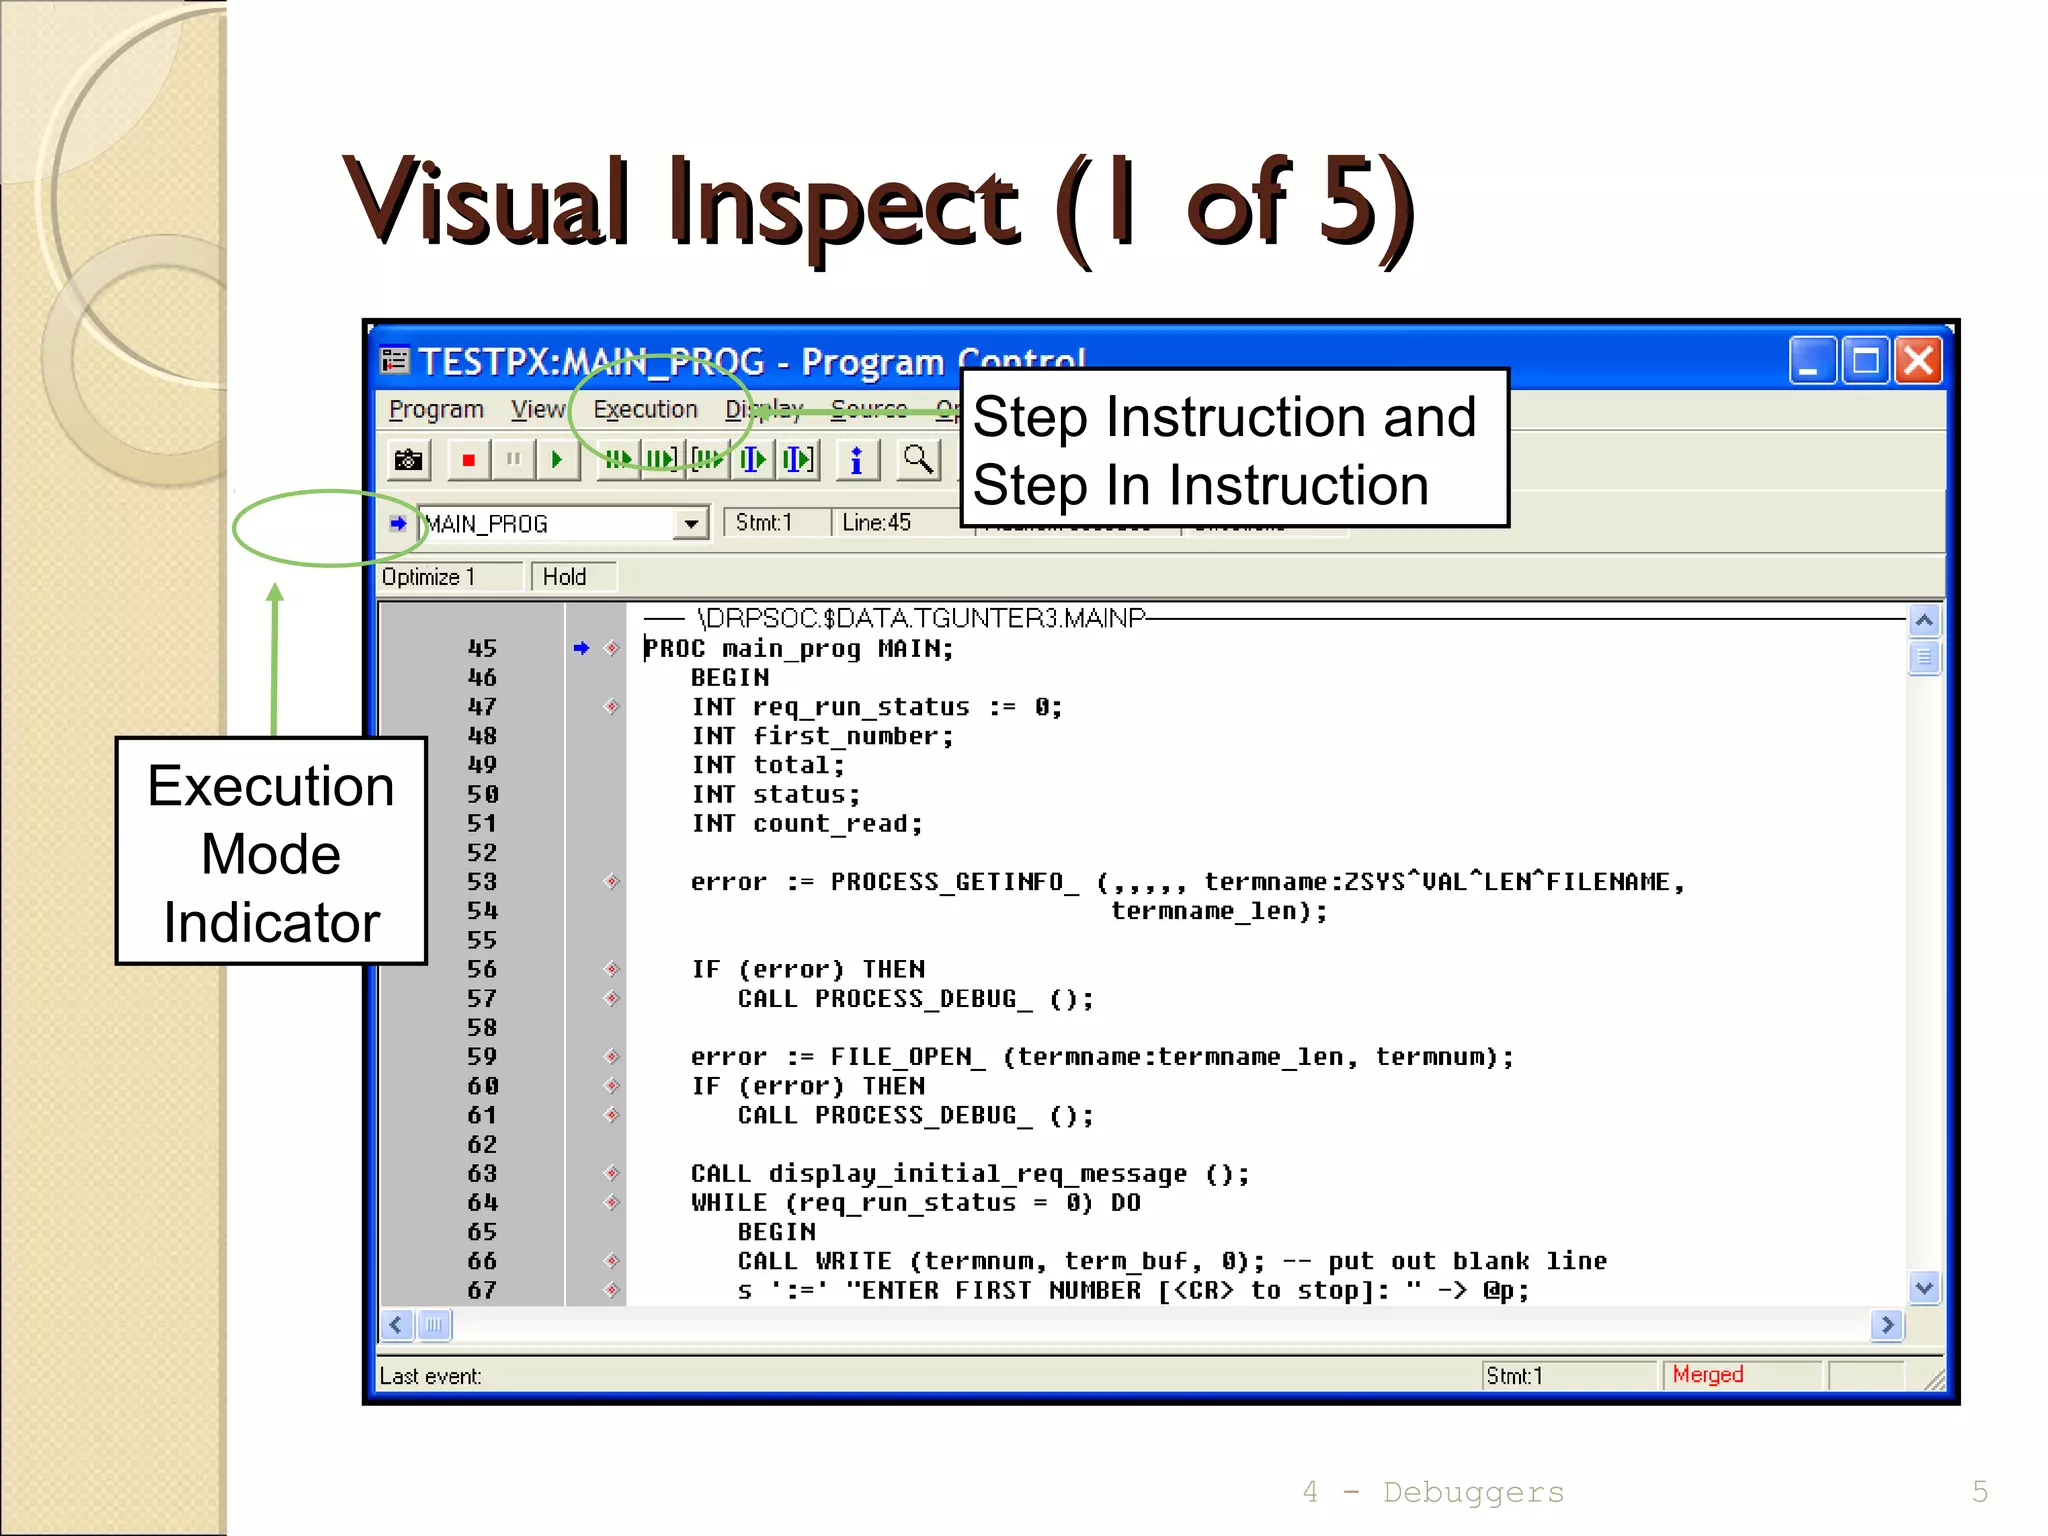
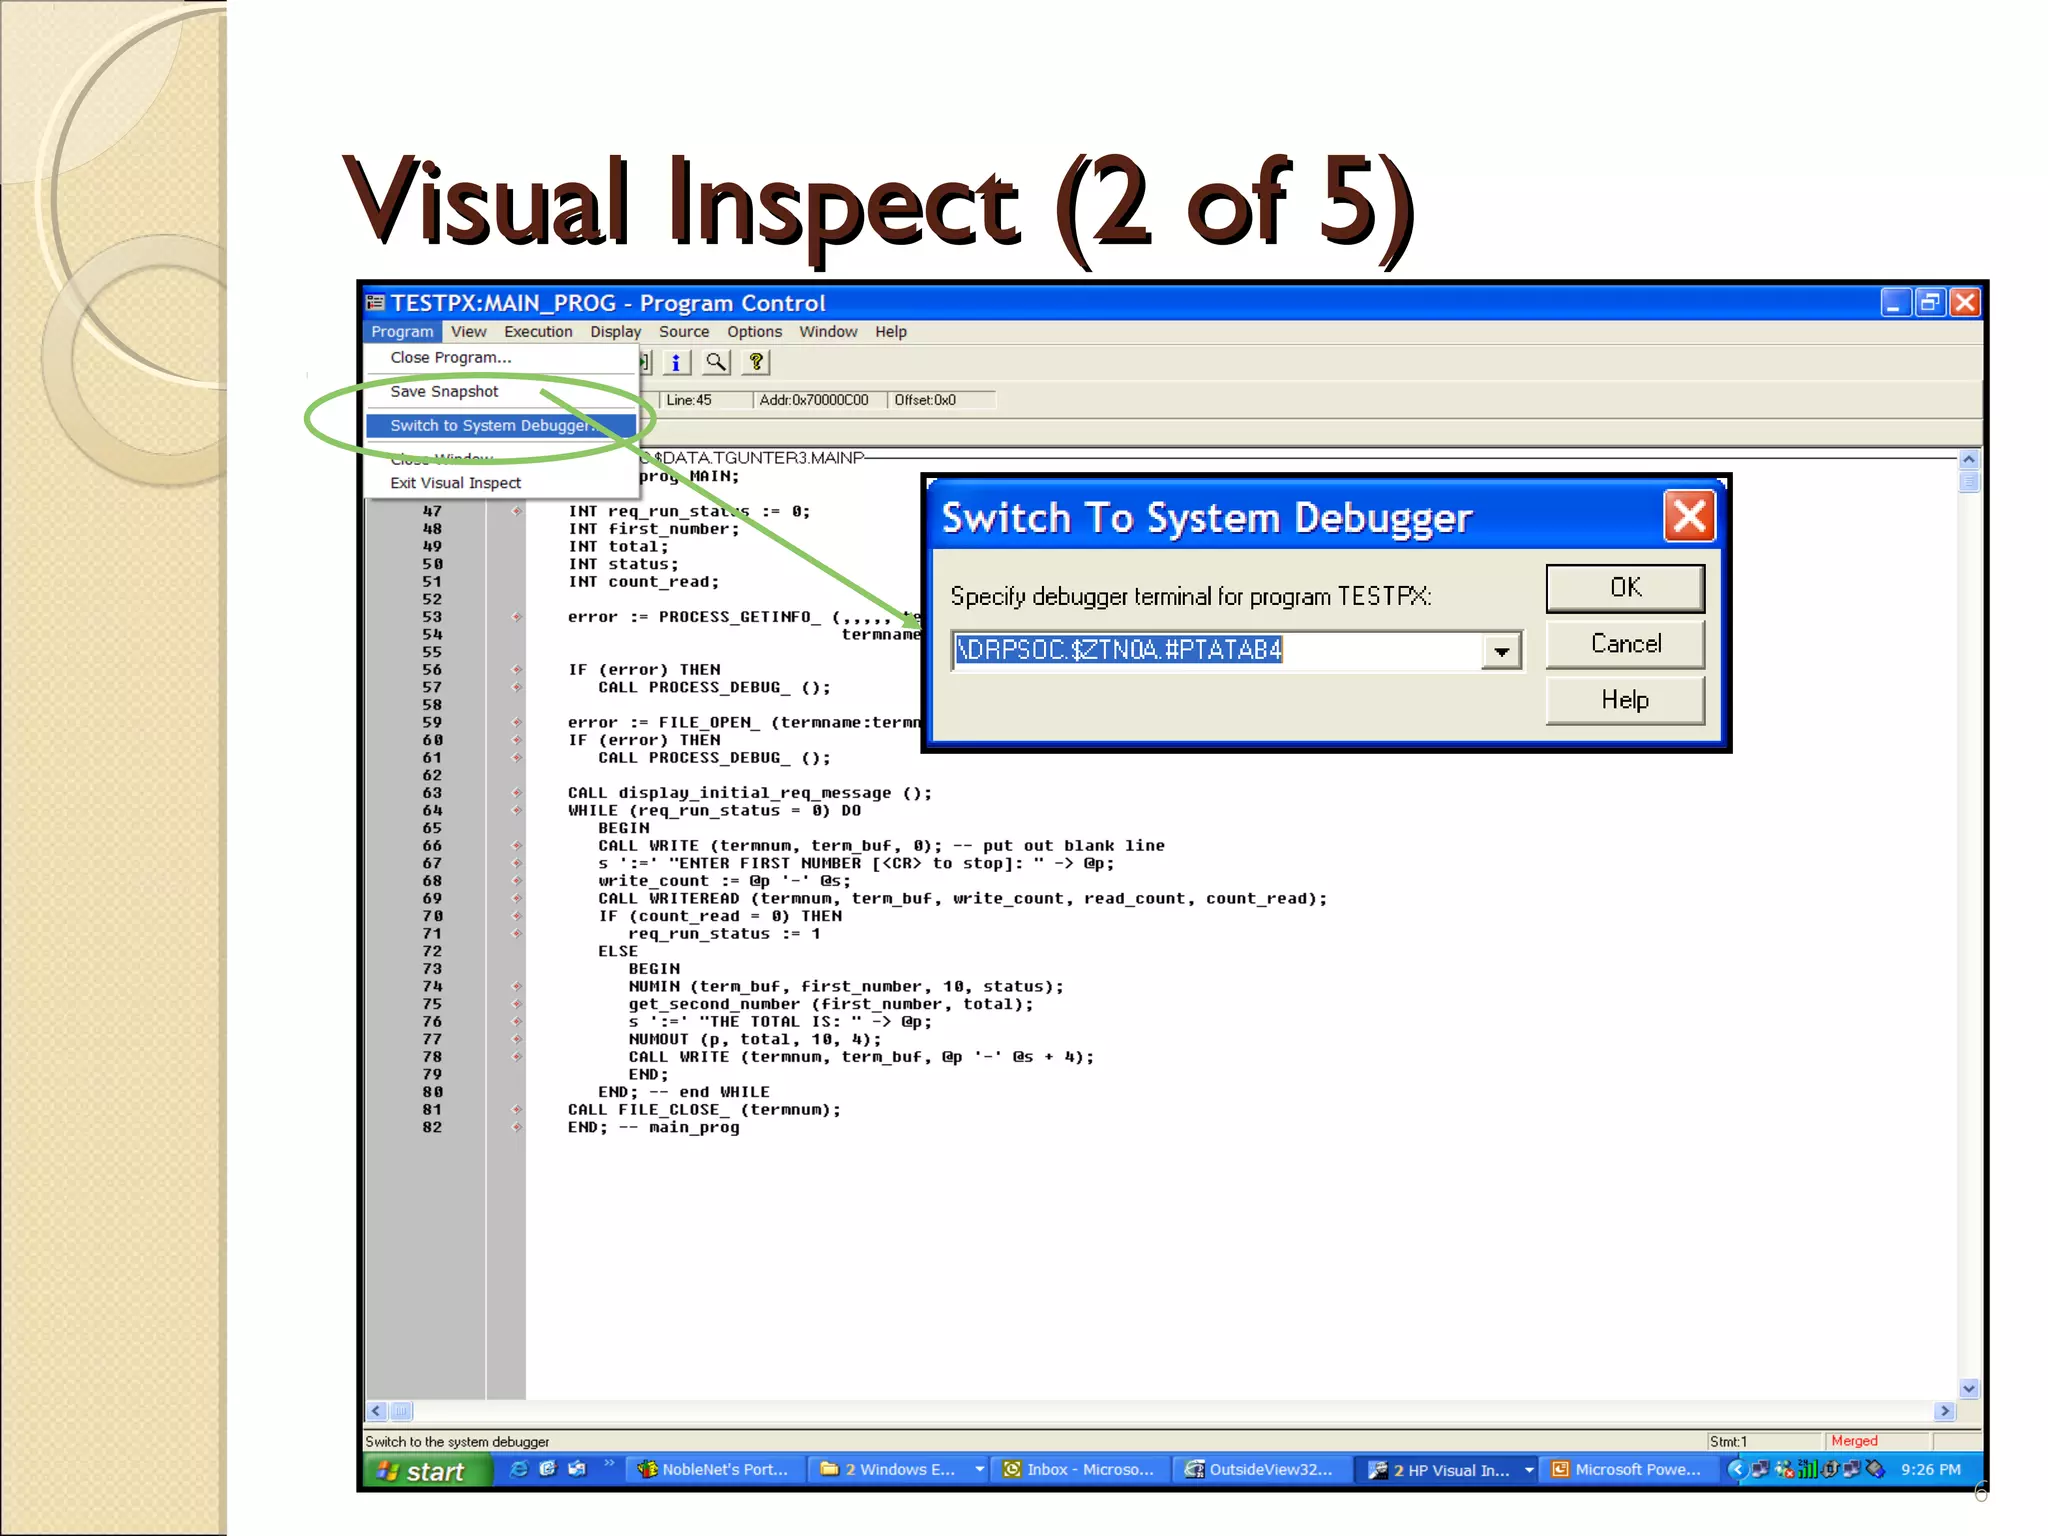
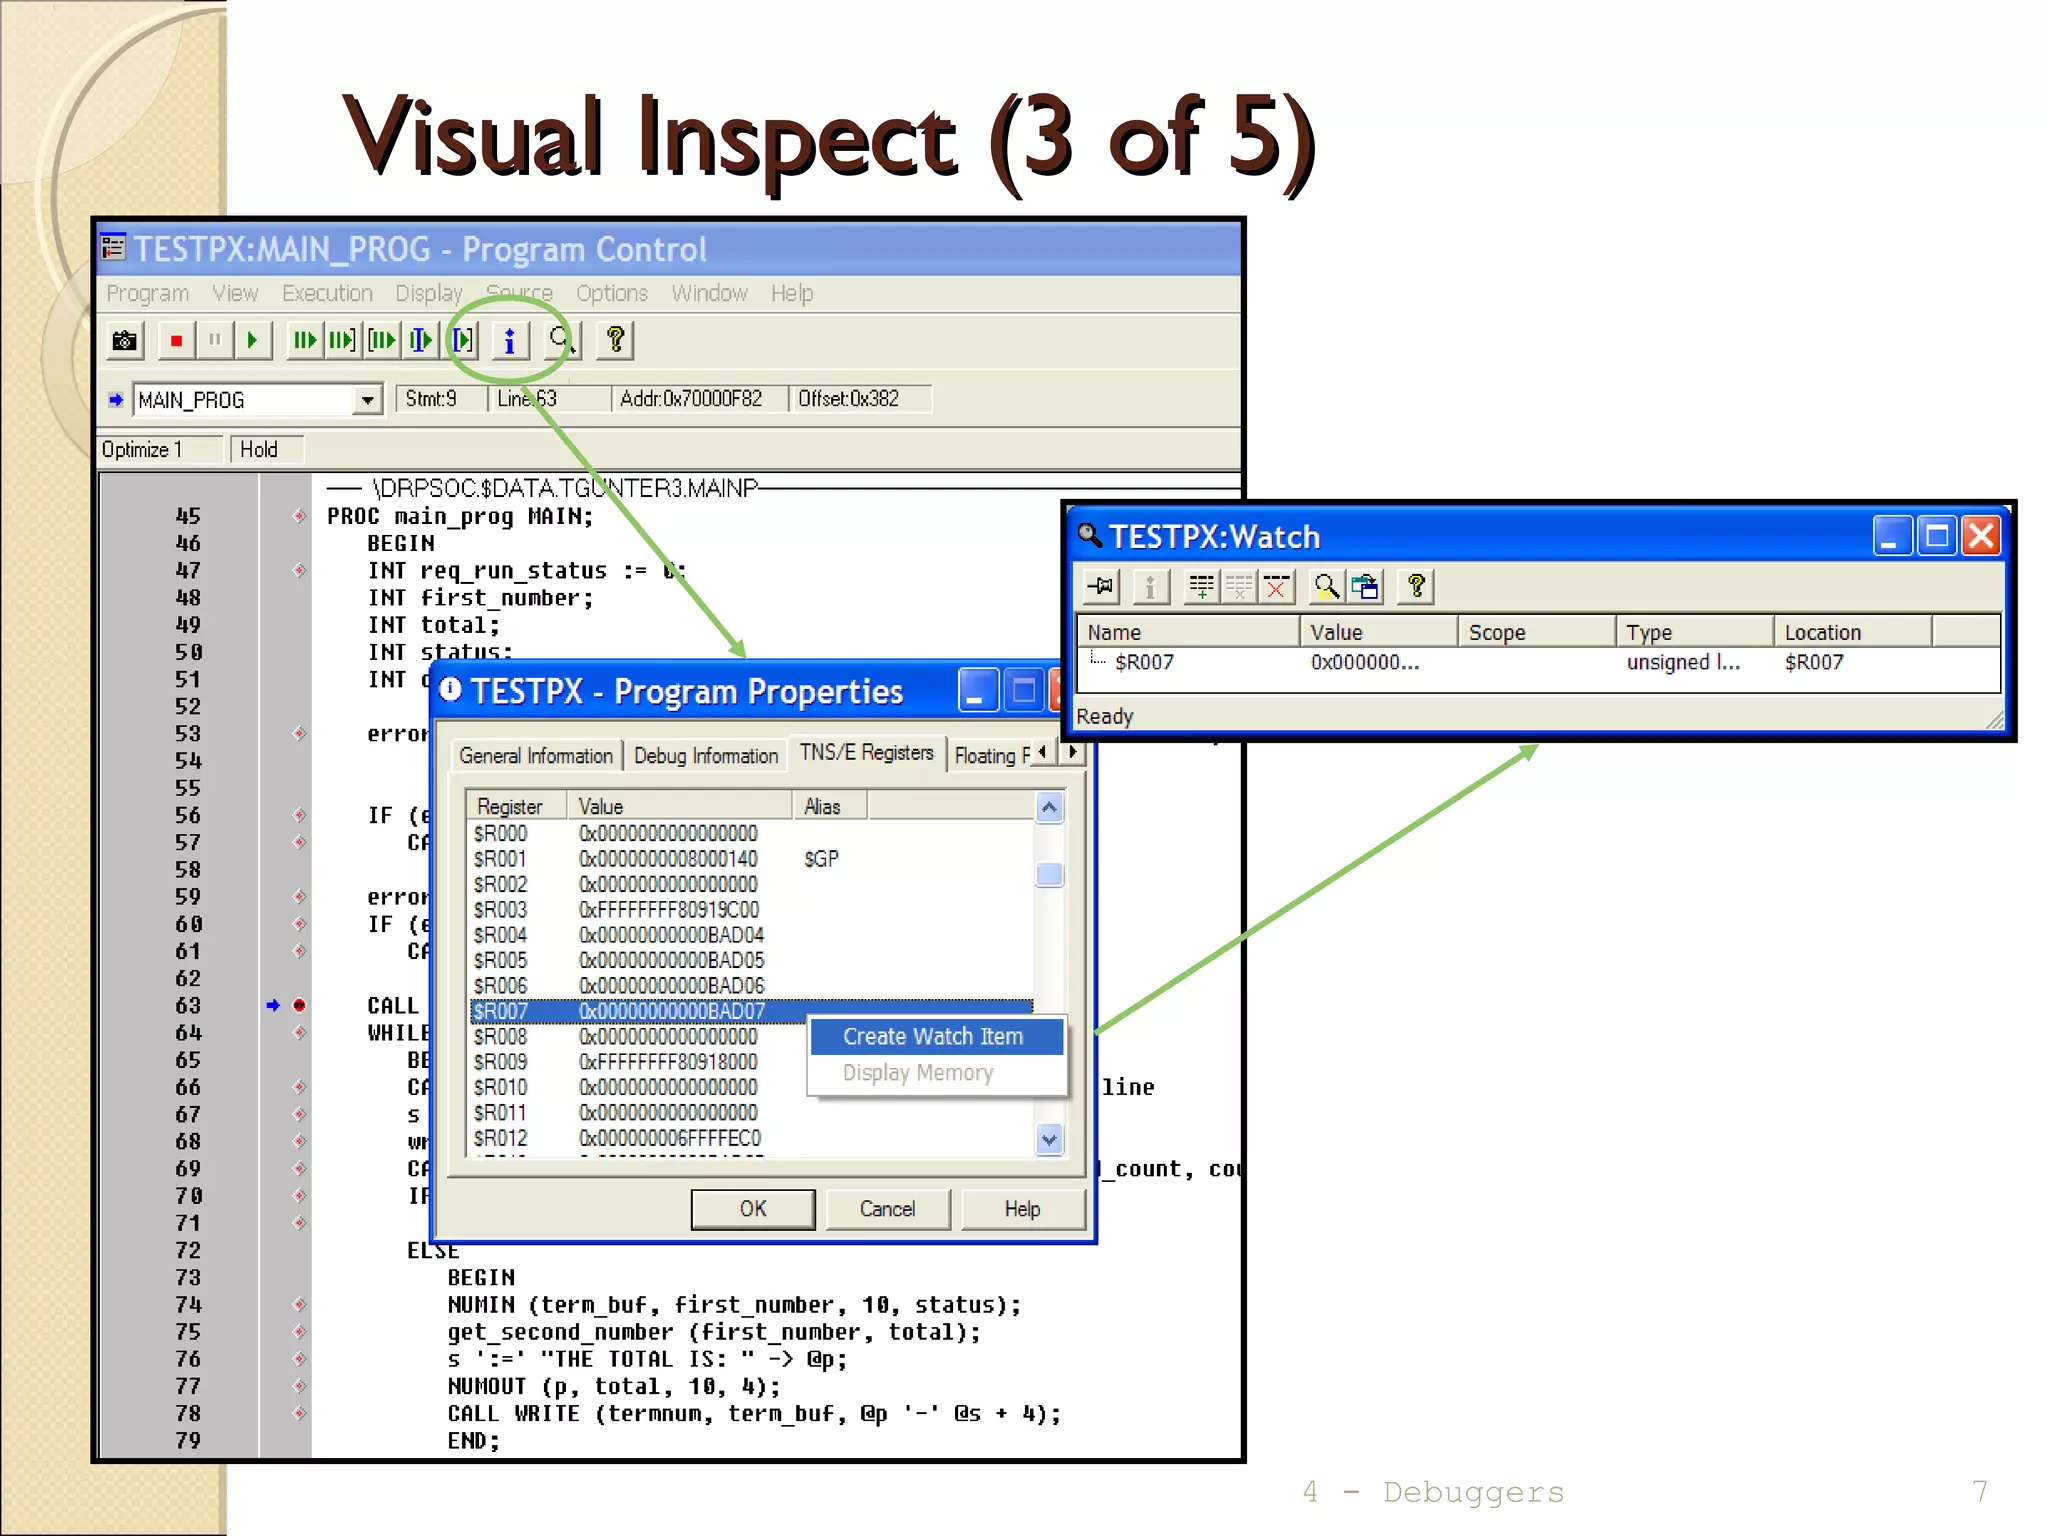
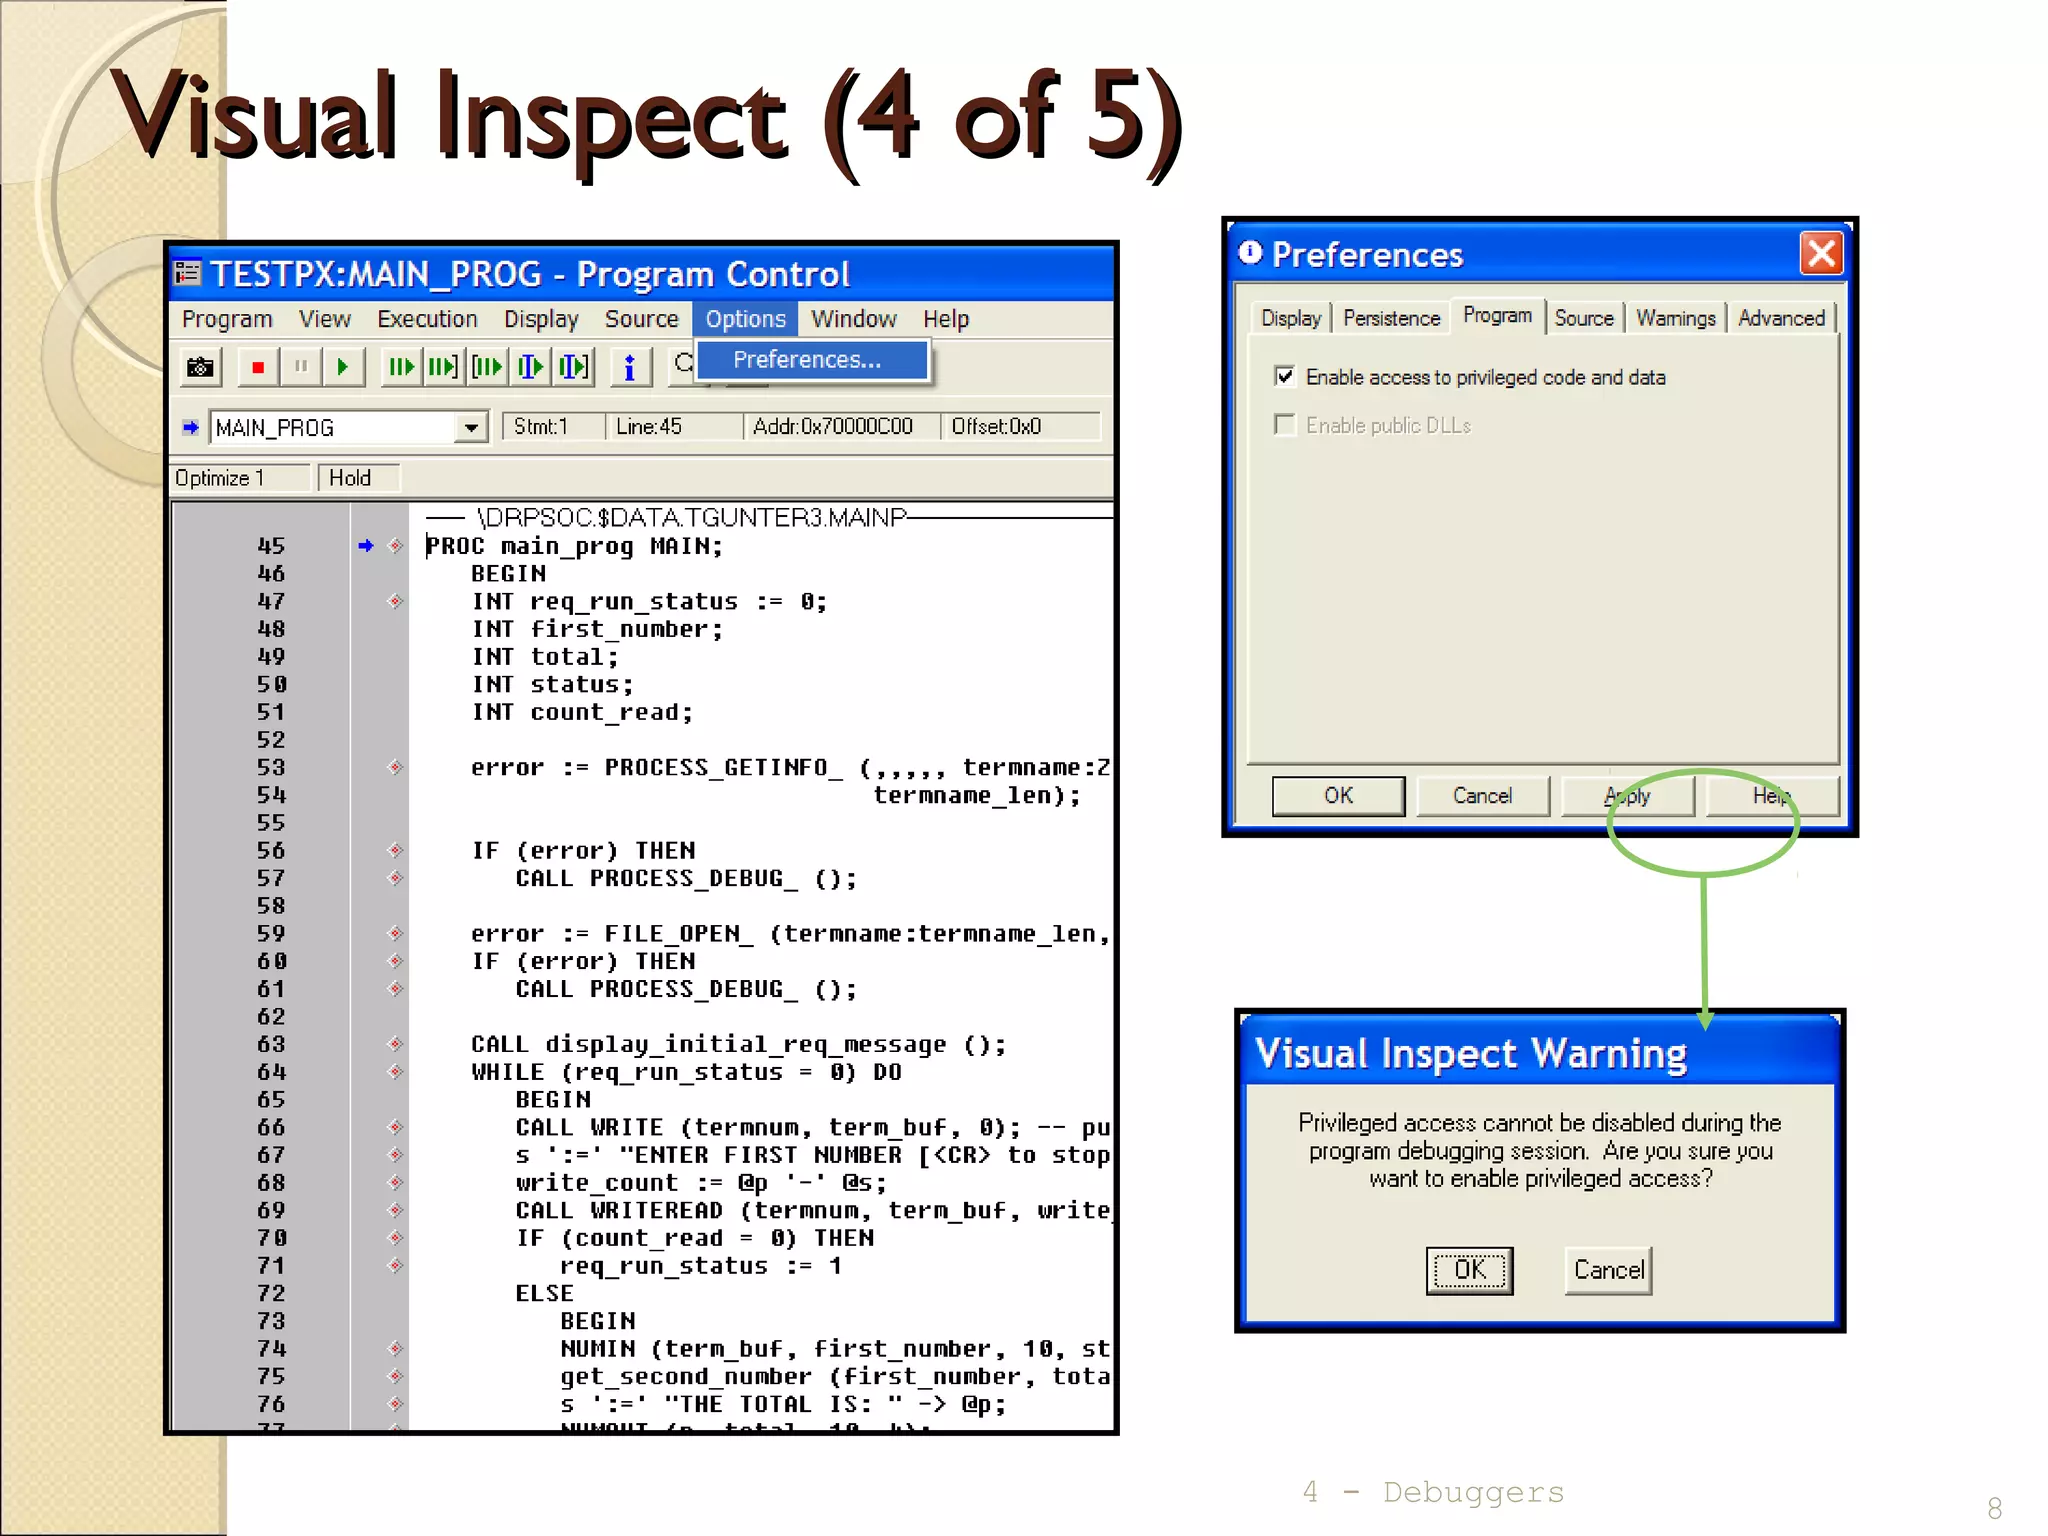
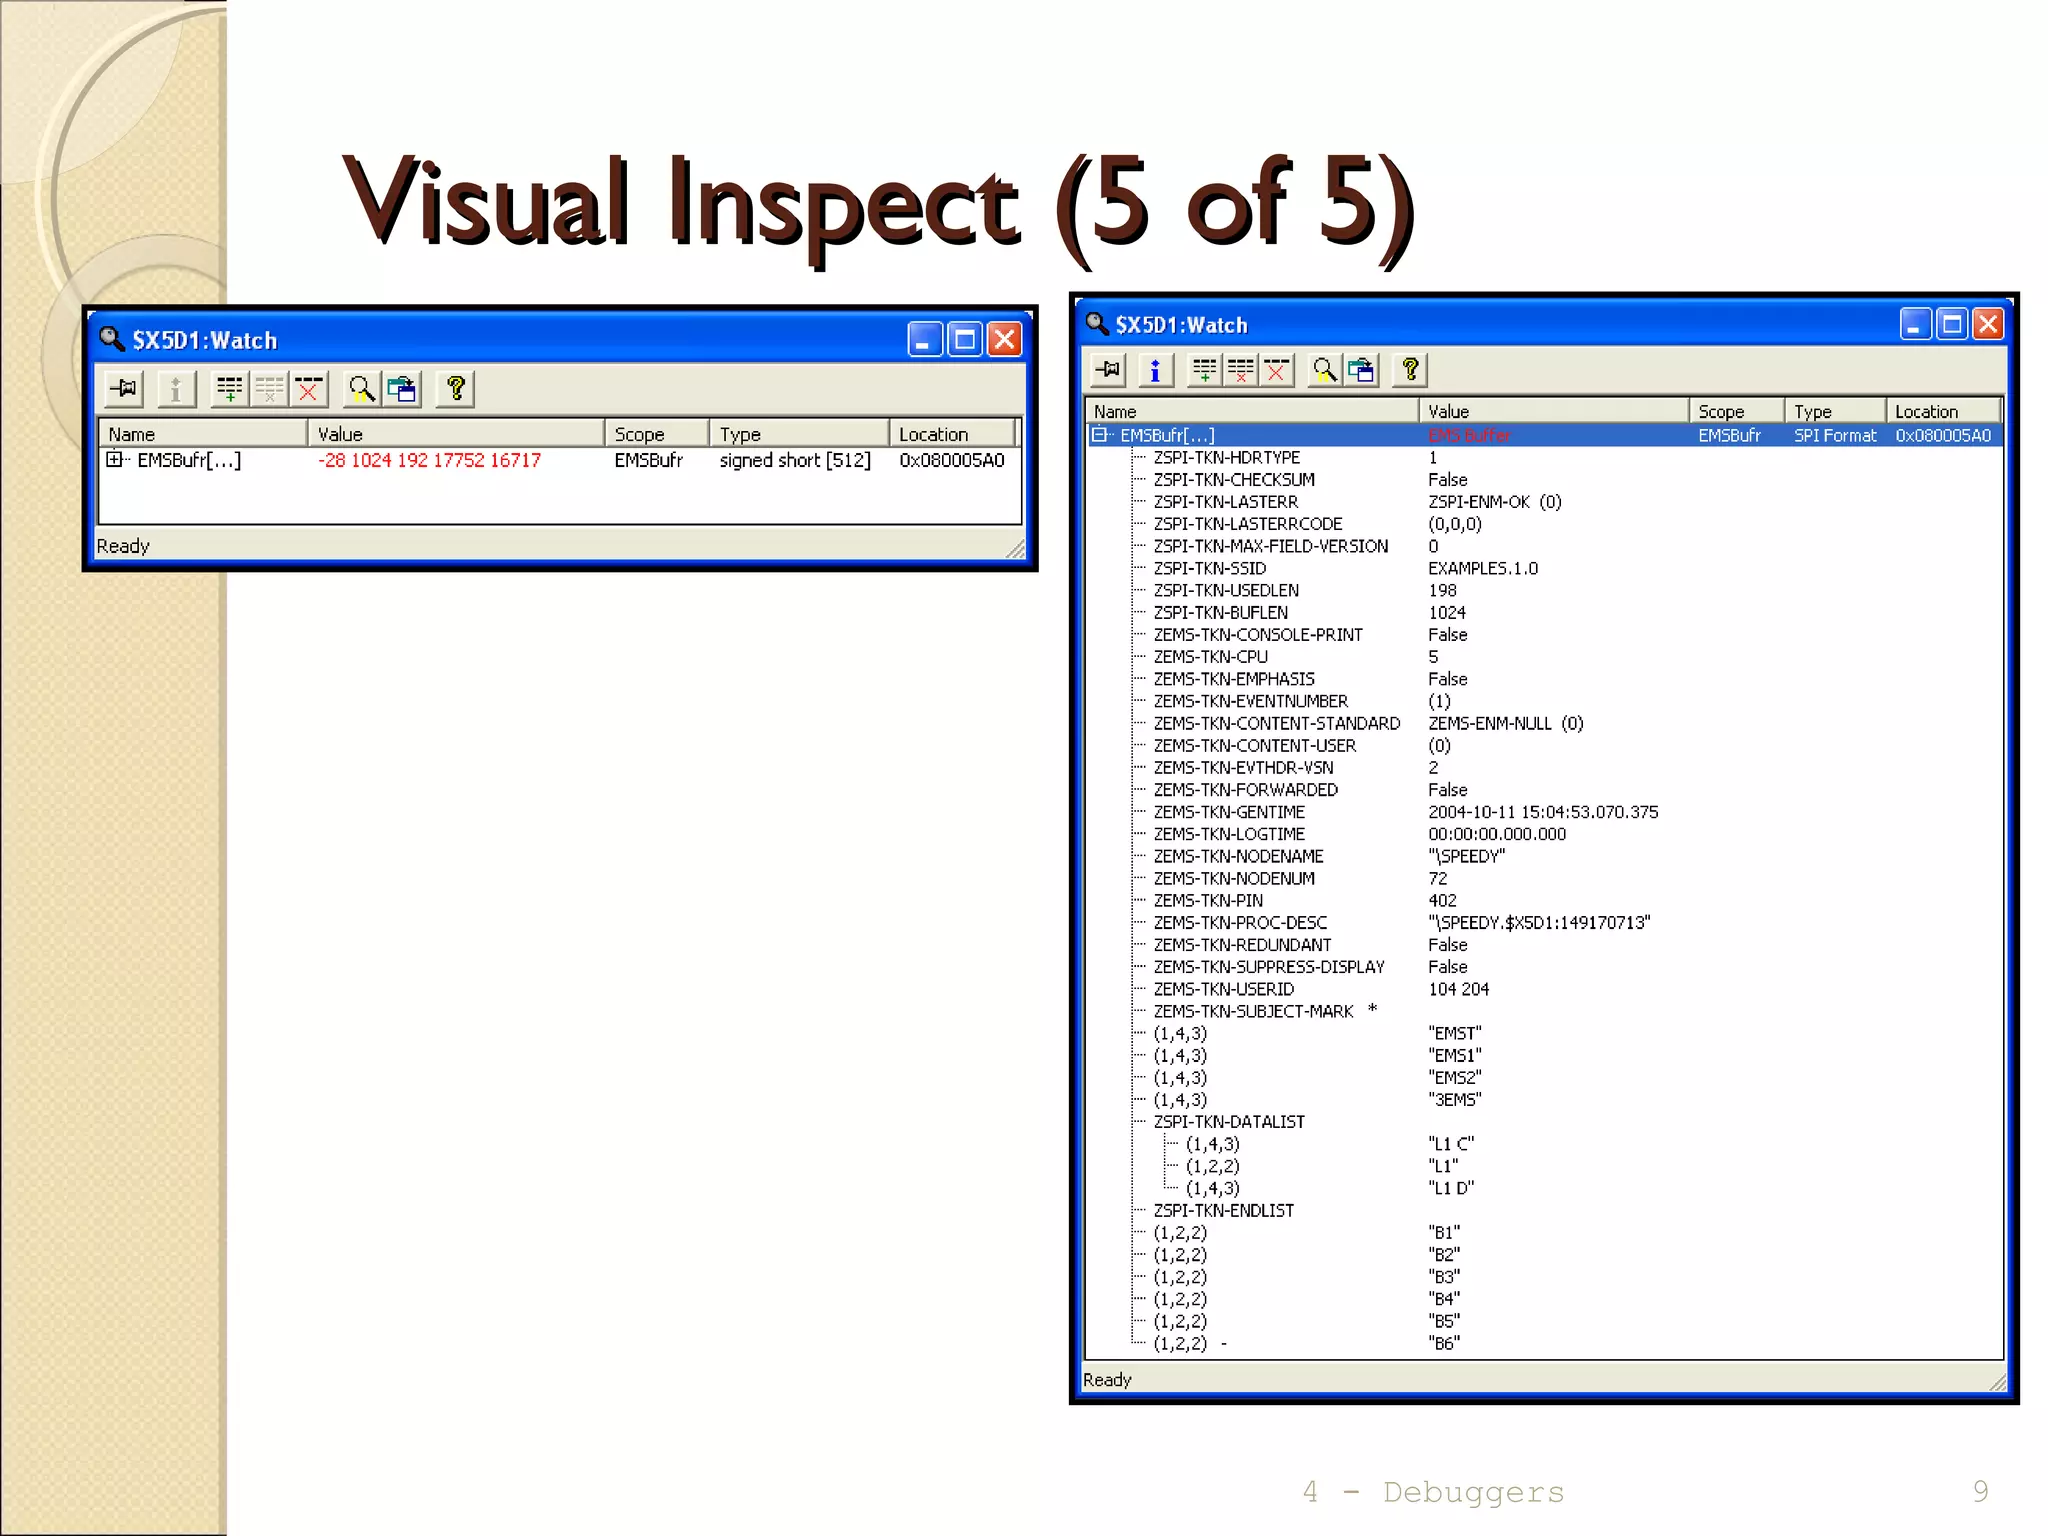
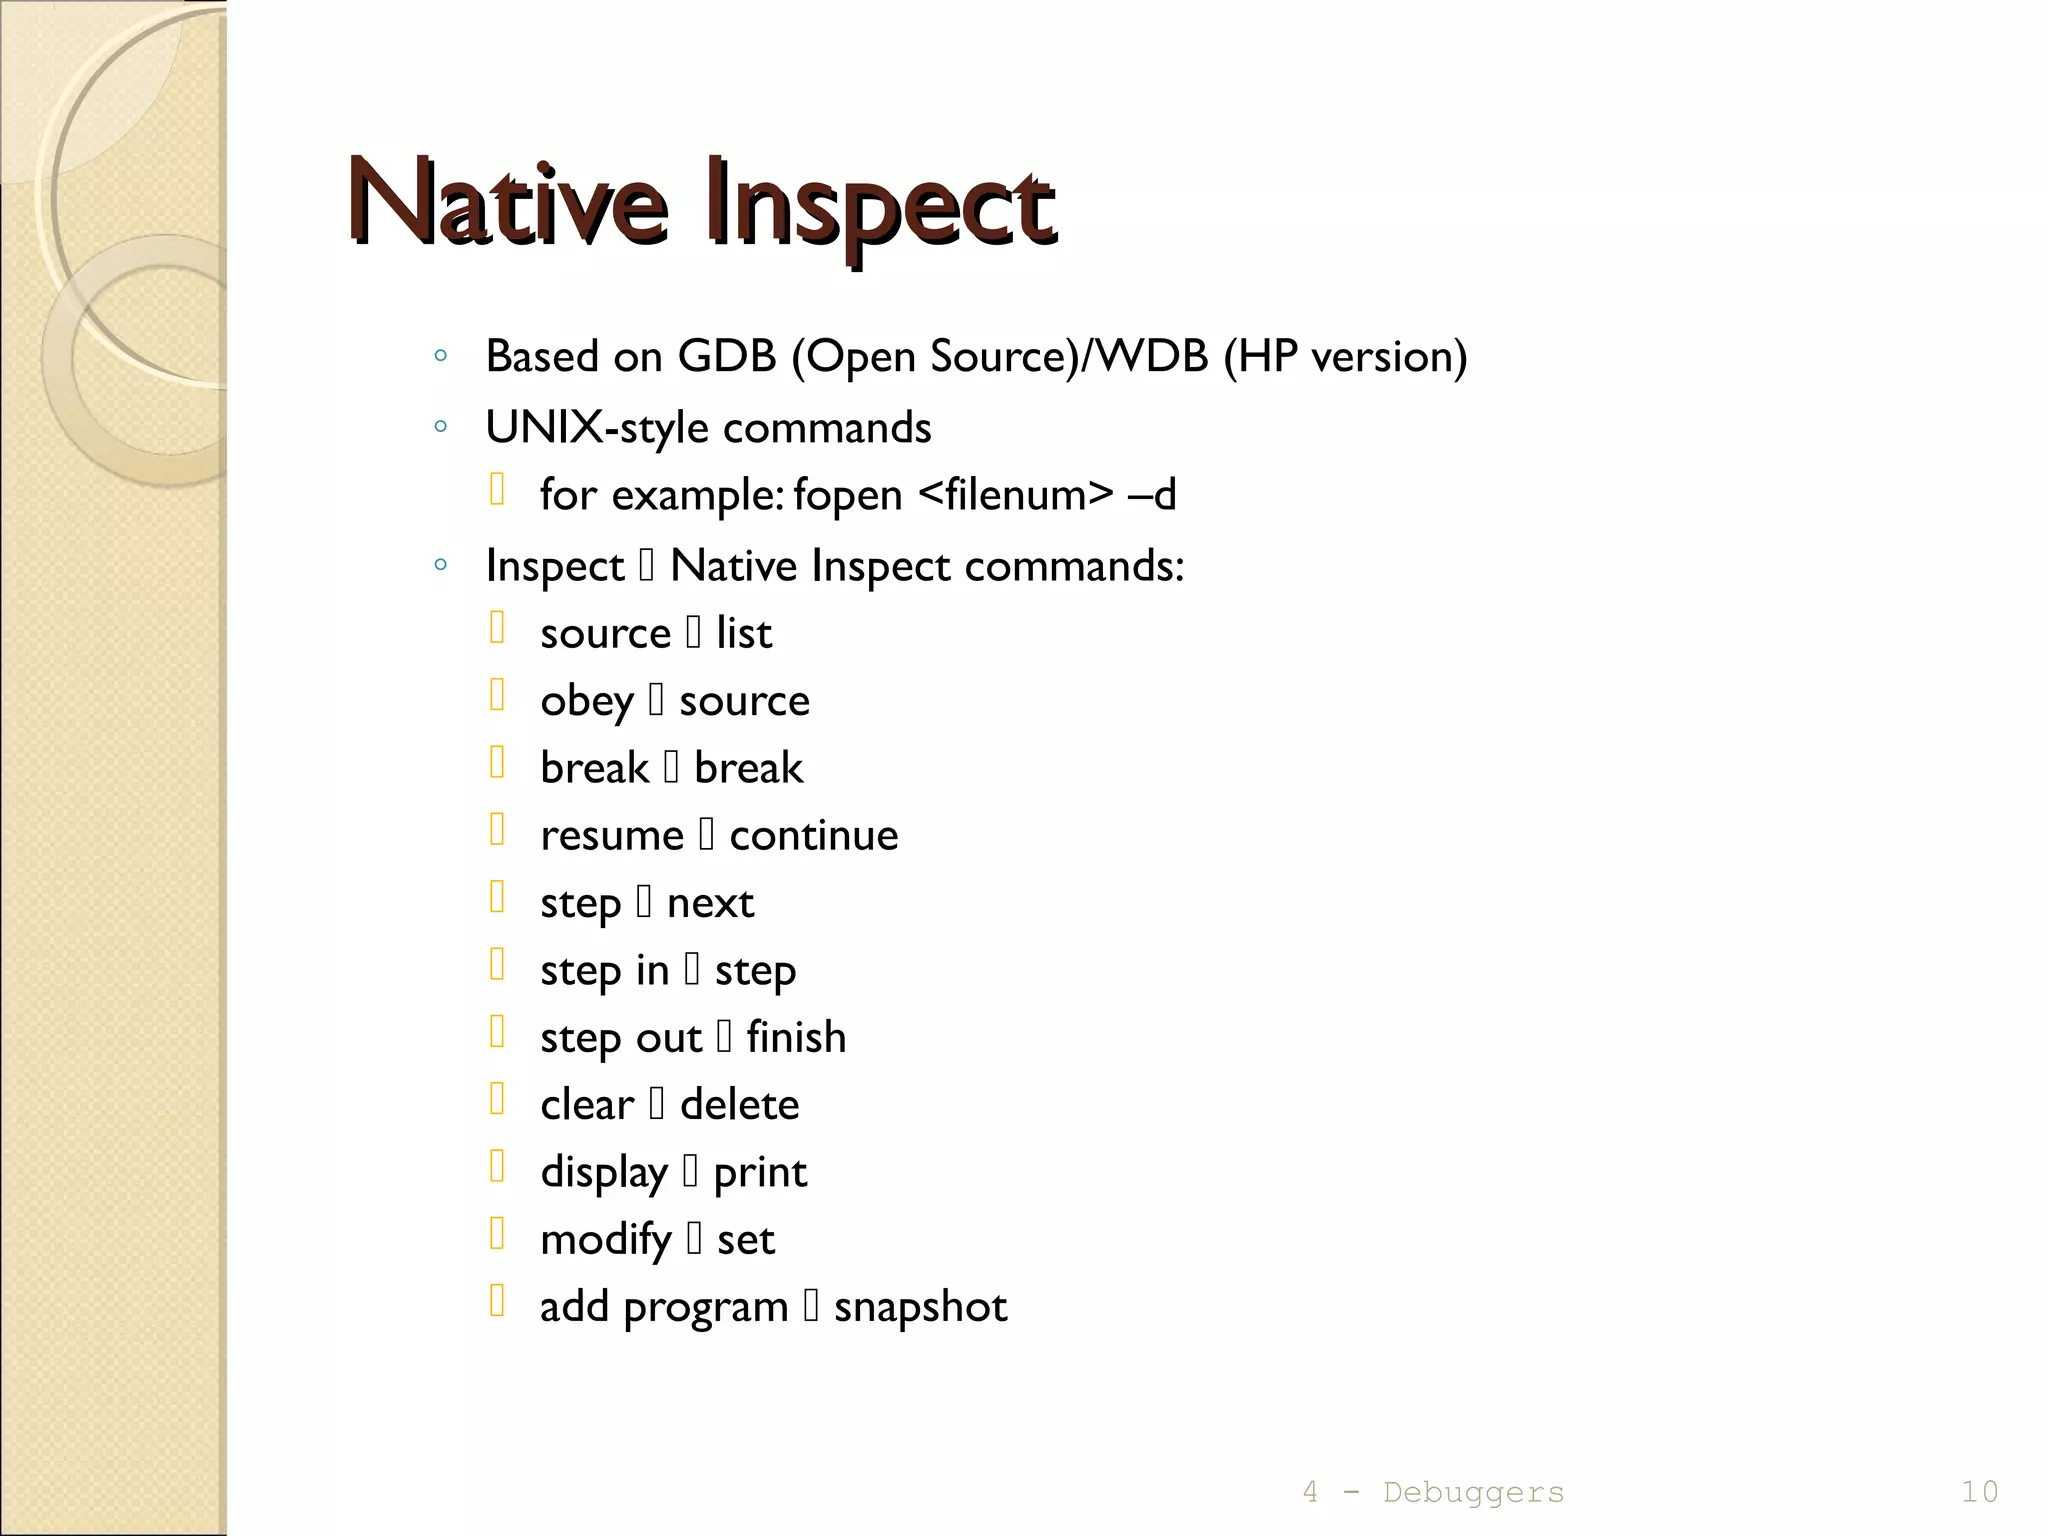
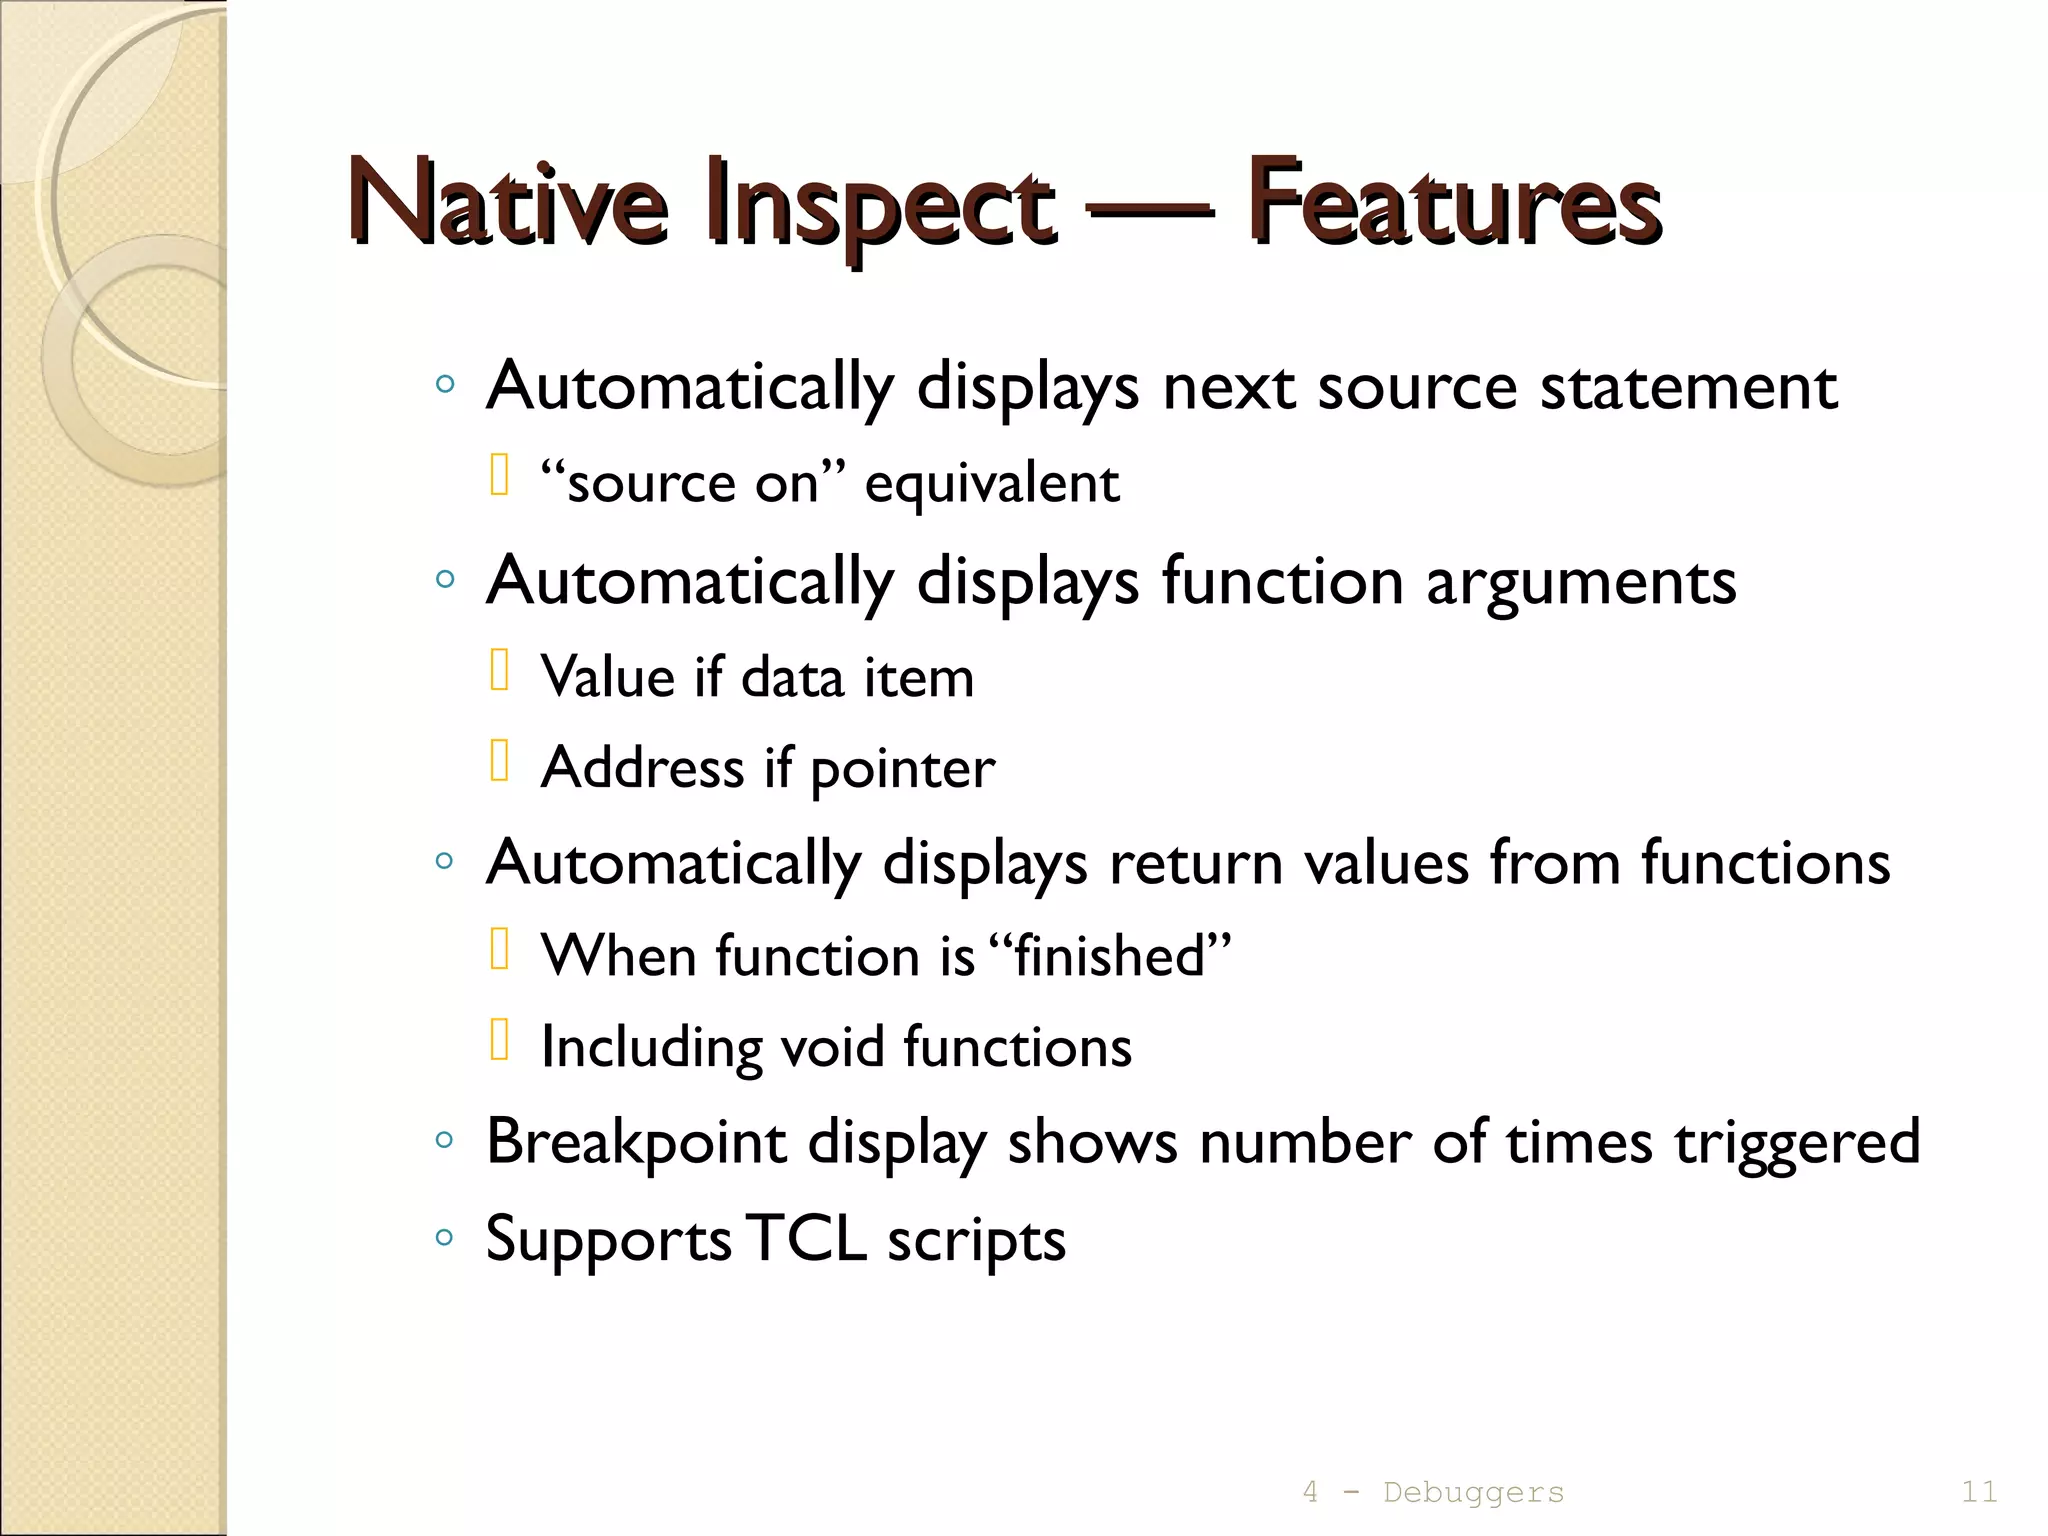
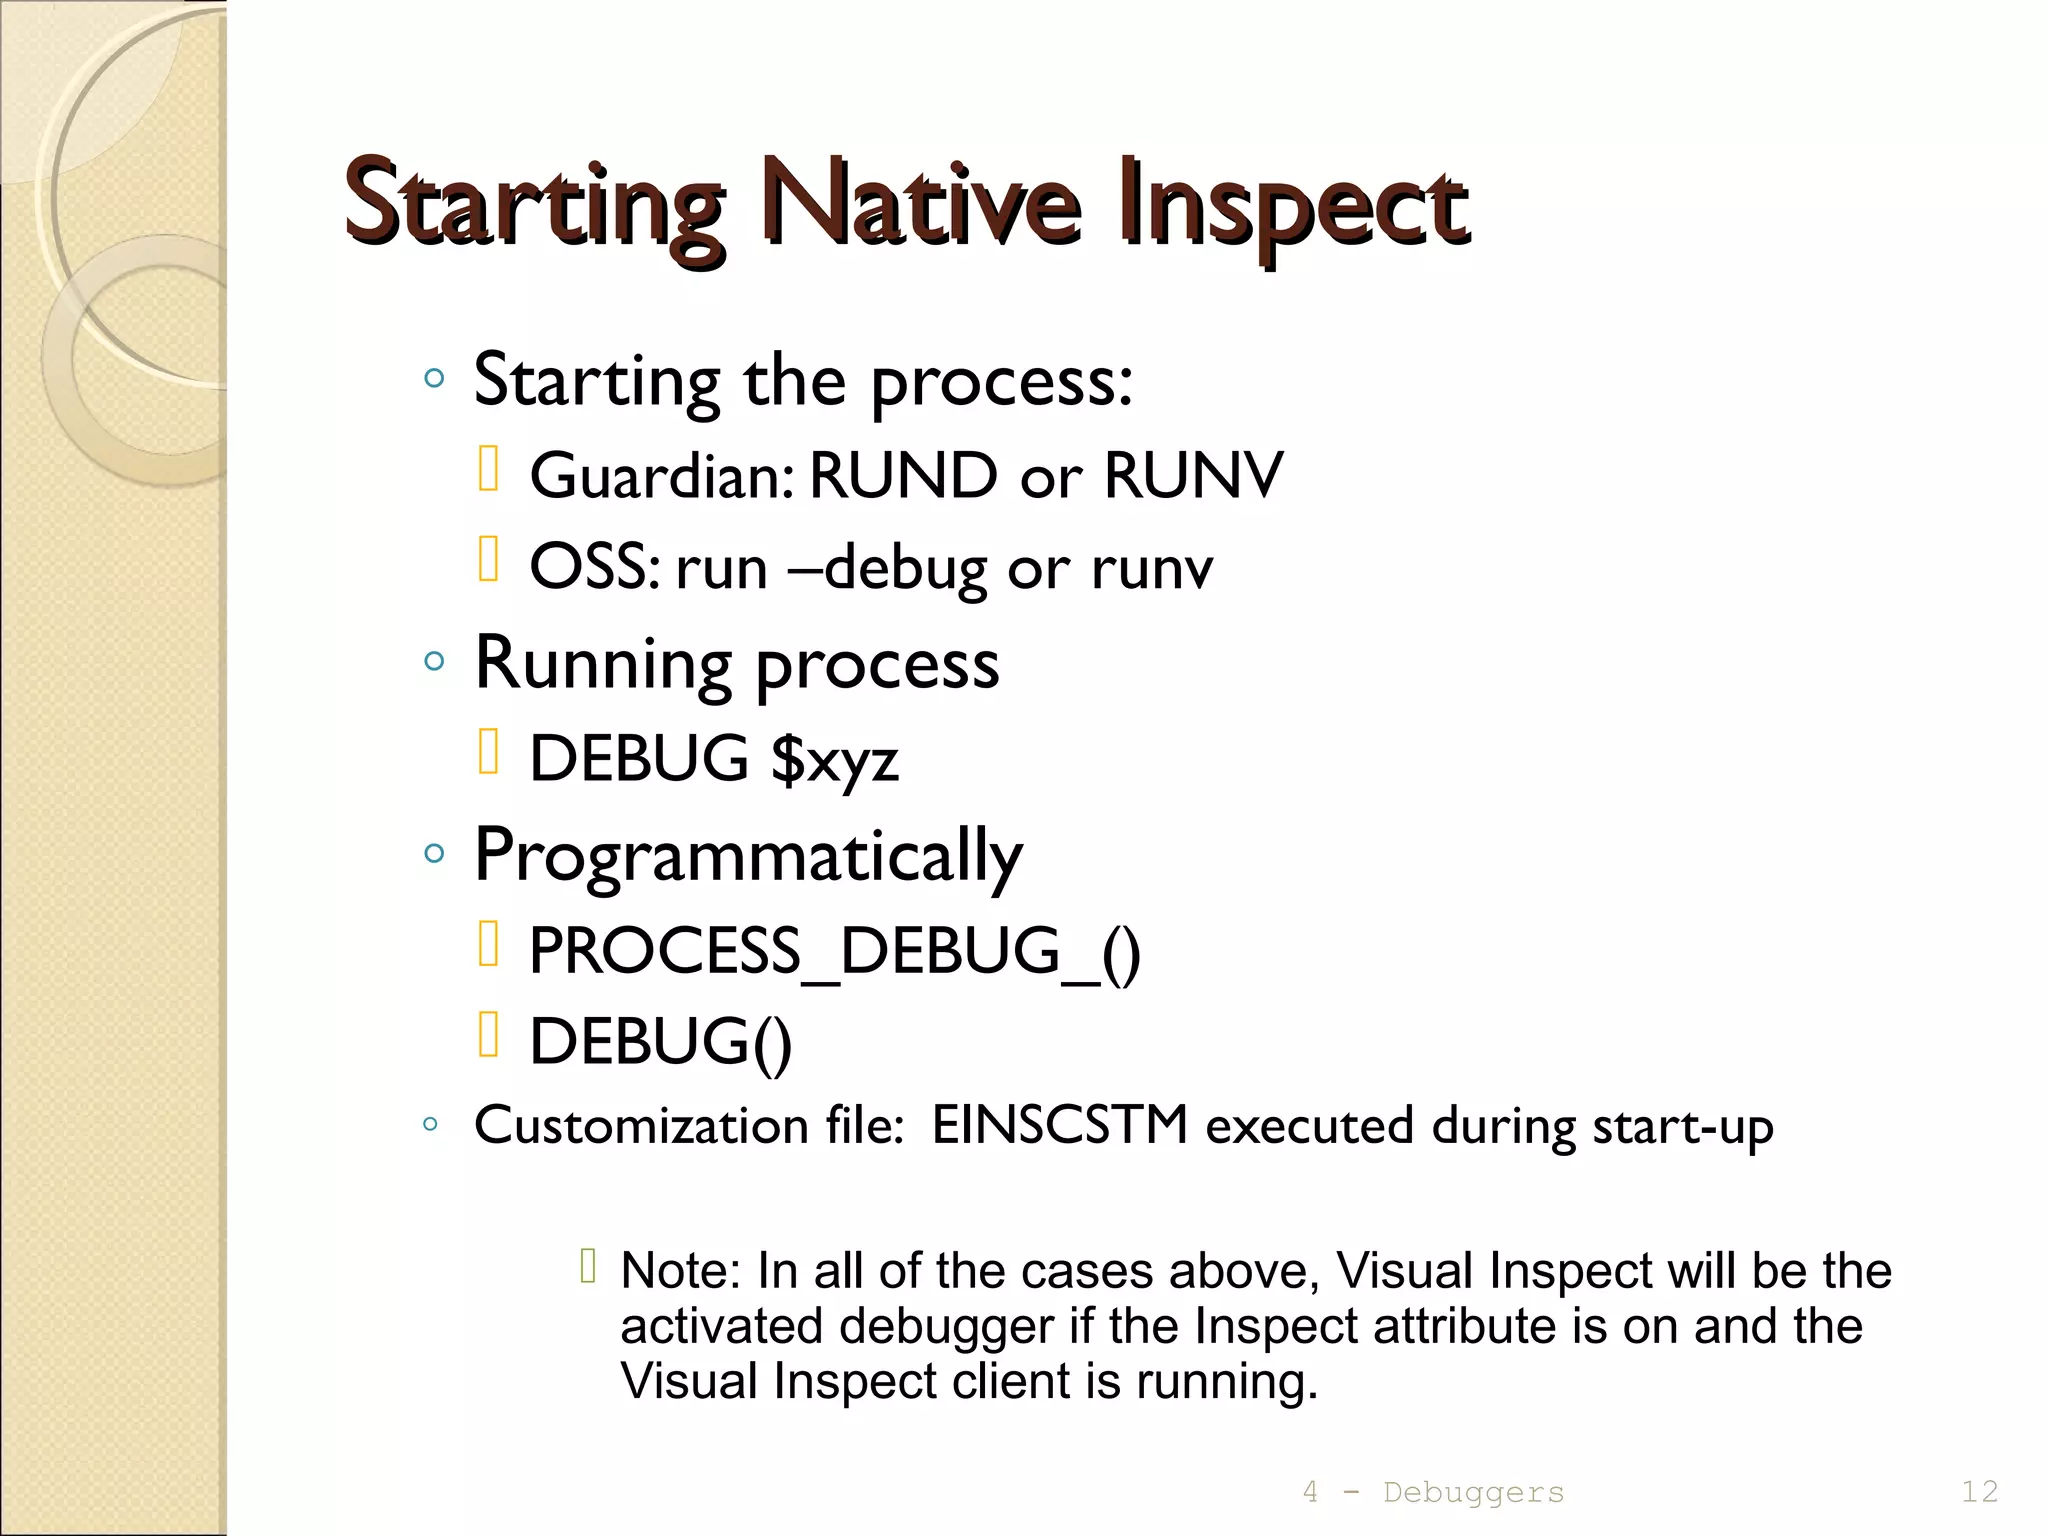
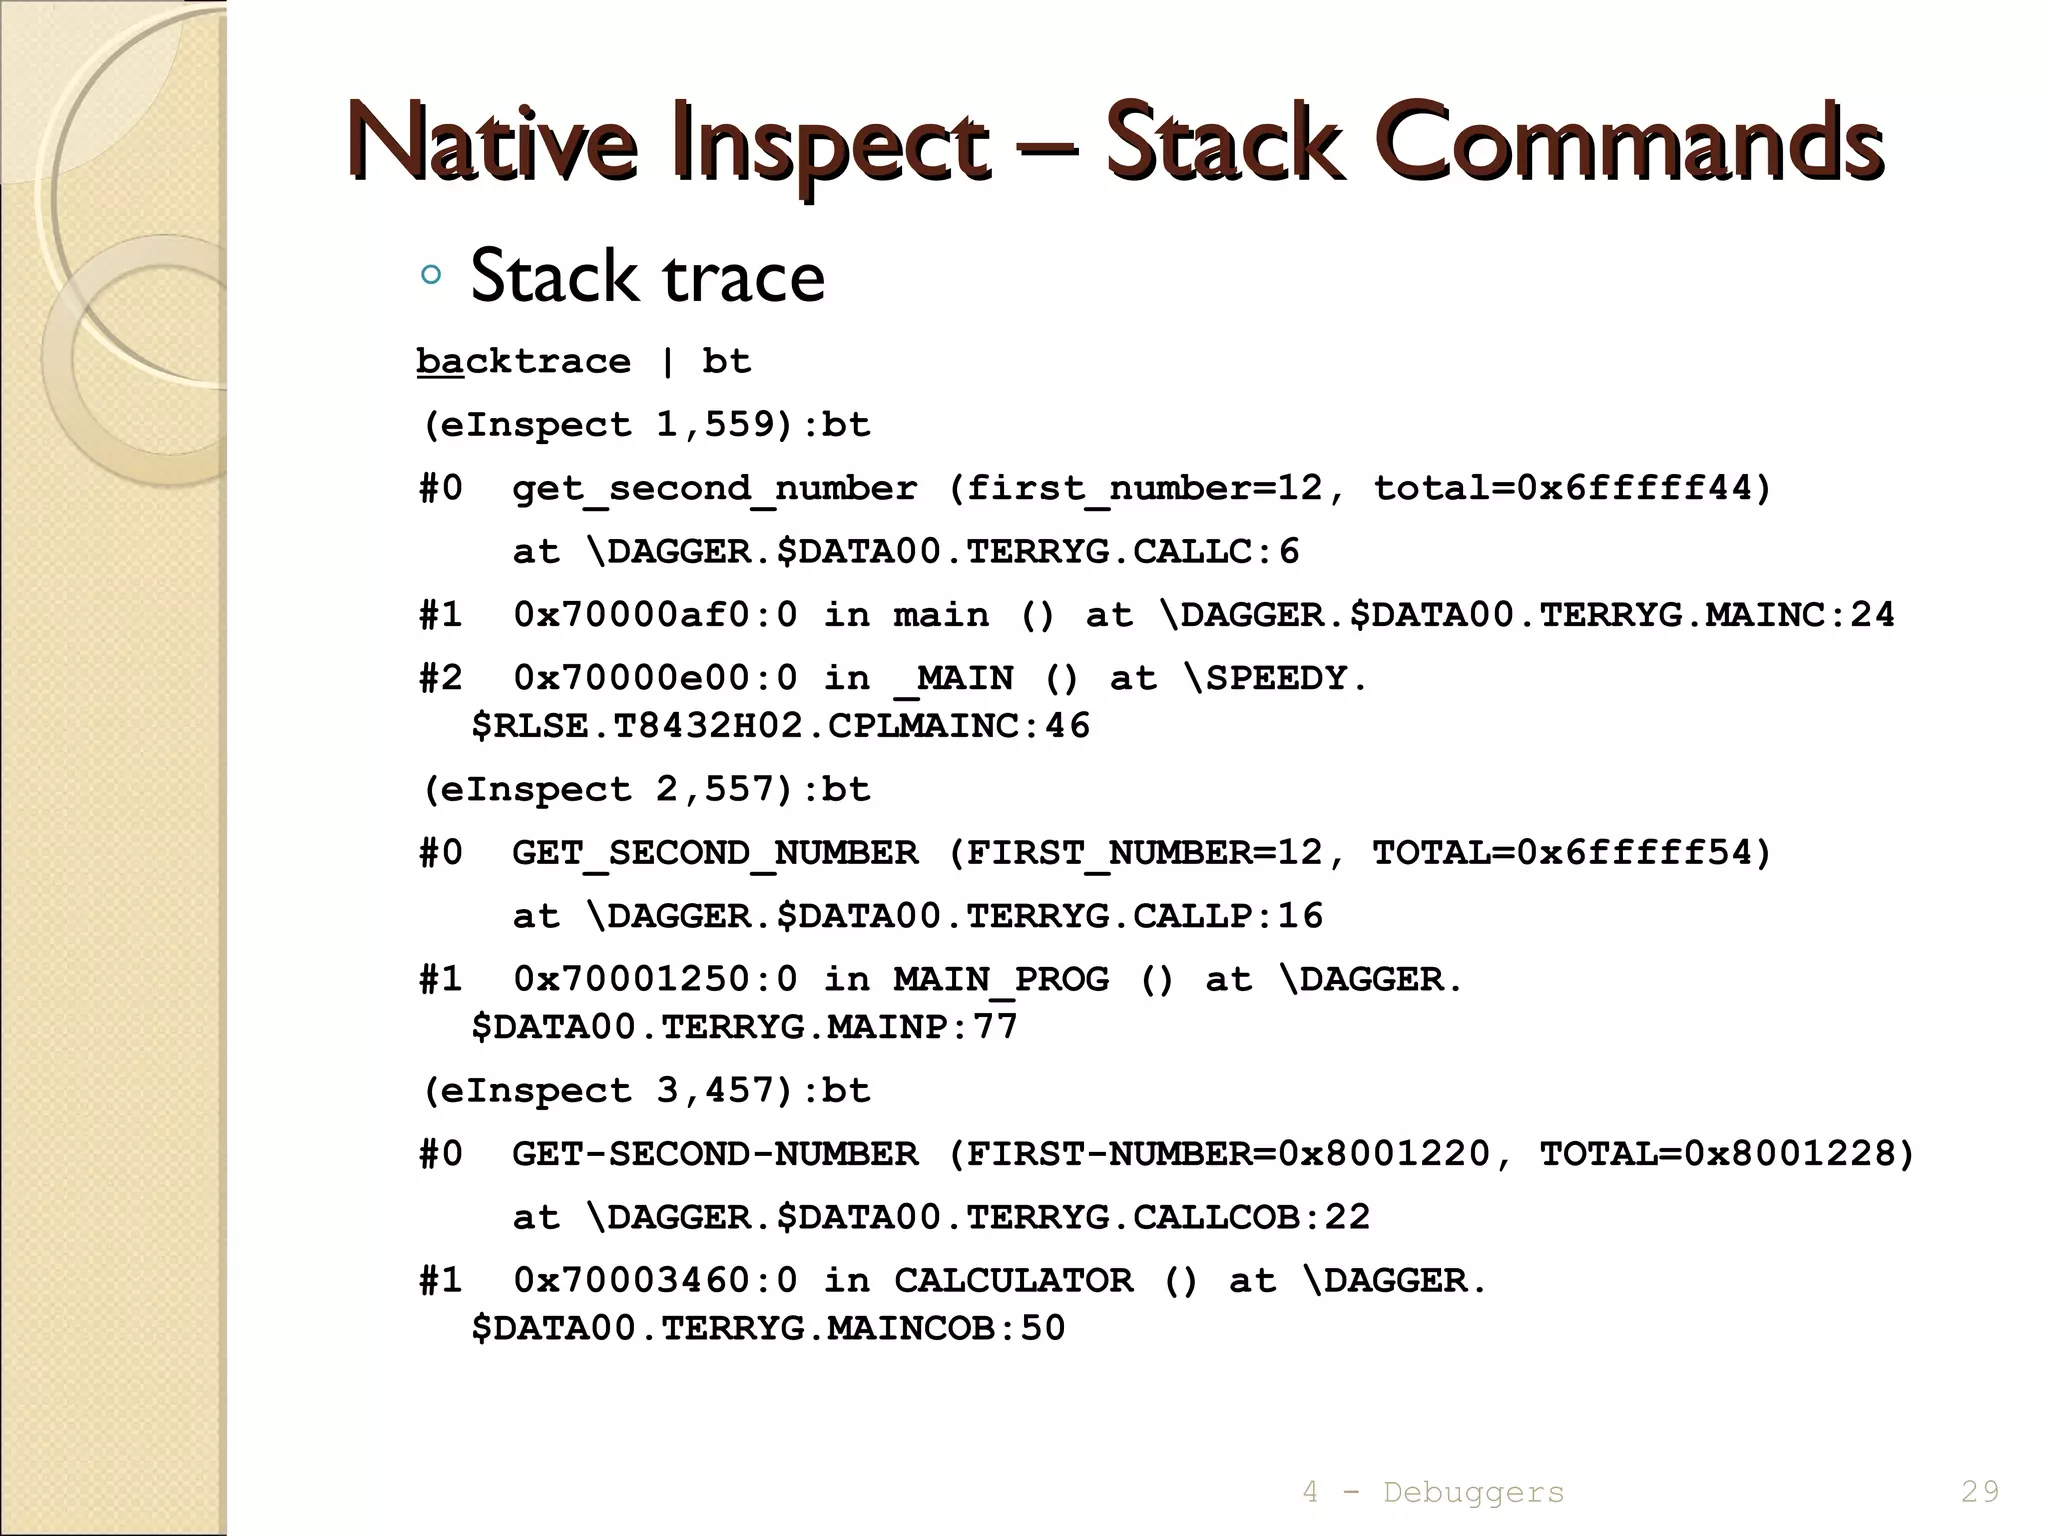
This document provides an overview of the available debuggers and key features of the Visual Inspect and Native Inspect debuggers. Visual Inspect is preferred for most uses and supports debugging TNS/E and TNS programs. Native Inspect is based on GDB/WDB and uses UNIX-style commands, supporting TNS/E, TNS and COBOL programs. Both debuggers allow setting breakpoints, examining variables, and stepping through code.


![How to Design a Great API (using flask) [ploneconf2017]](https://cdn.slidesharecdn.com/ss_thumbnails/howtodesignagreatapiusingflaskplone2017-171018104226-thumbnail.jpg?width=640&height=640&fit=bounds)


![Sergi Álvarez & Roi Martín - Radare2 Preview [RootedCON 2010]](https://cdn.slidesharecdn.com/ss_thumbnails/sergialvarezroimartin-radare2preview-100328043046-phpapp02-thumbnail.jpg?width=640&height=640&fit=bounds)


![Lean React - Patterns for High Performance [ploneconf2017]](https://cdn.slidesharecdn.com/ss_thumbnails/leanreactflat-patternsforhighperformanceplone2017-171020111110-thumbnail.jpg?width=640&height=640&fit=bounds)