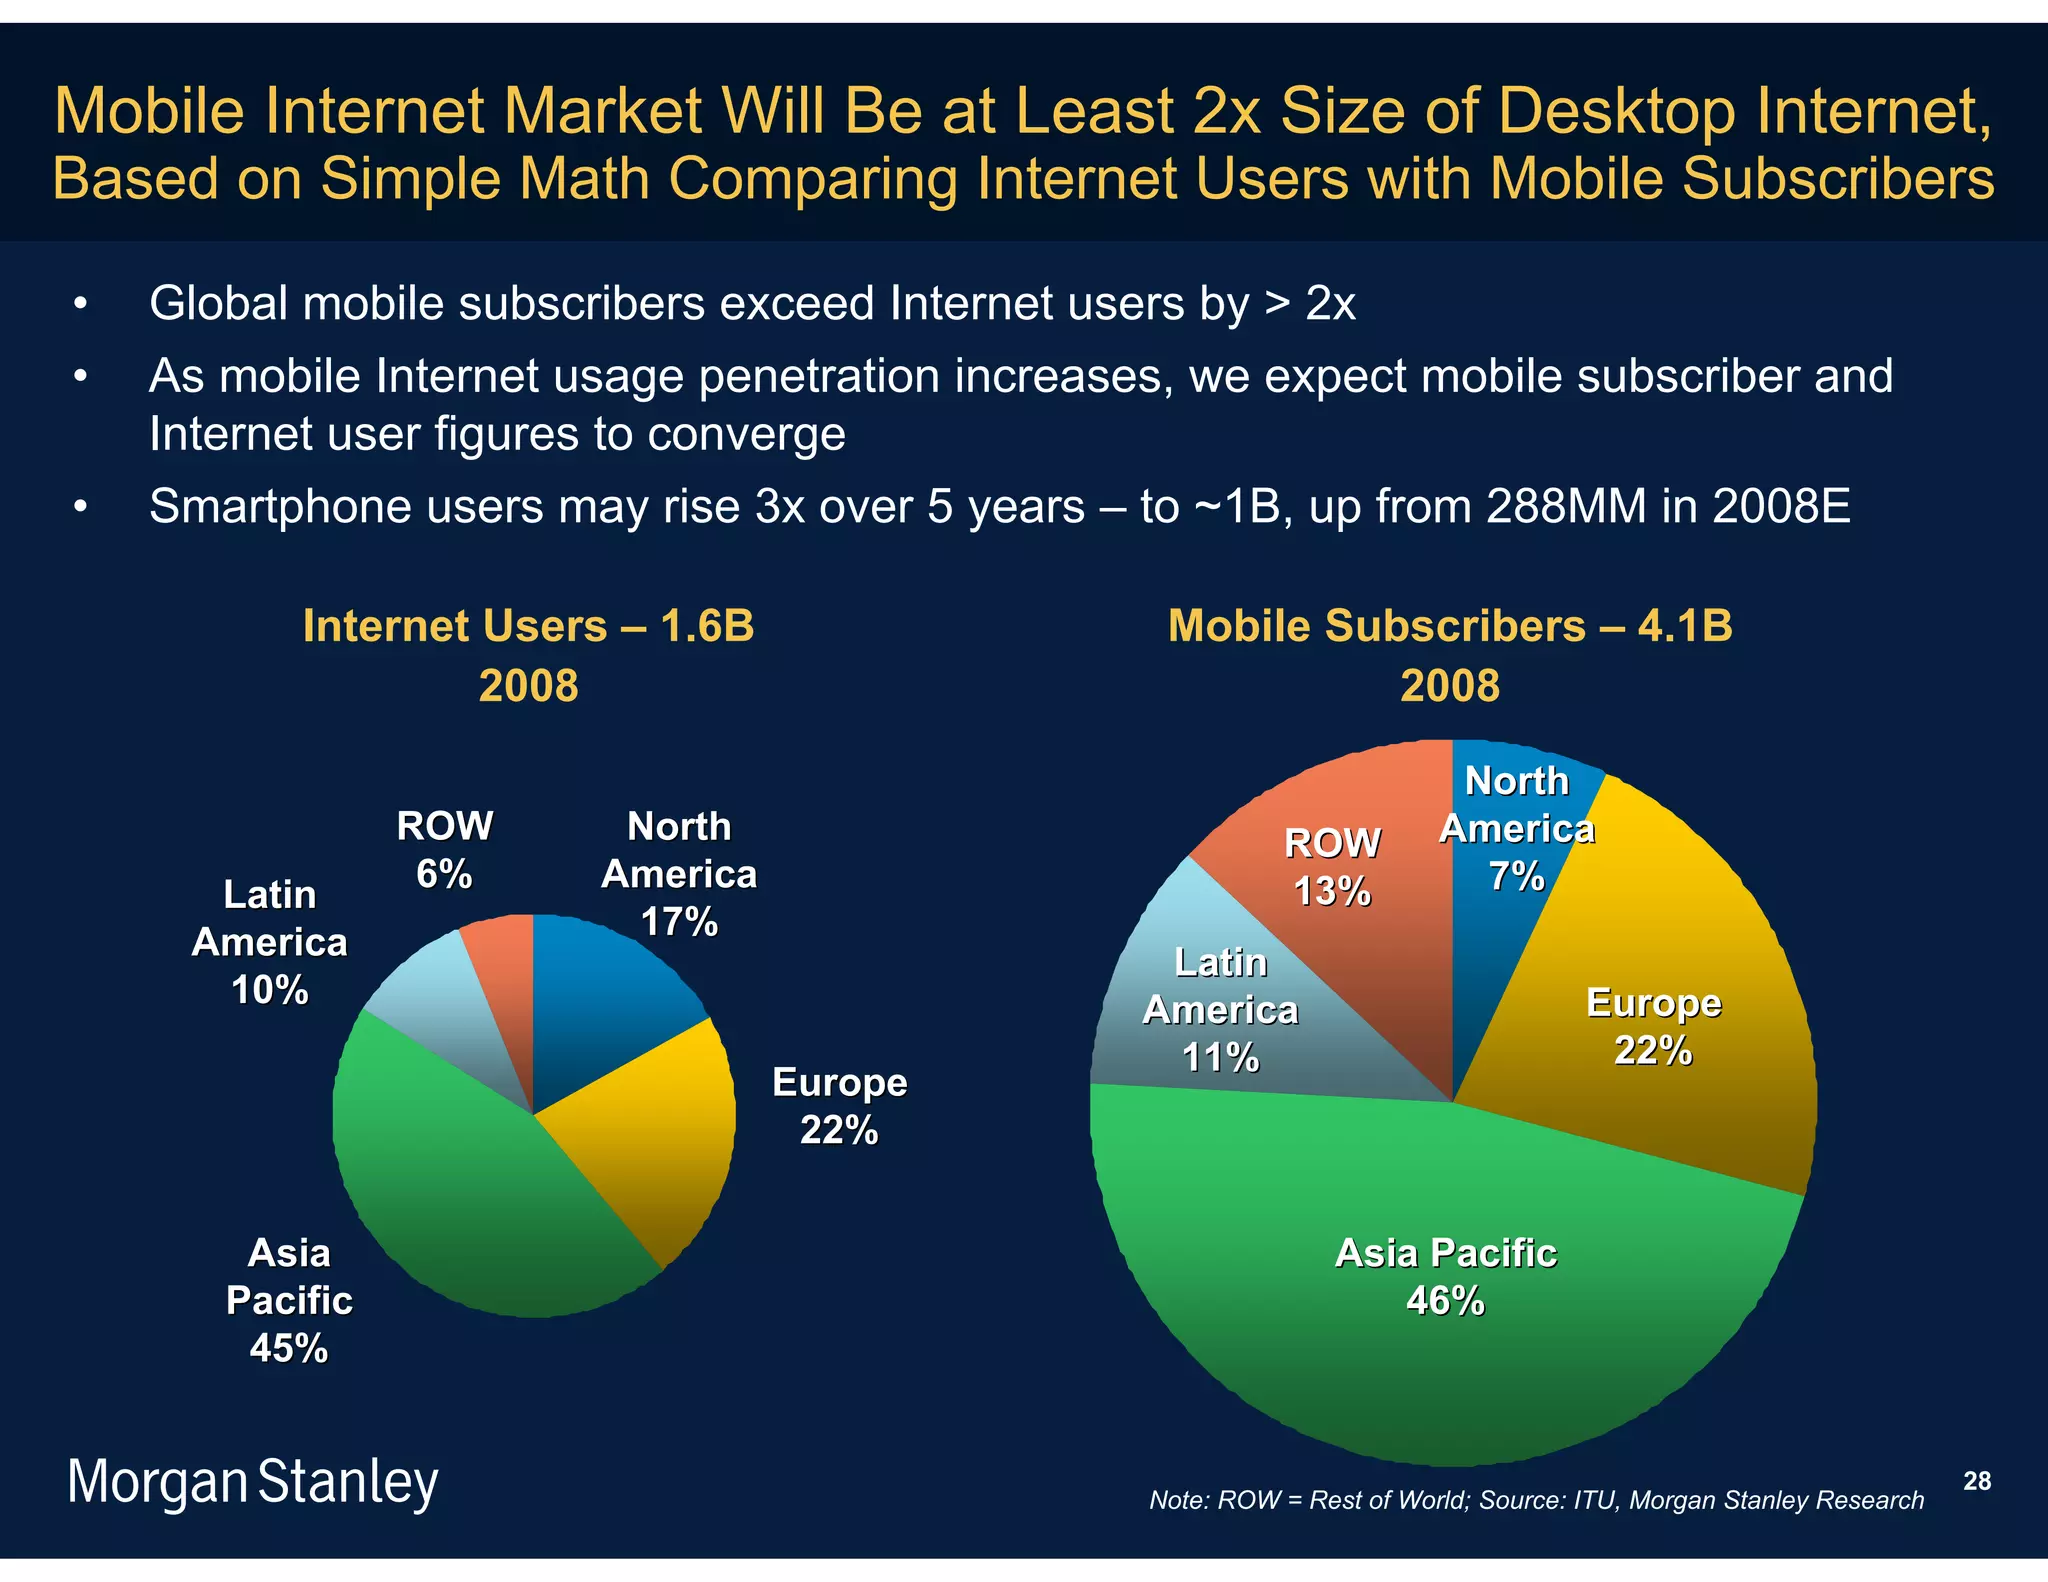
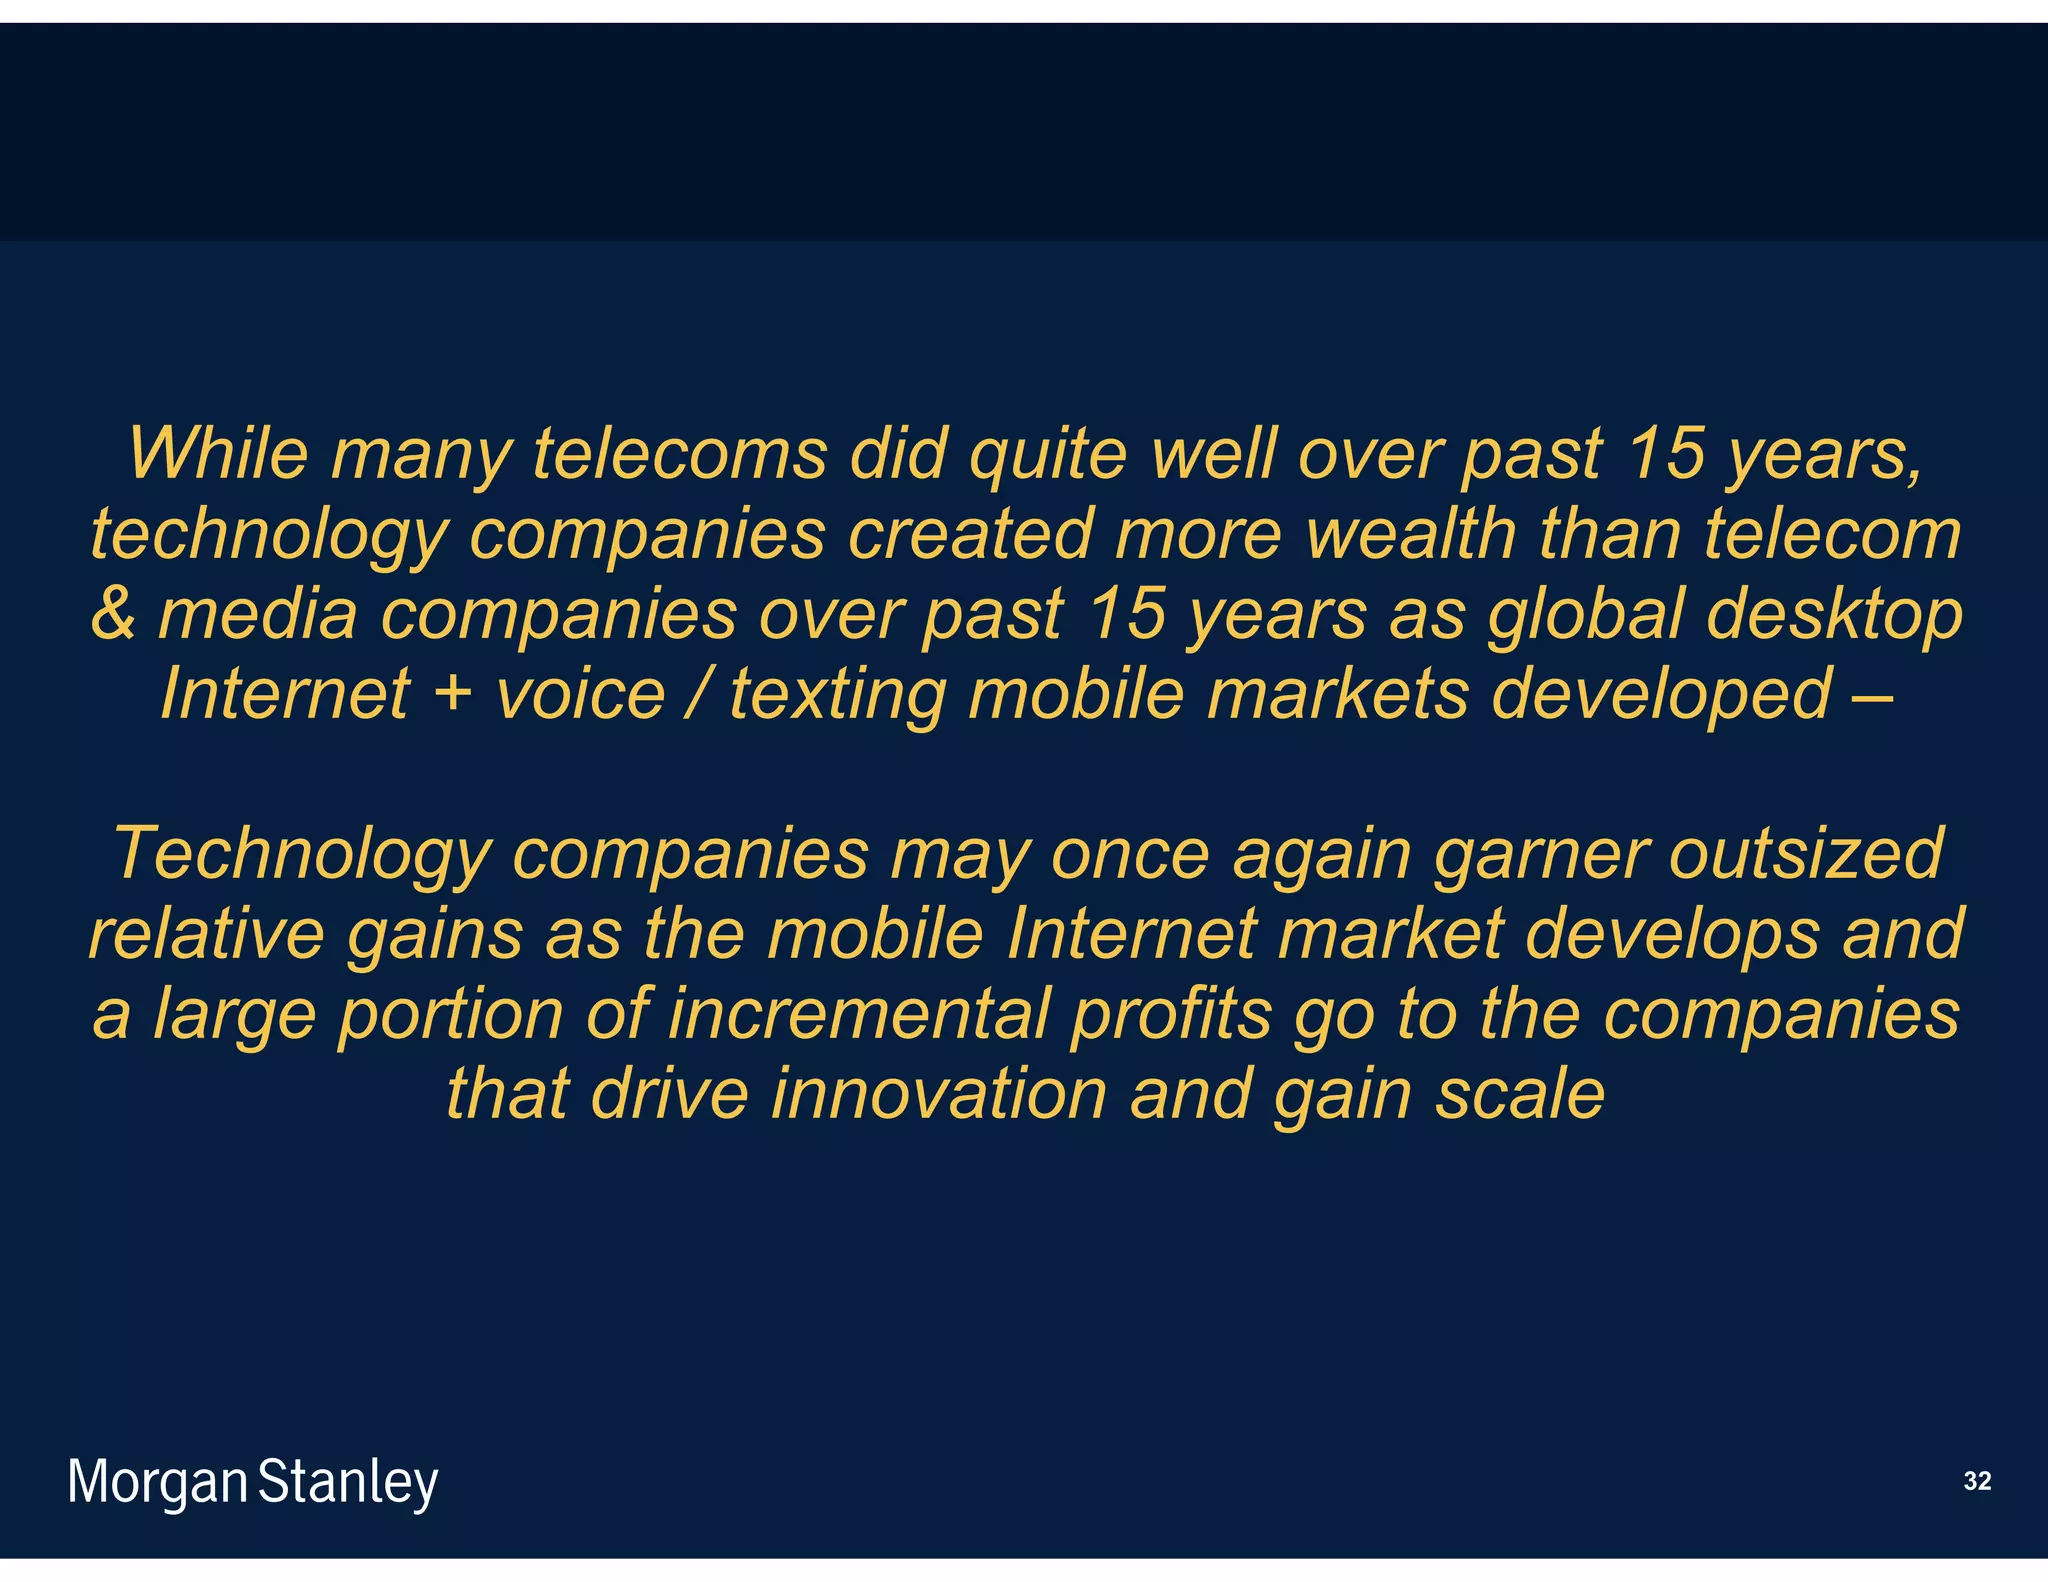
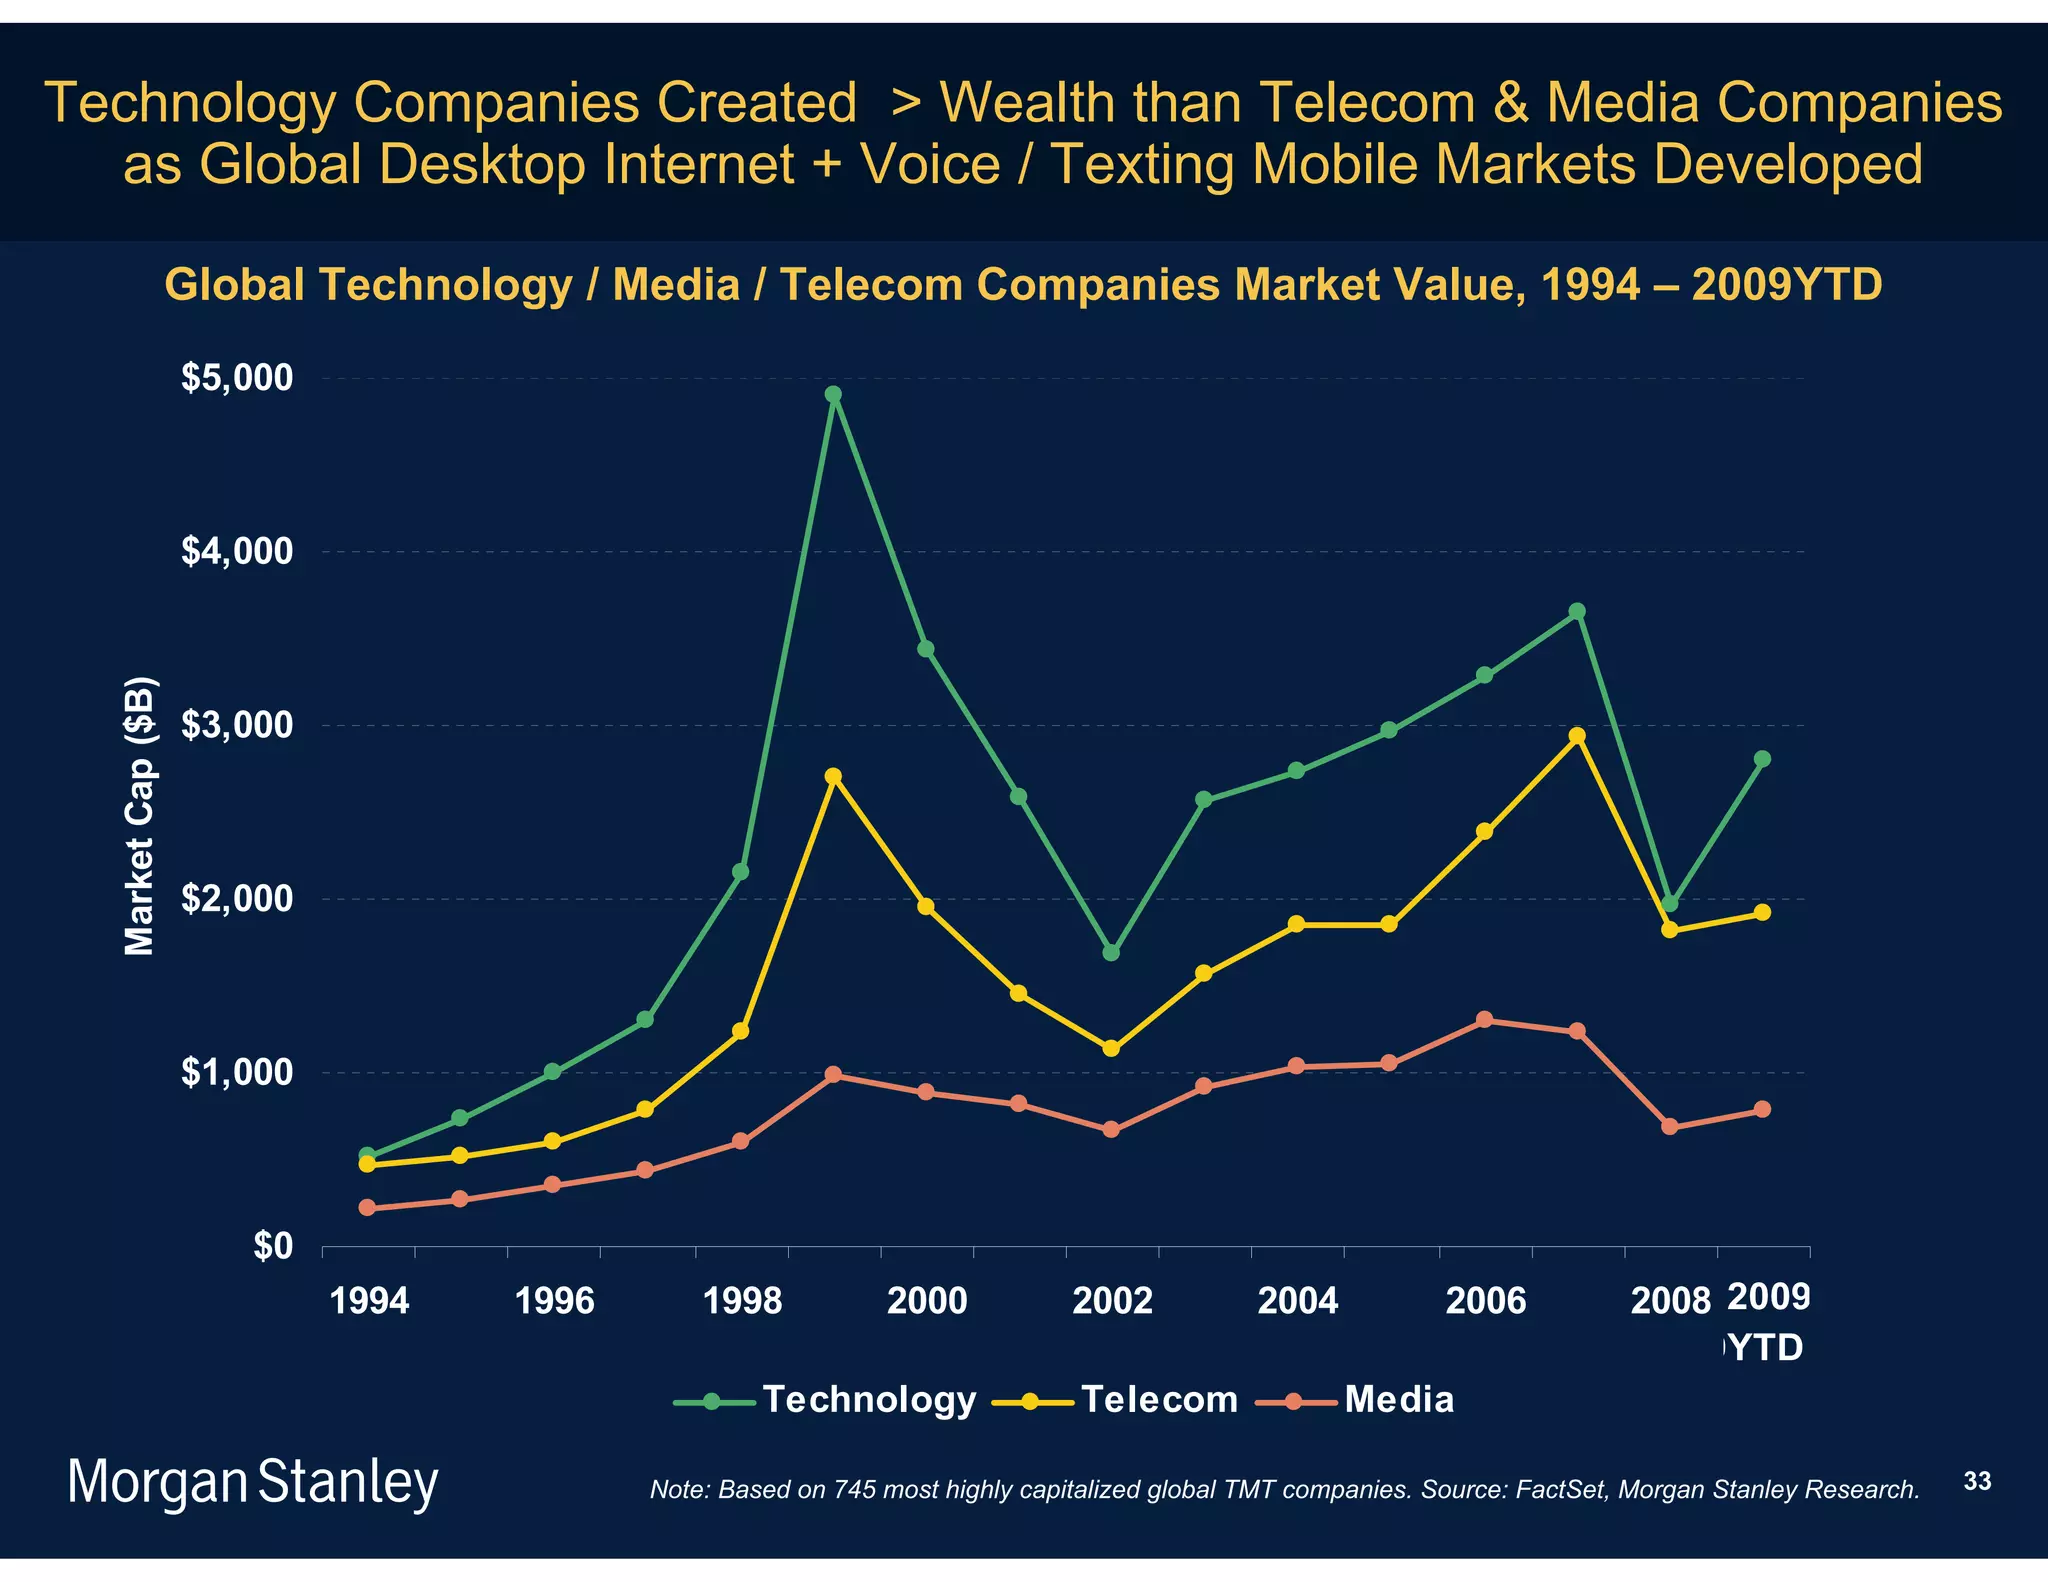
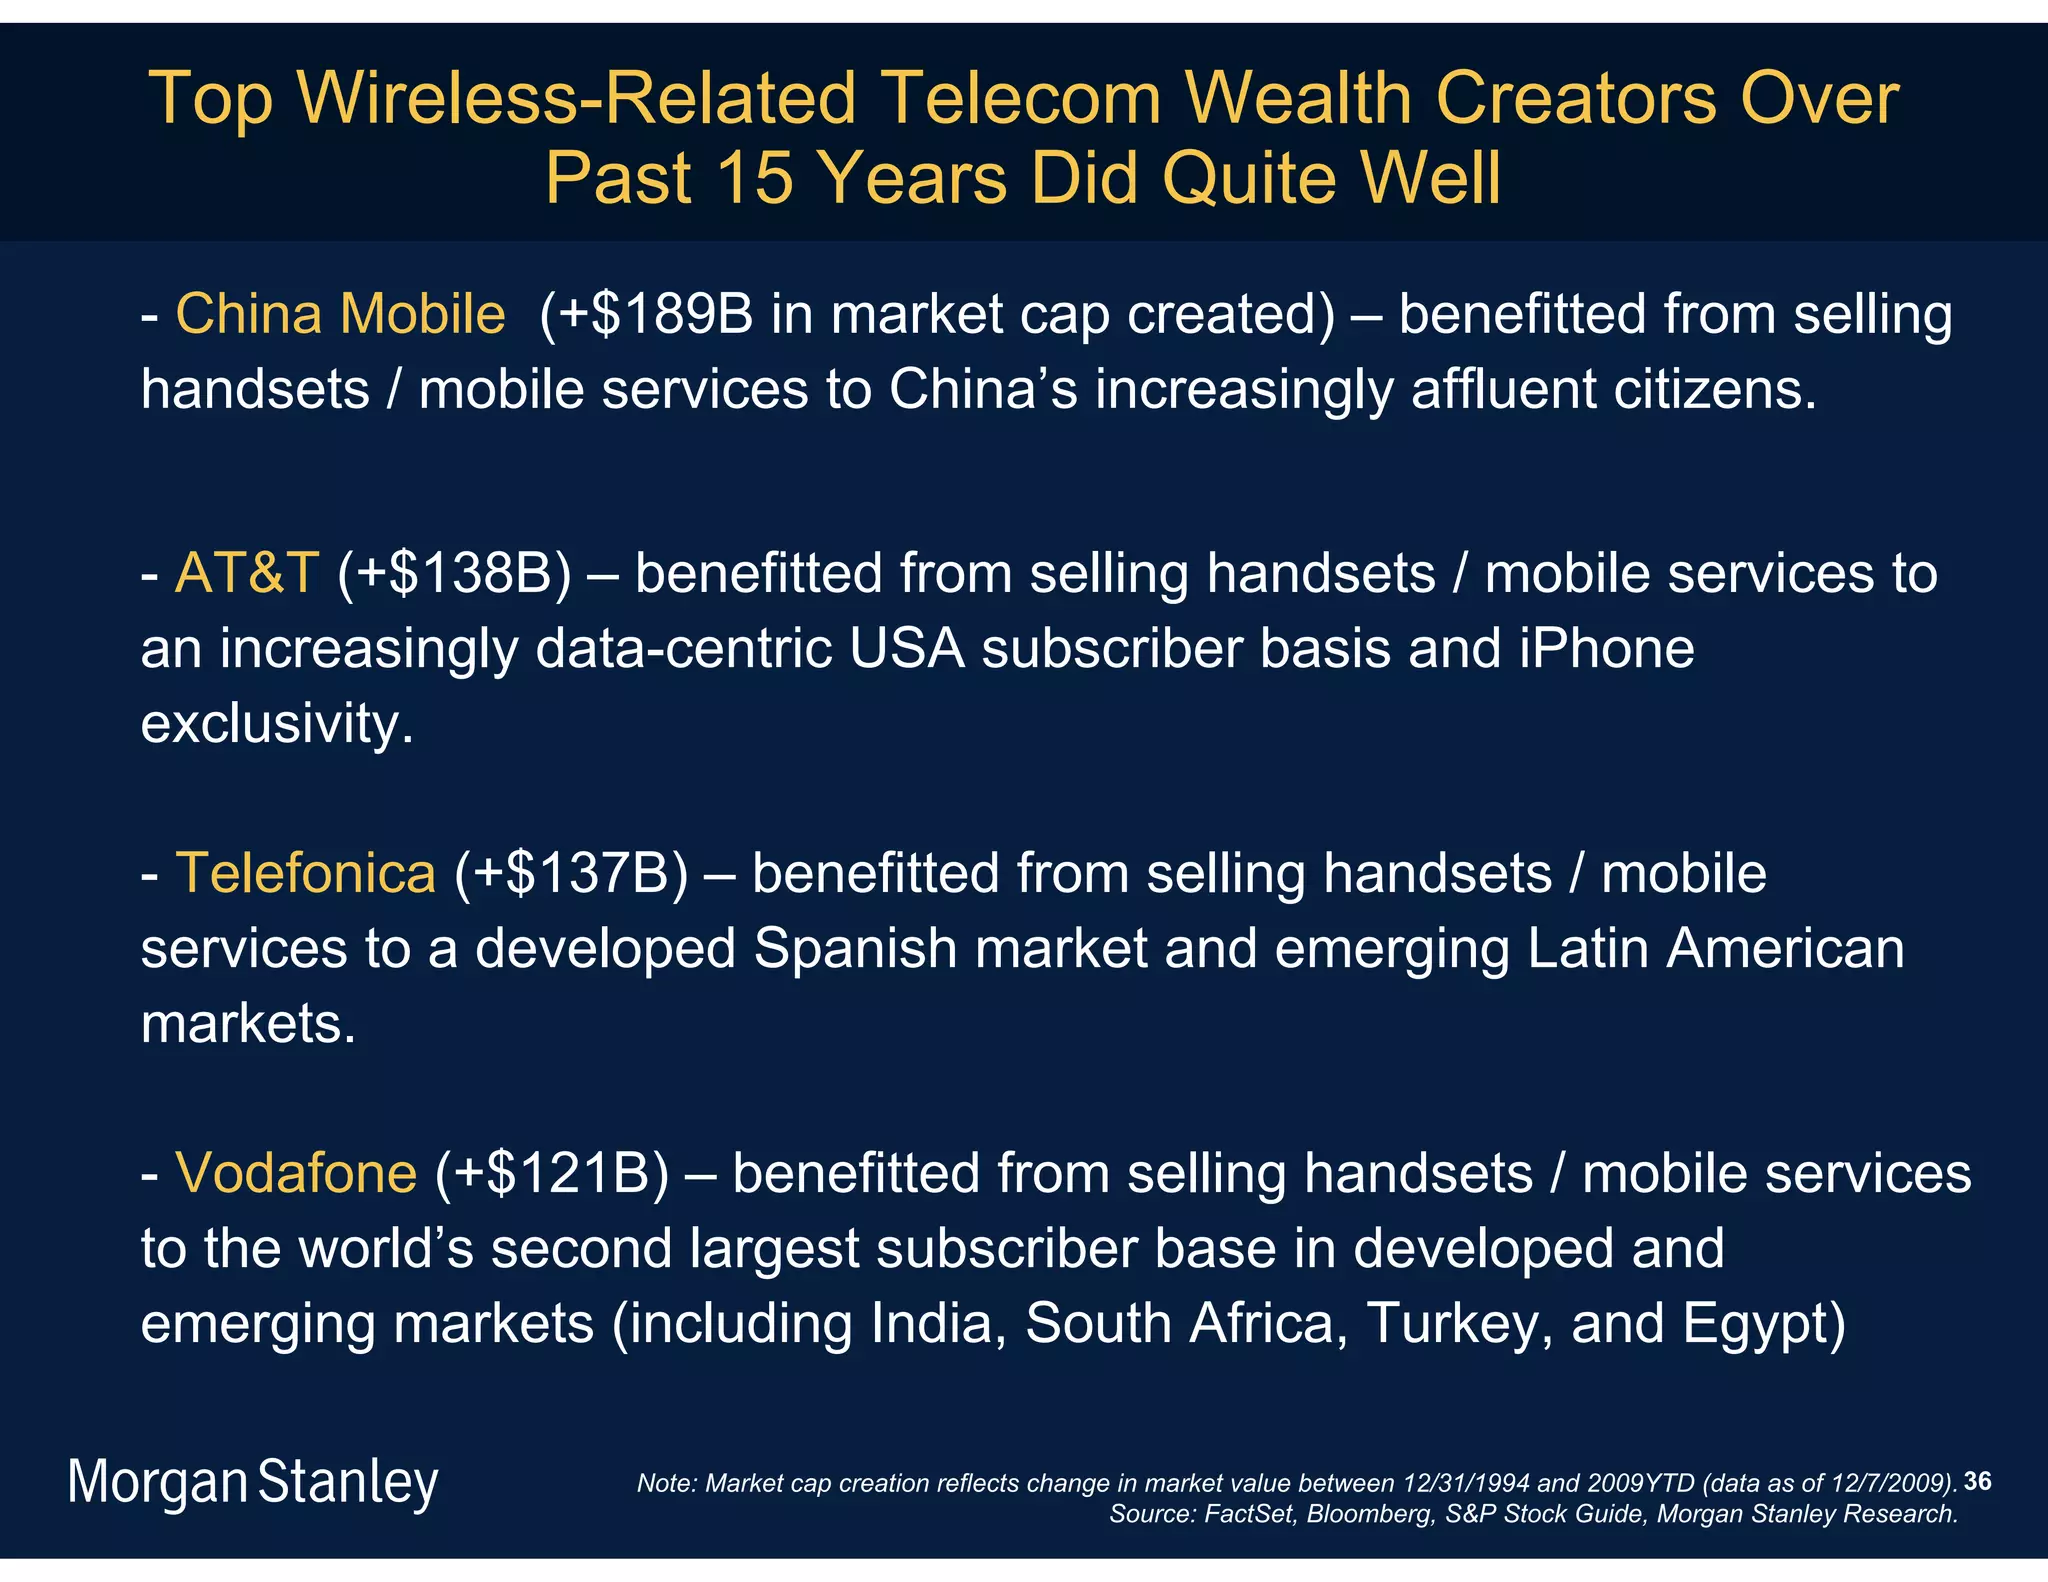
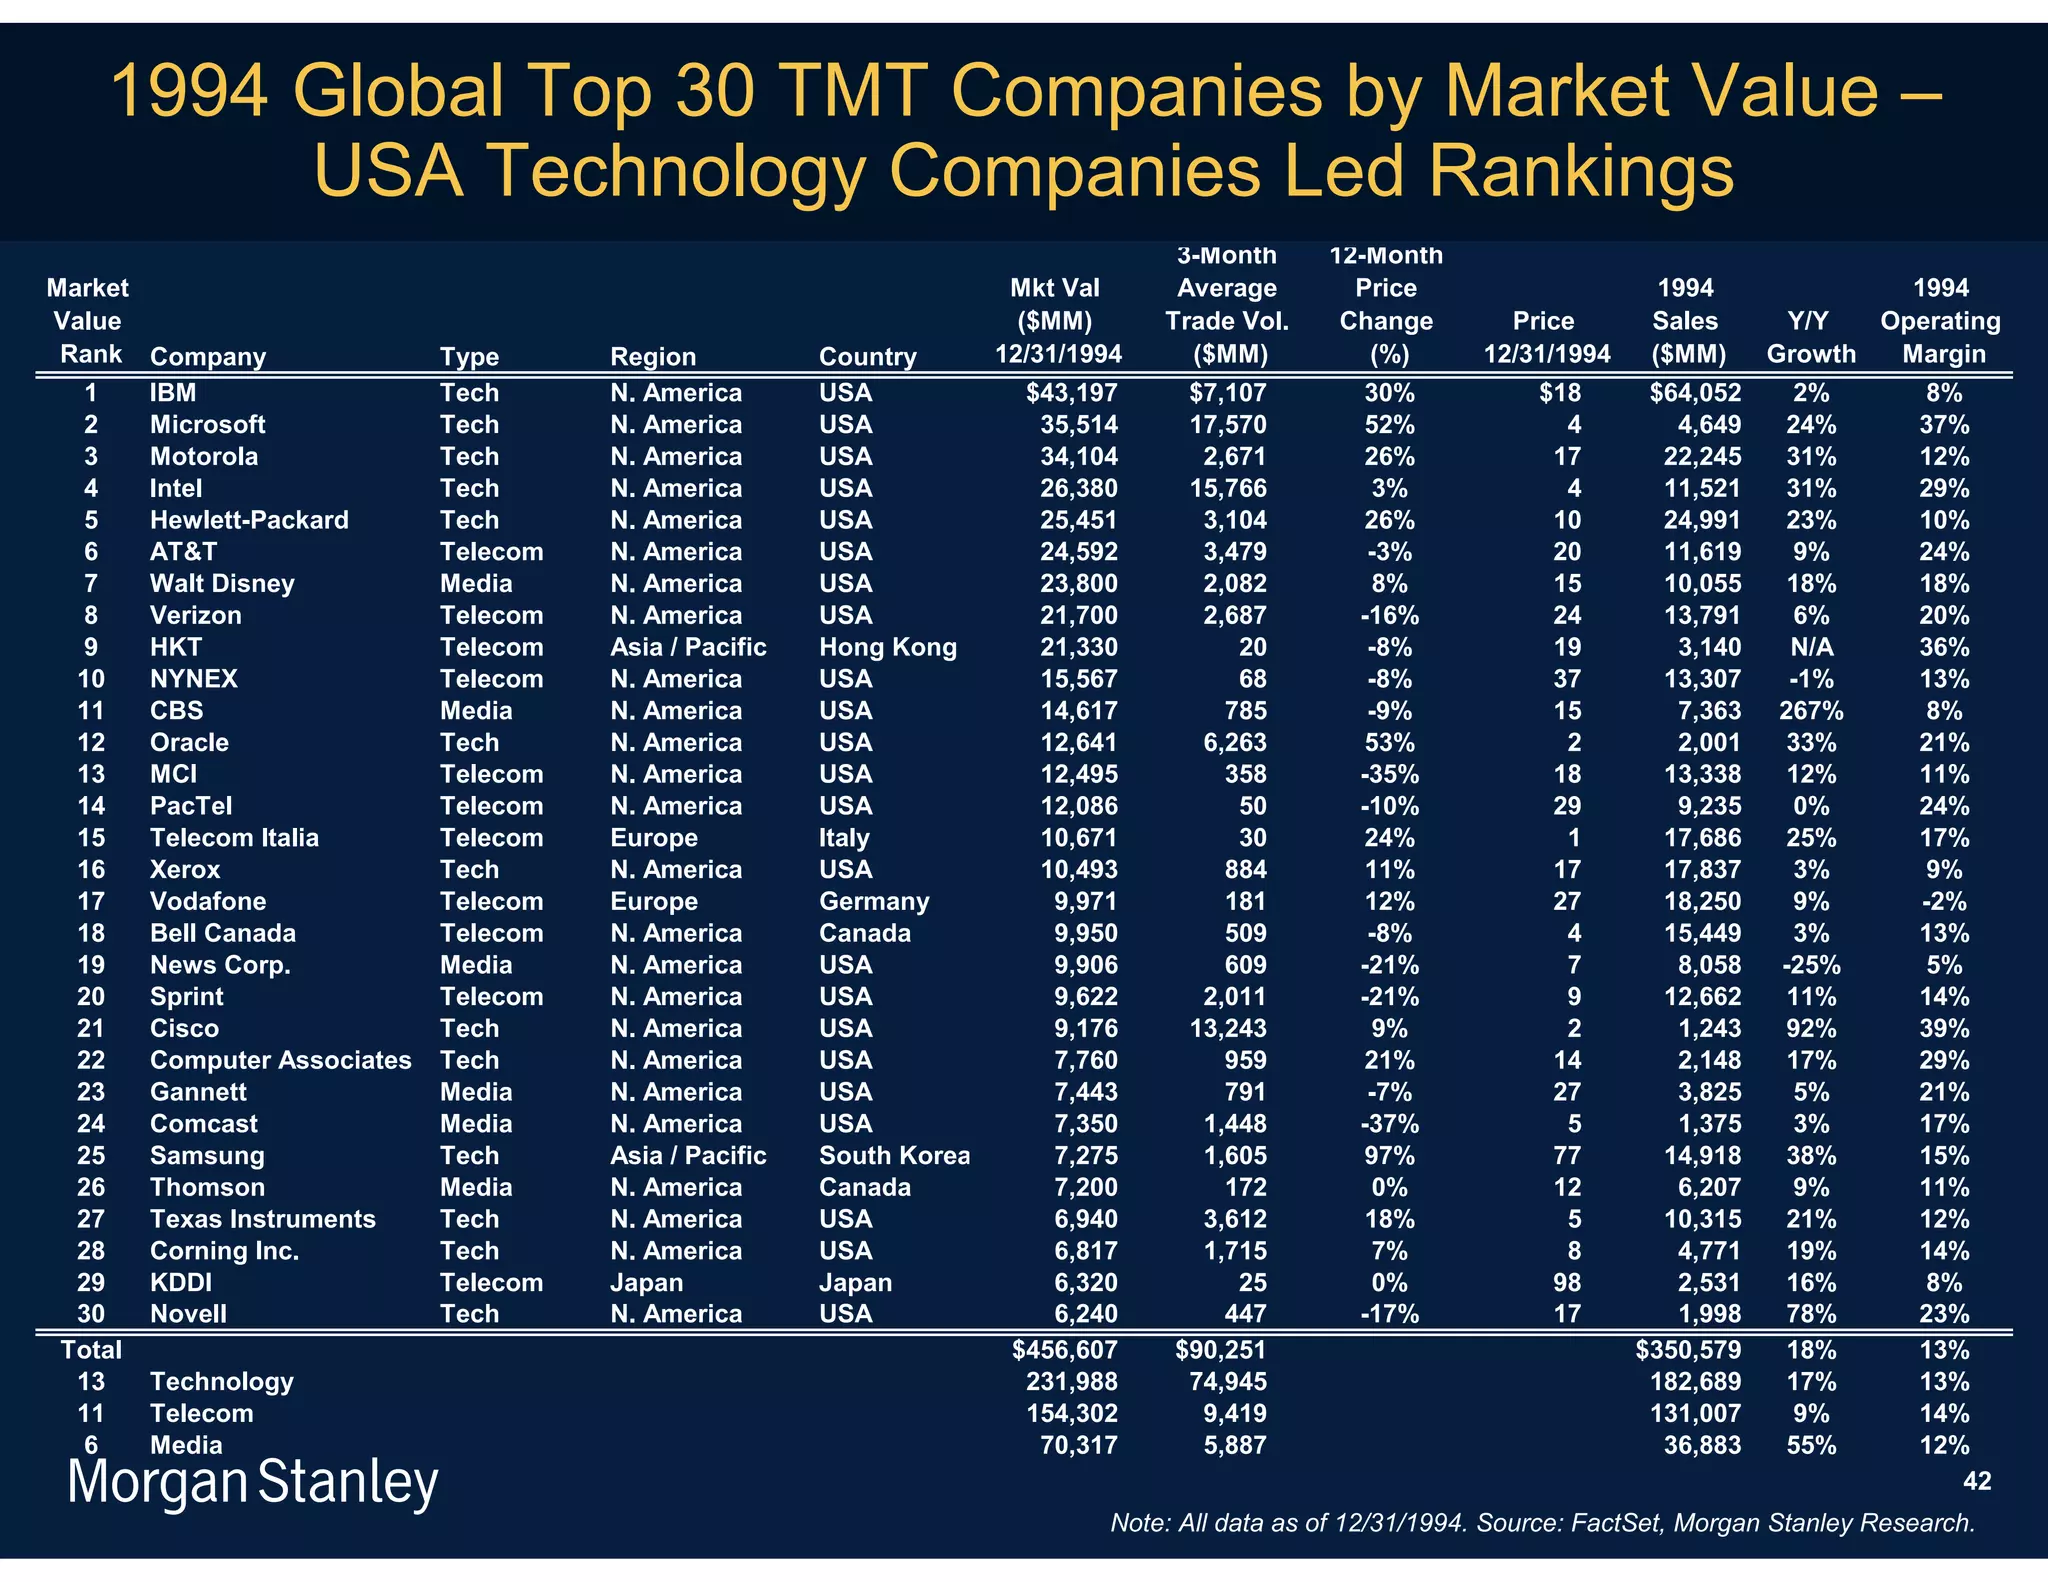
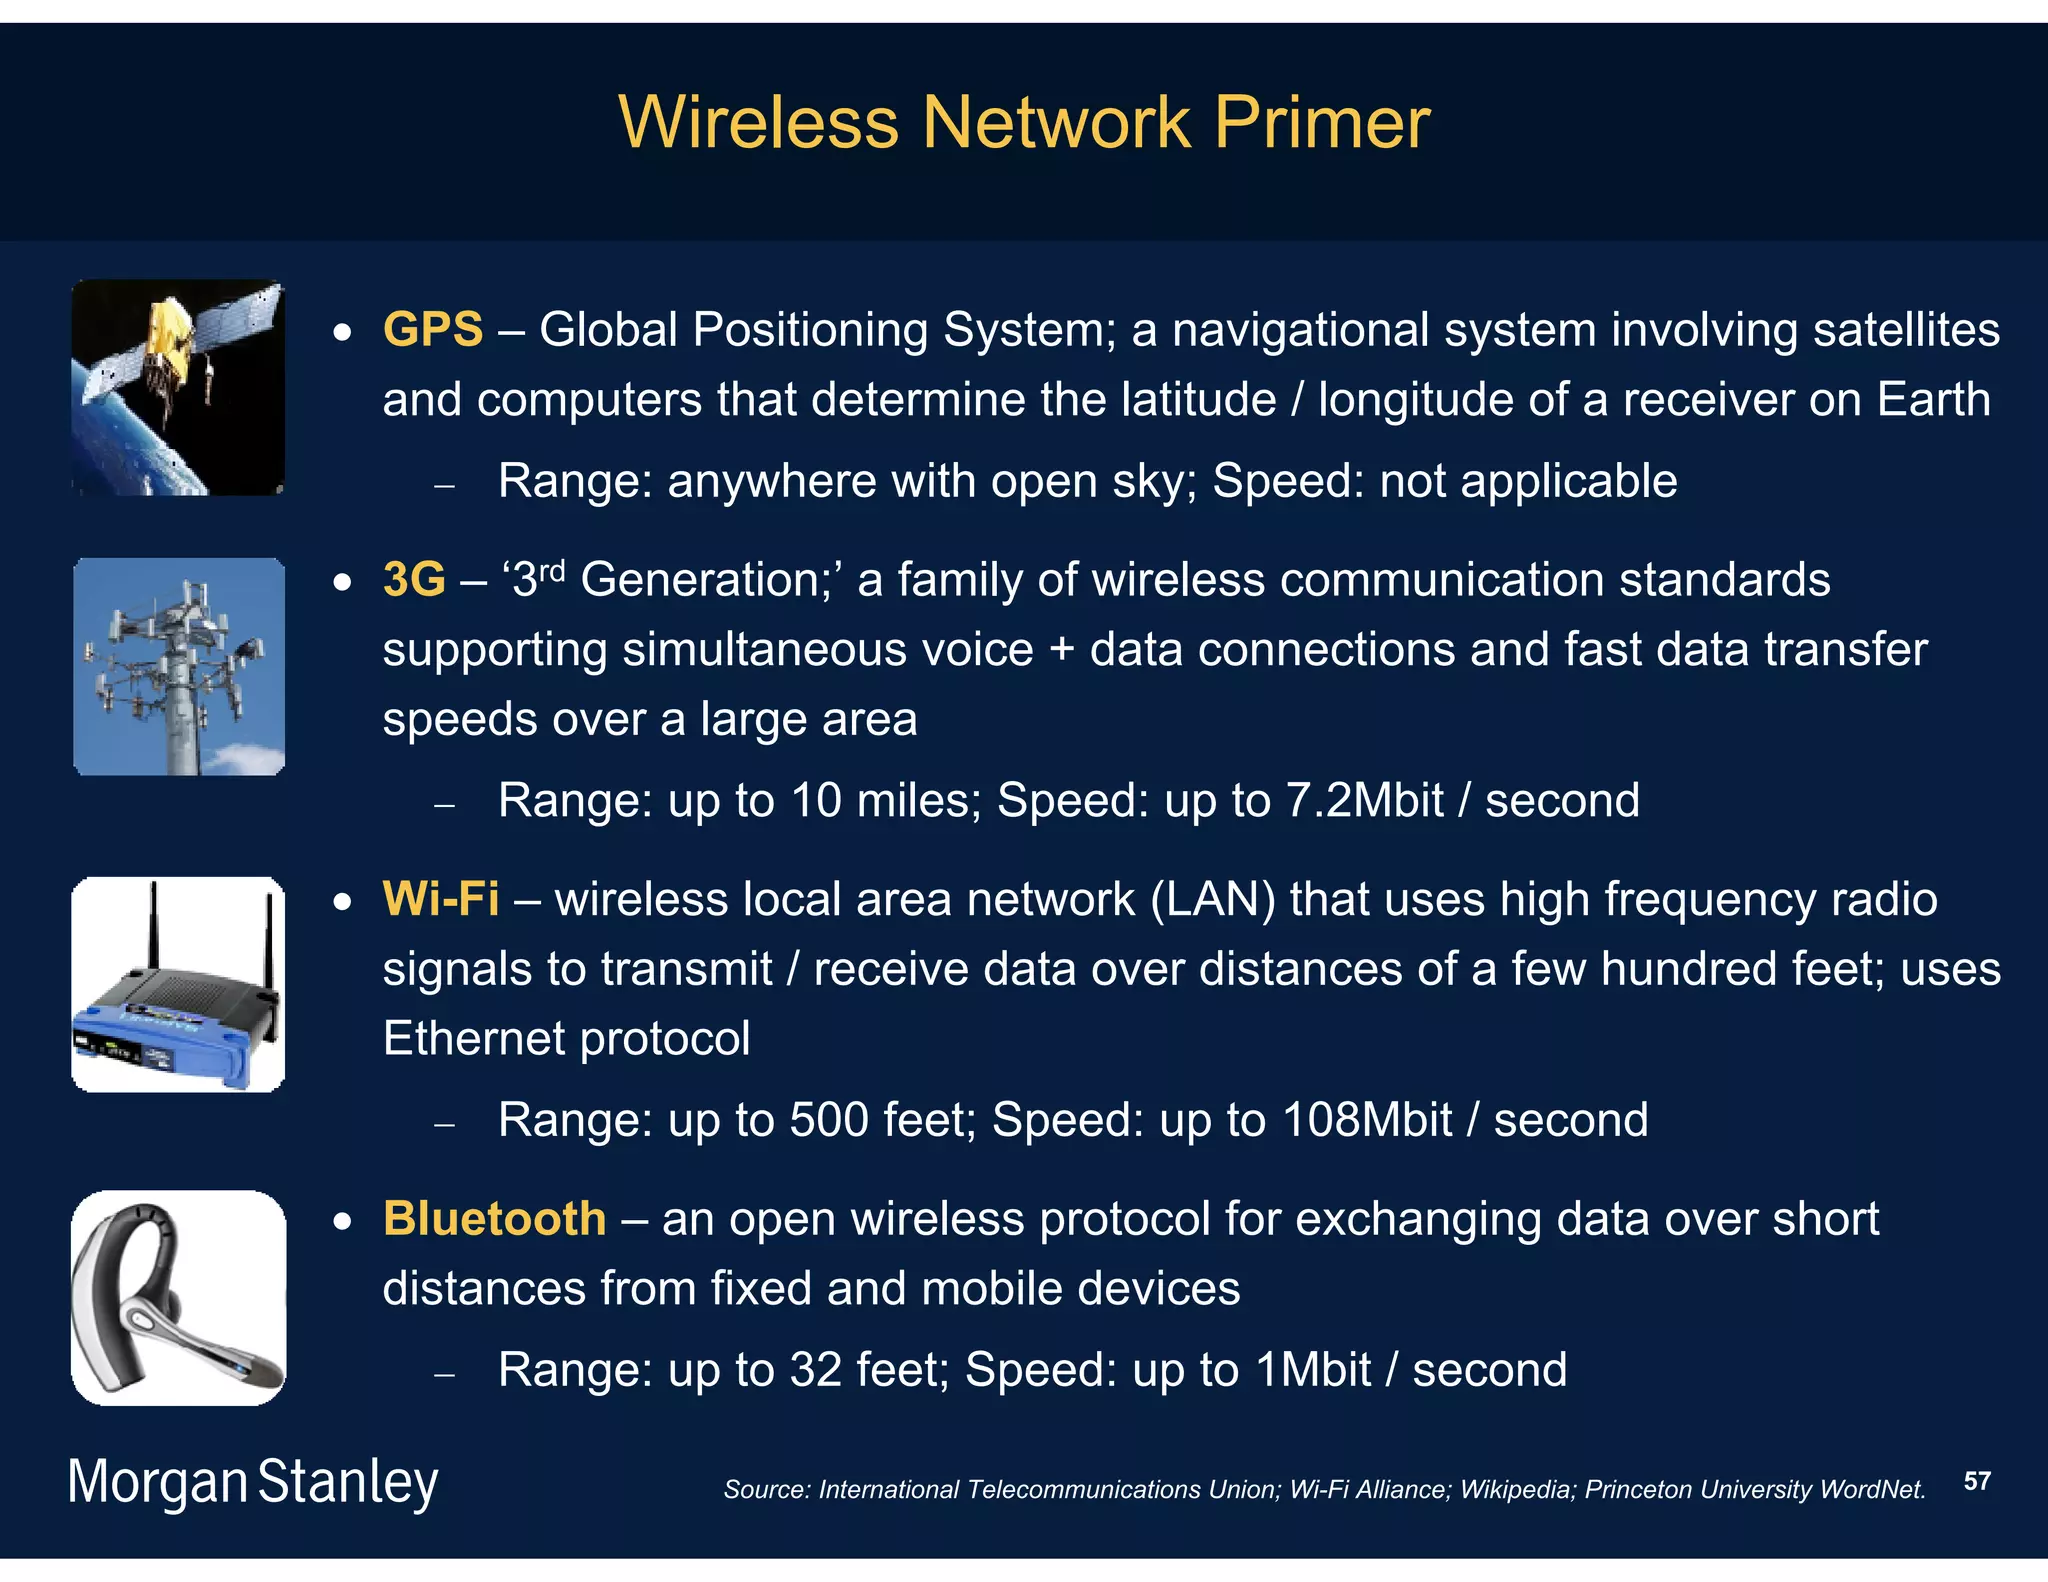
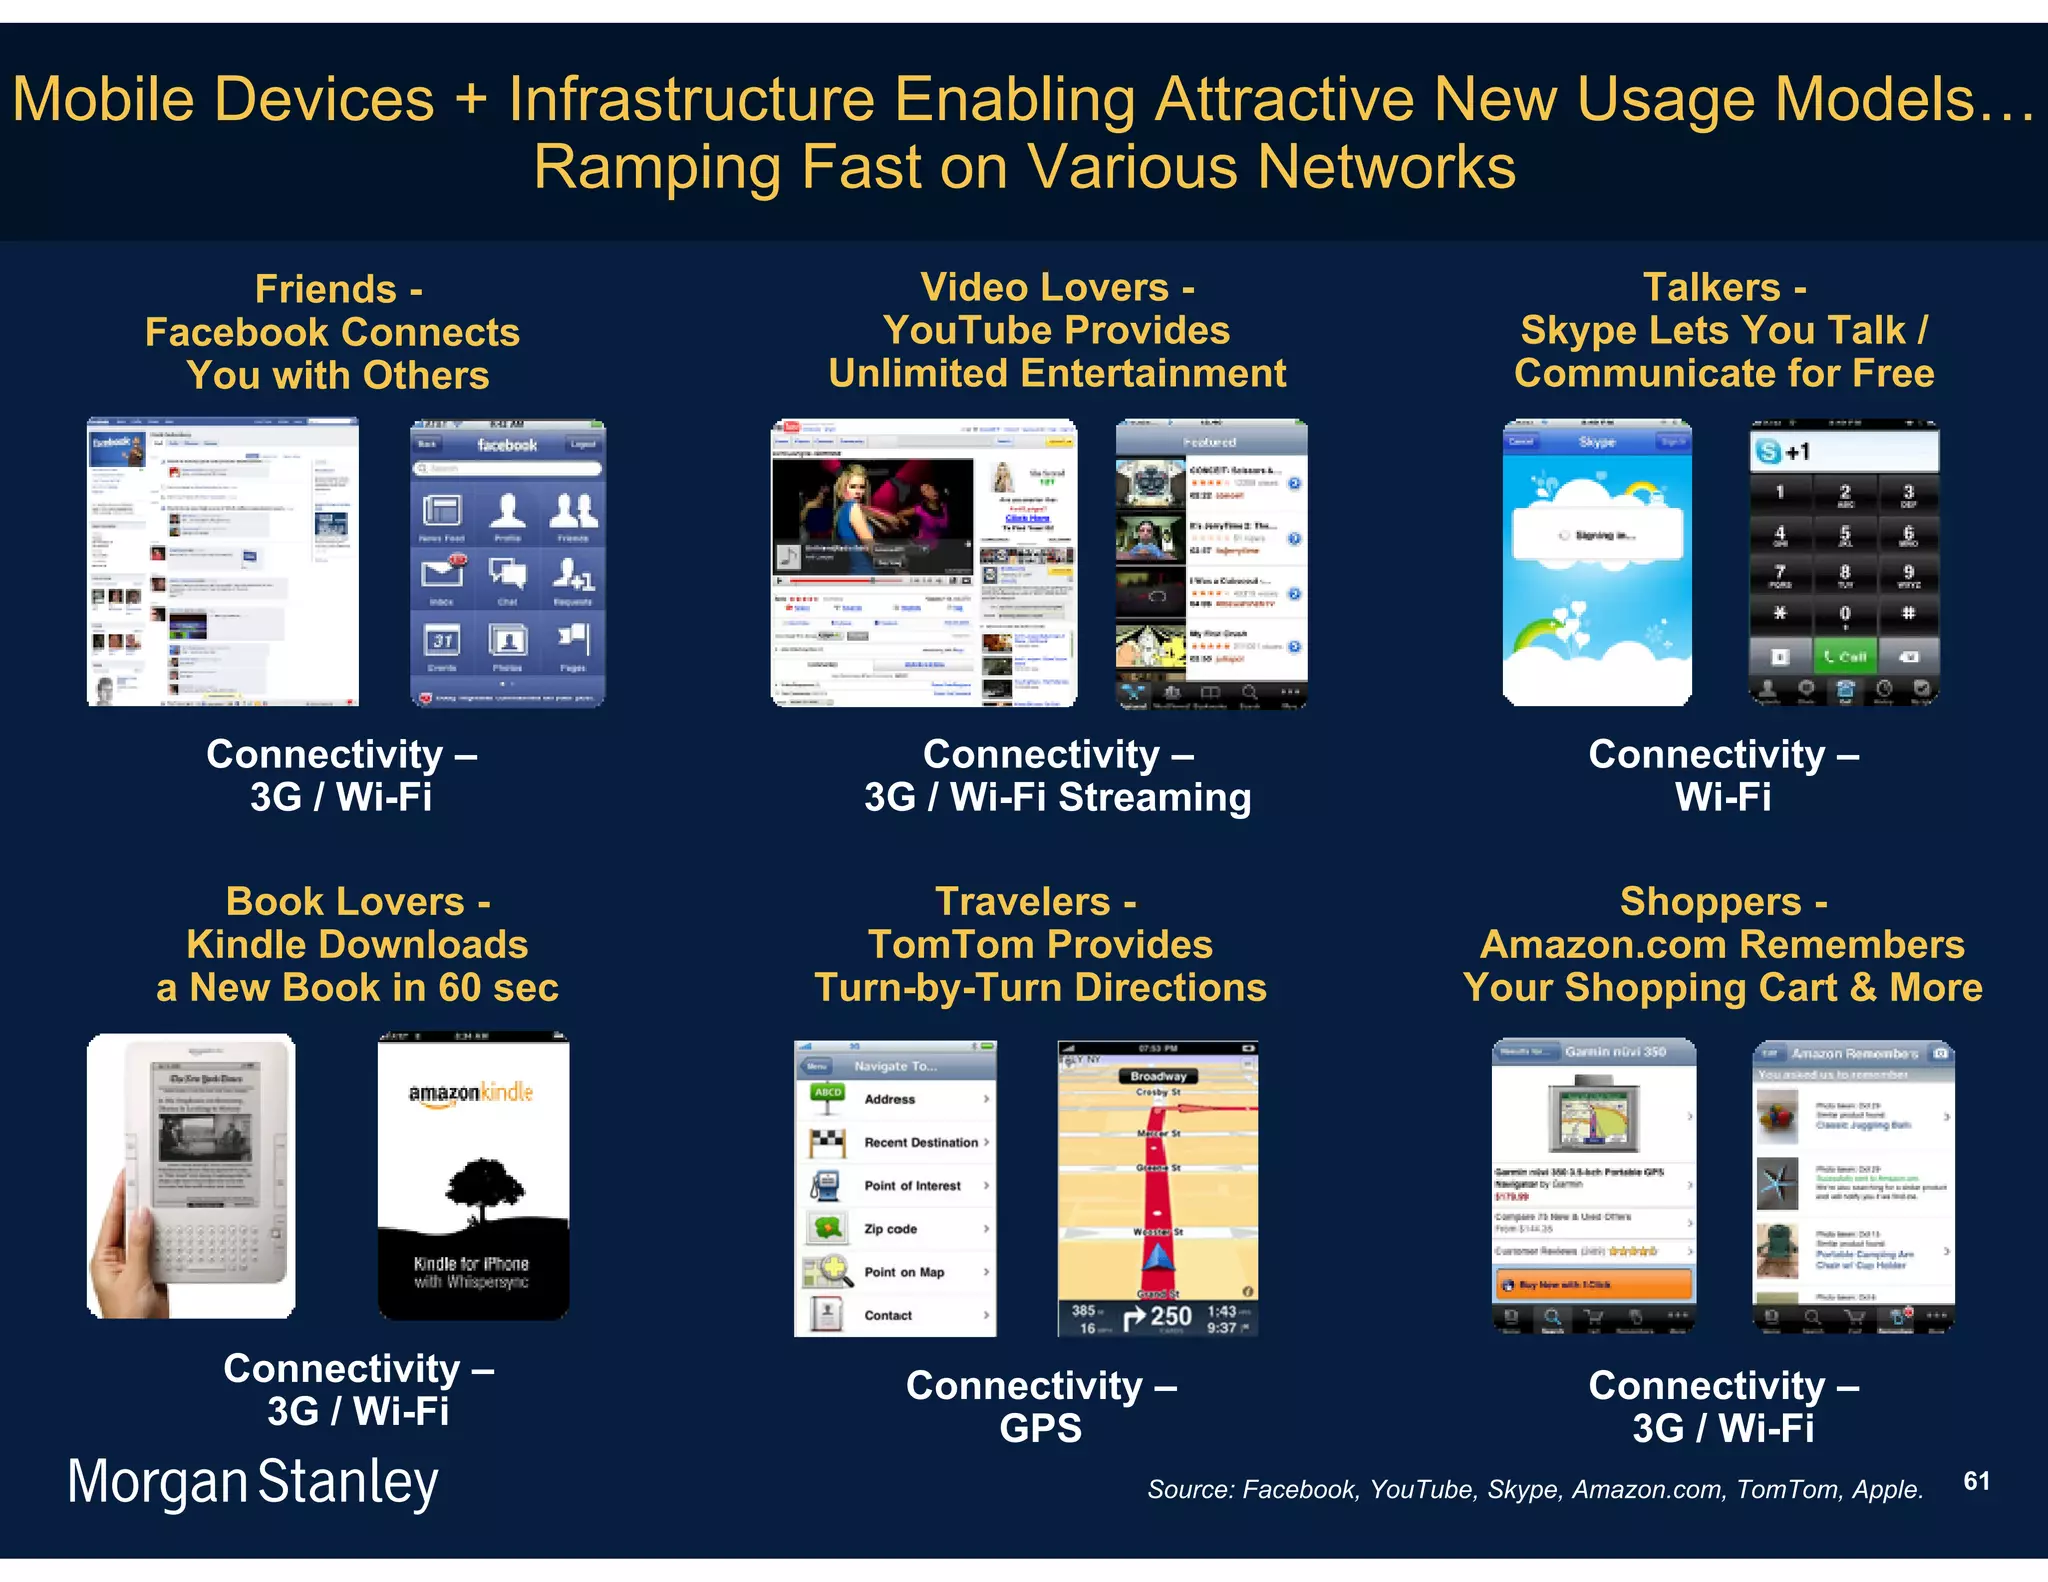
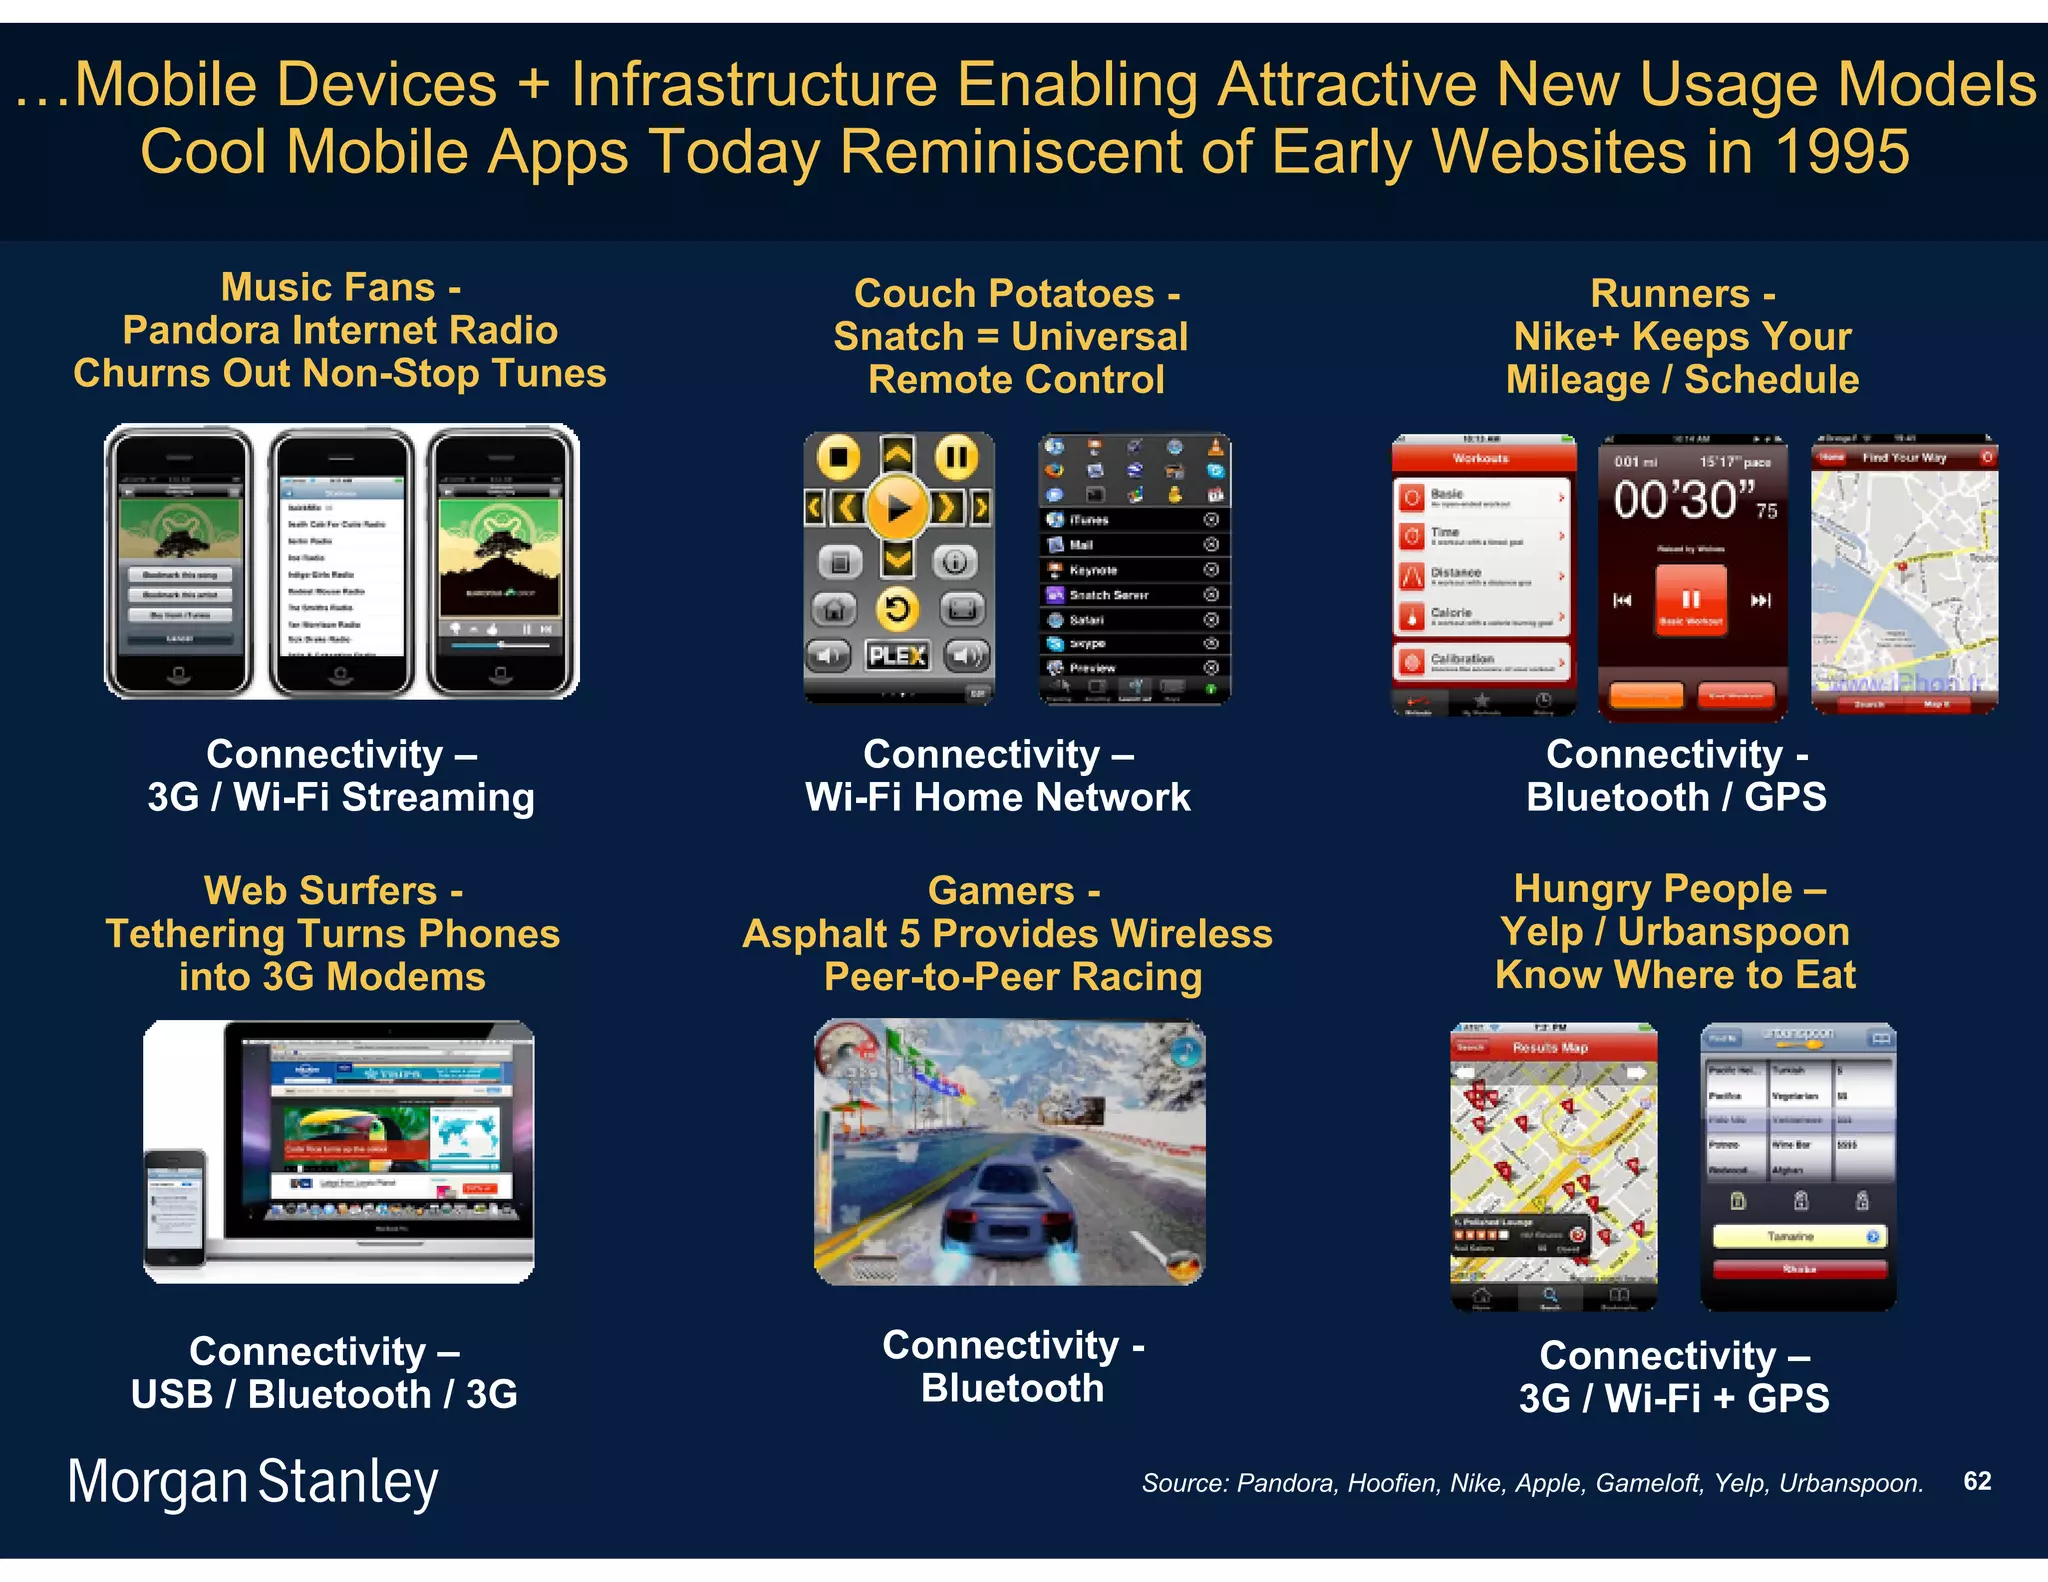
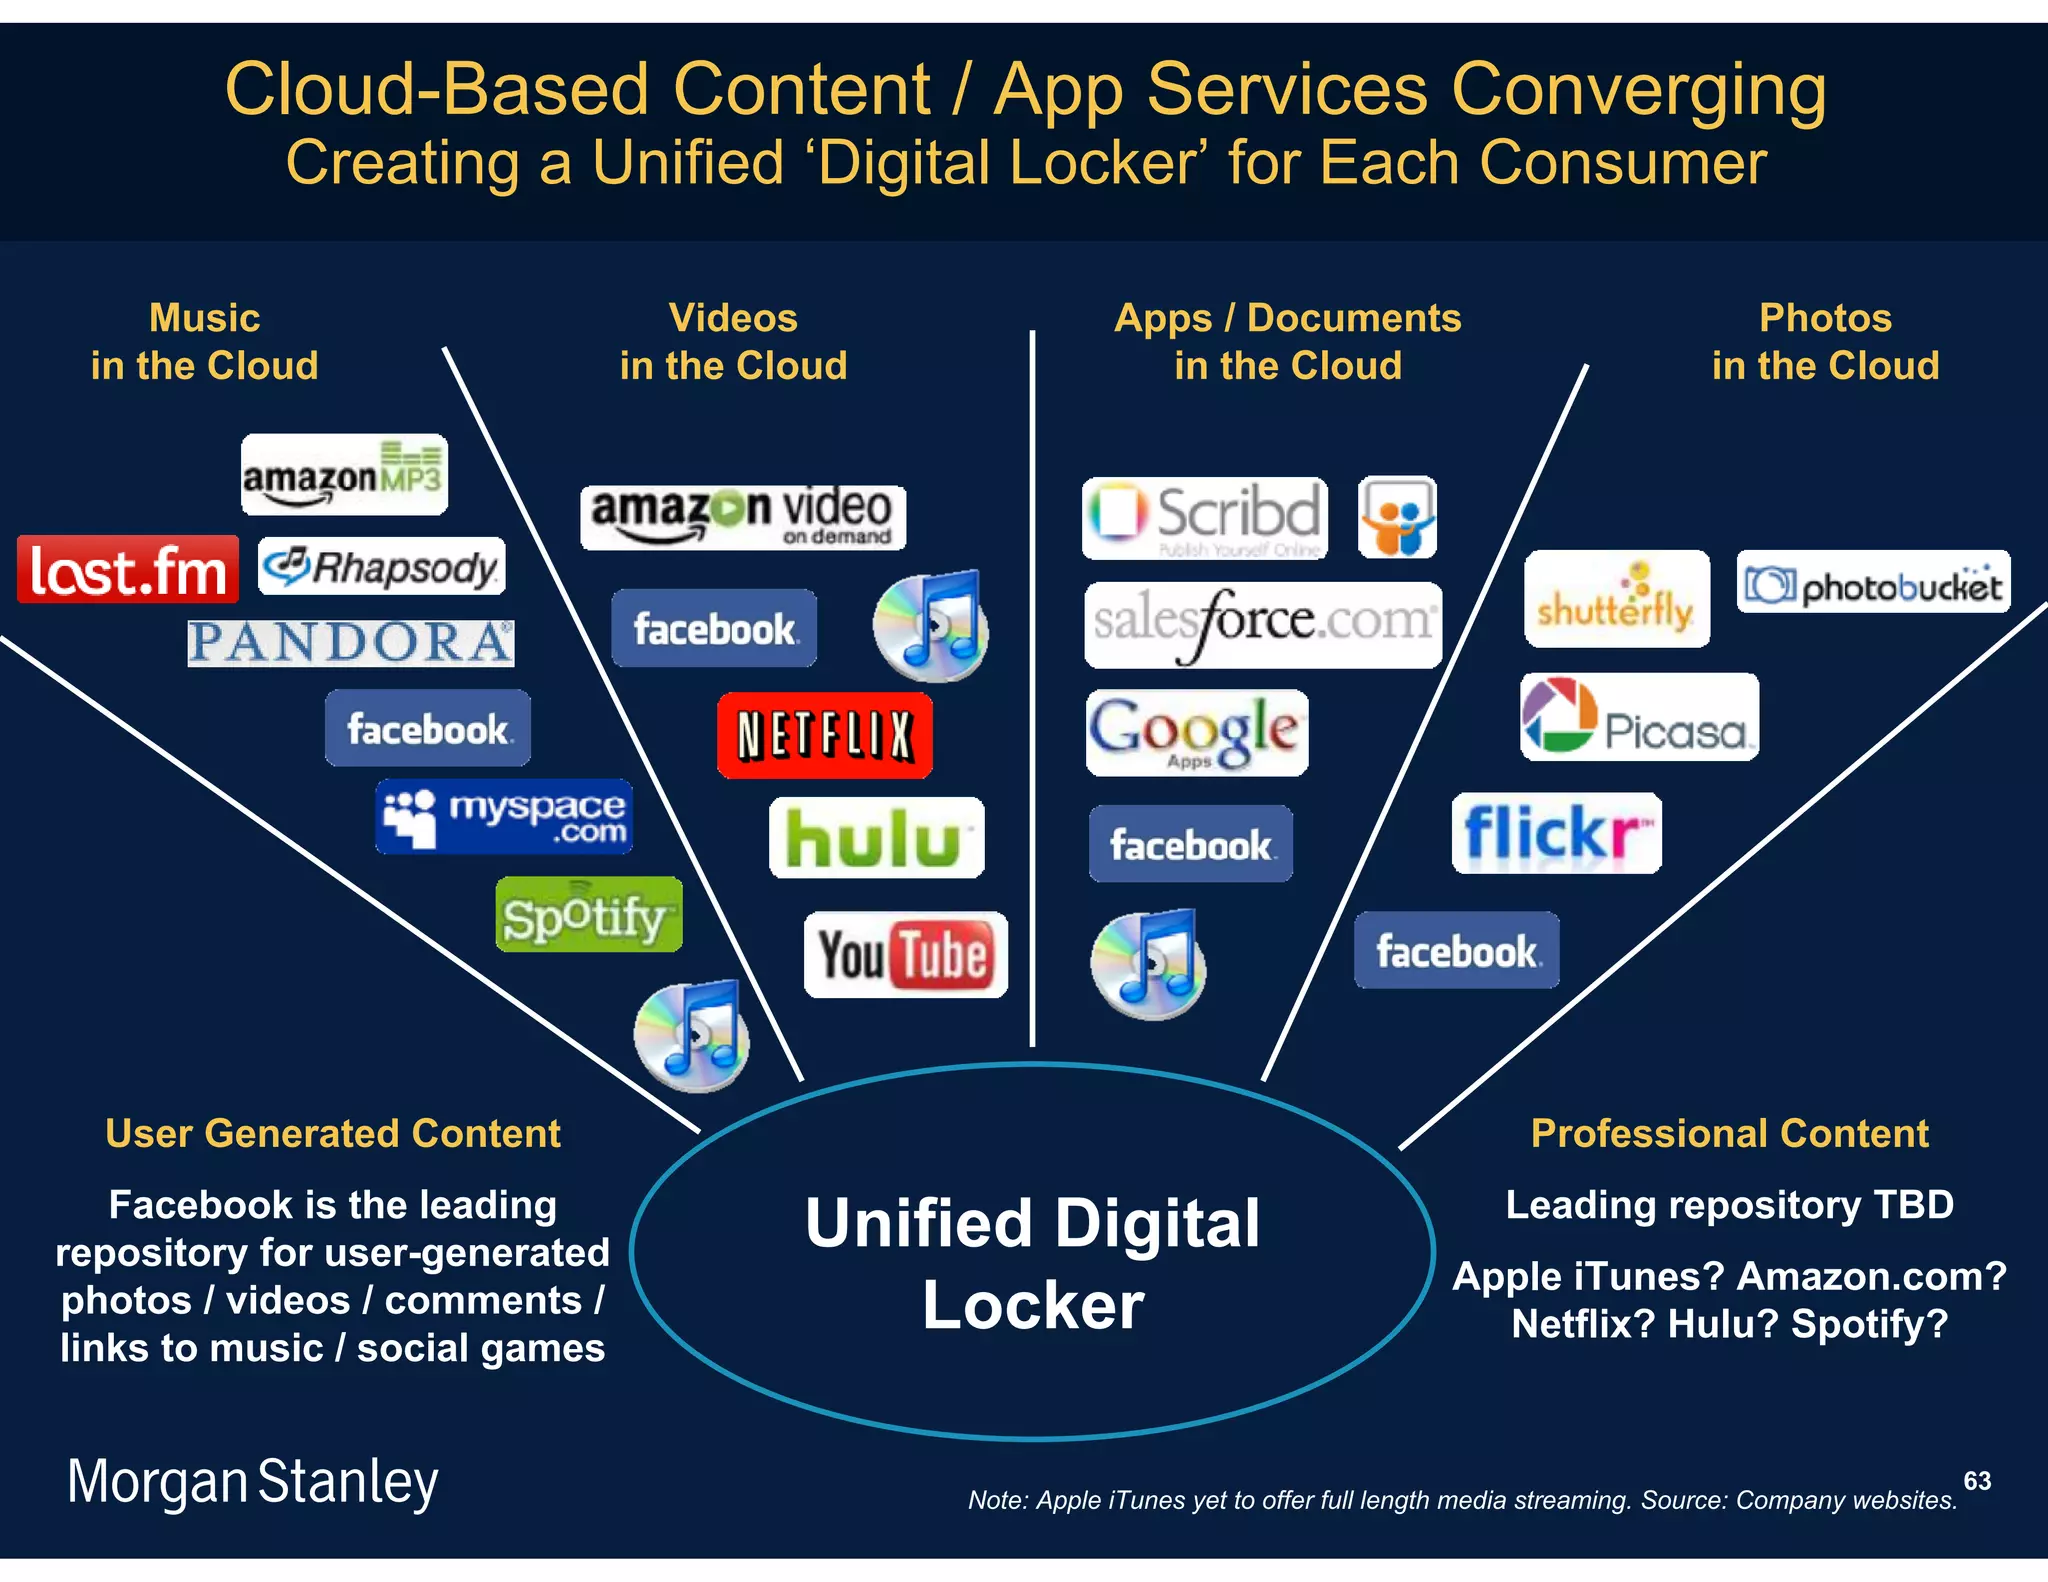
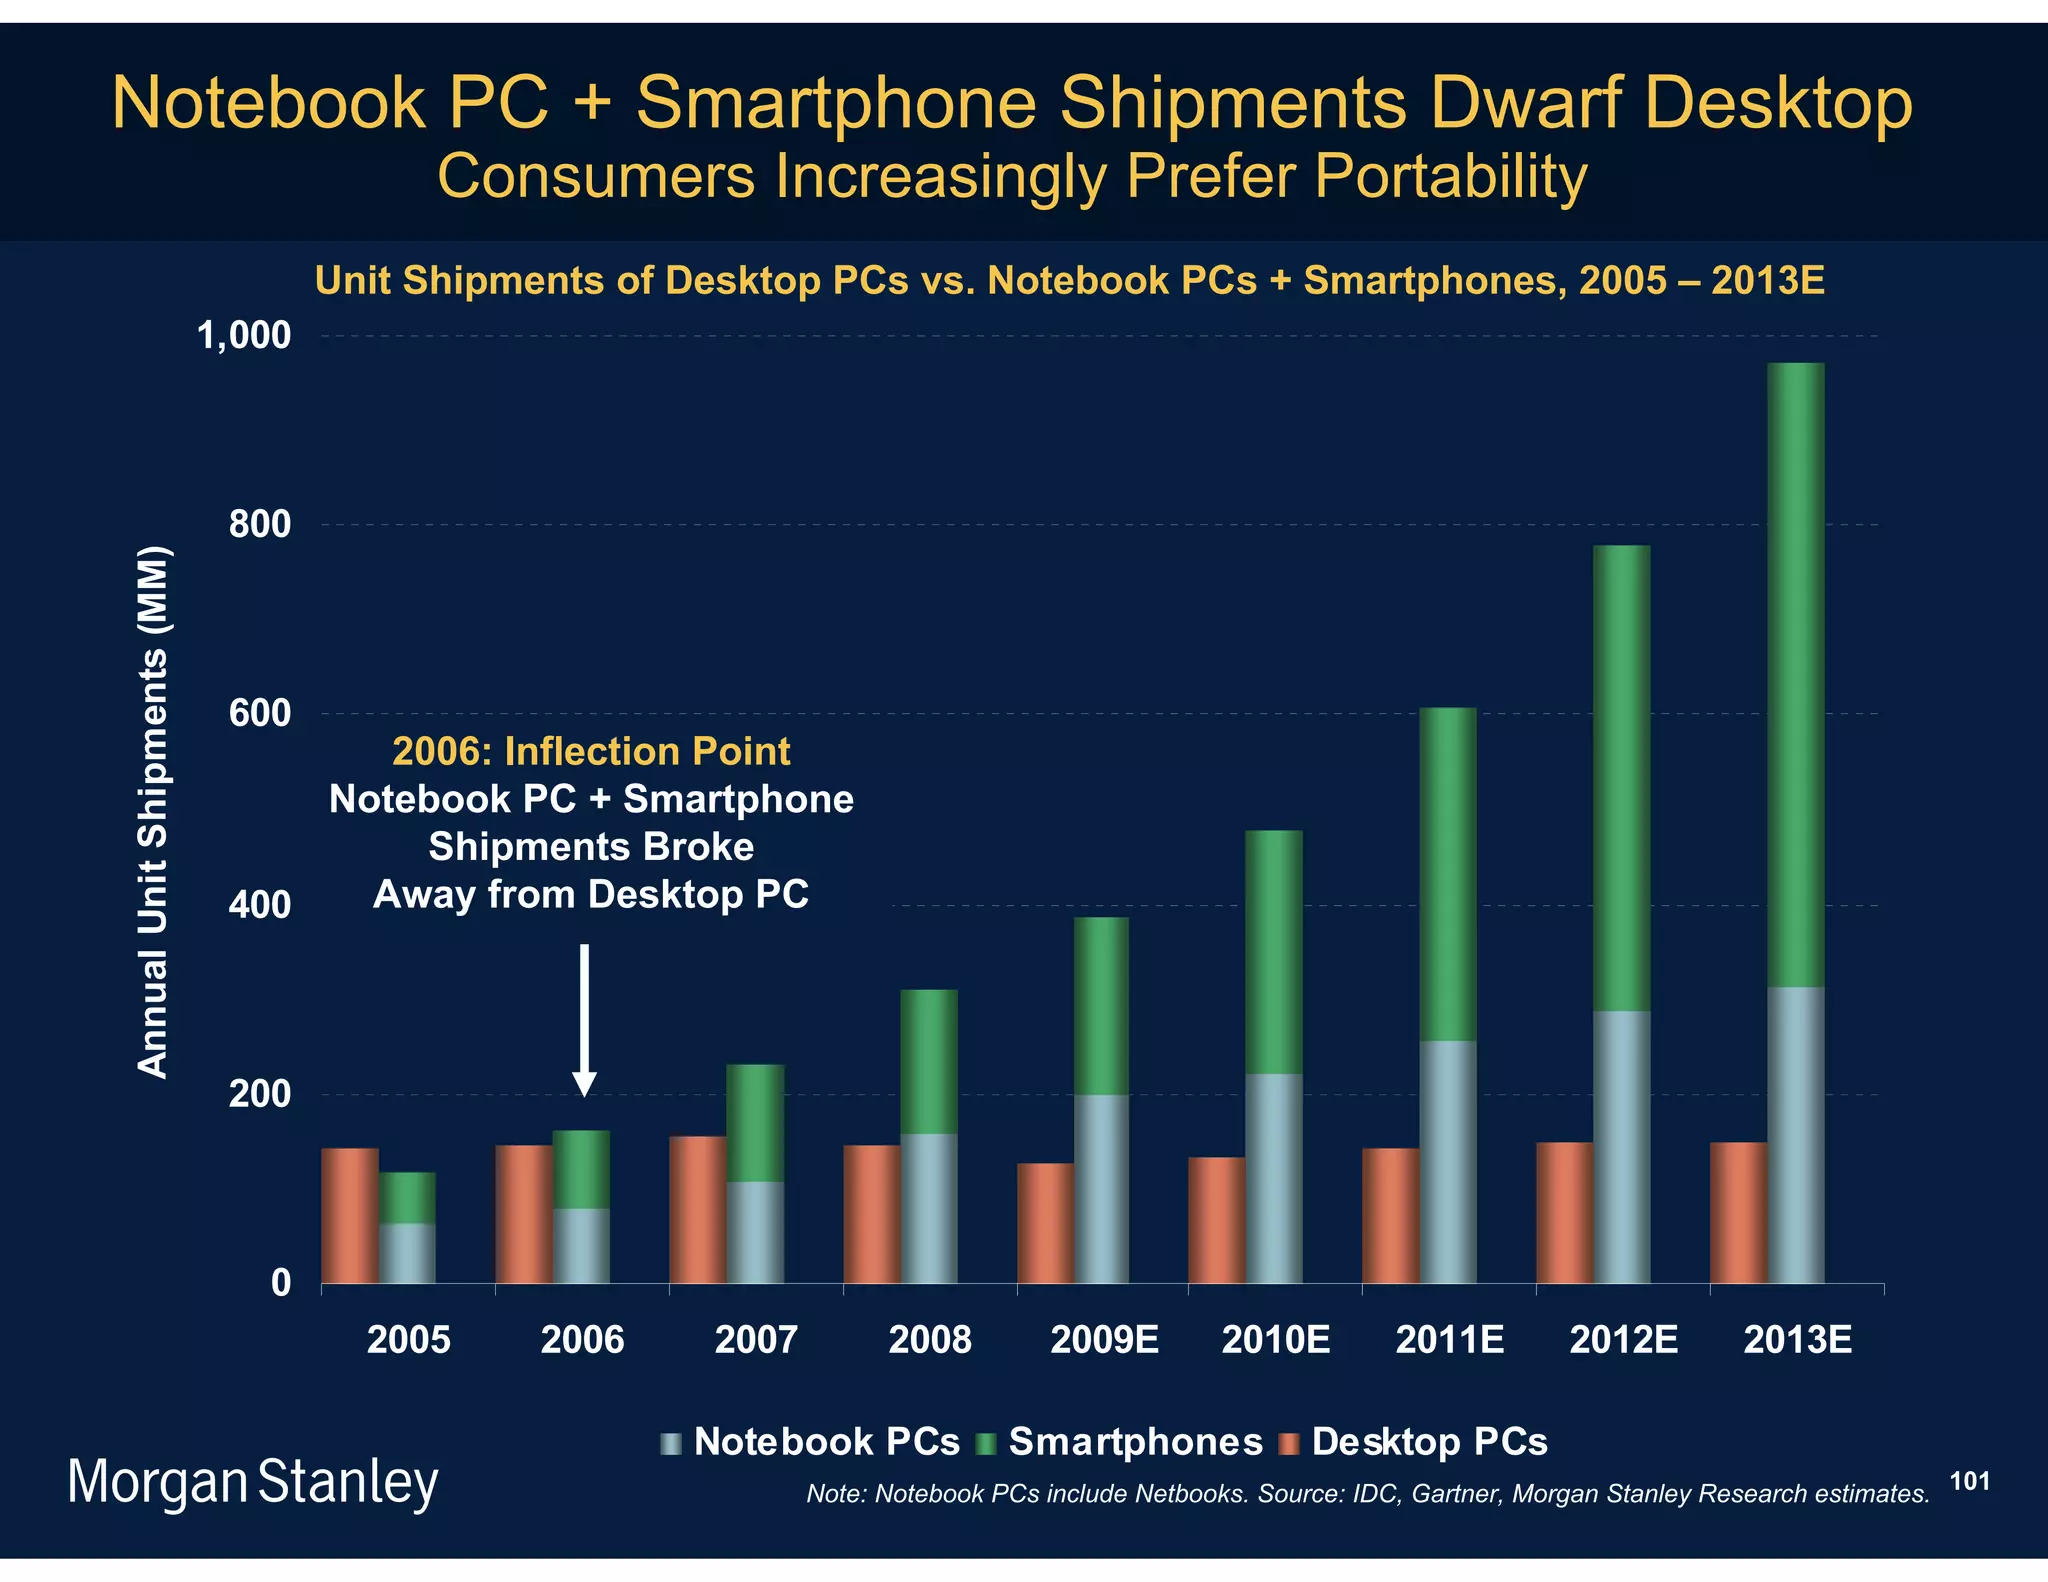
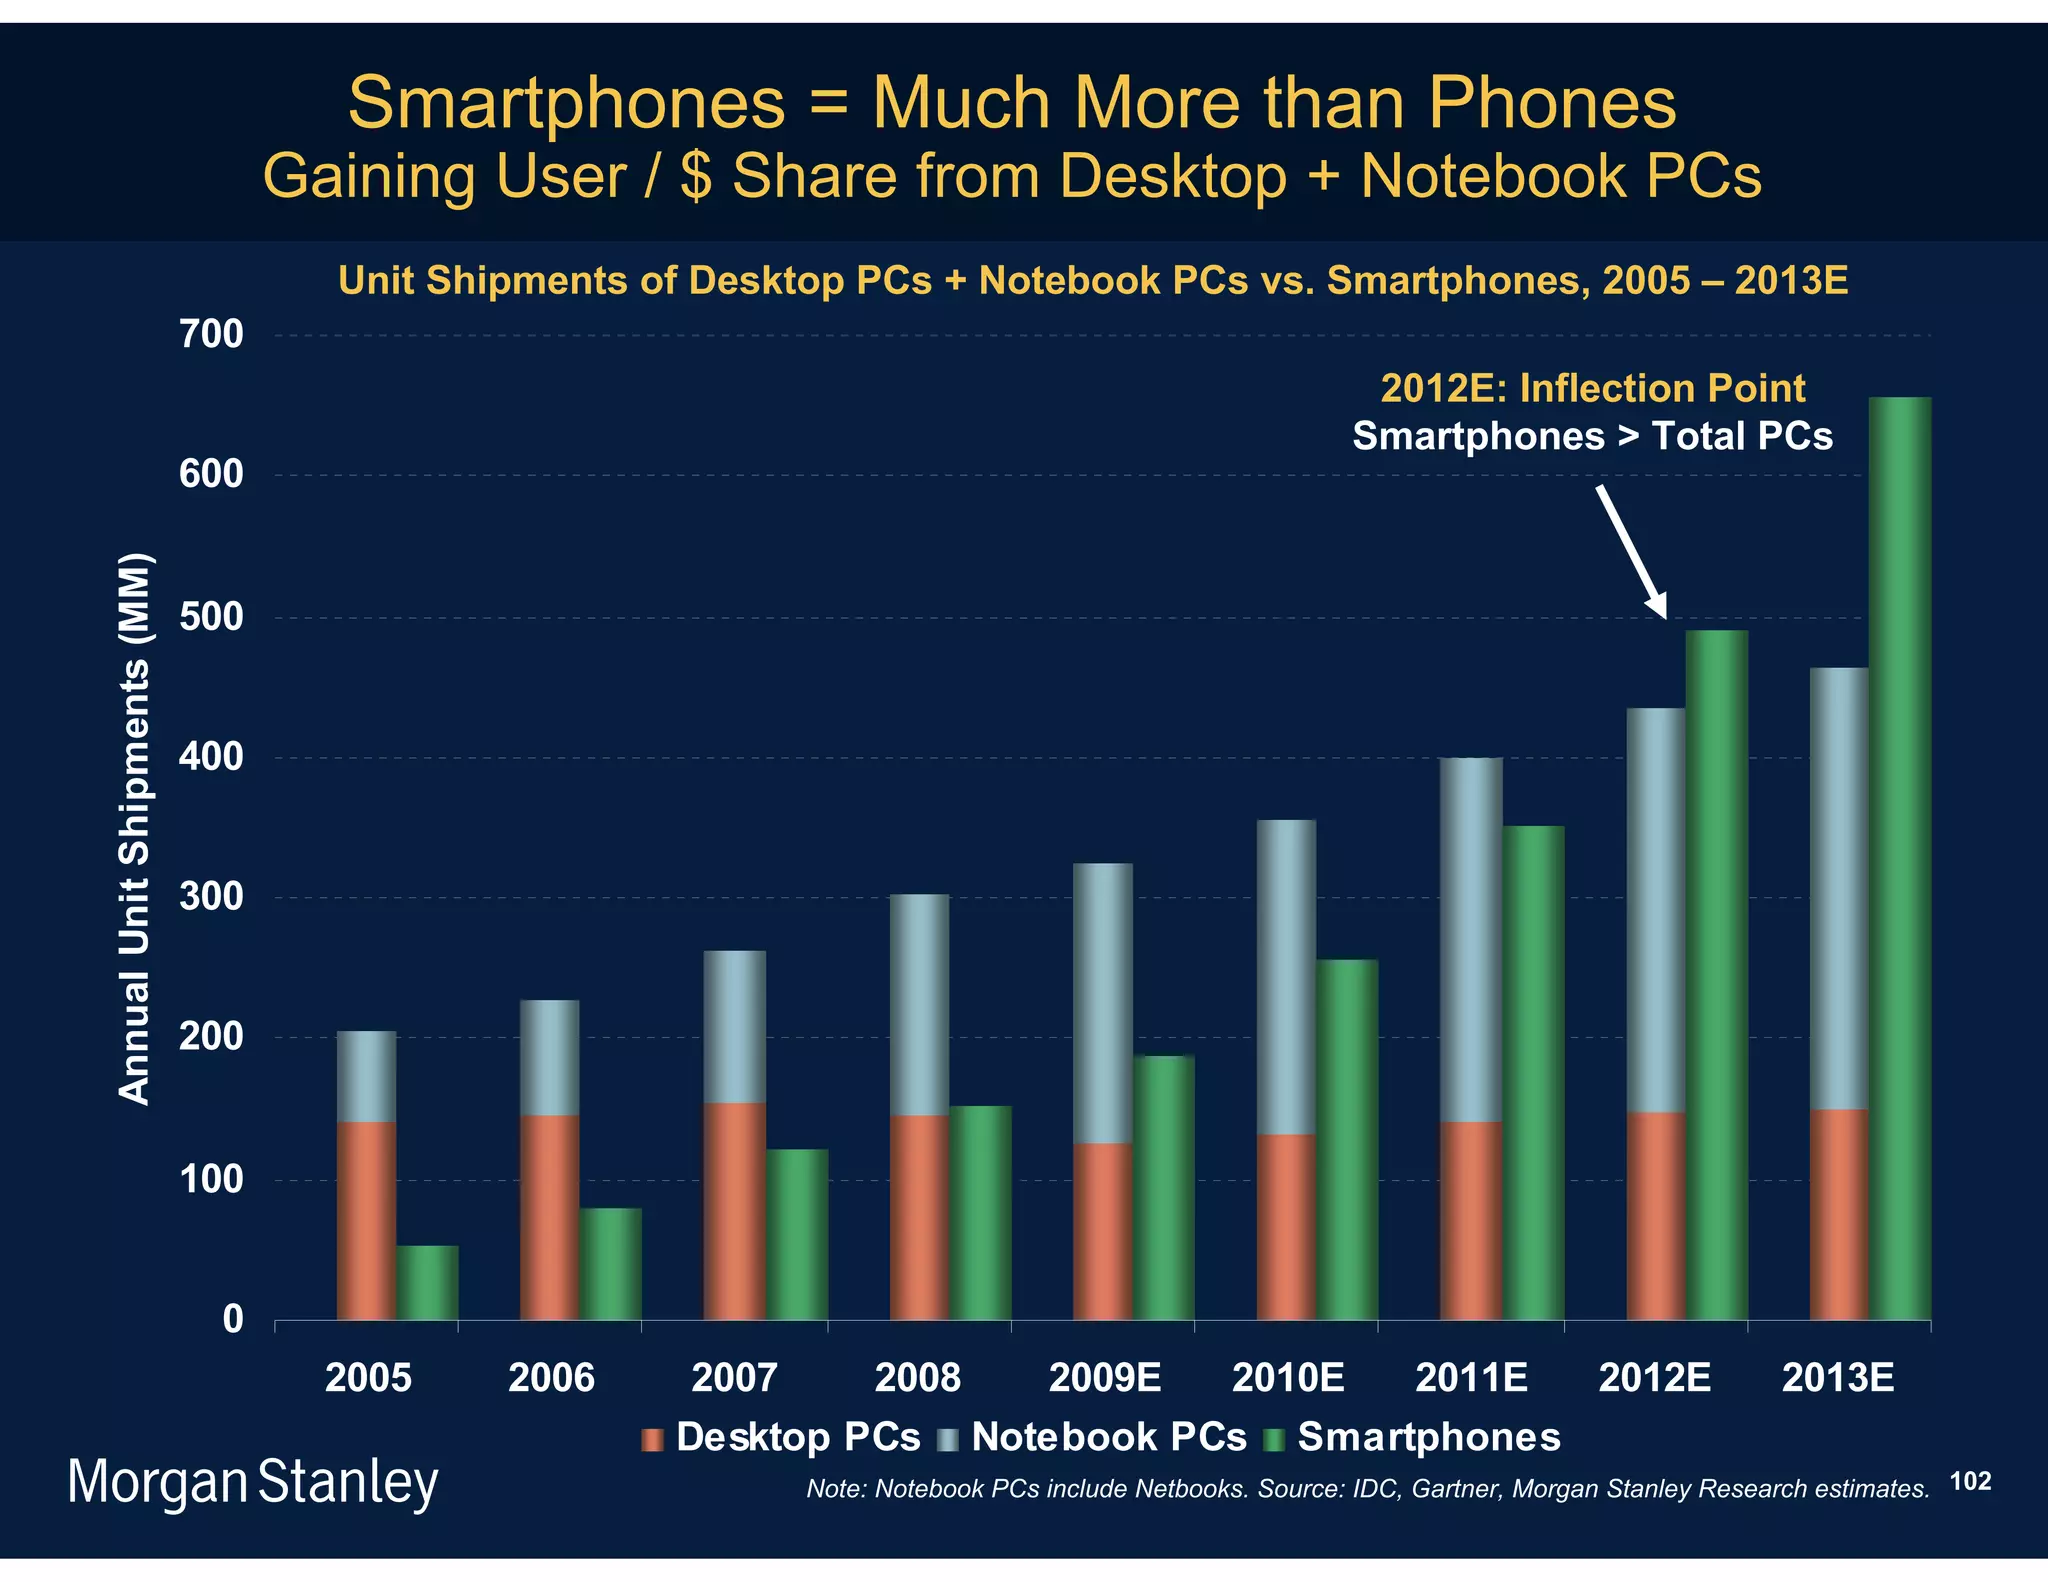
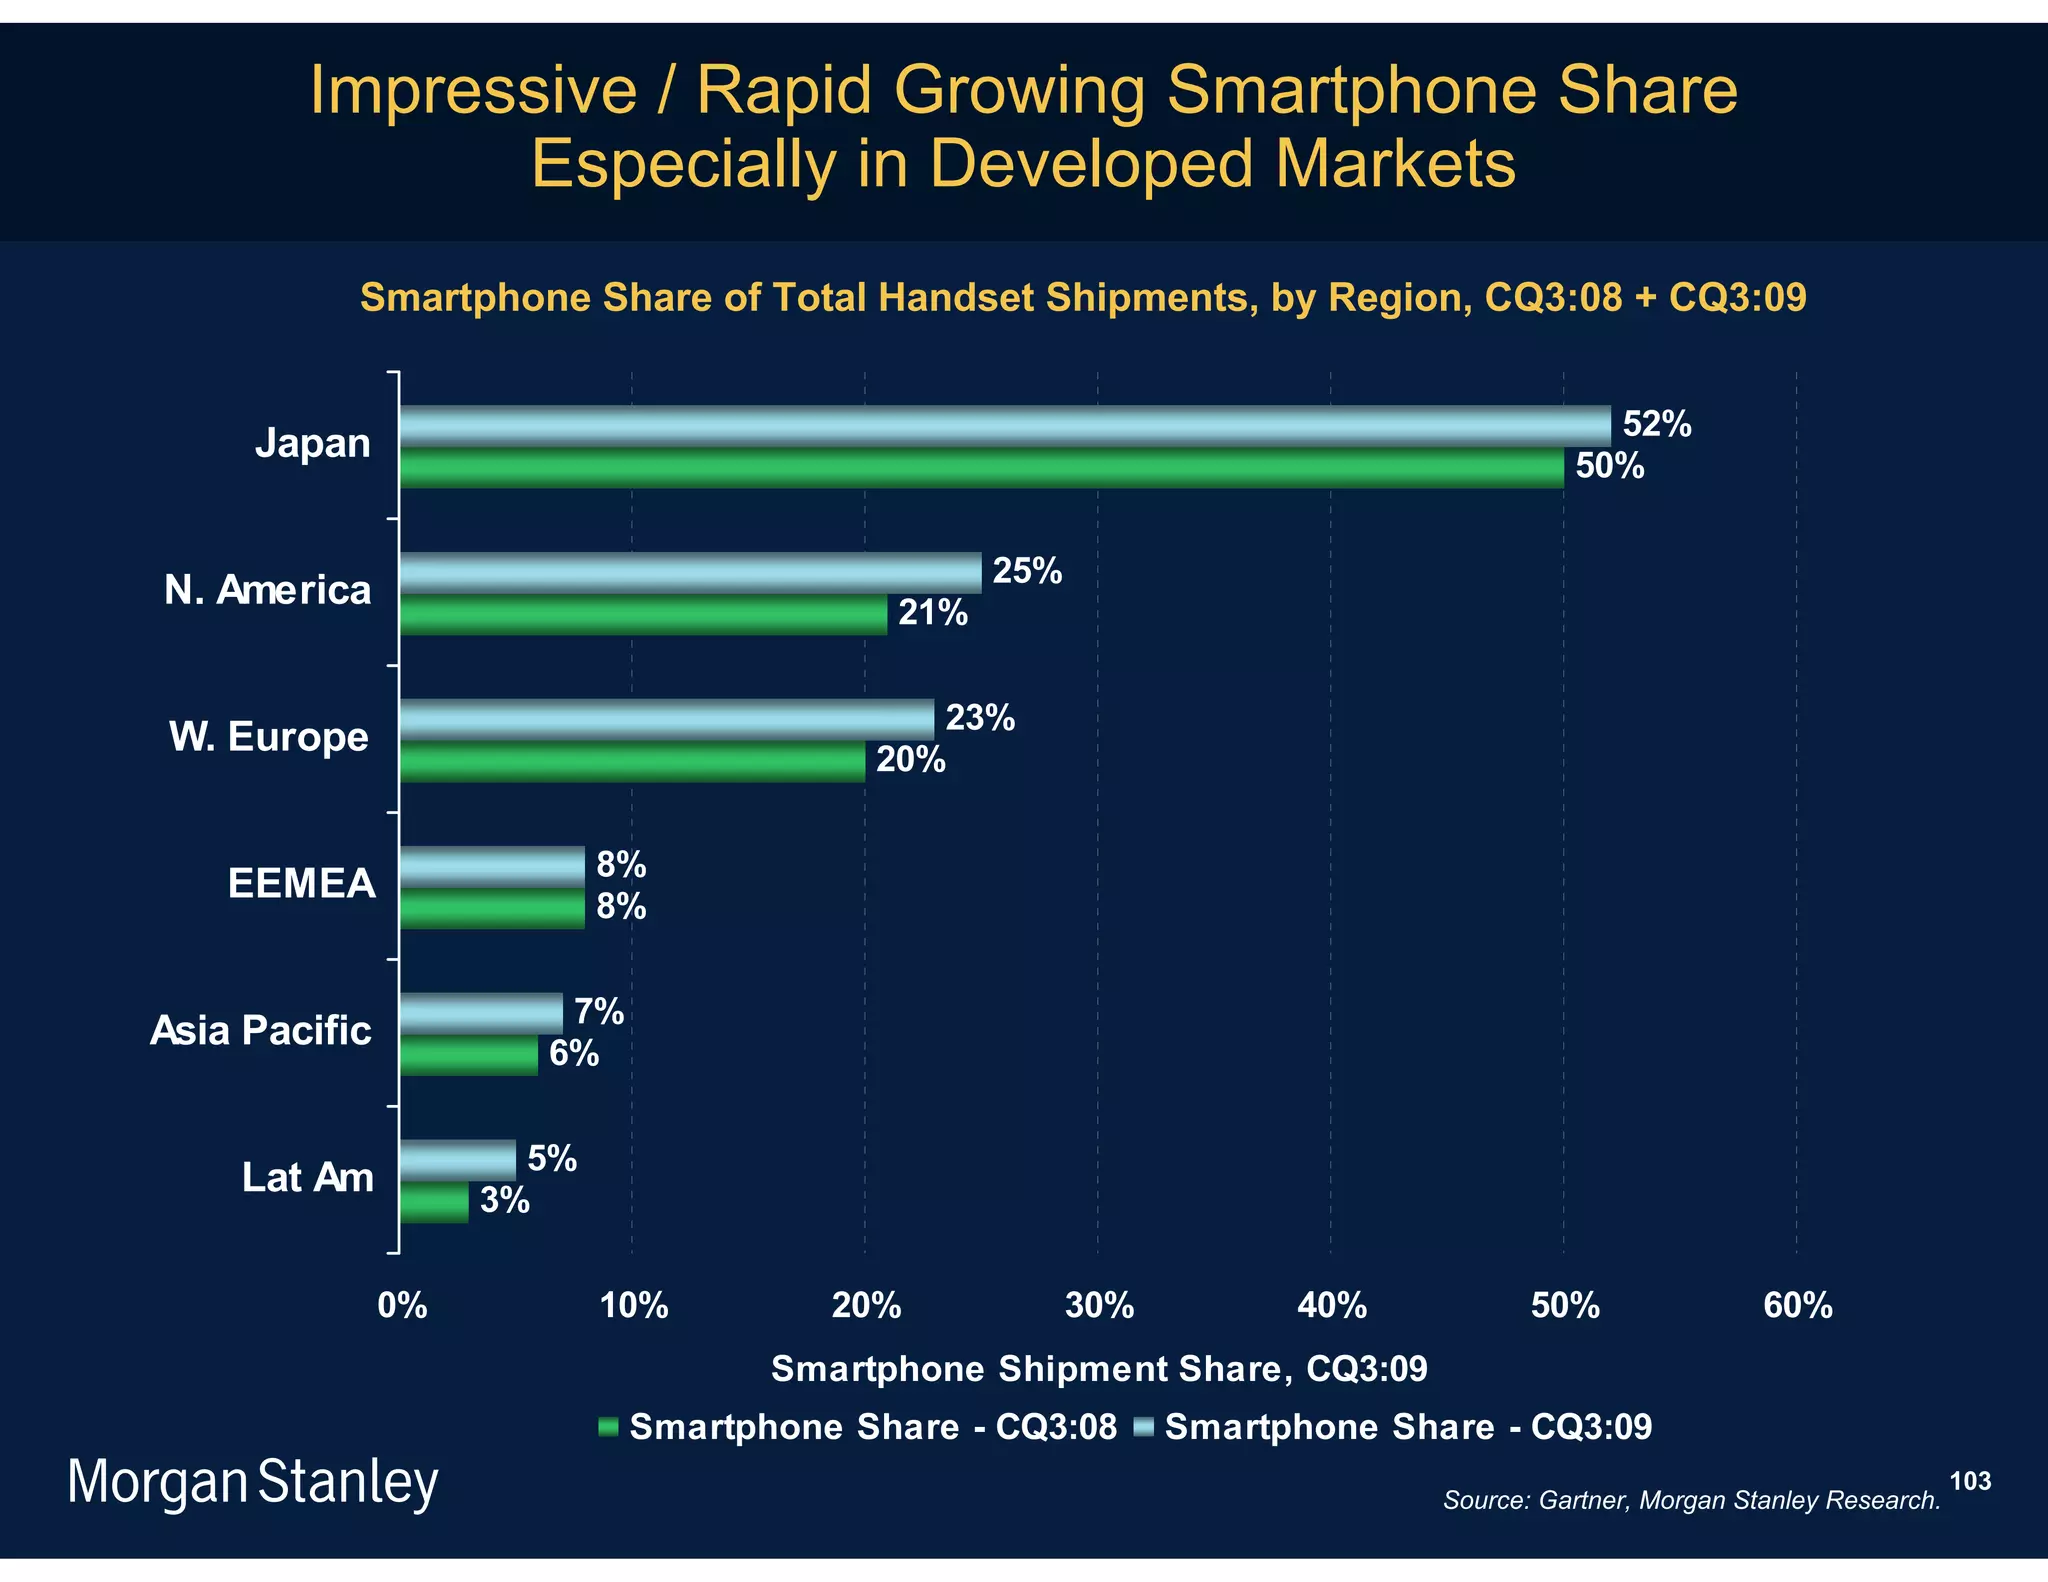
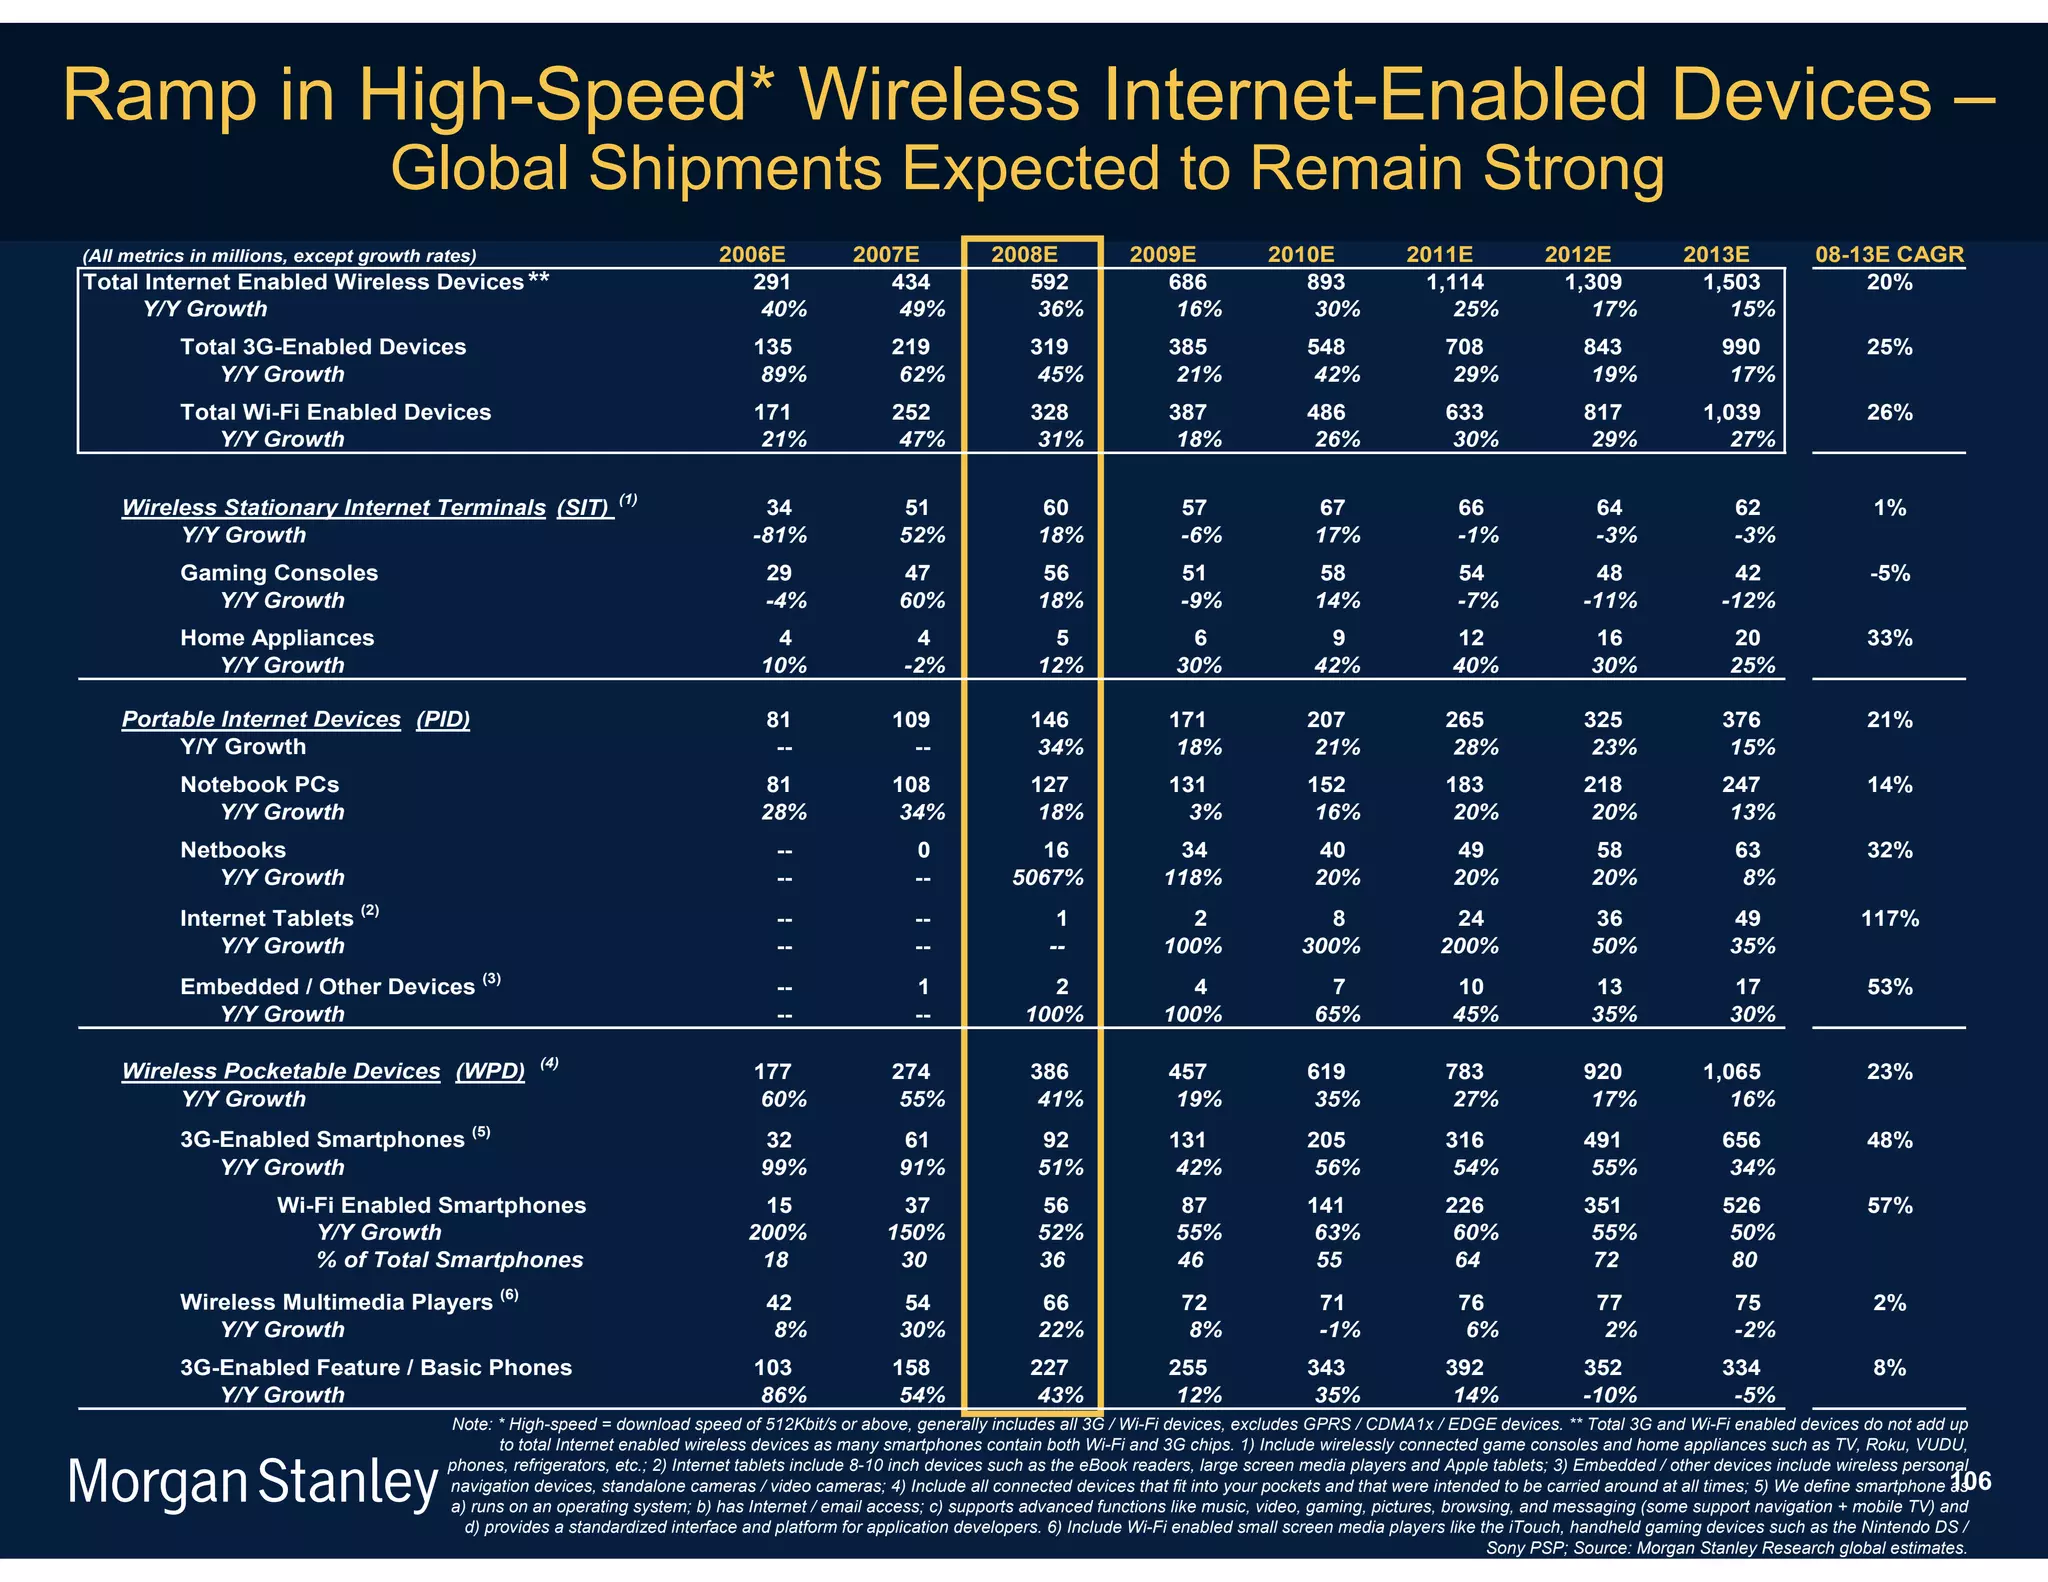
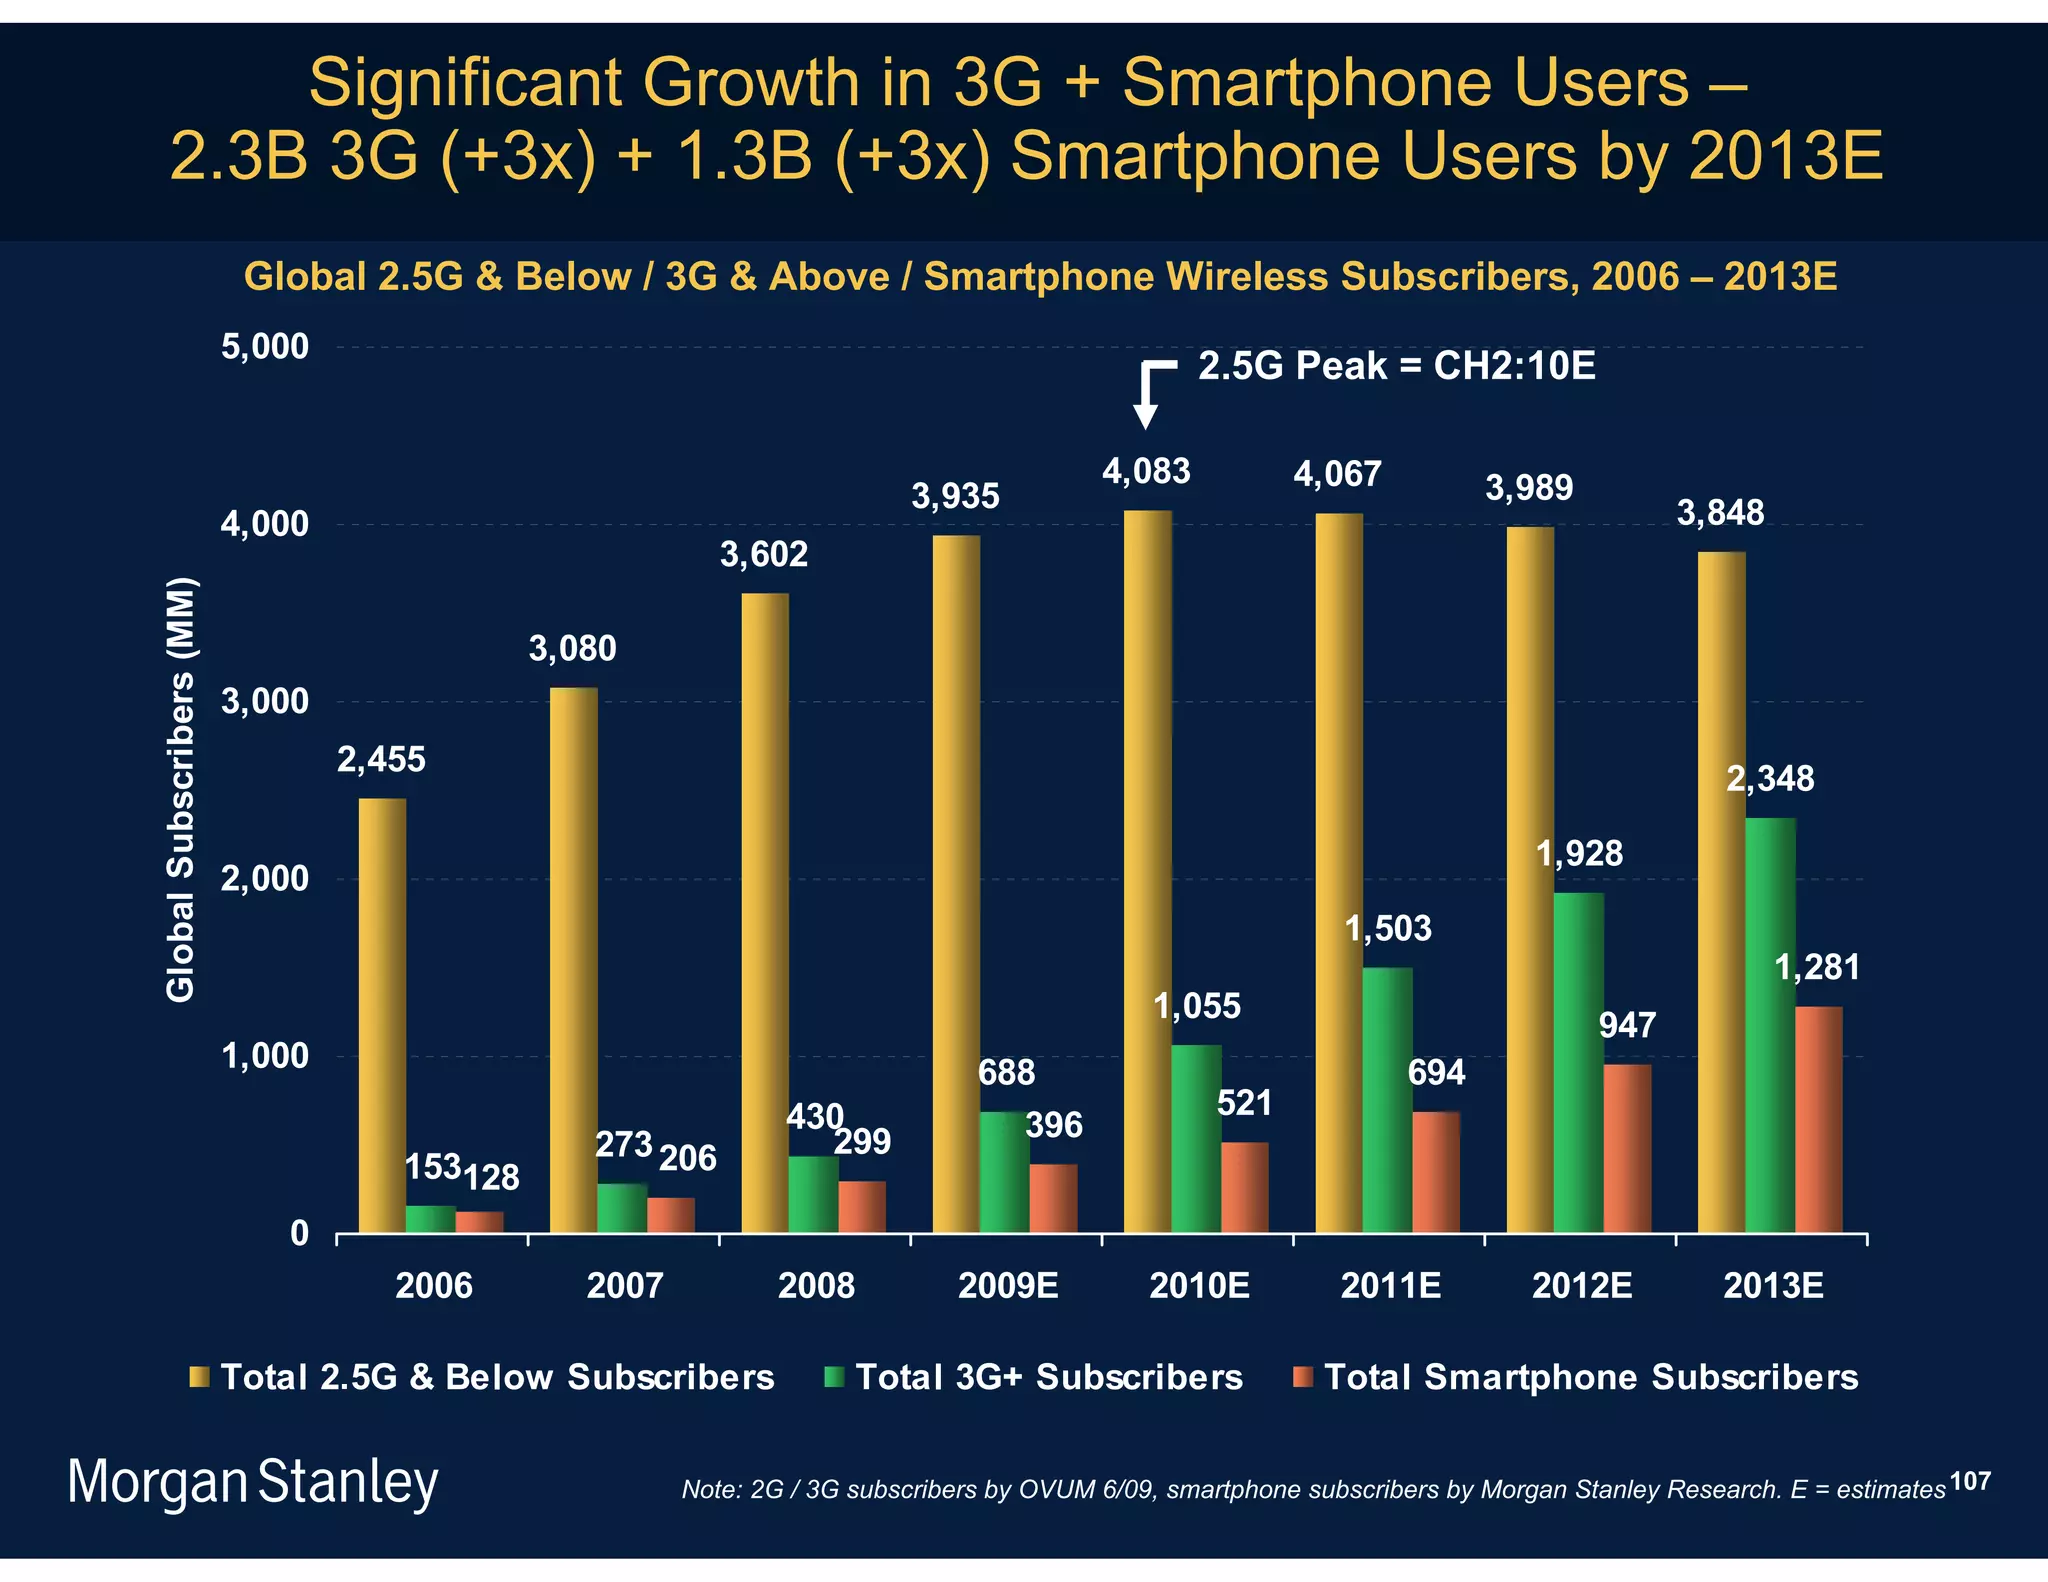
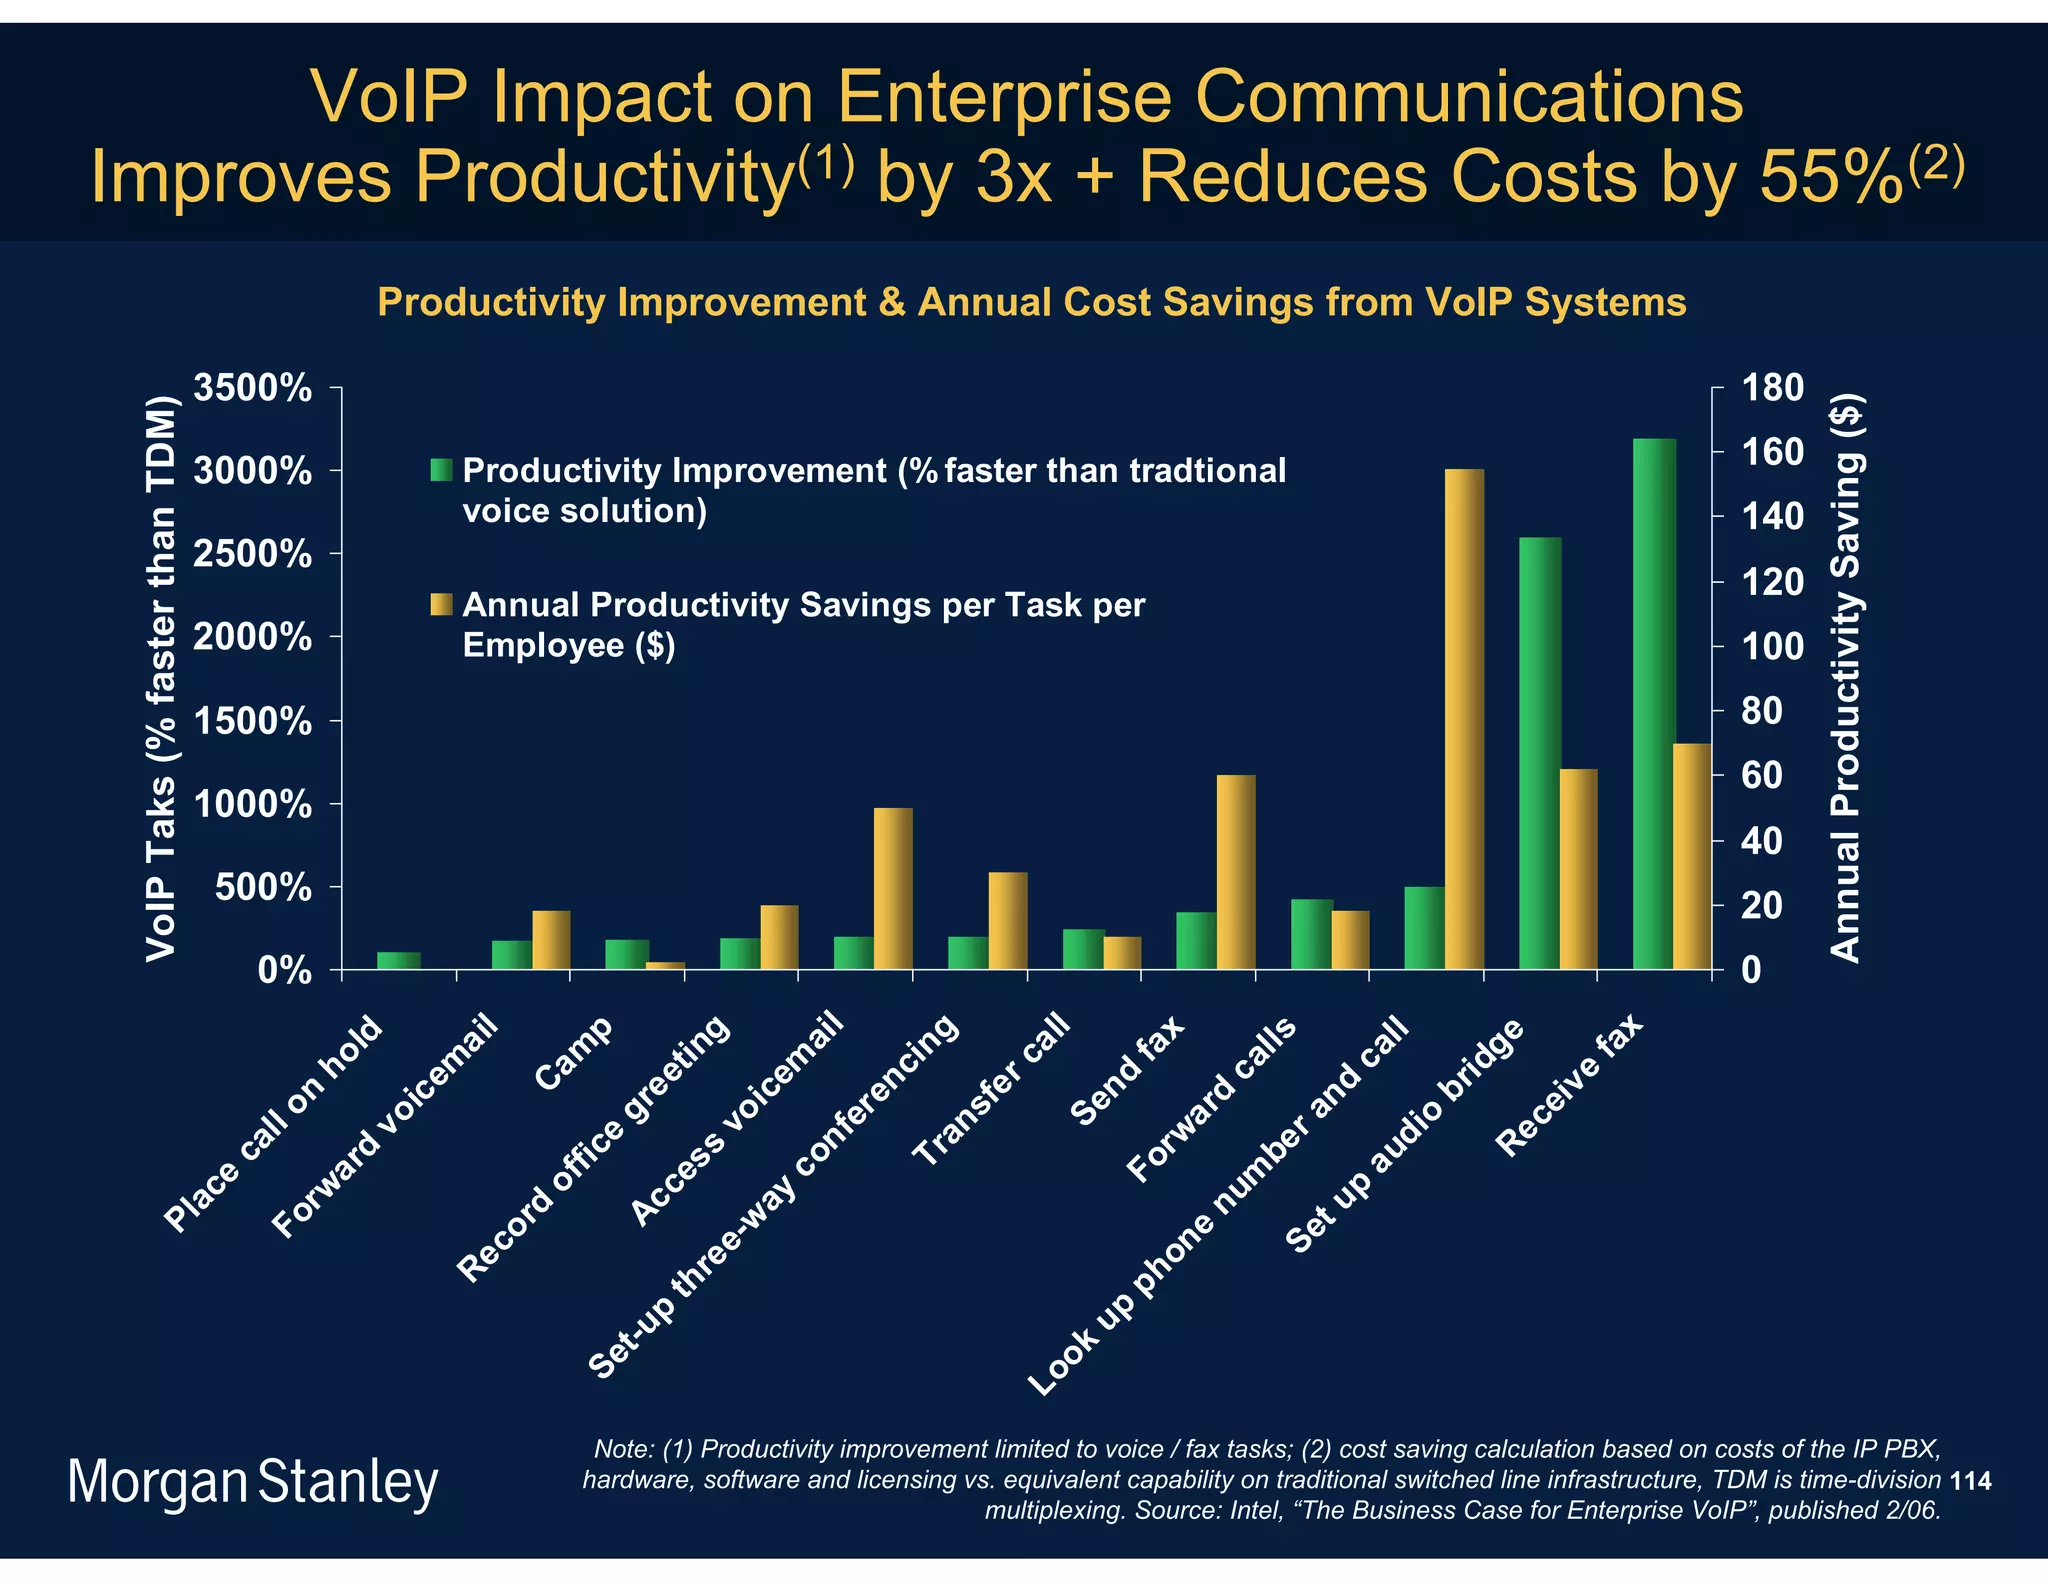
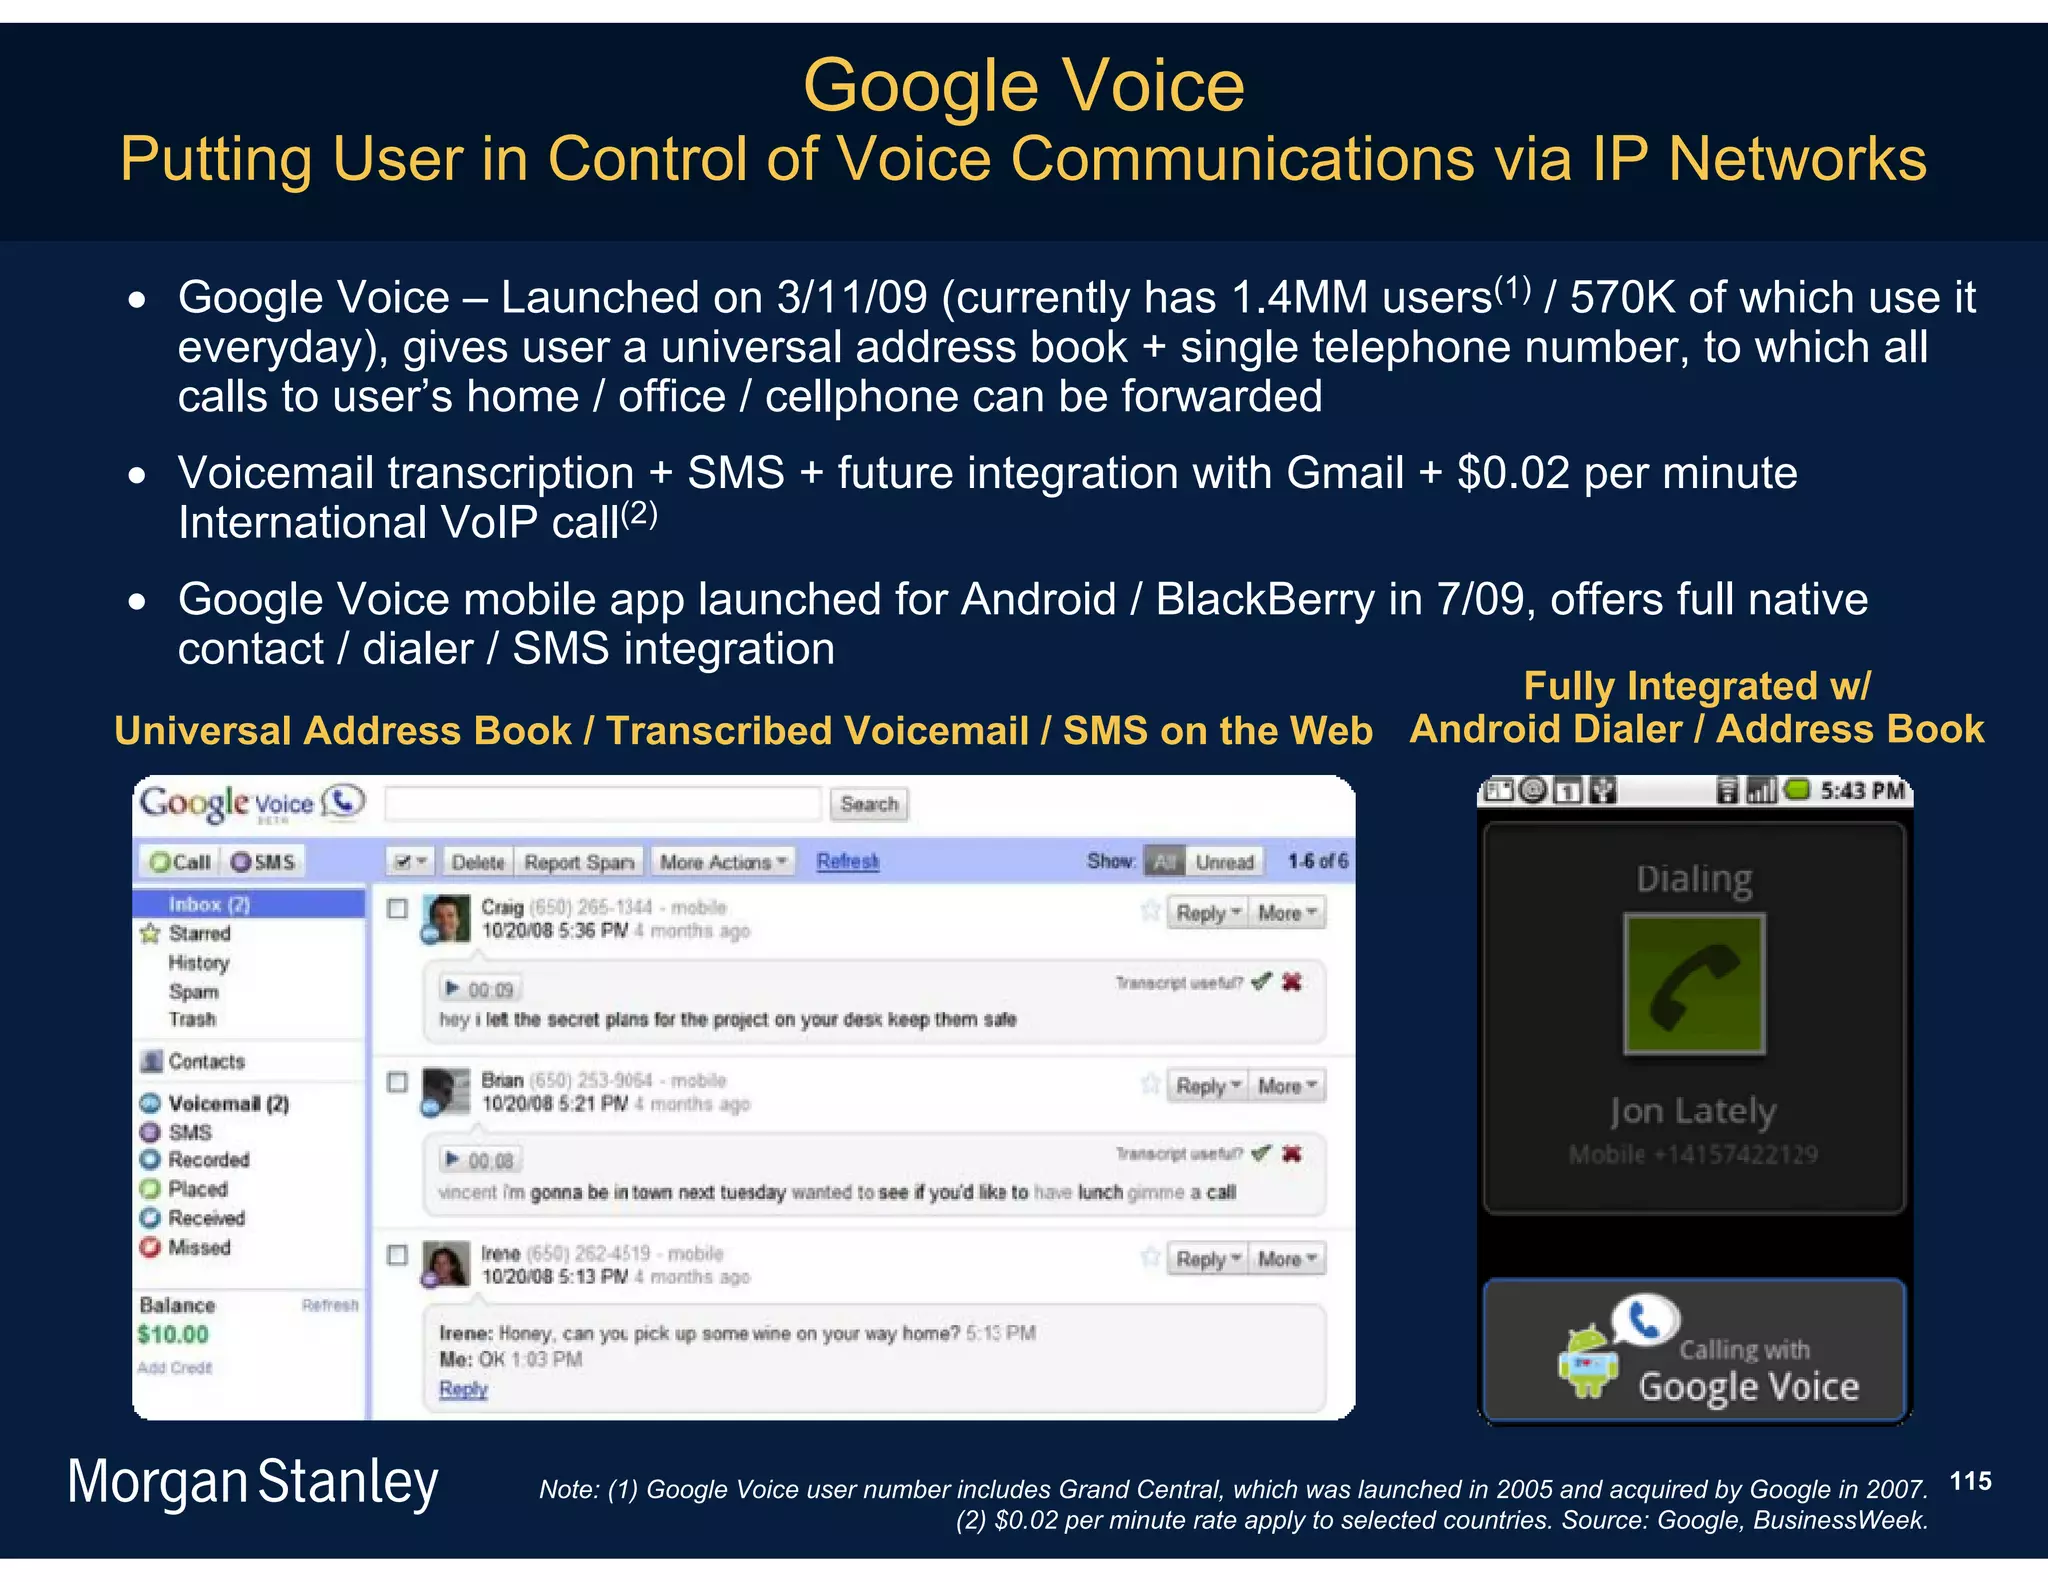
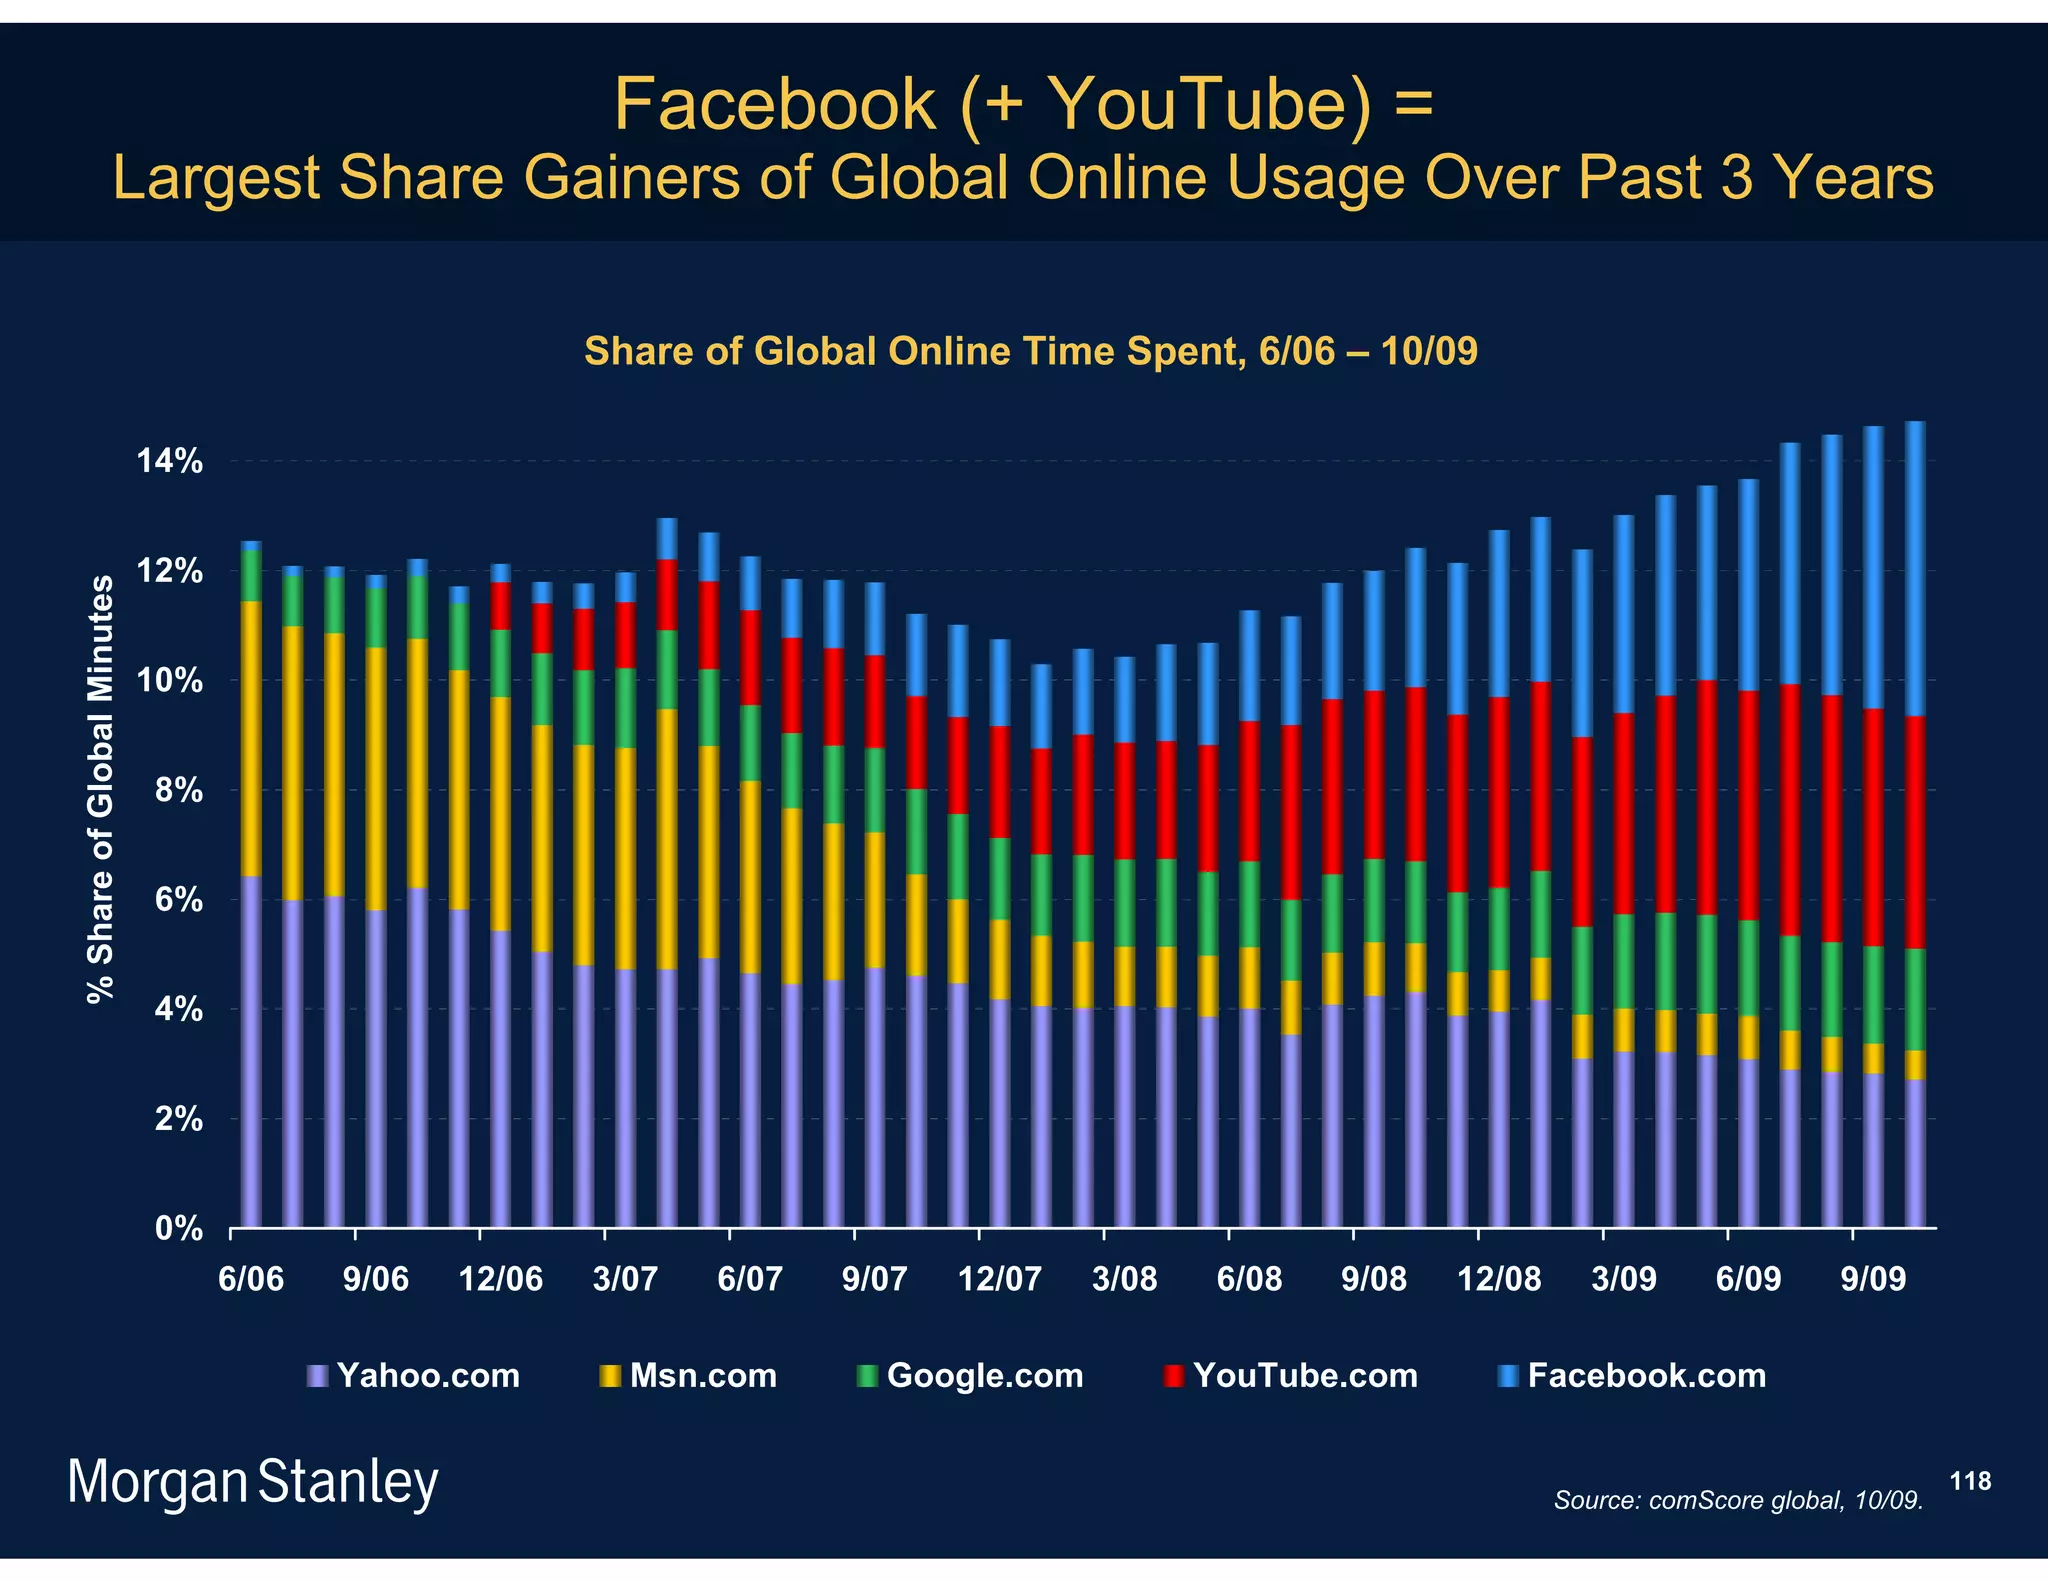
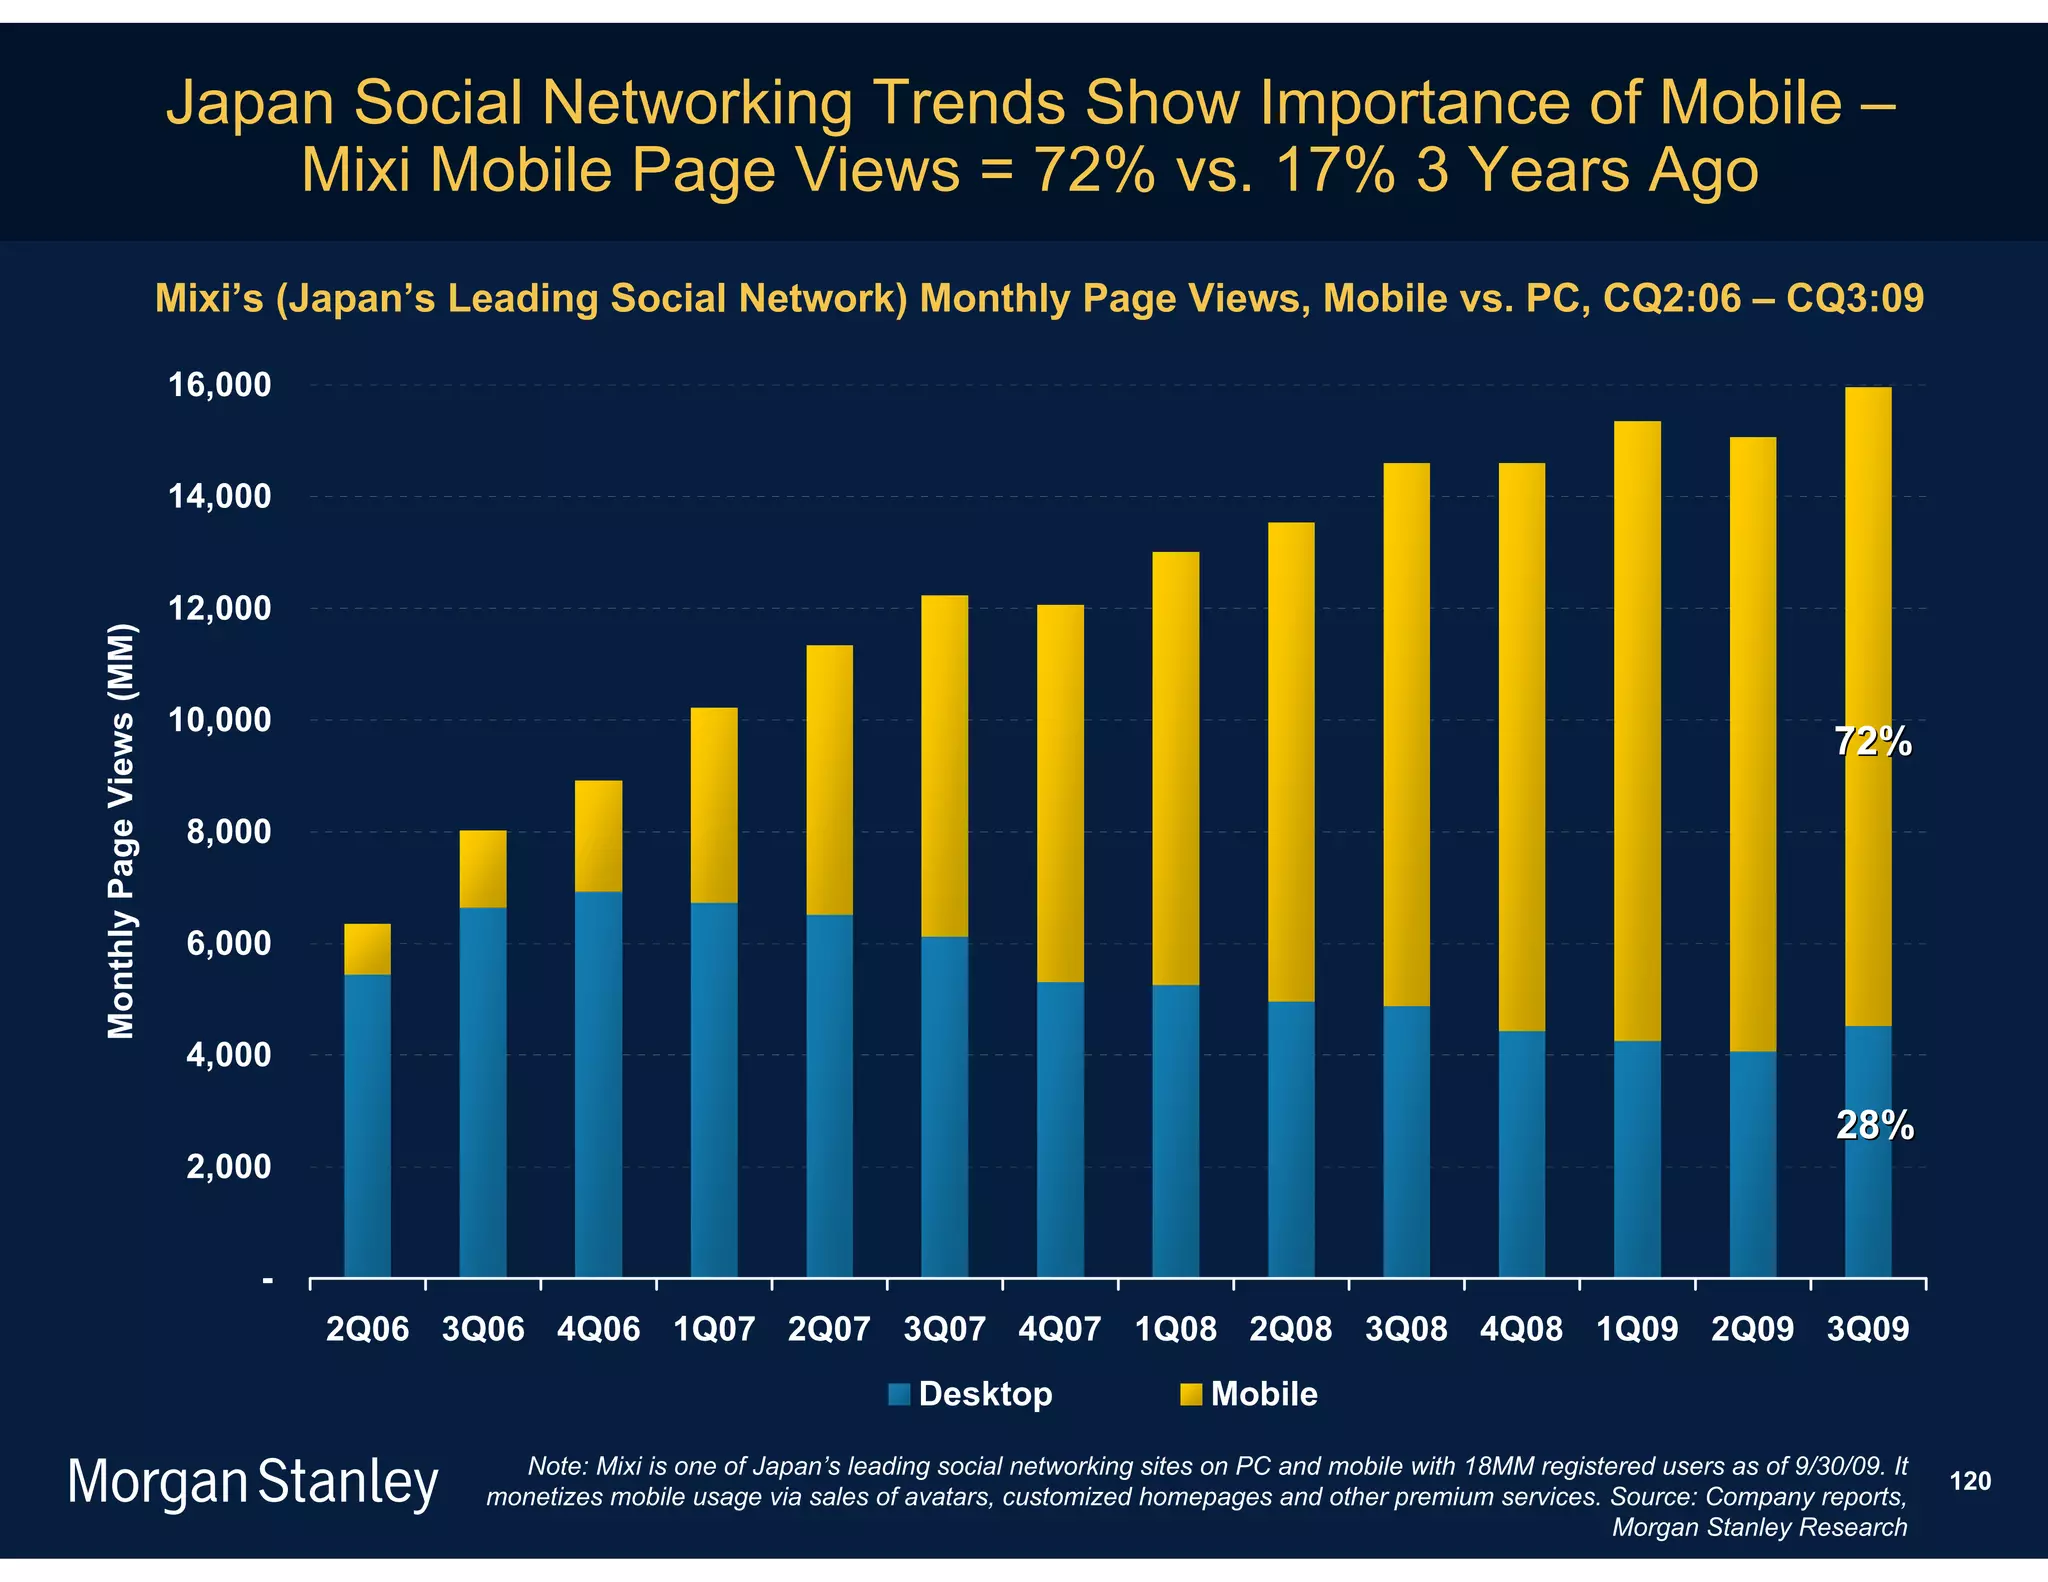
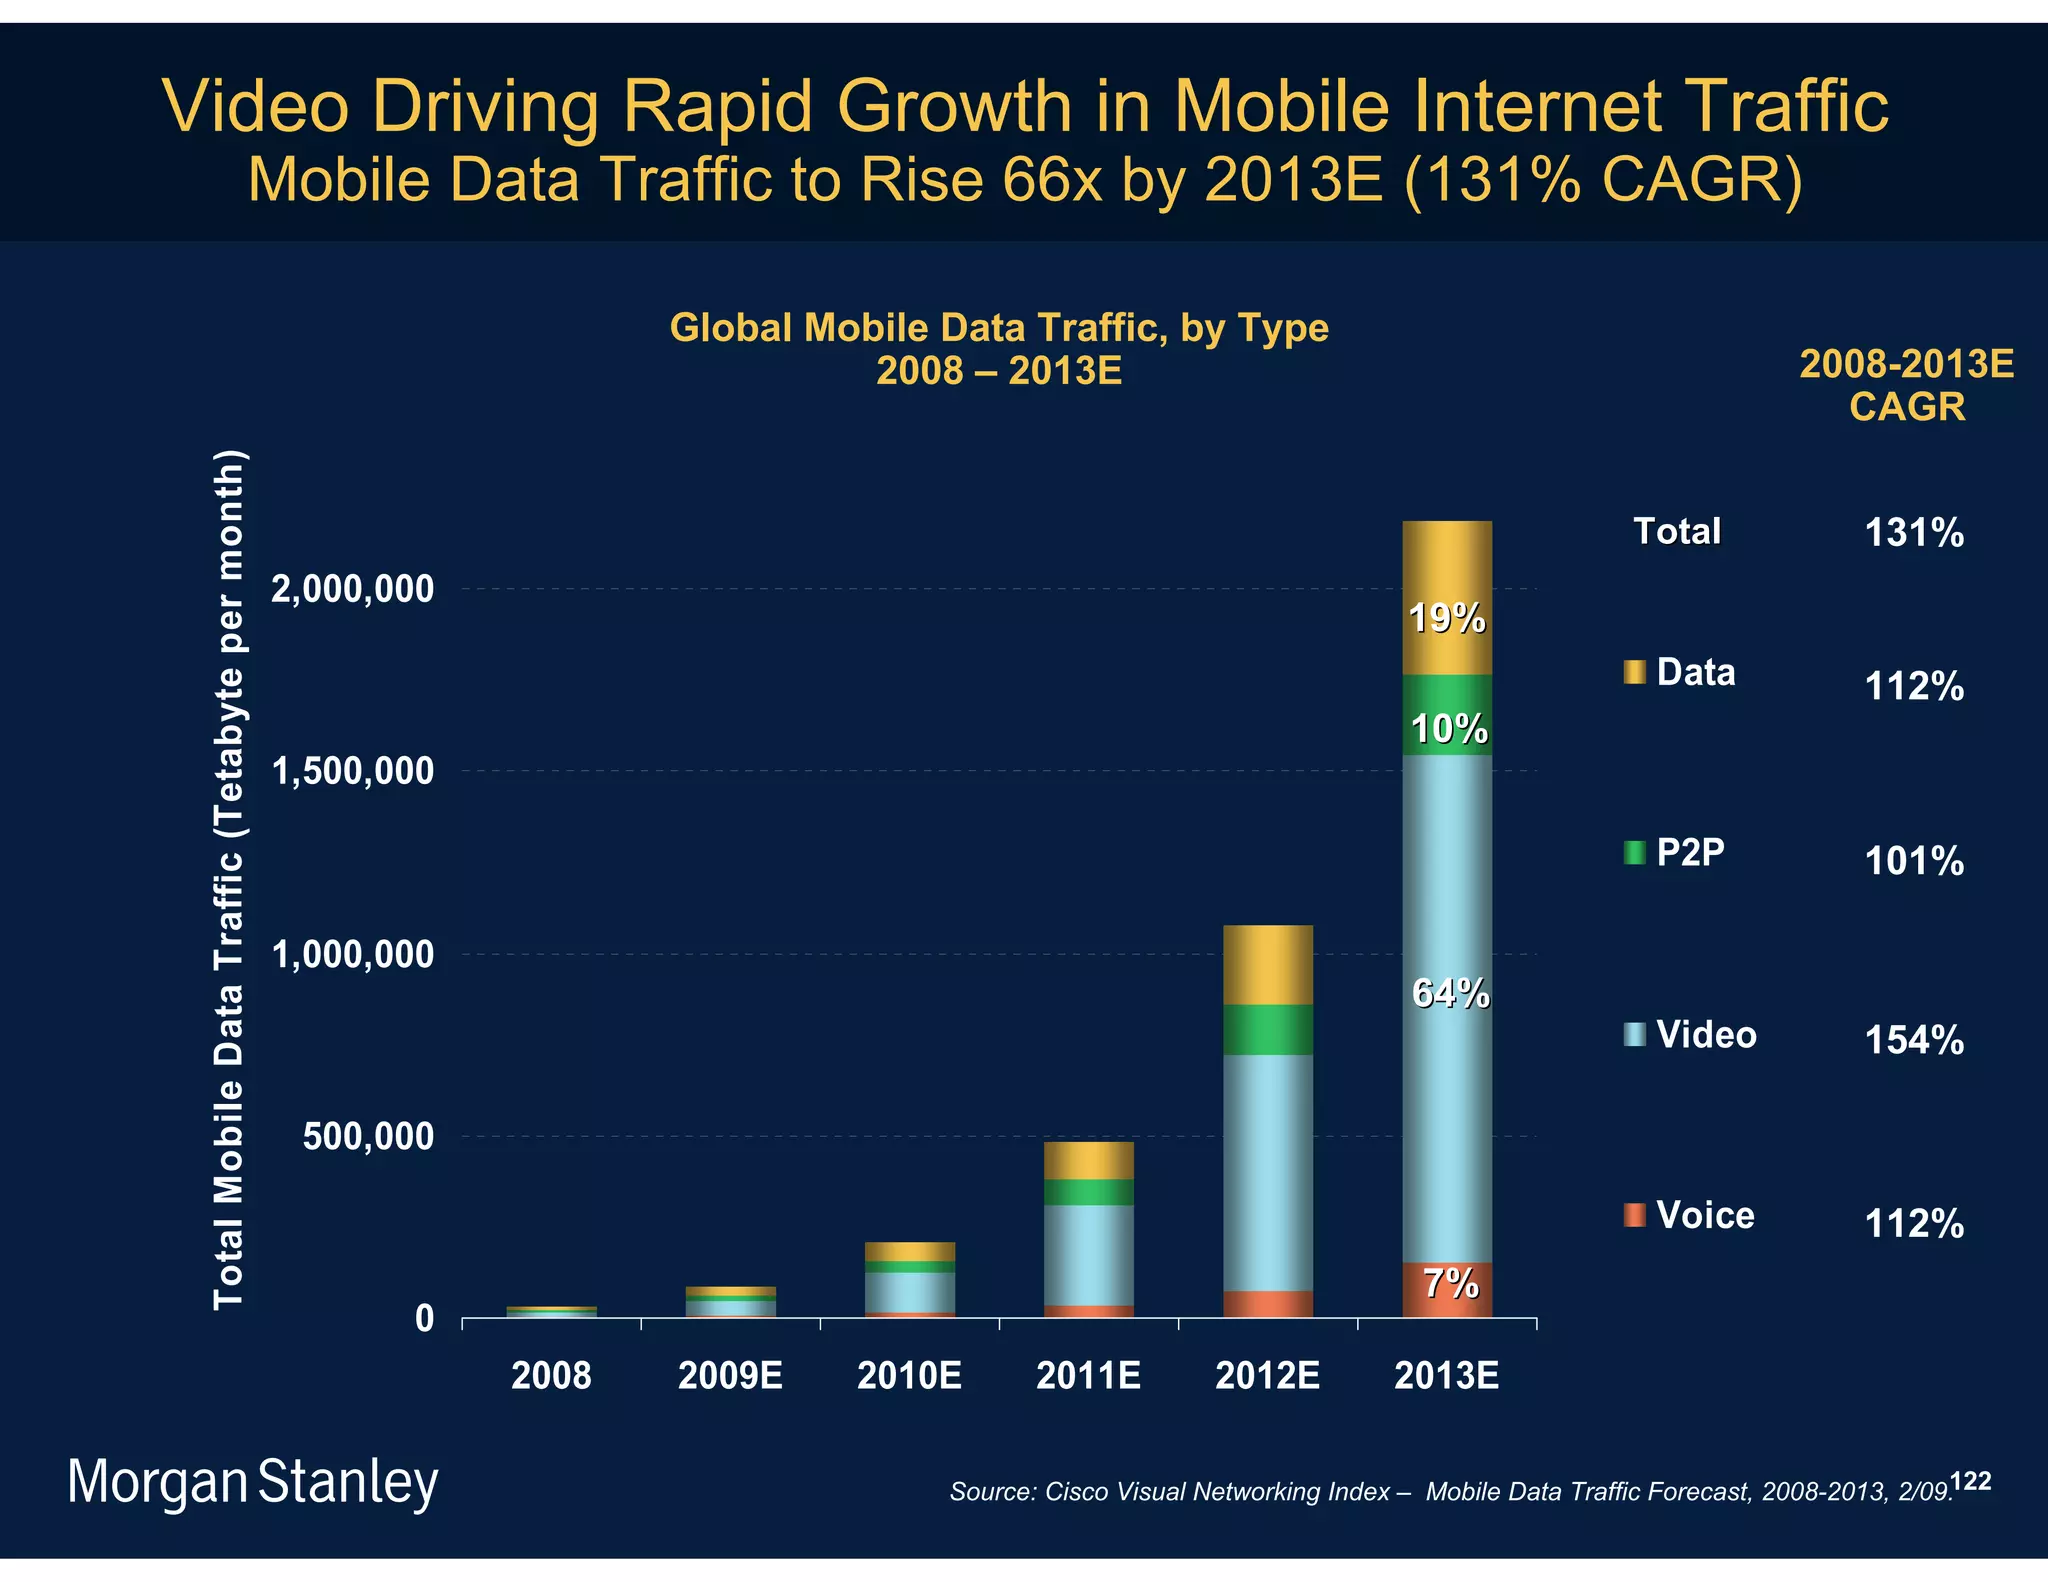
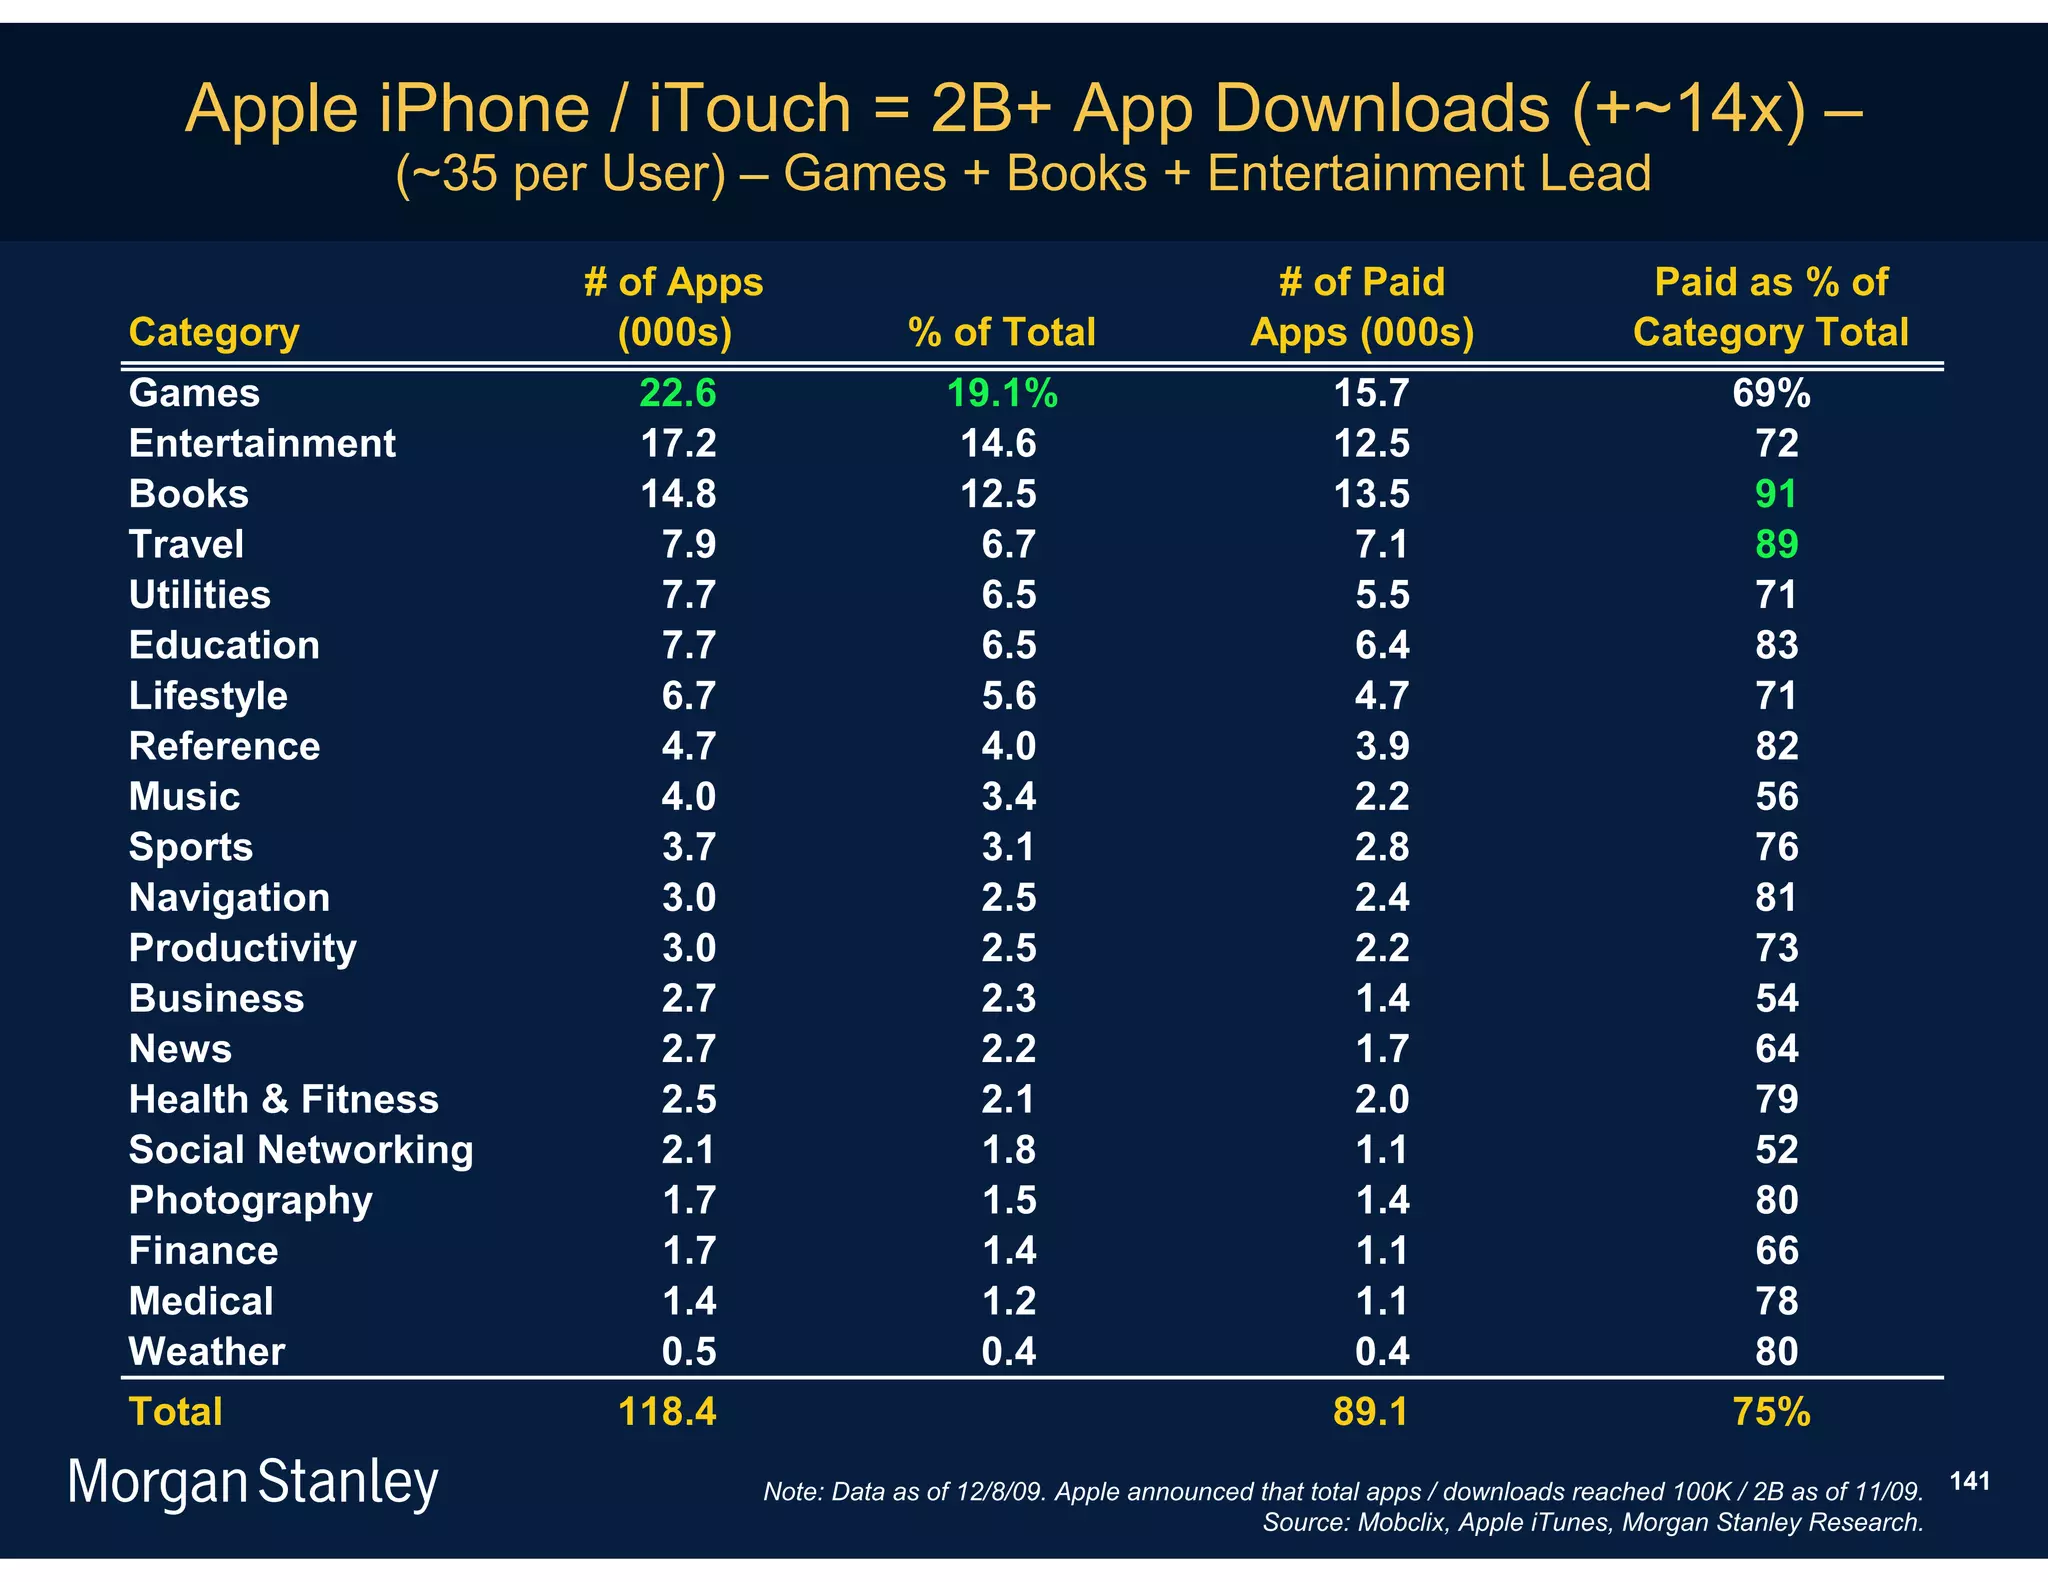
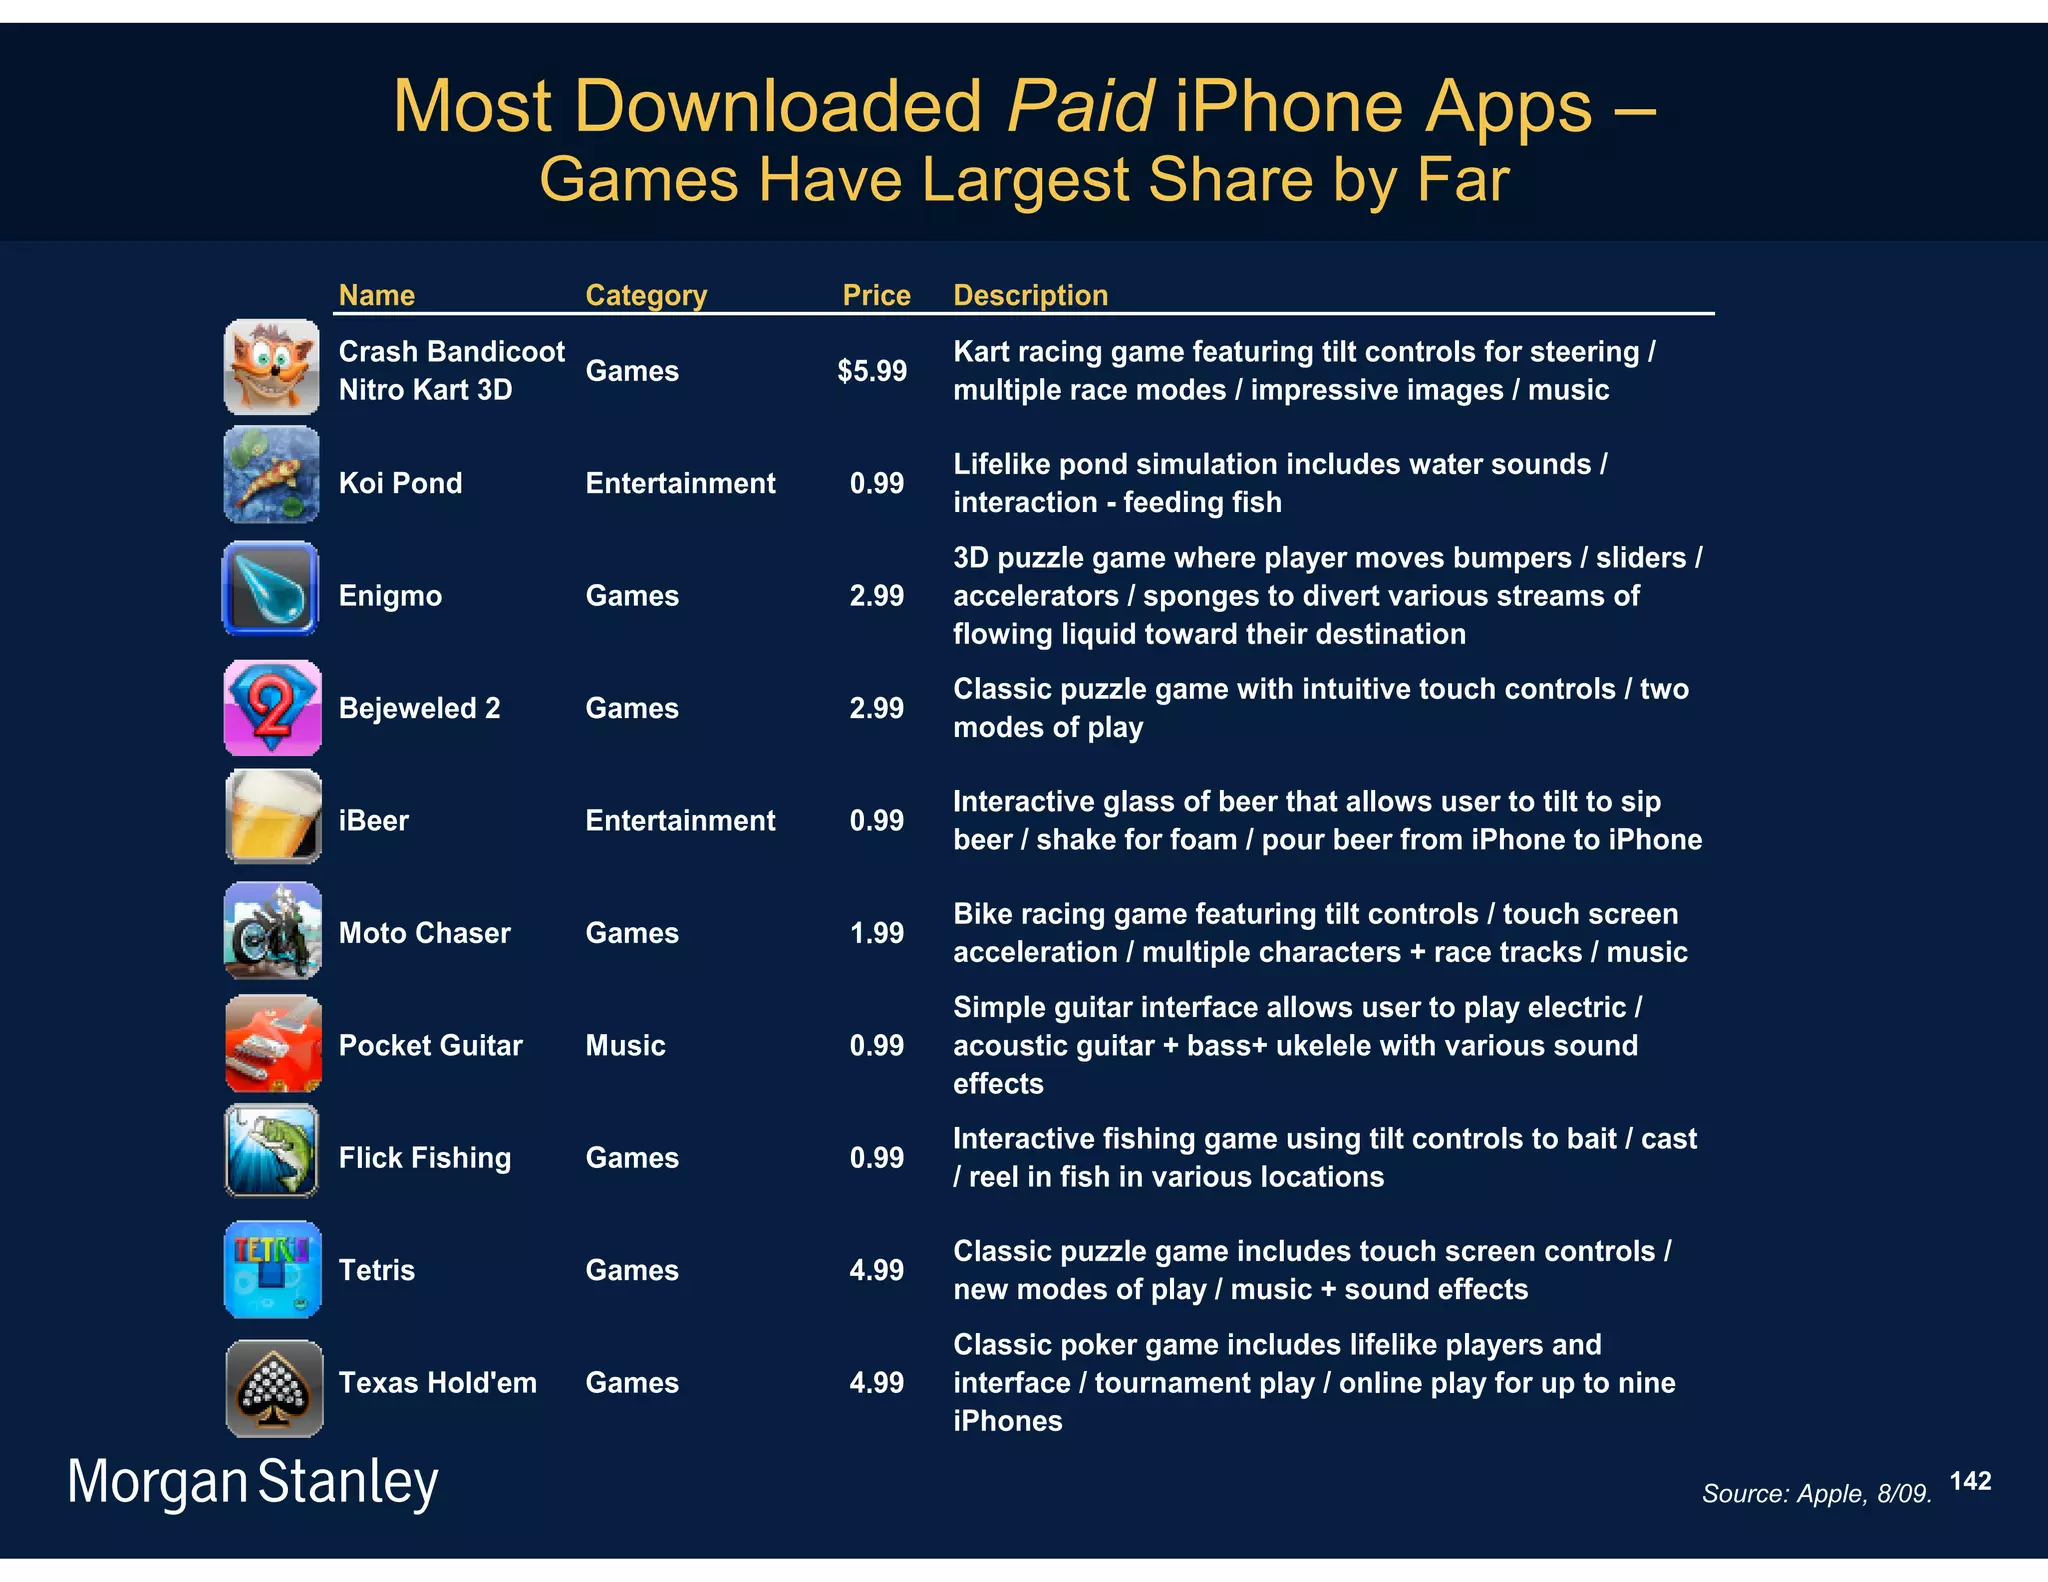
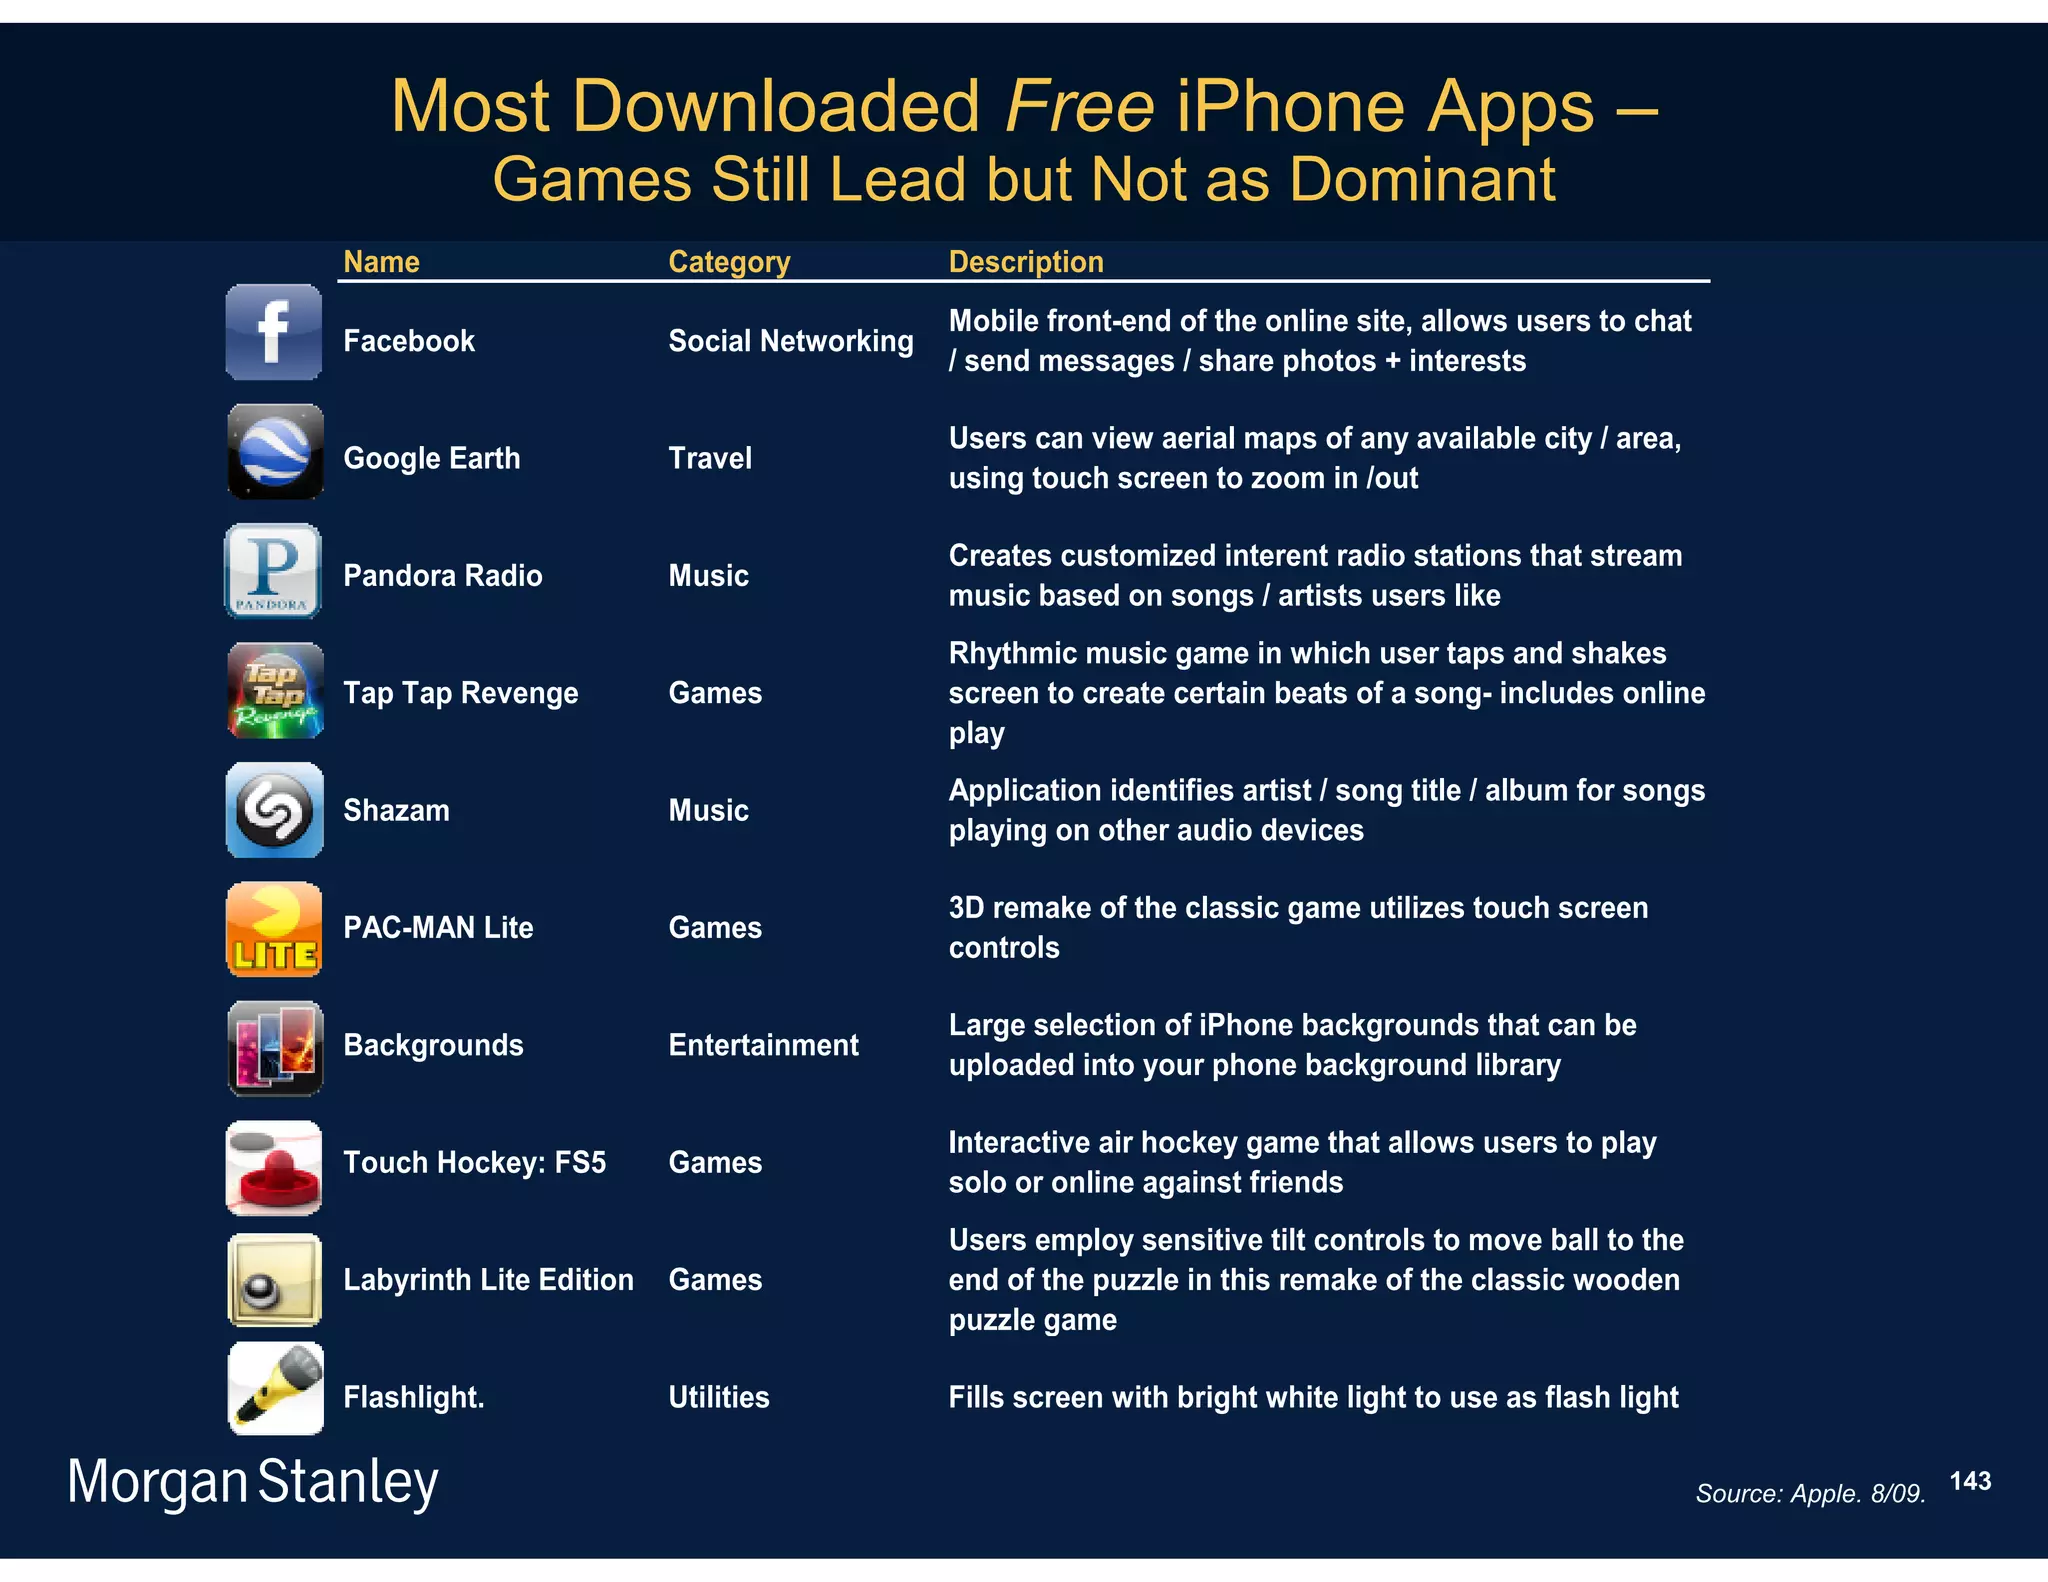
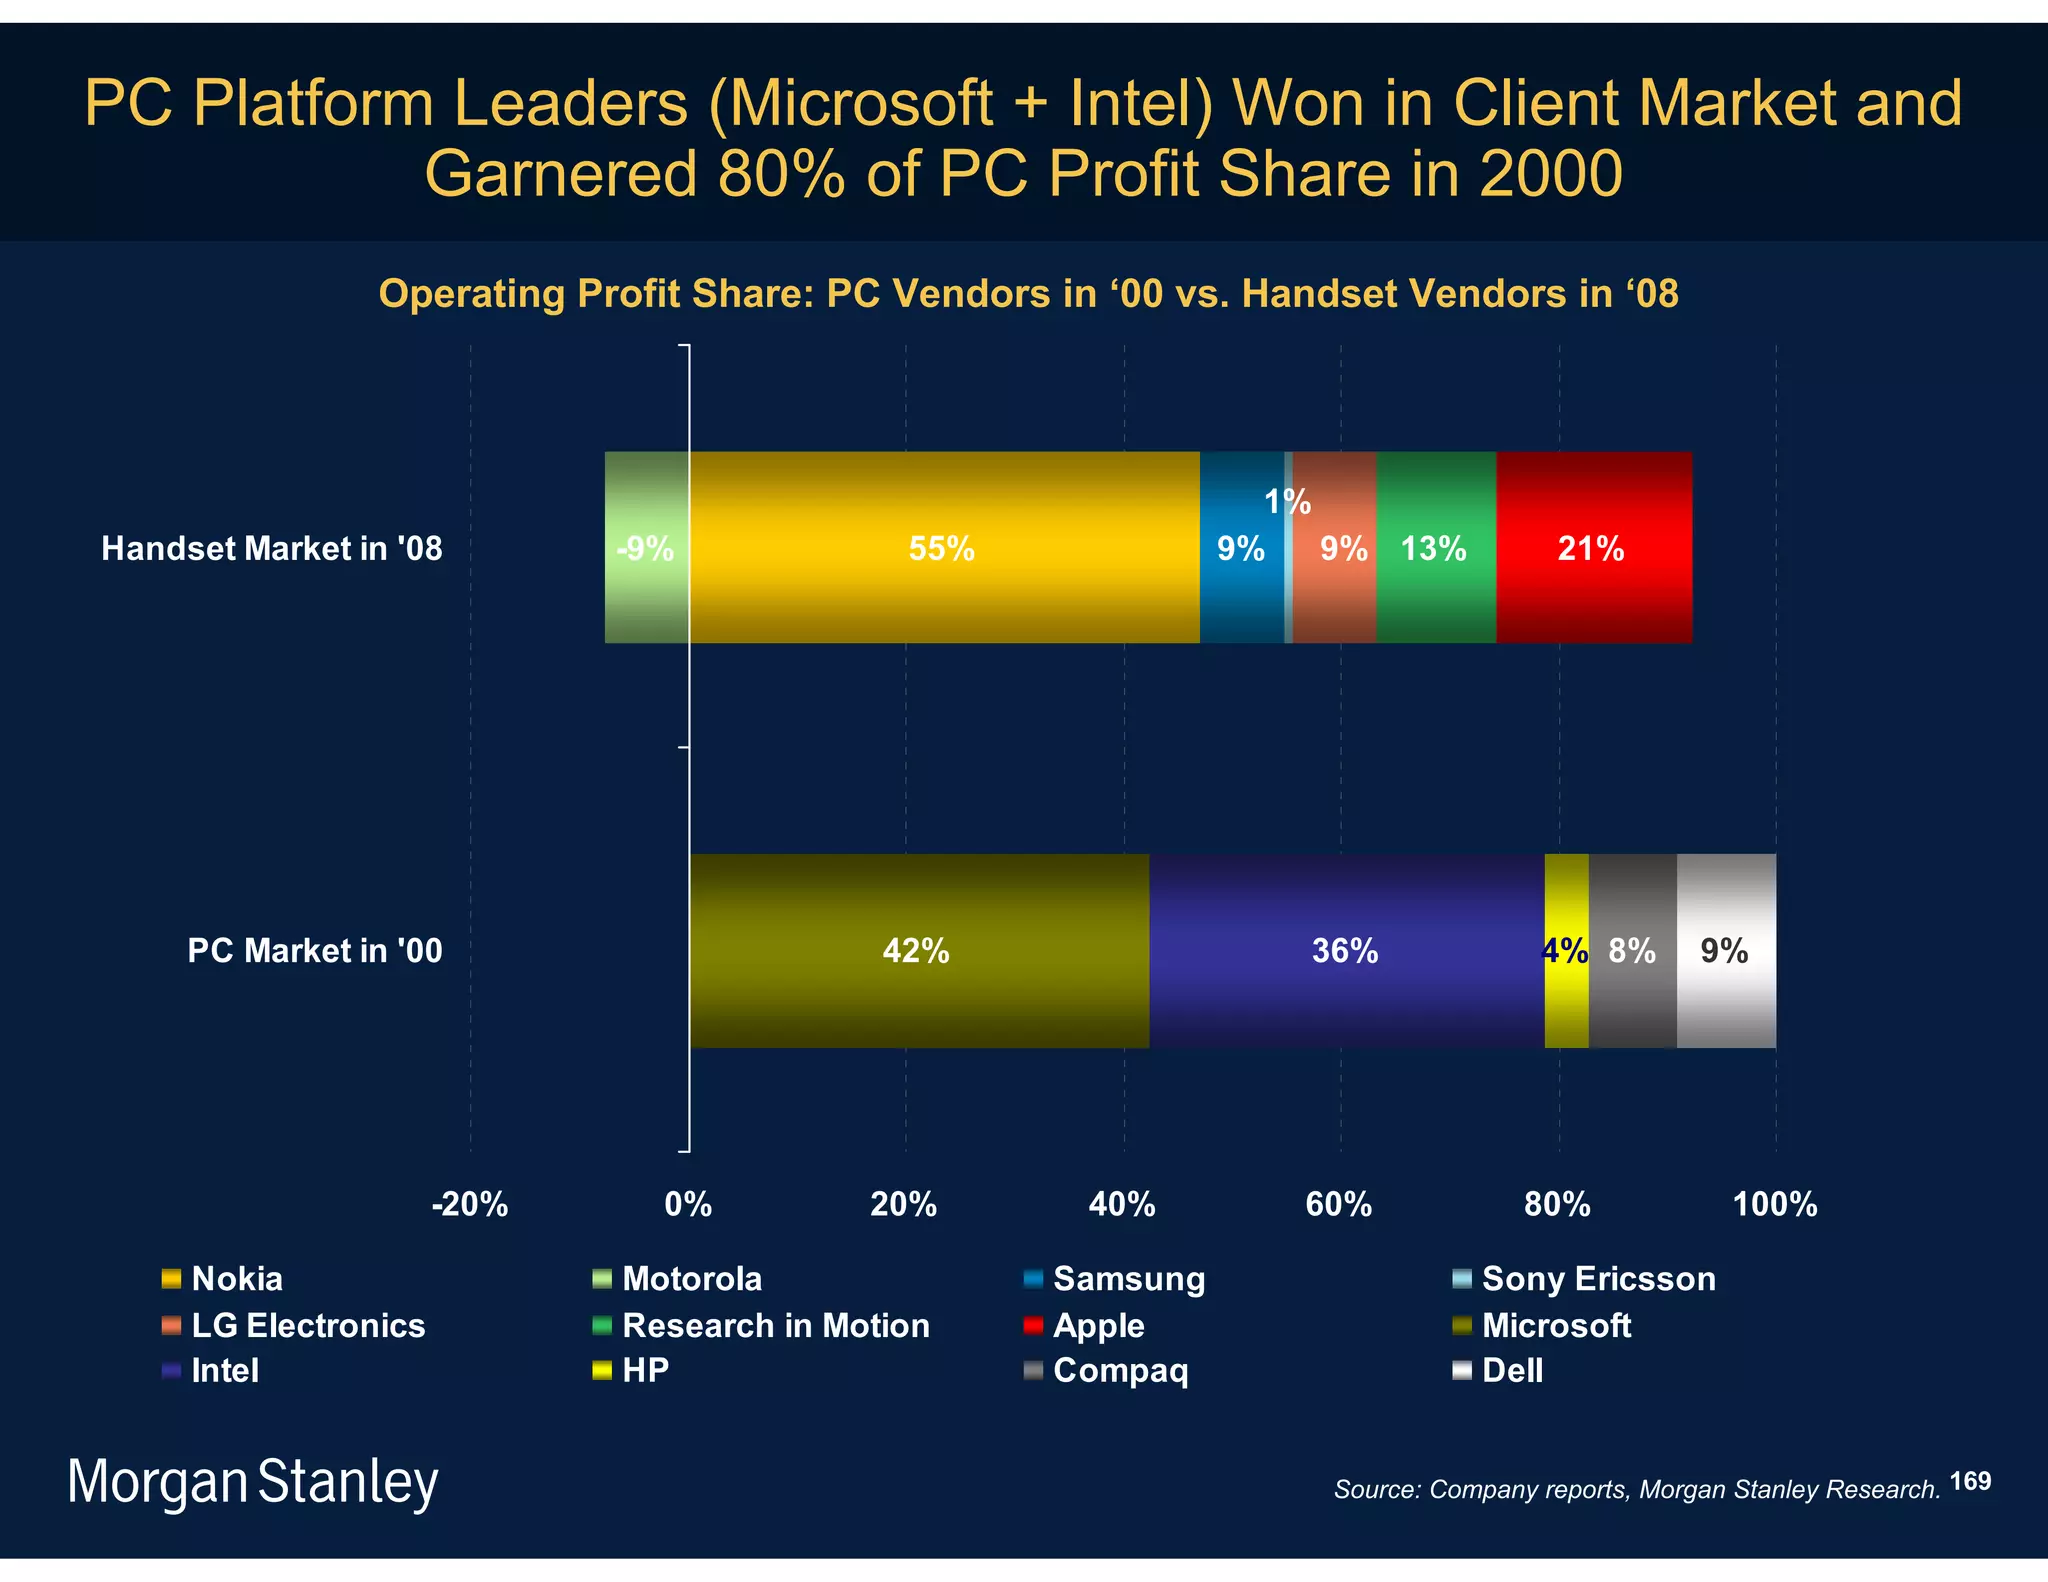
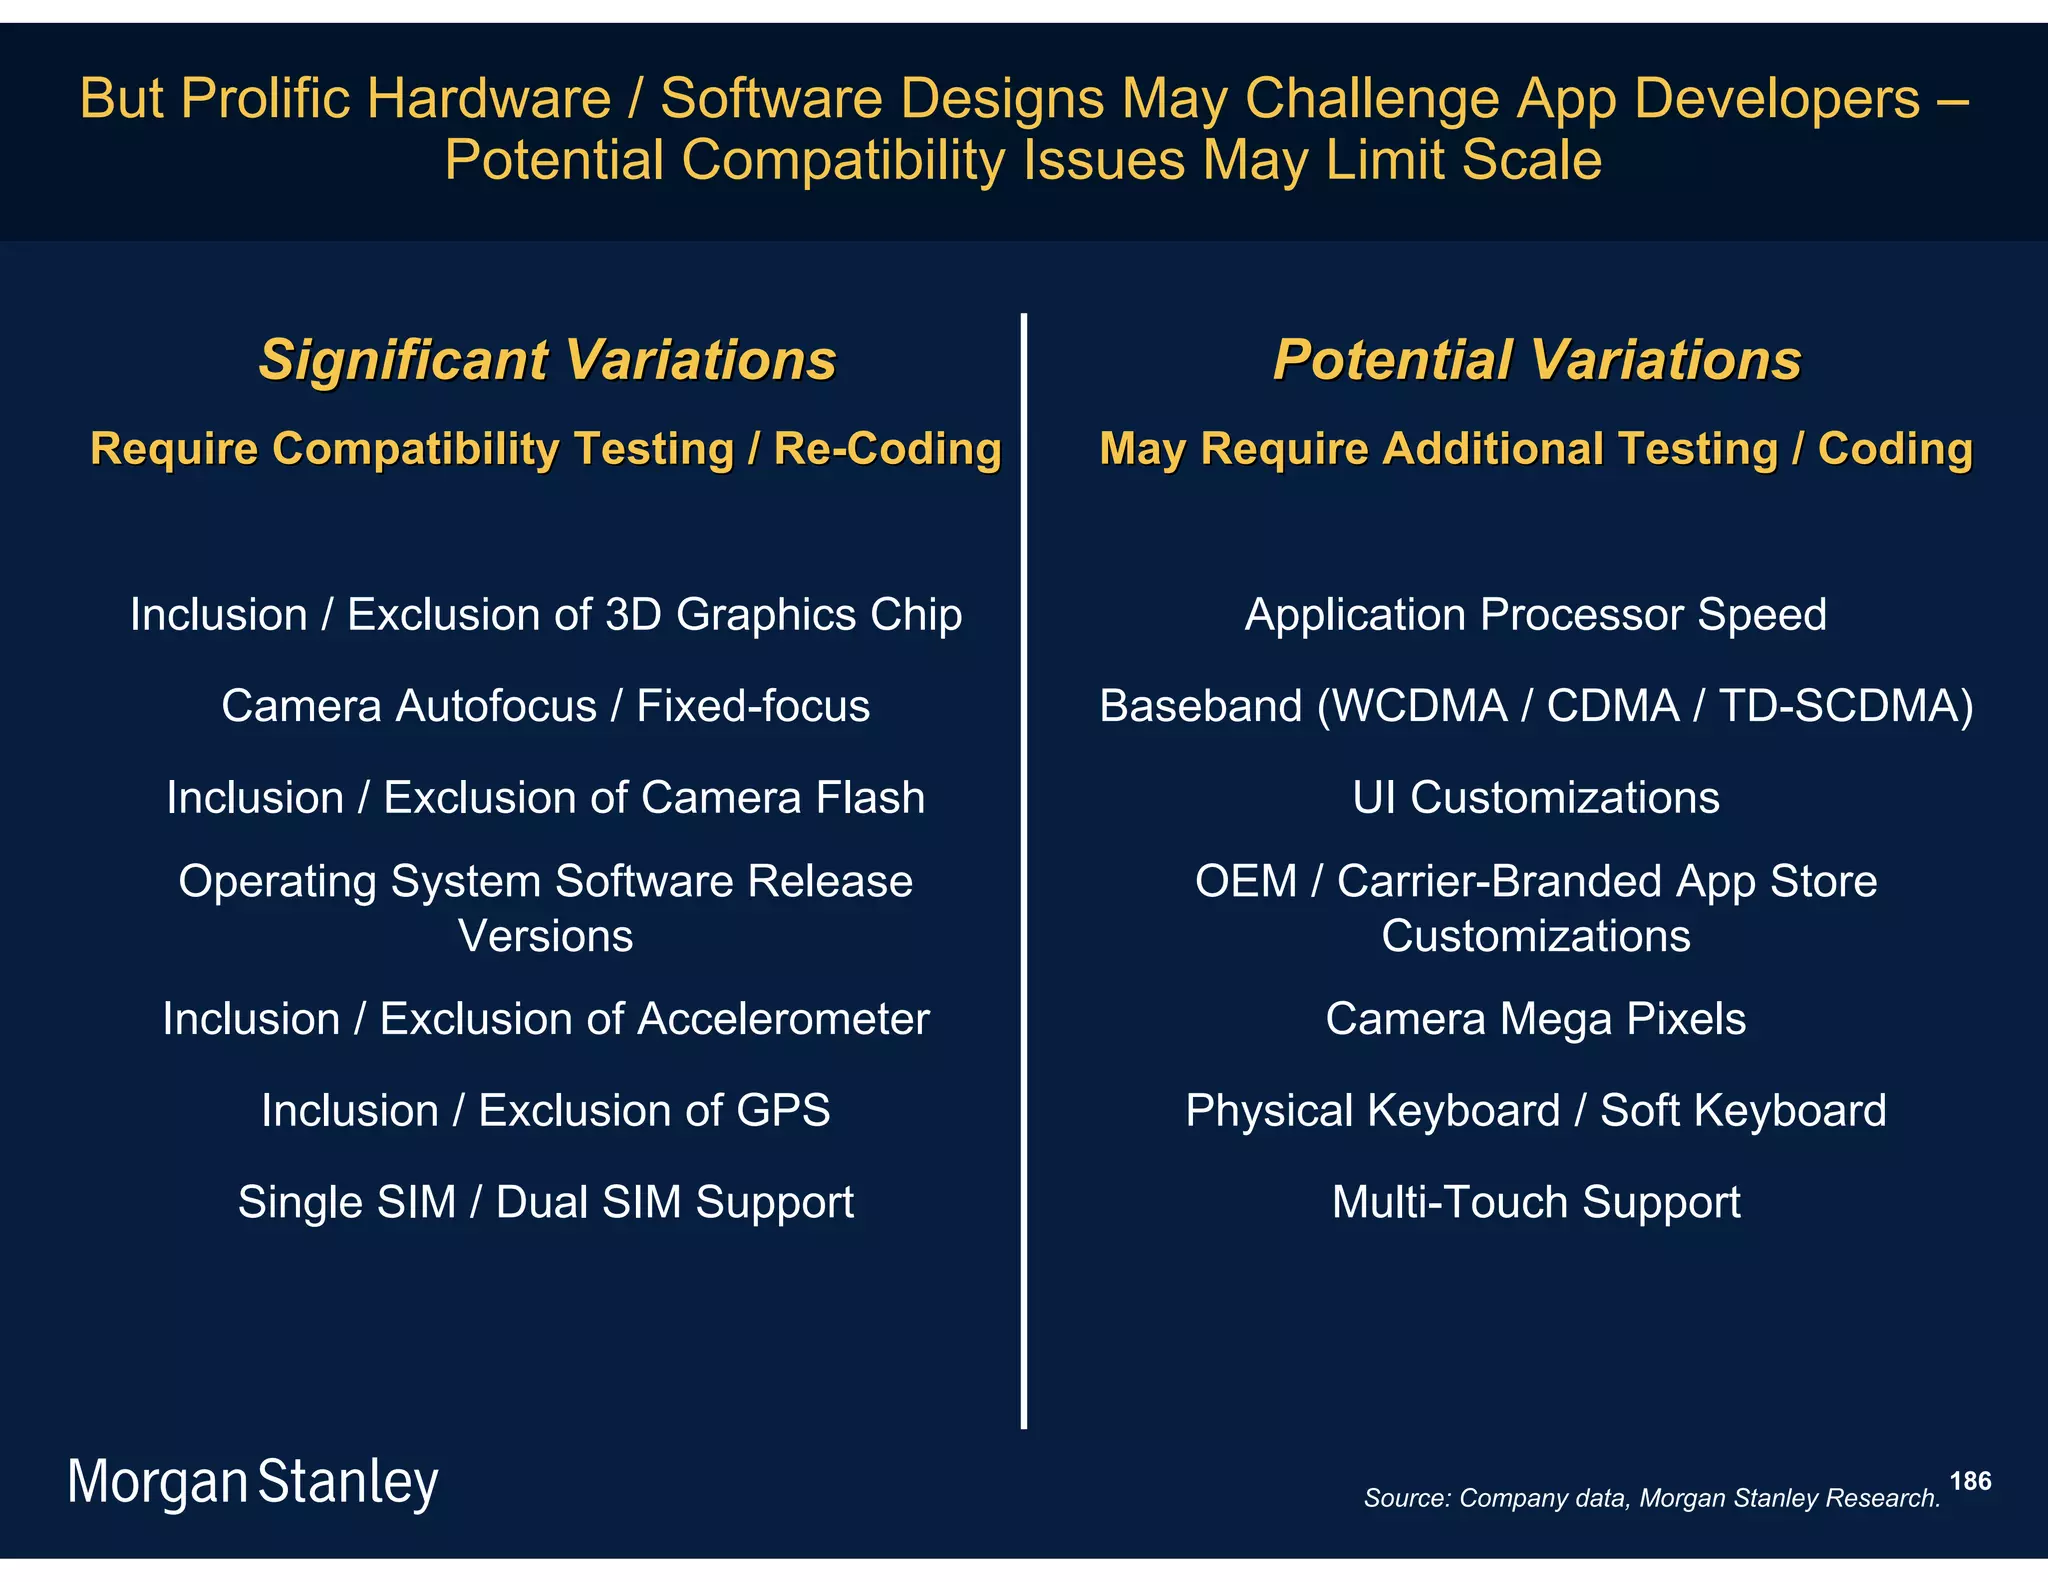
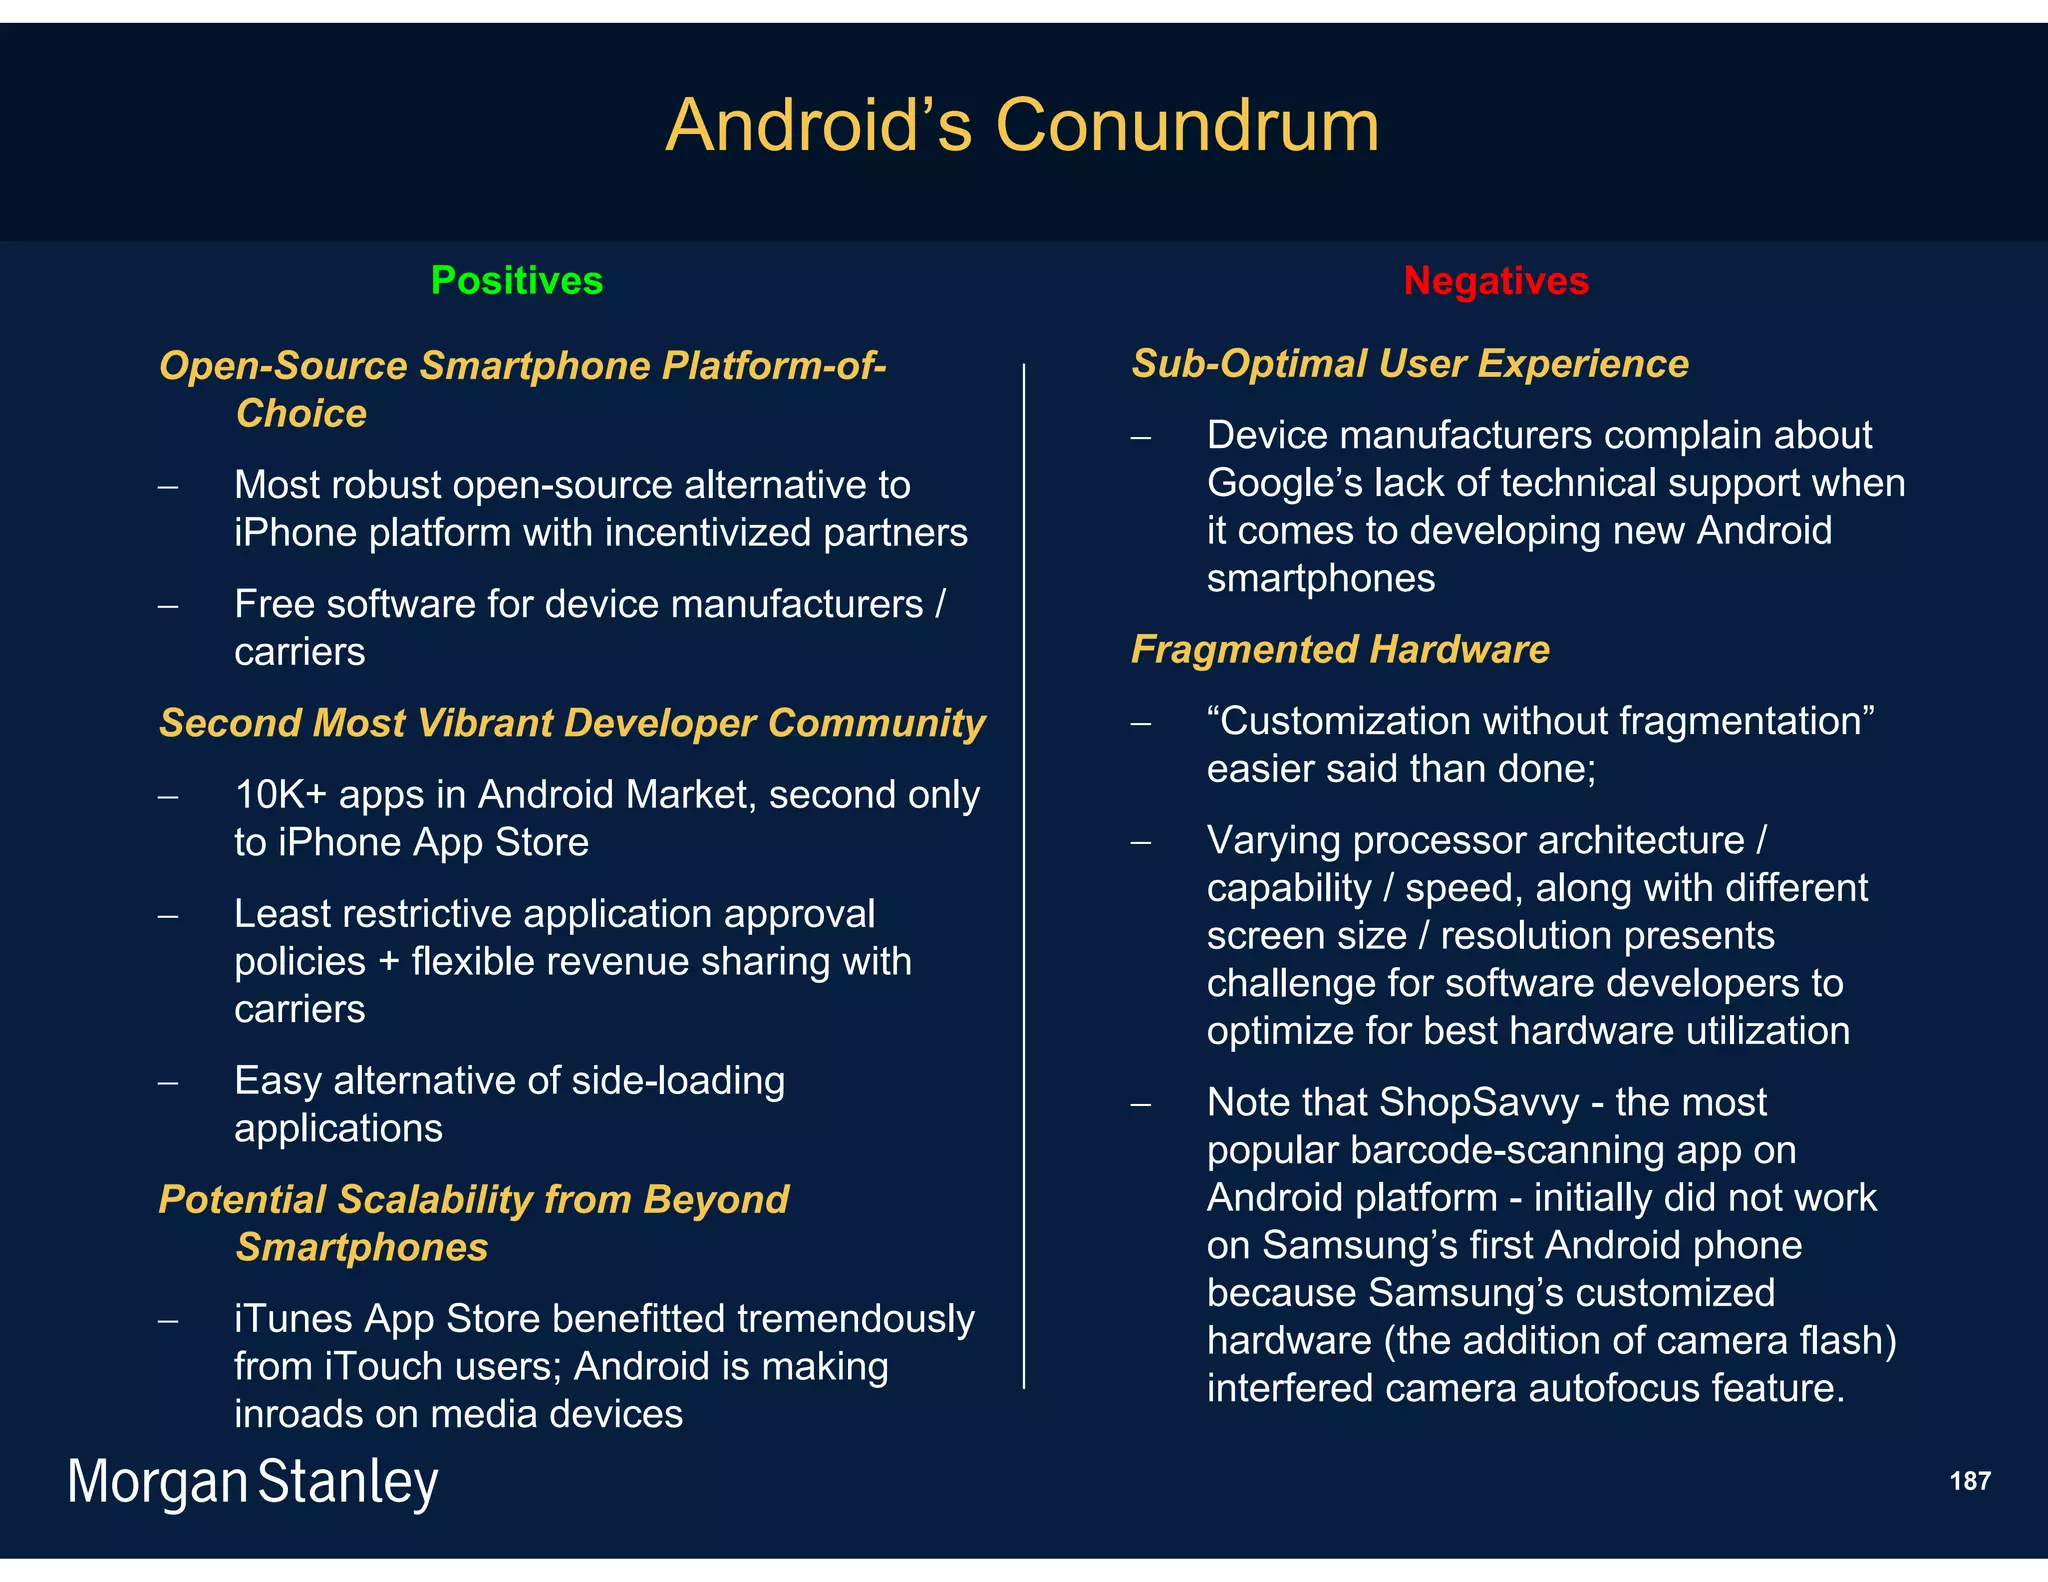
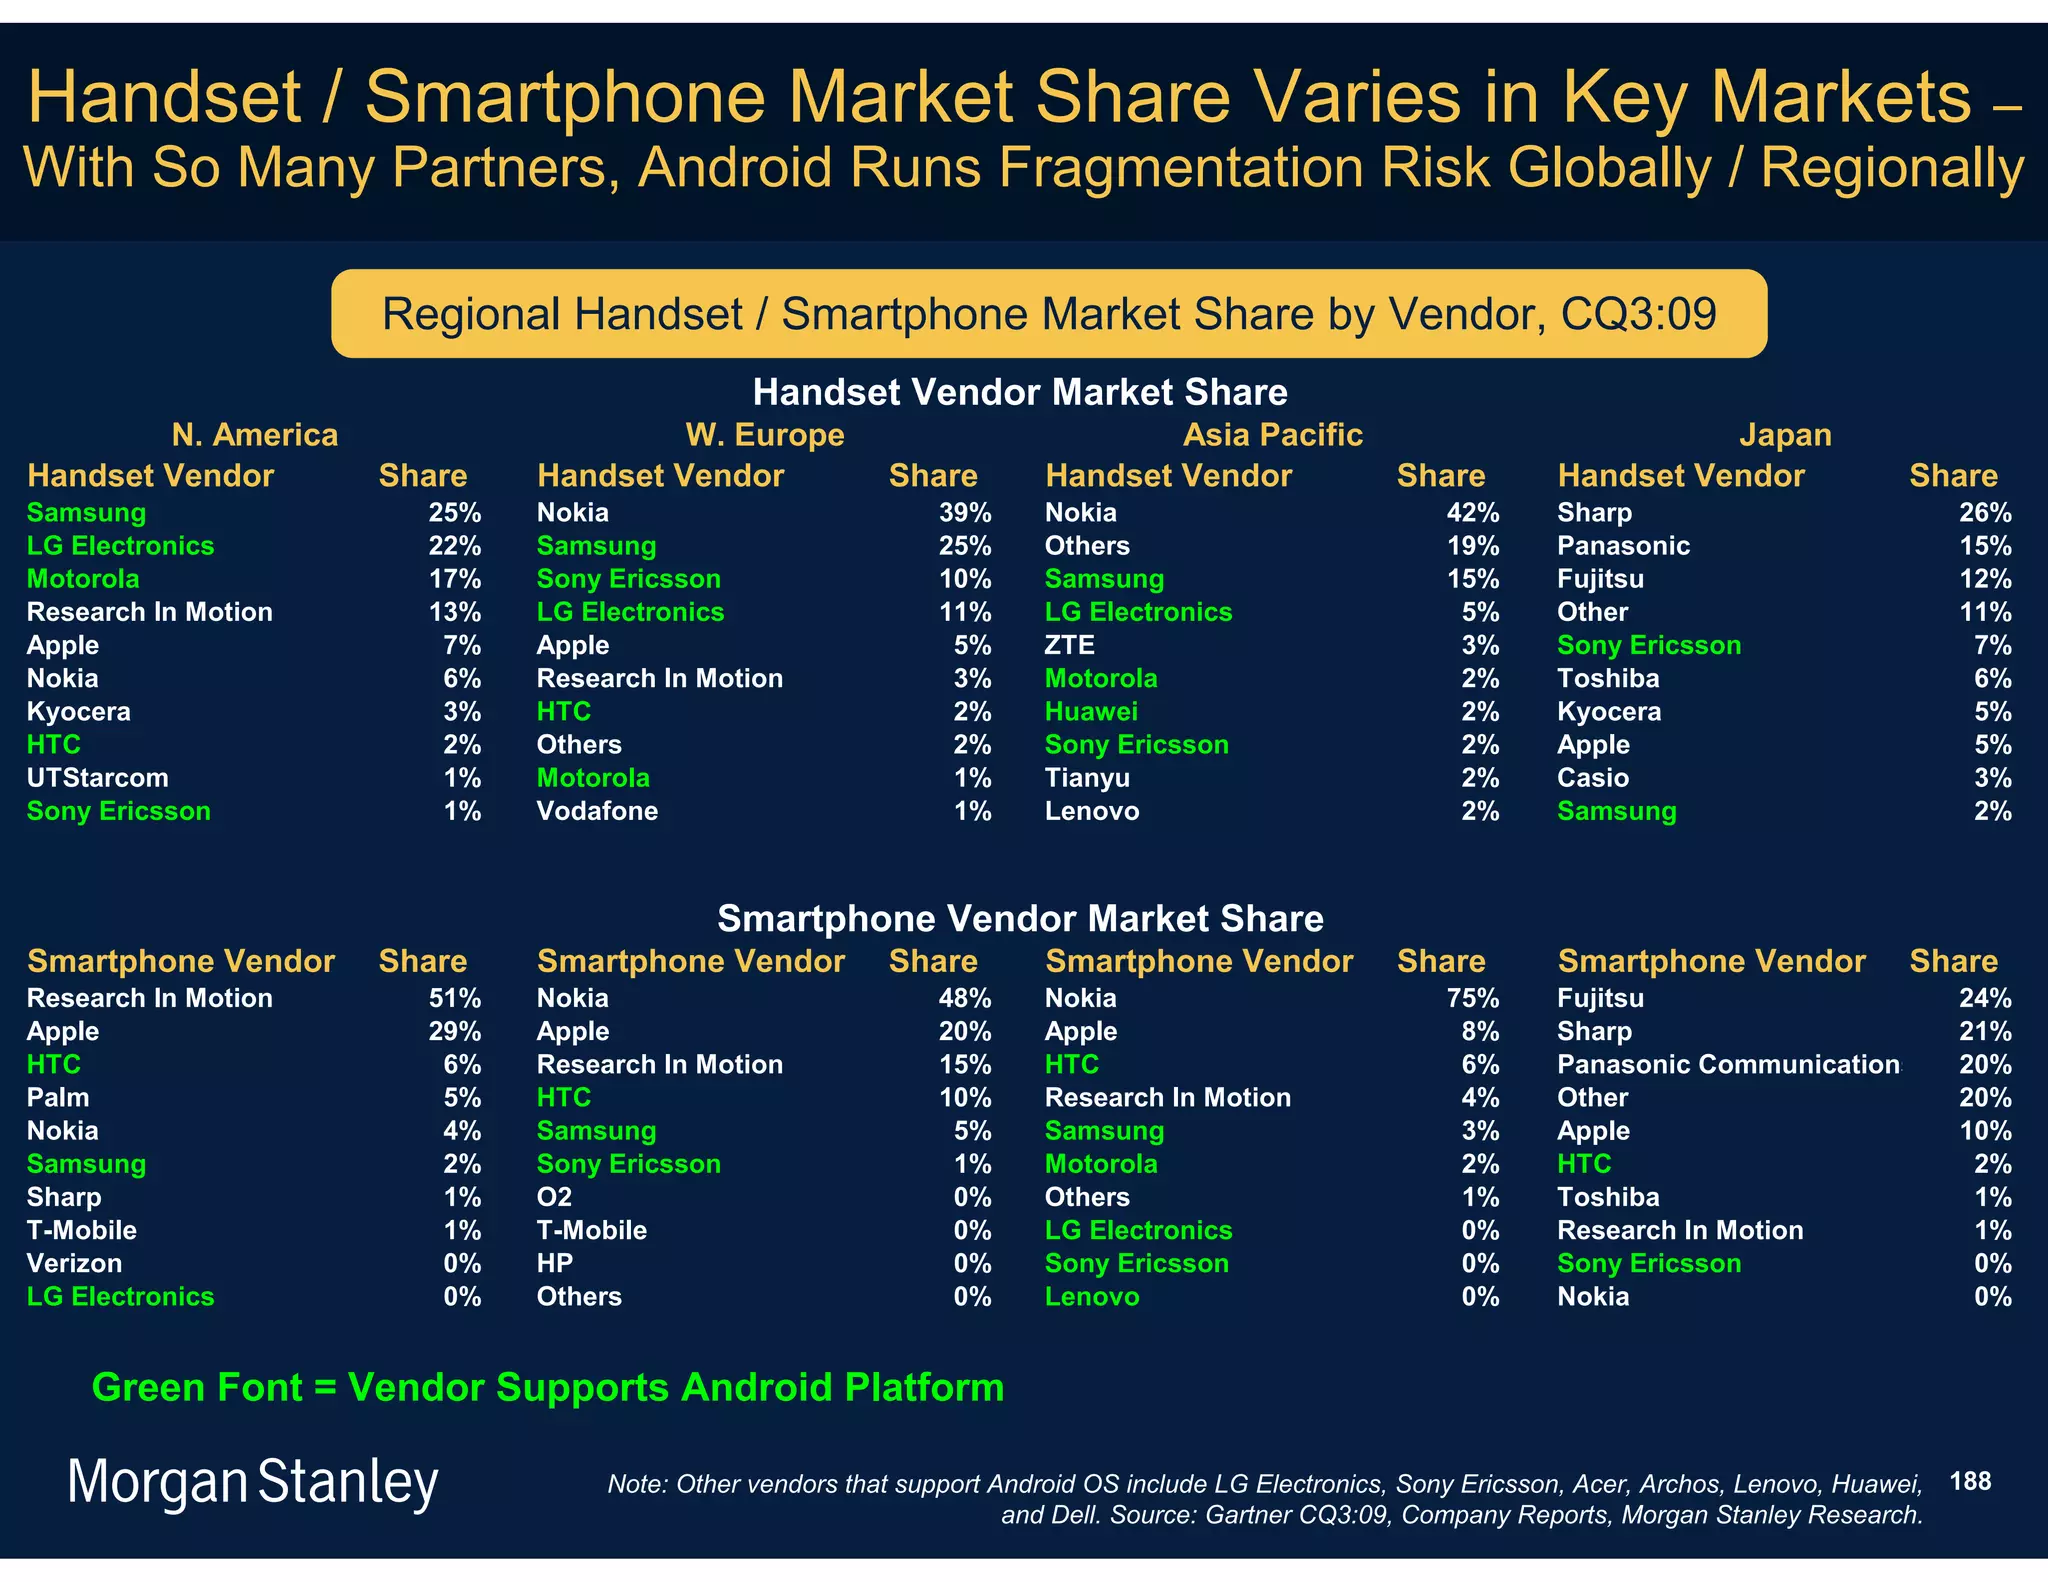
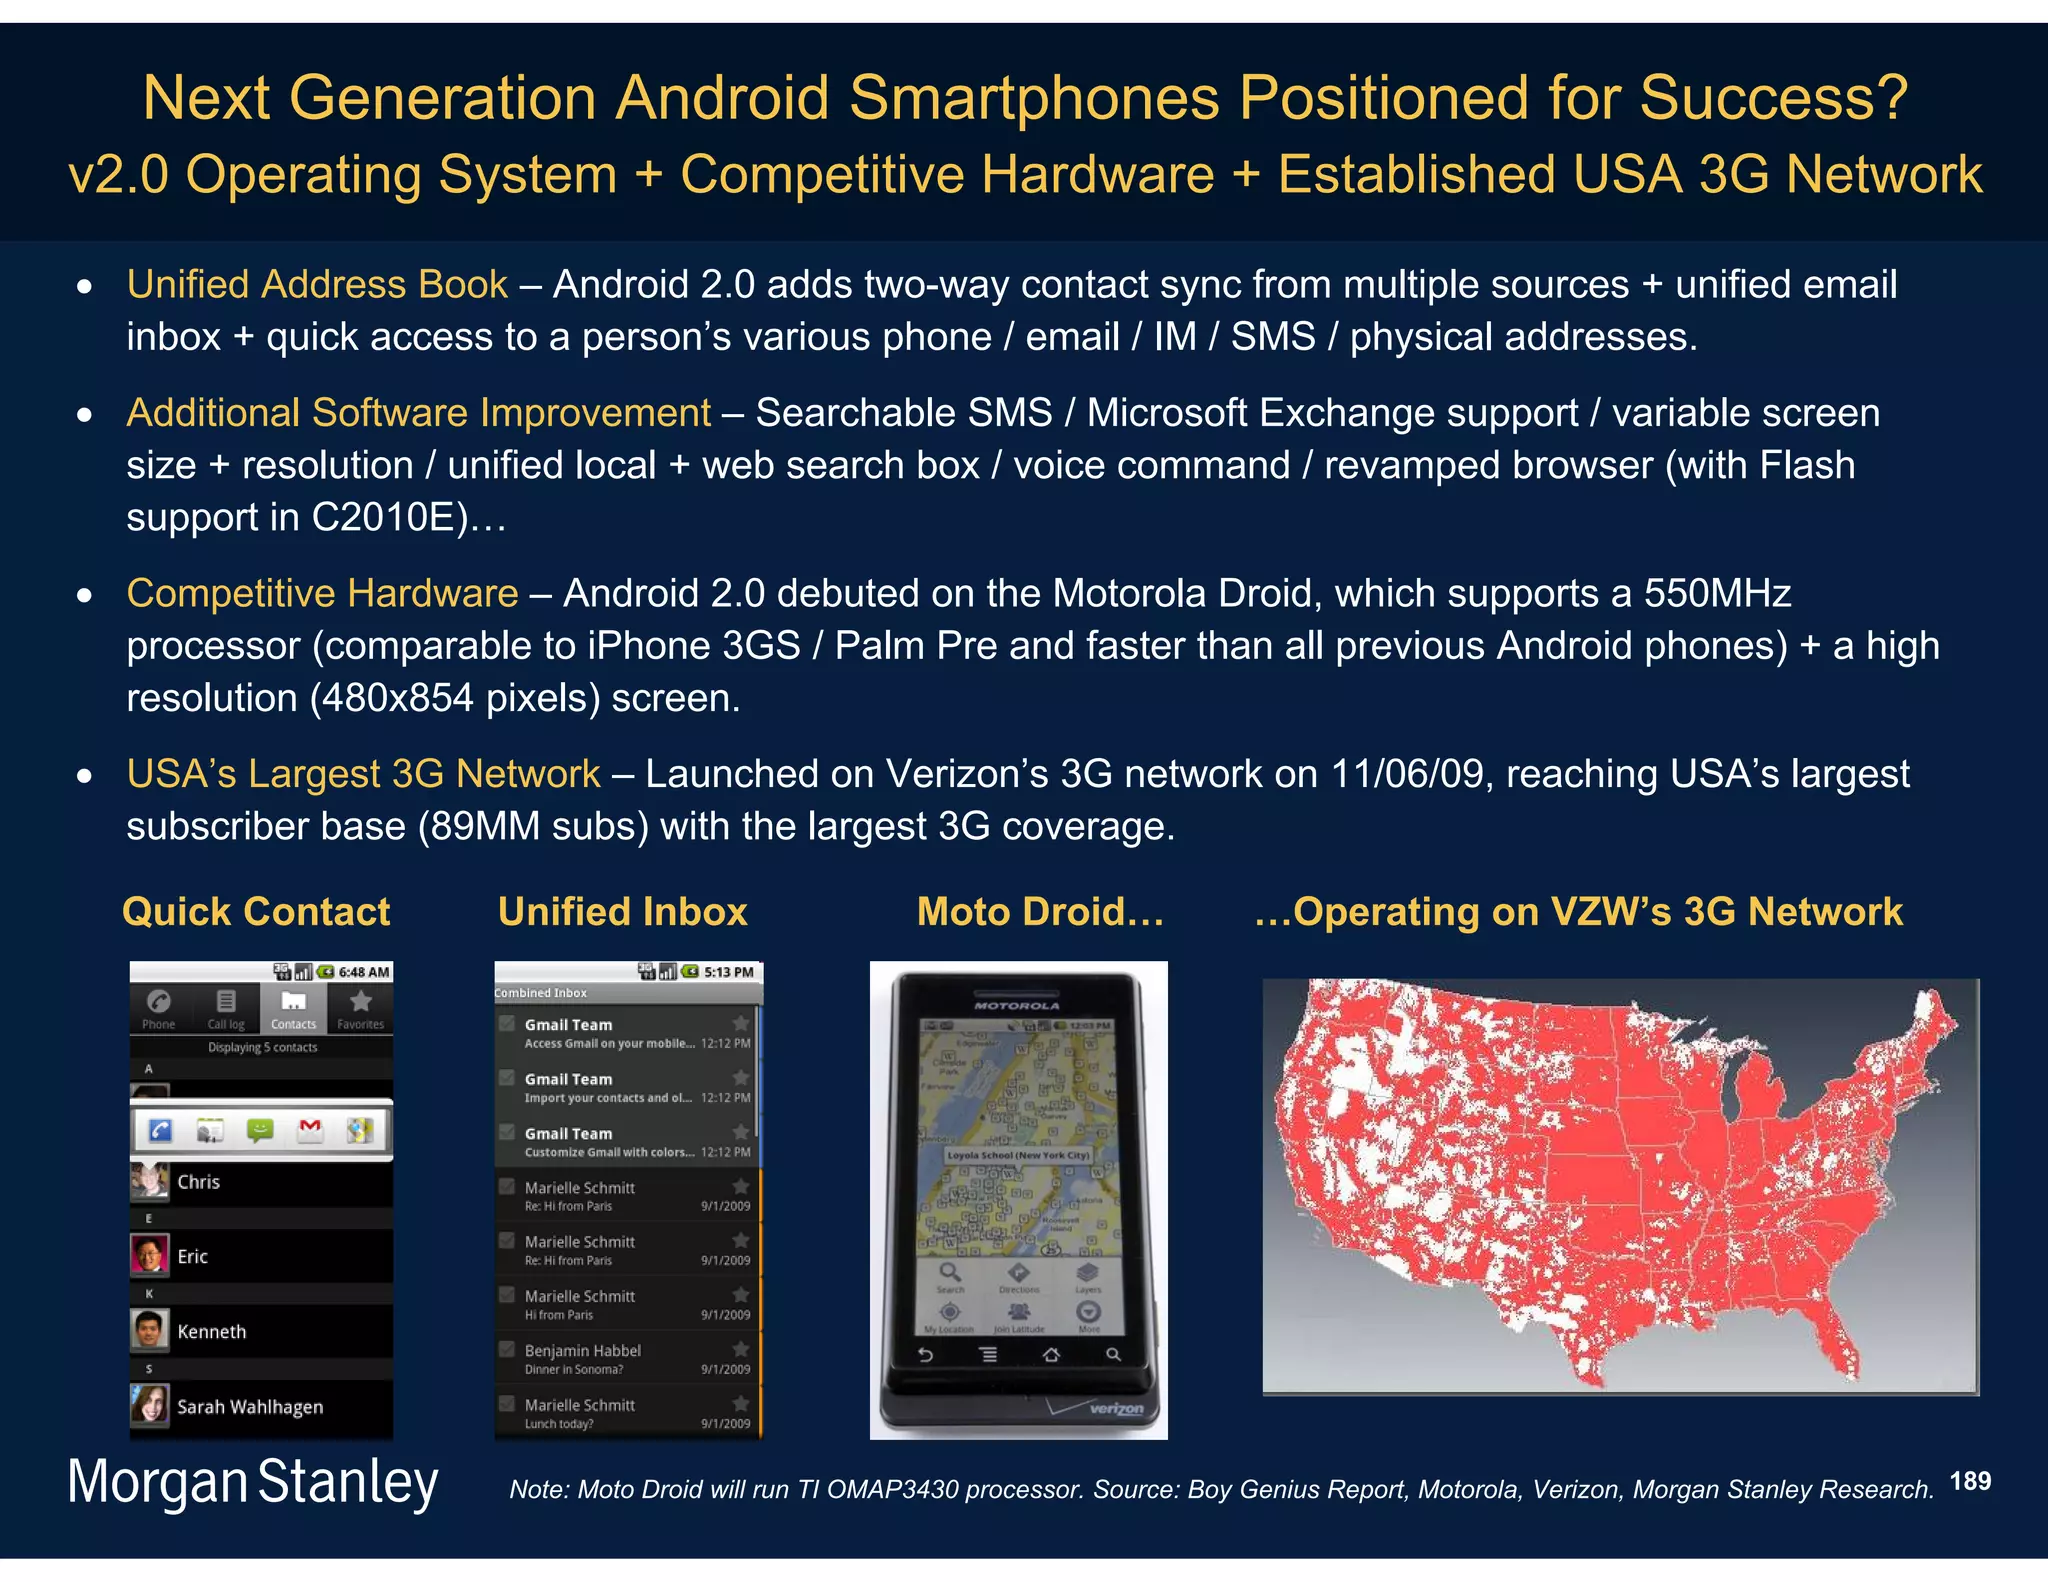
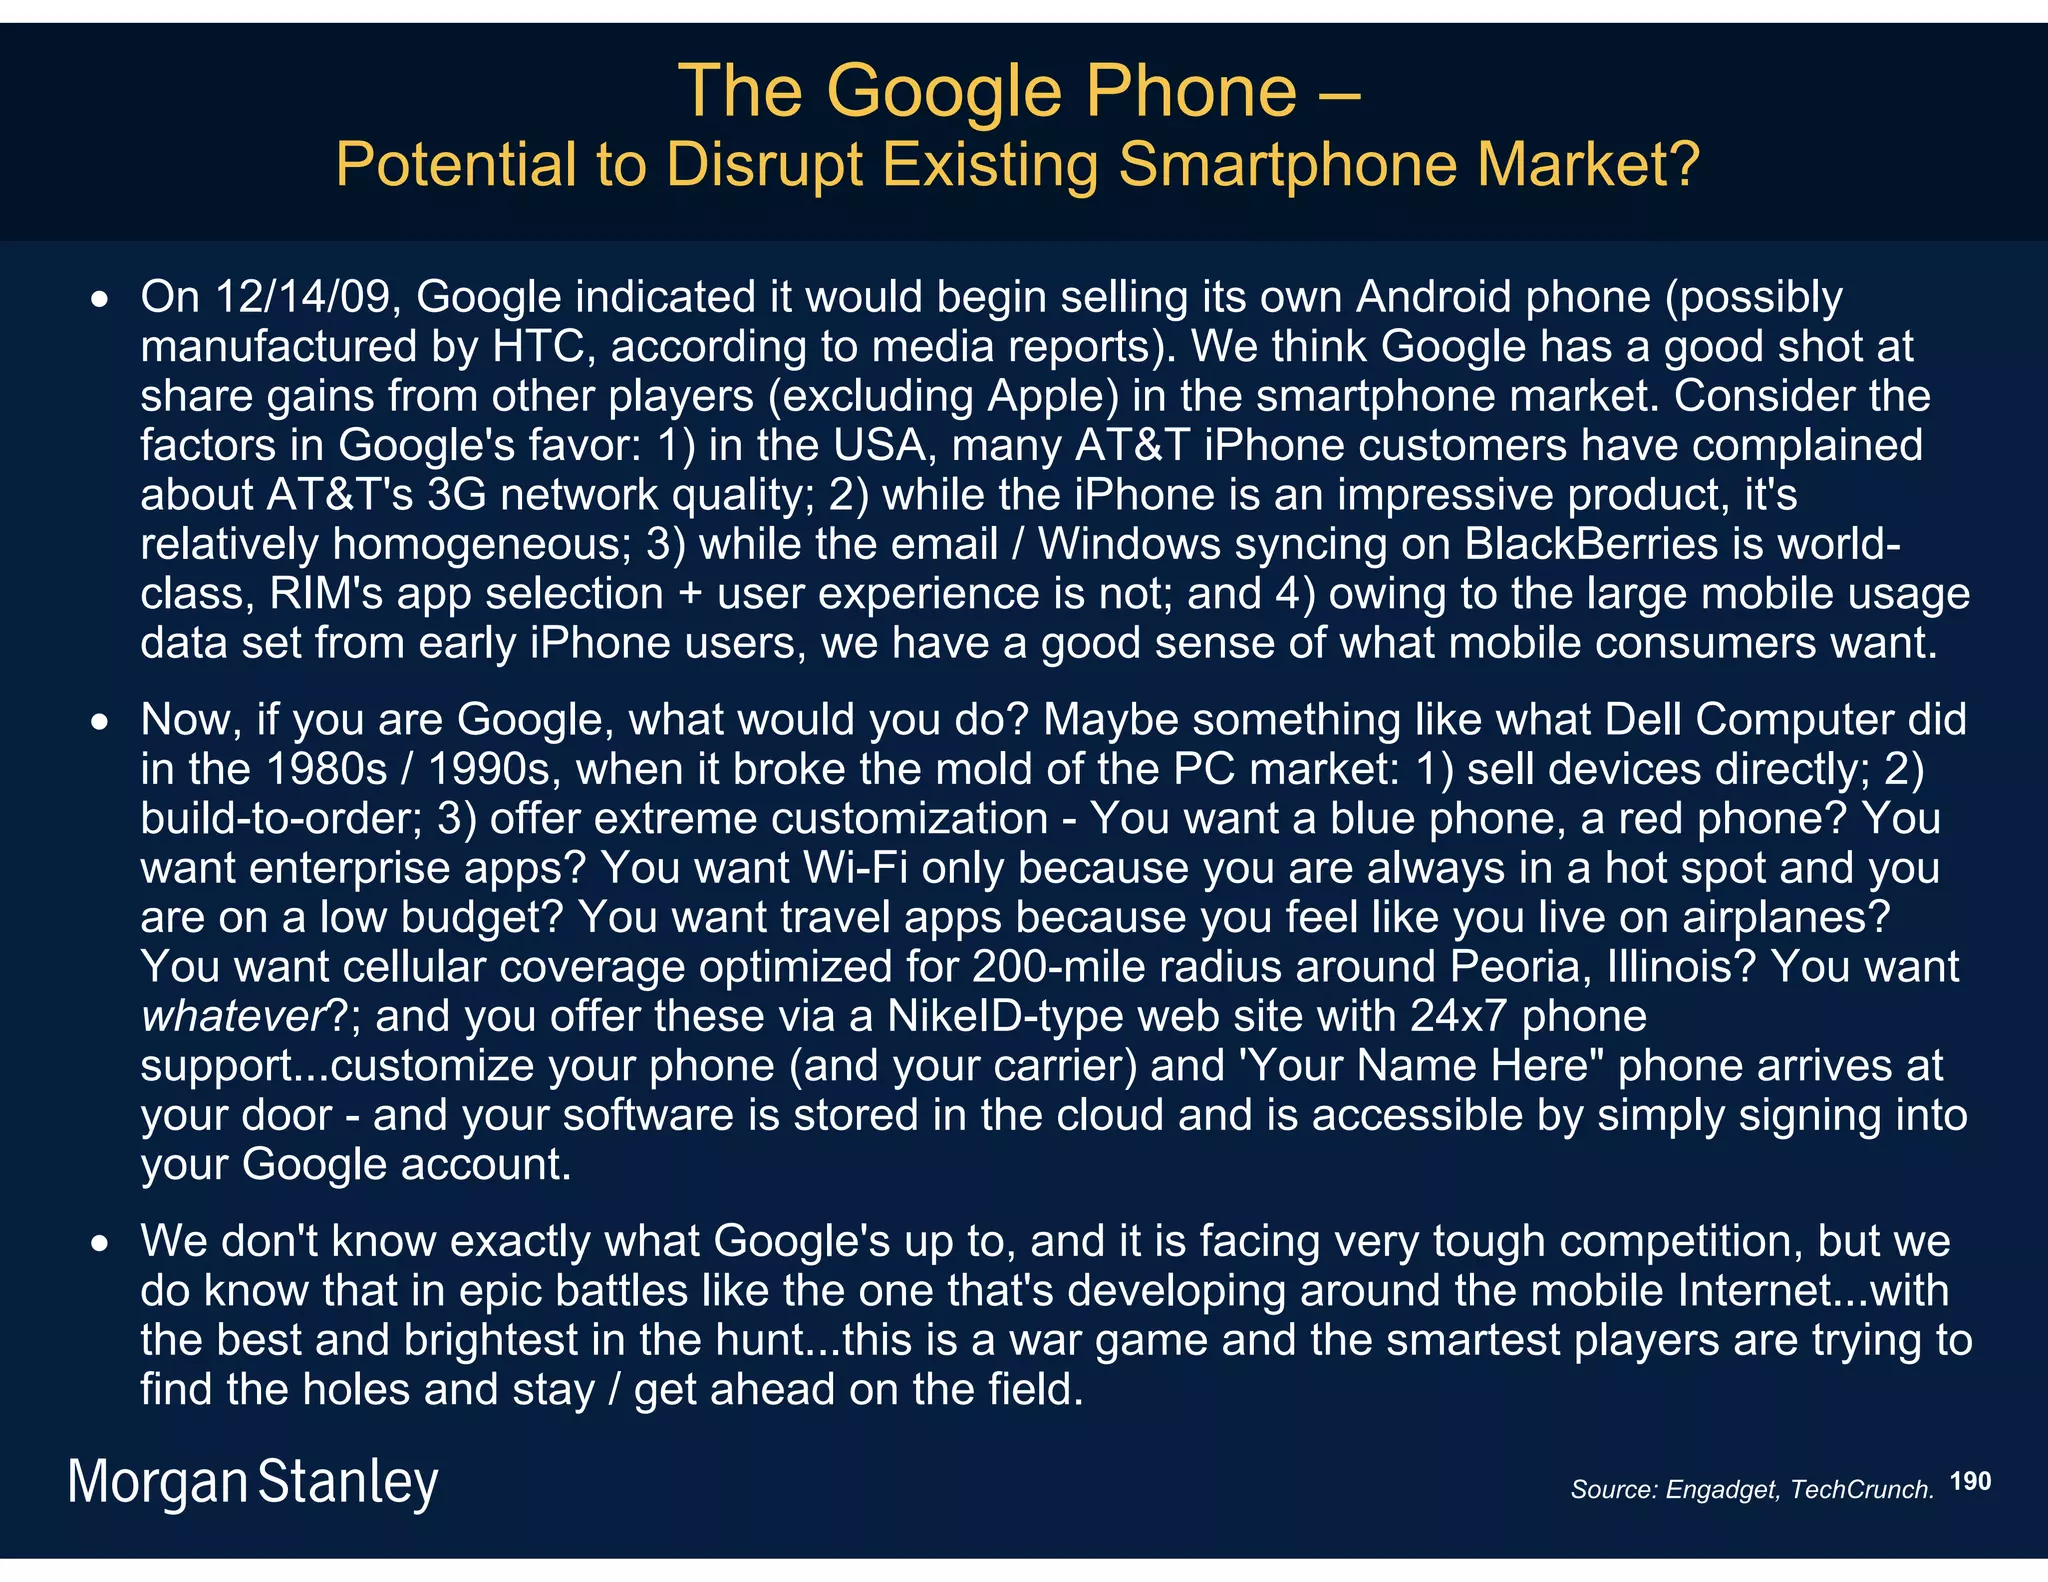
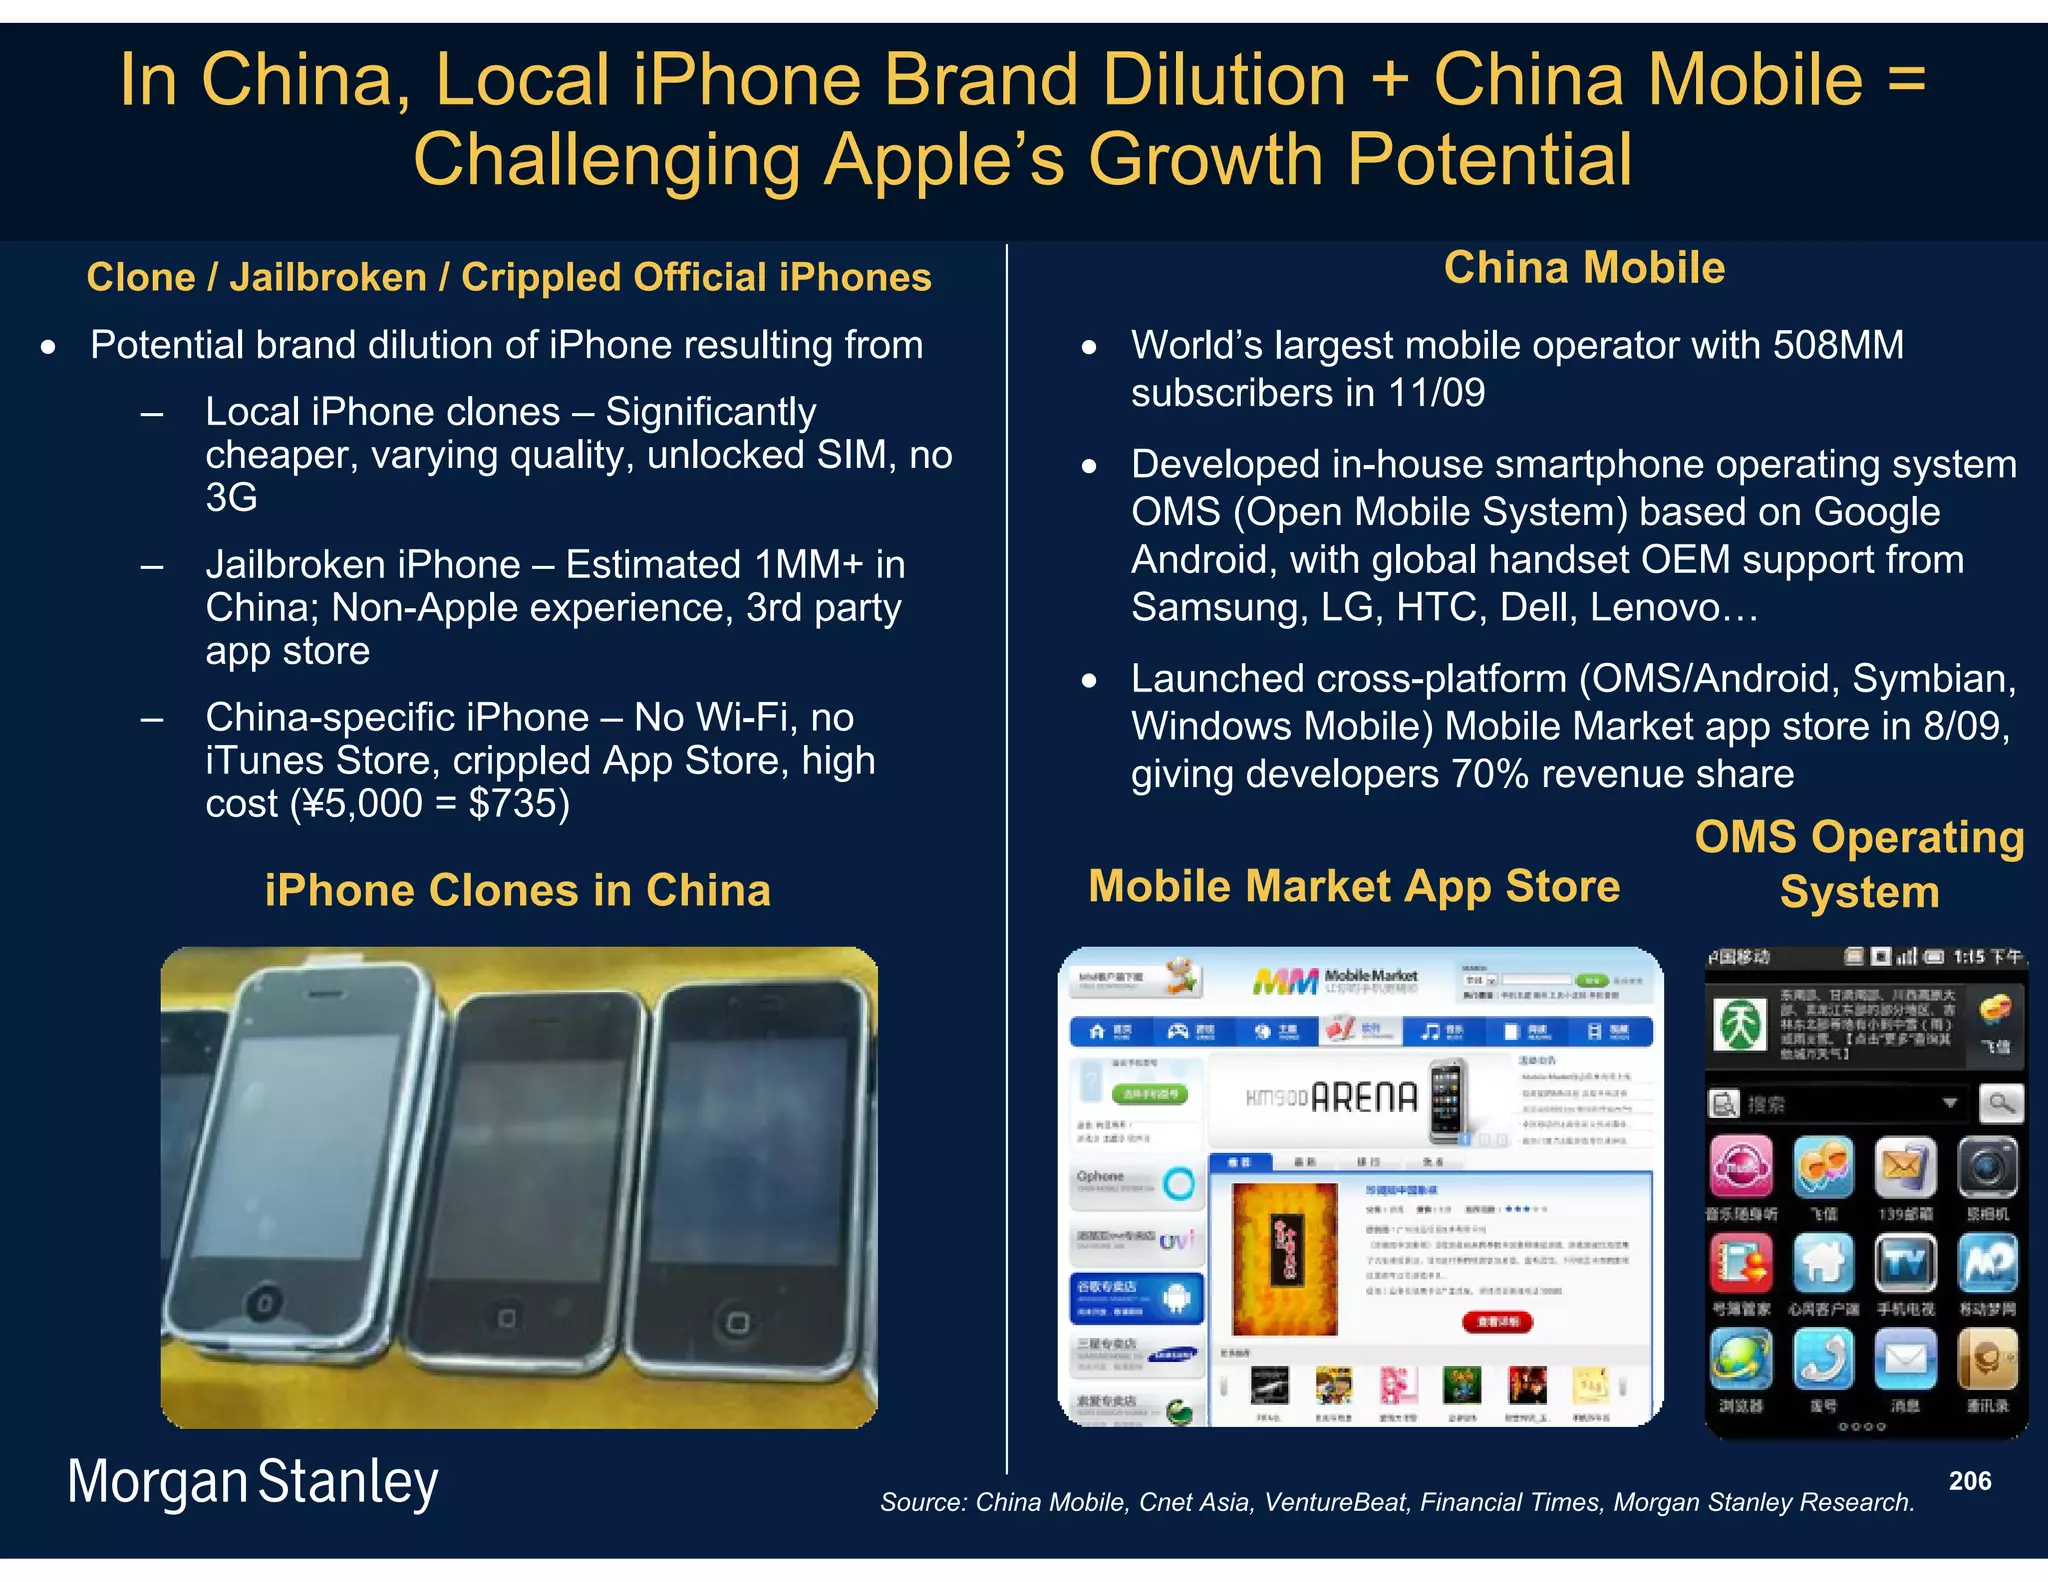
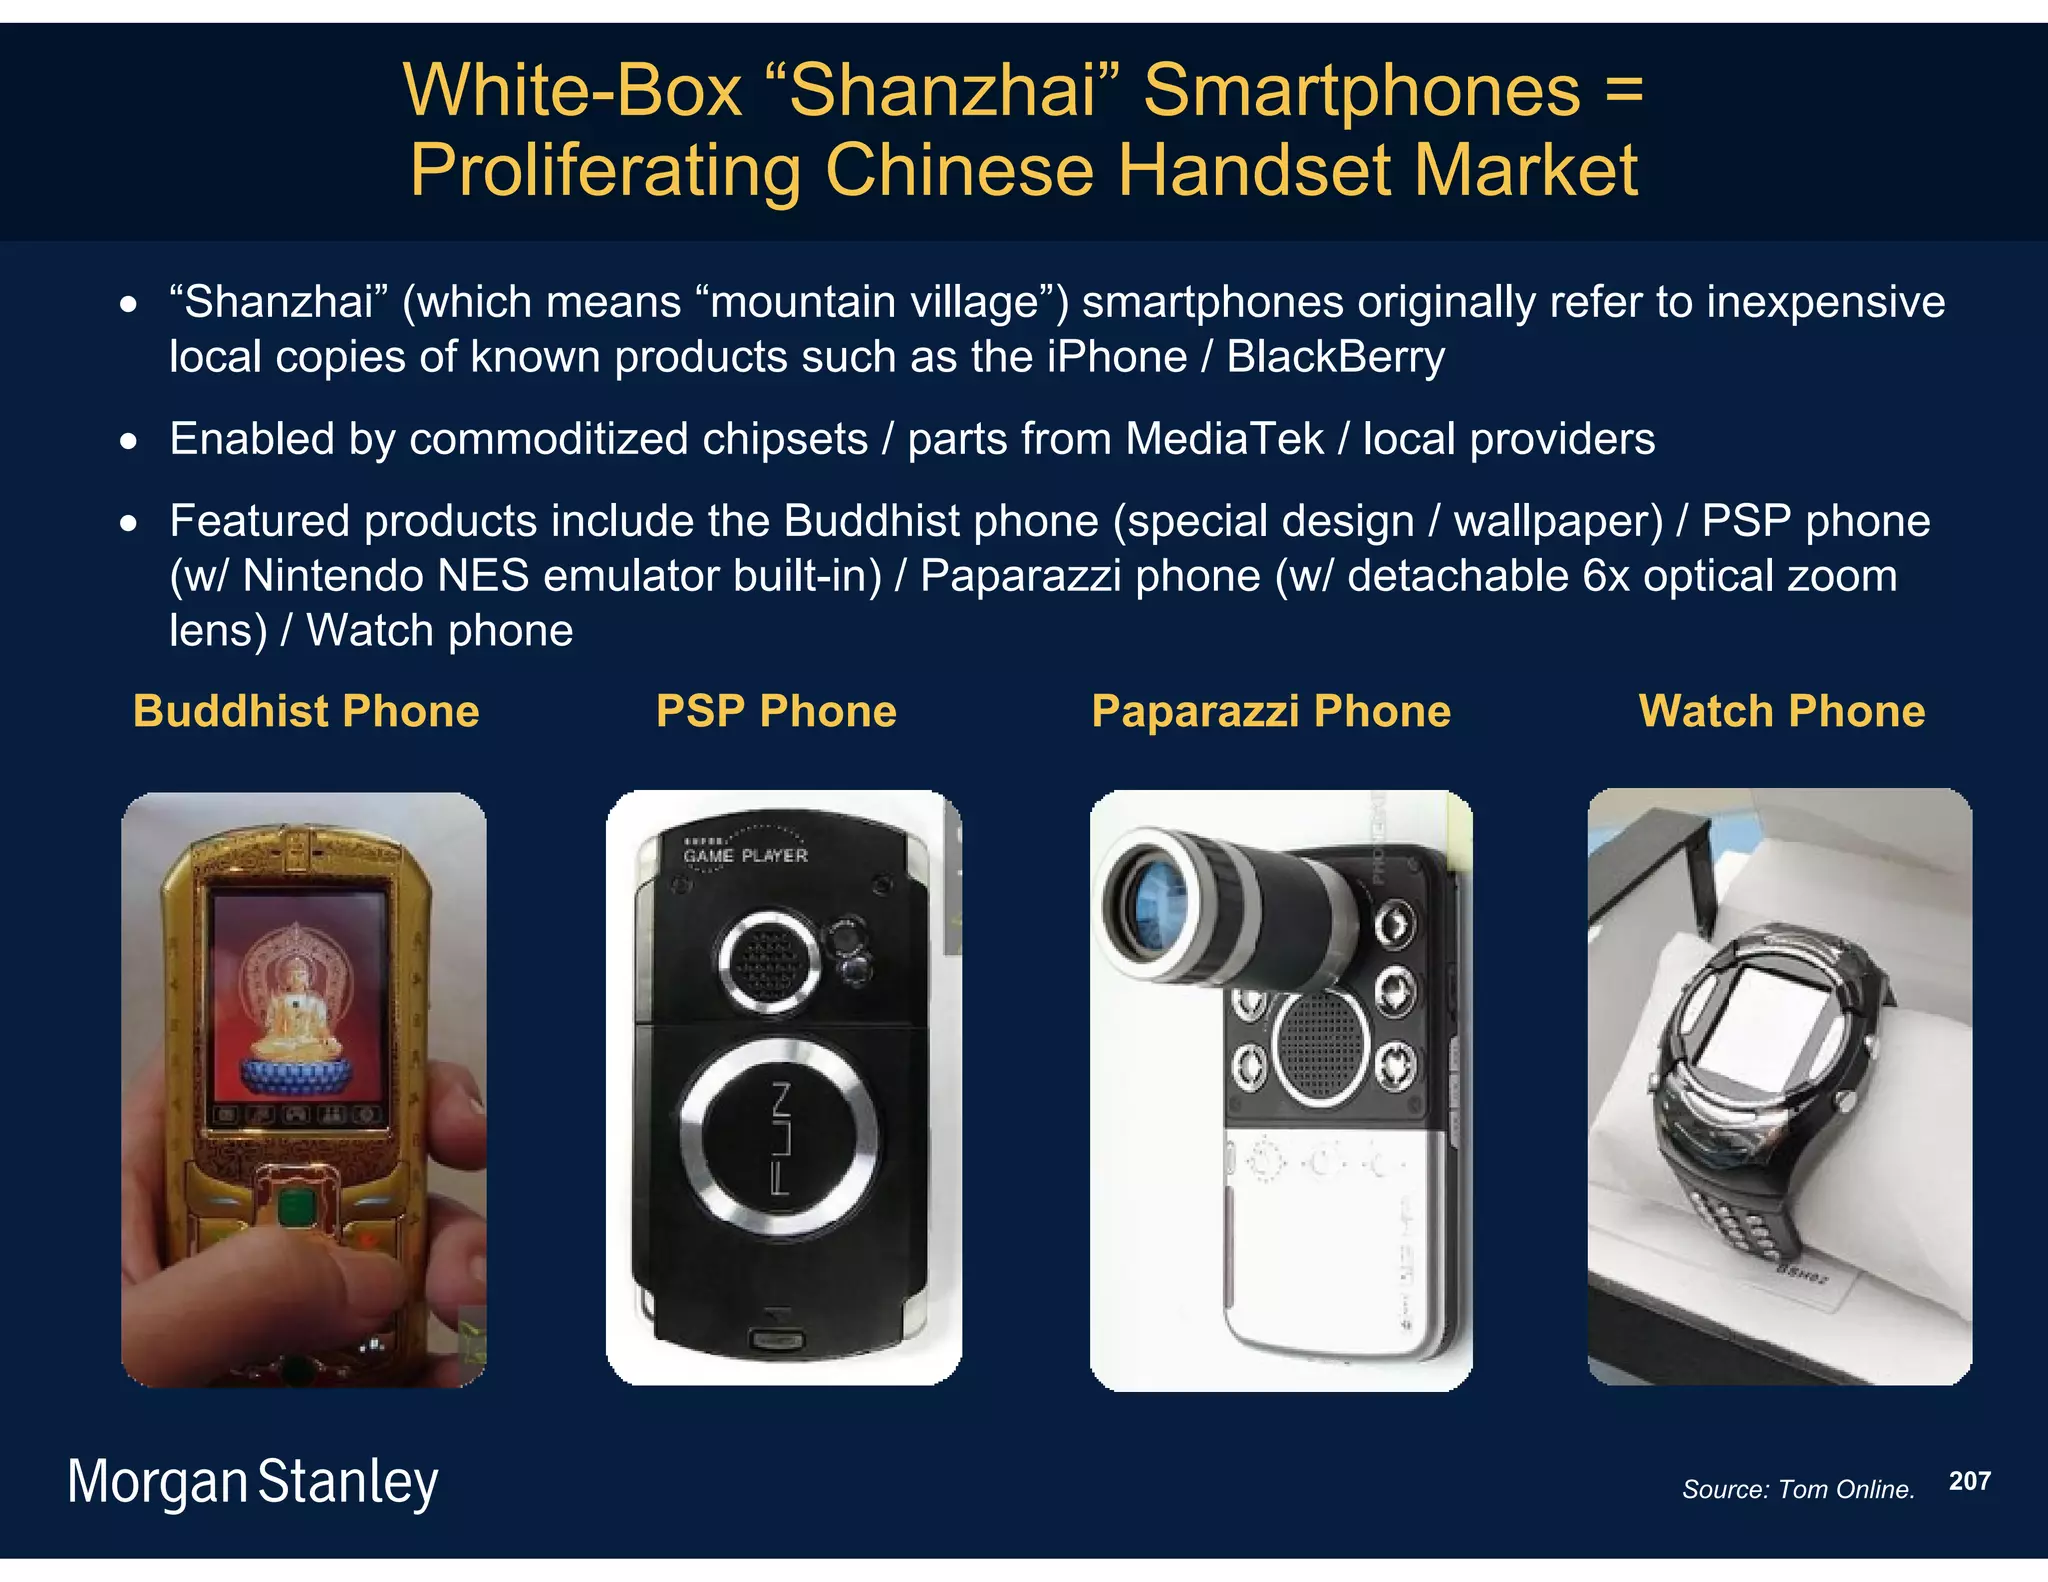
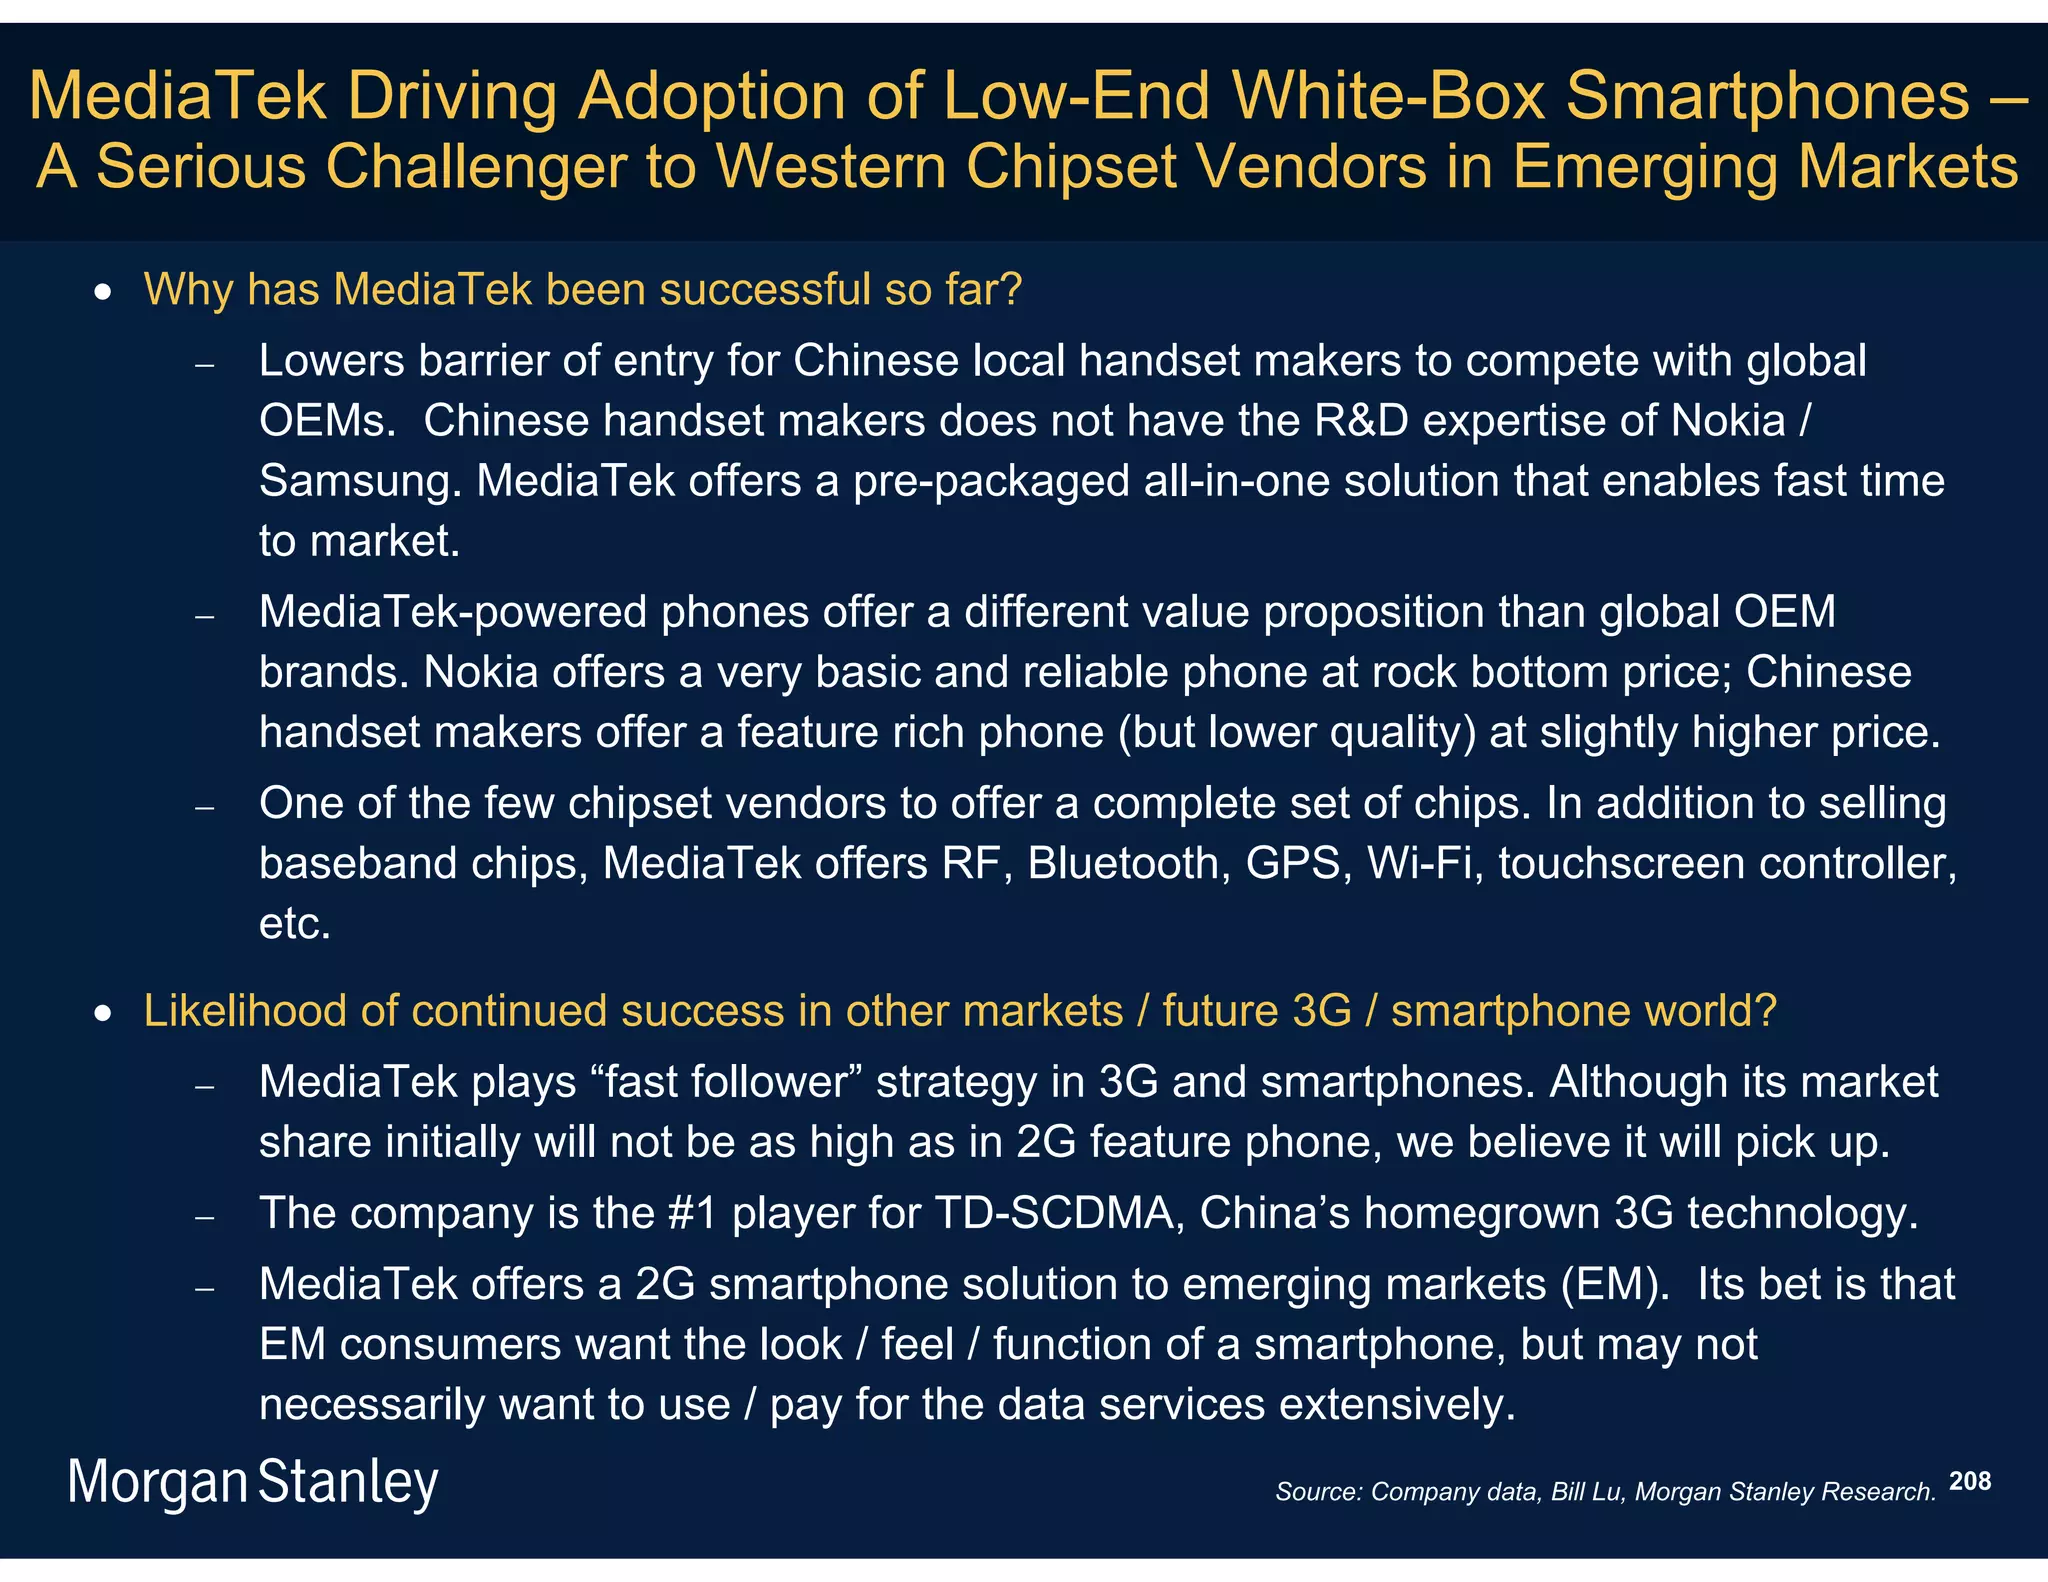
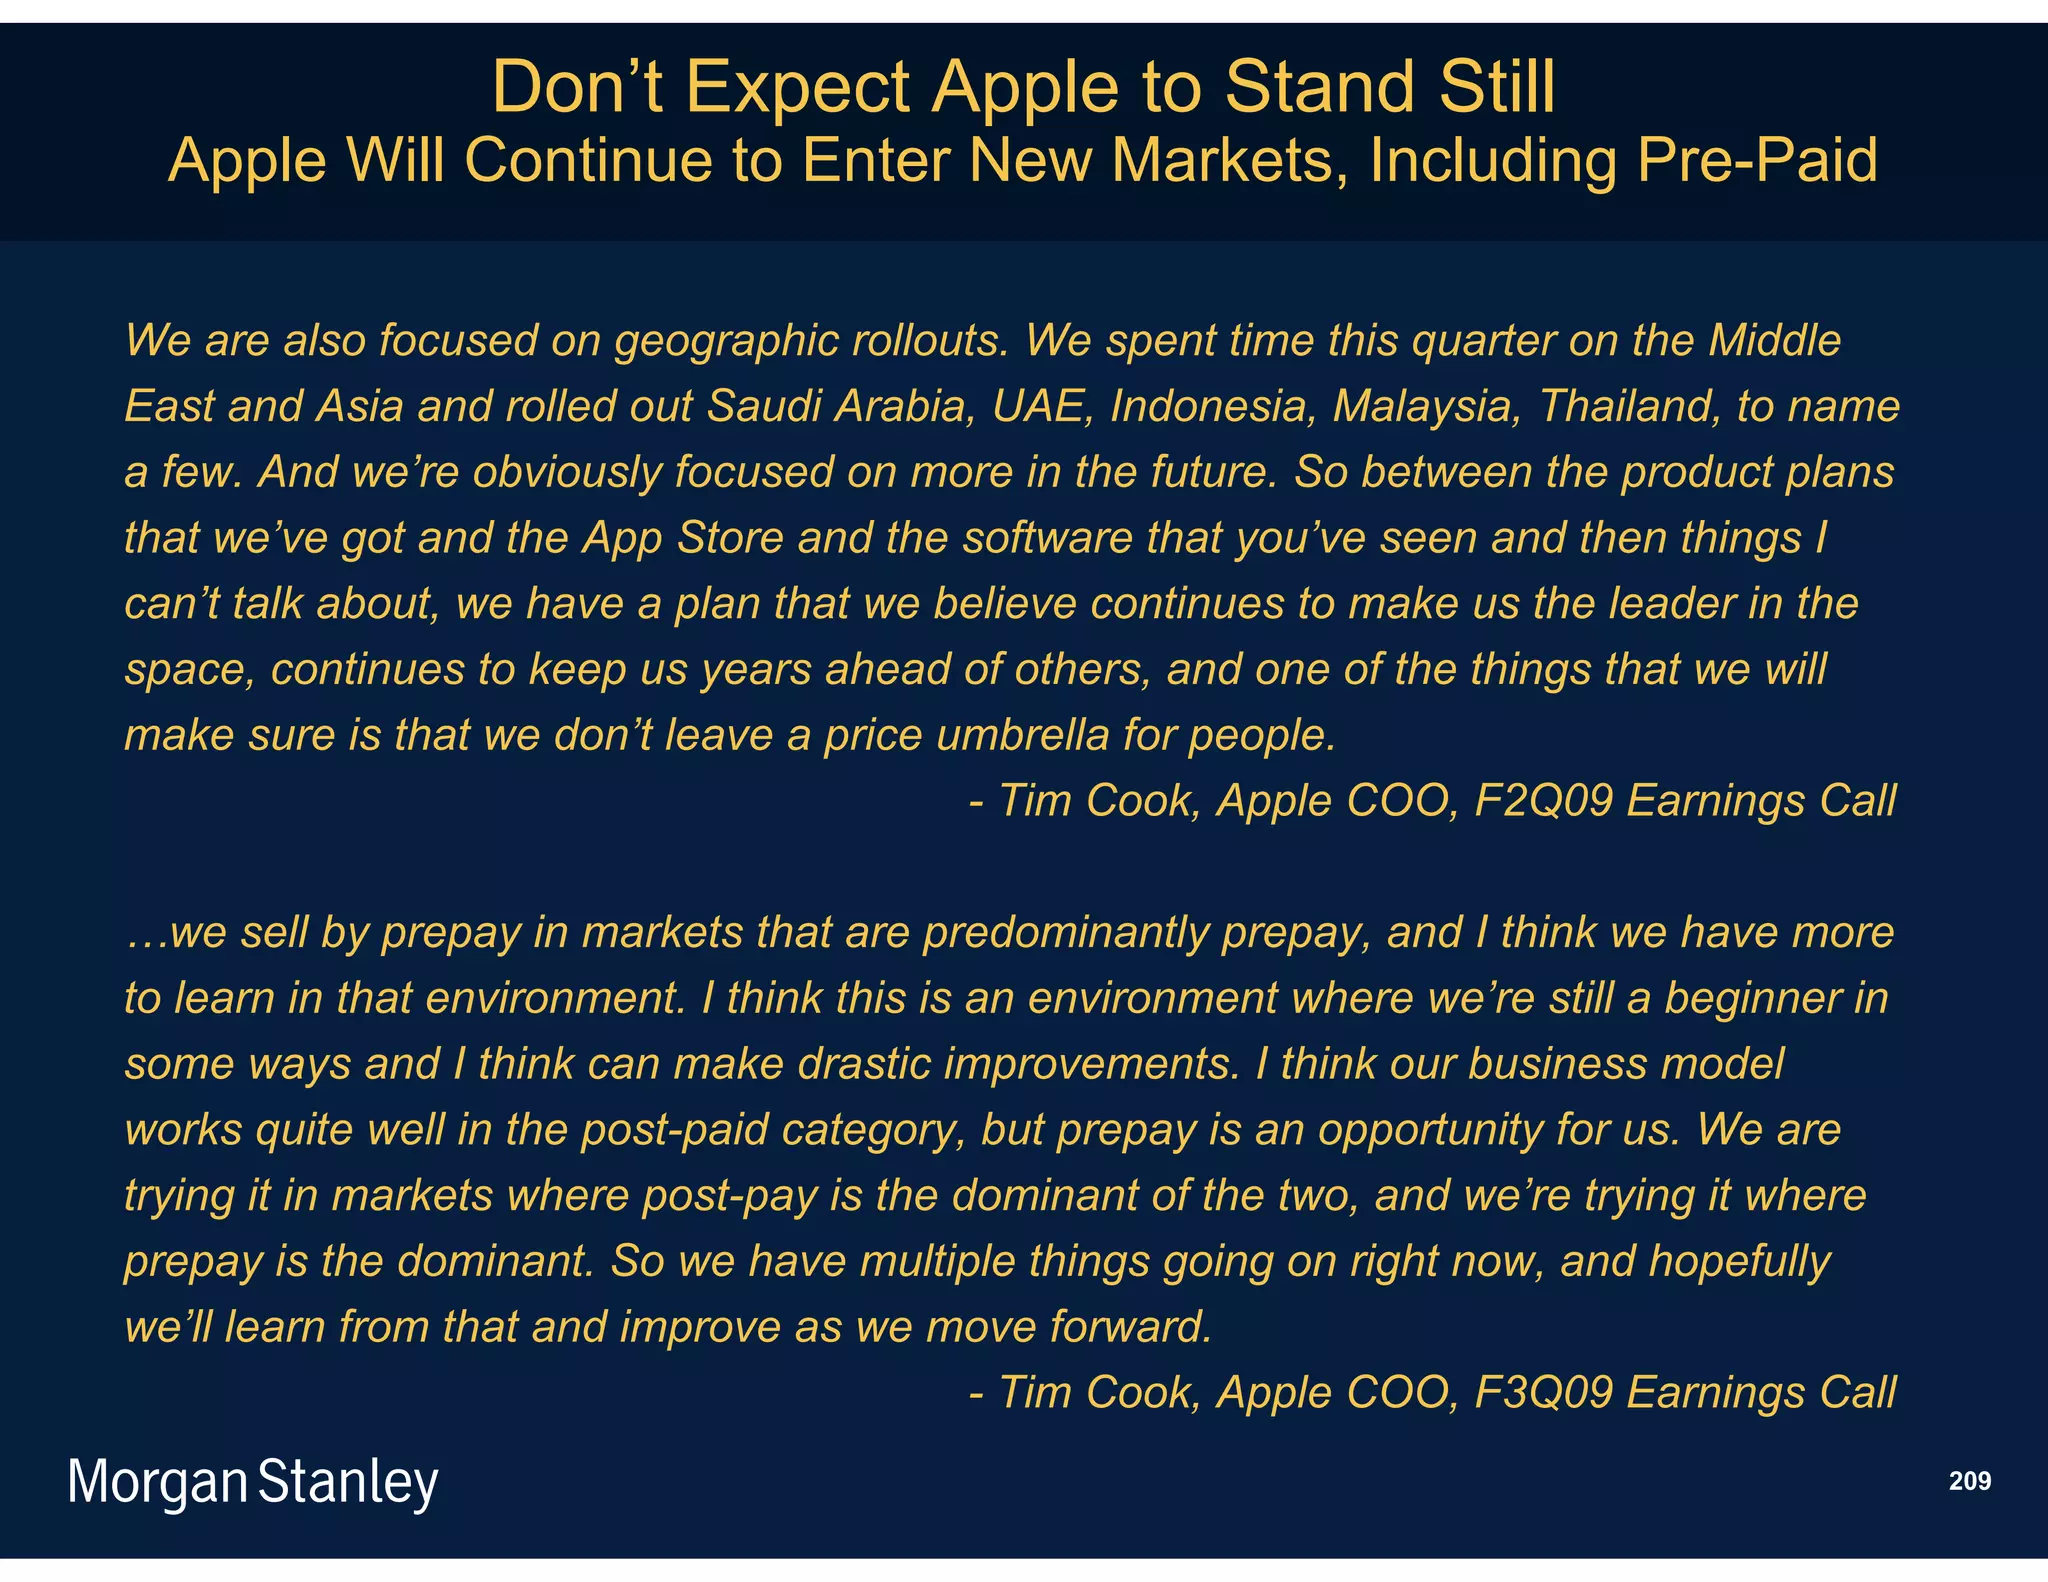
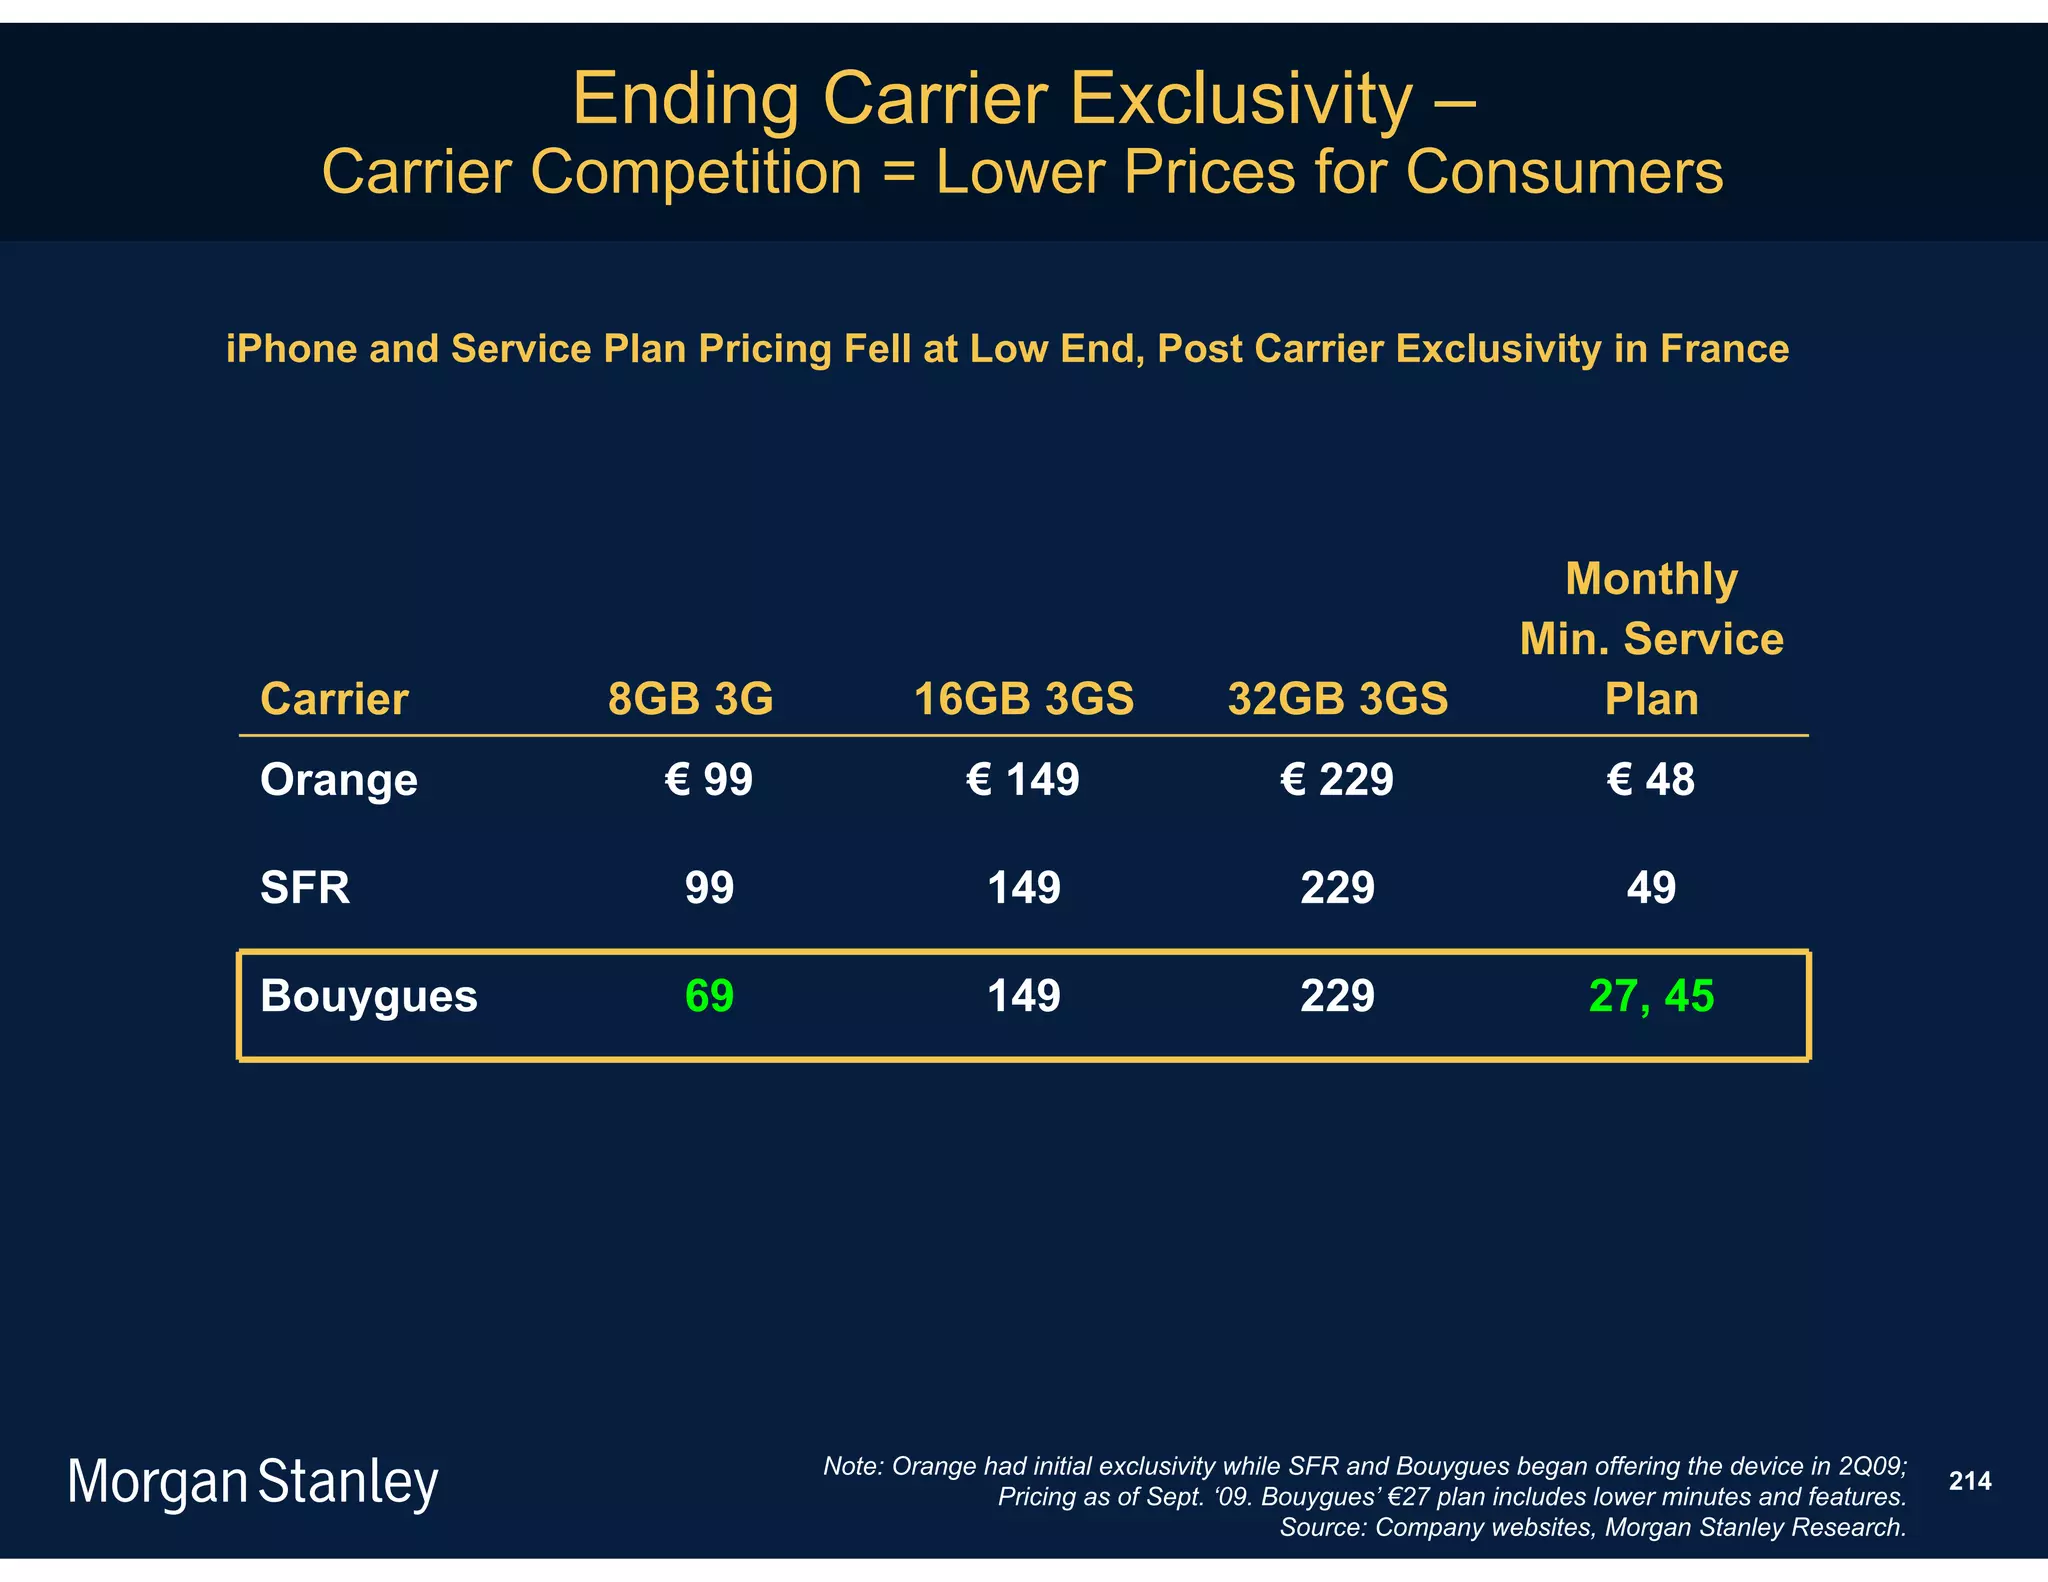
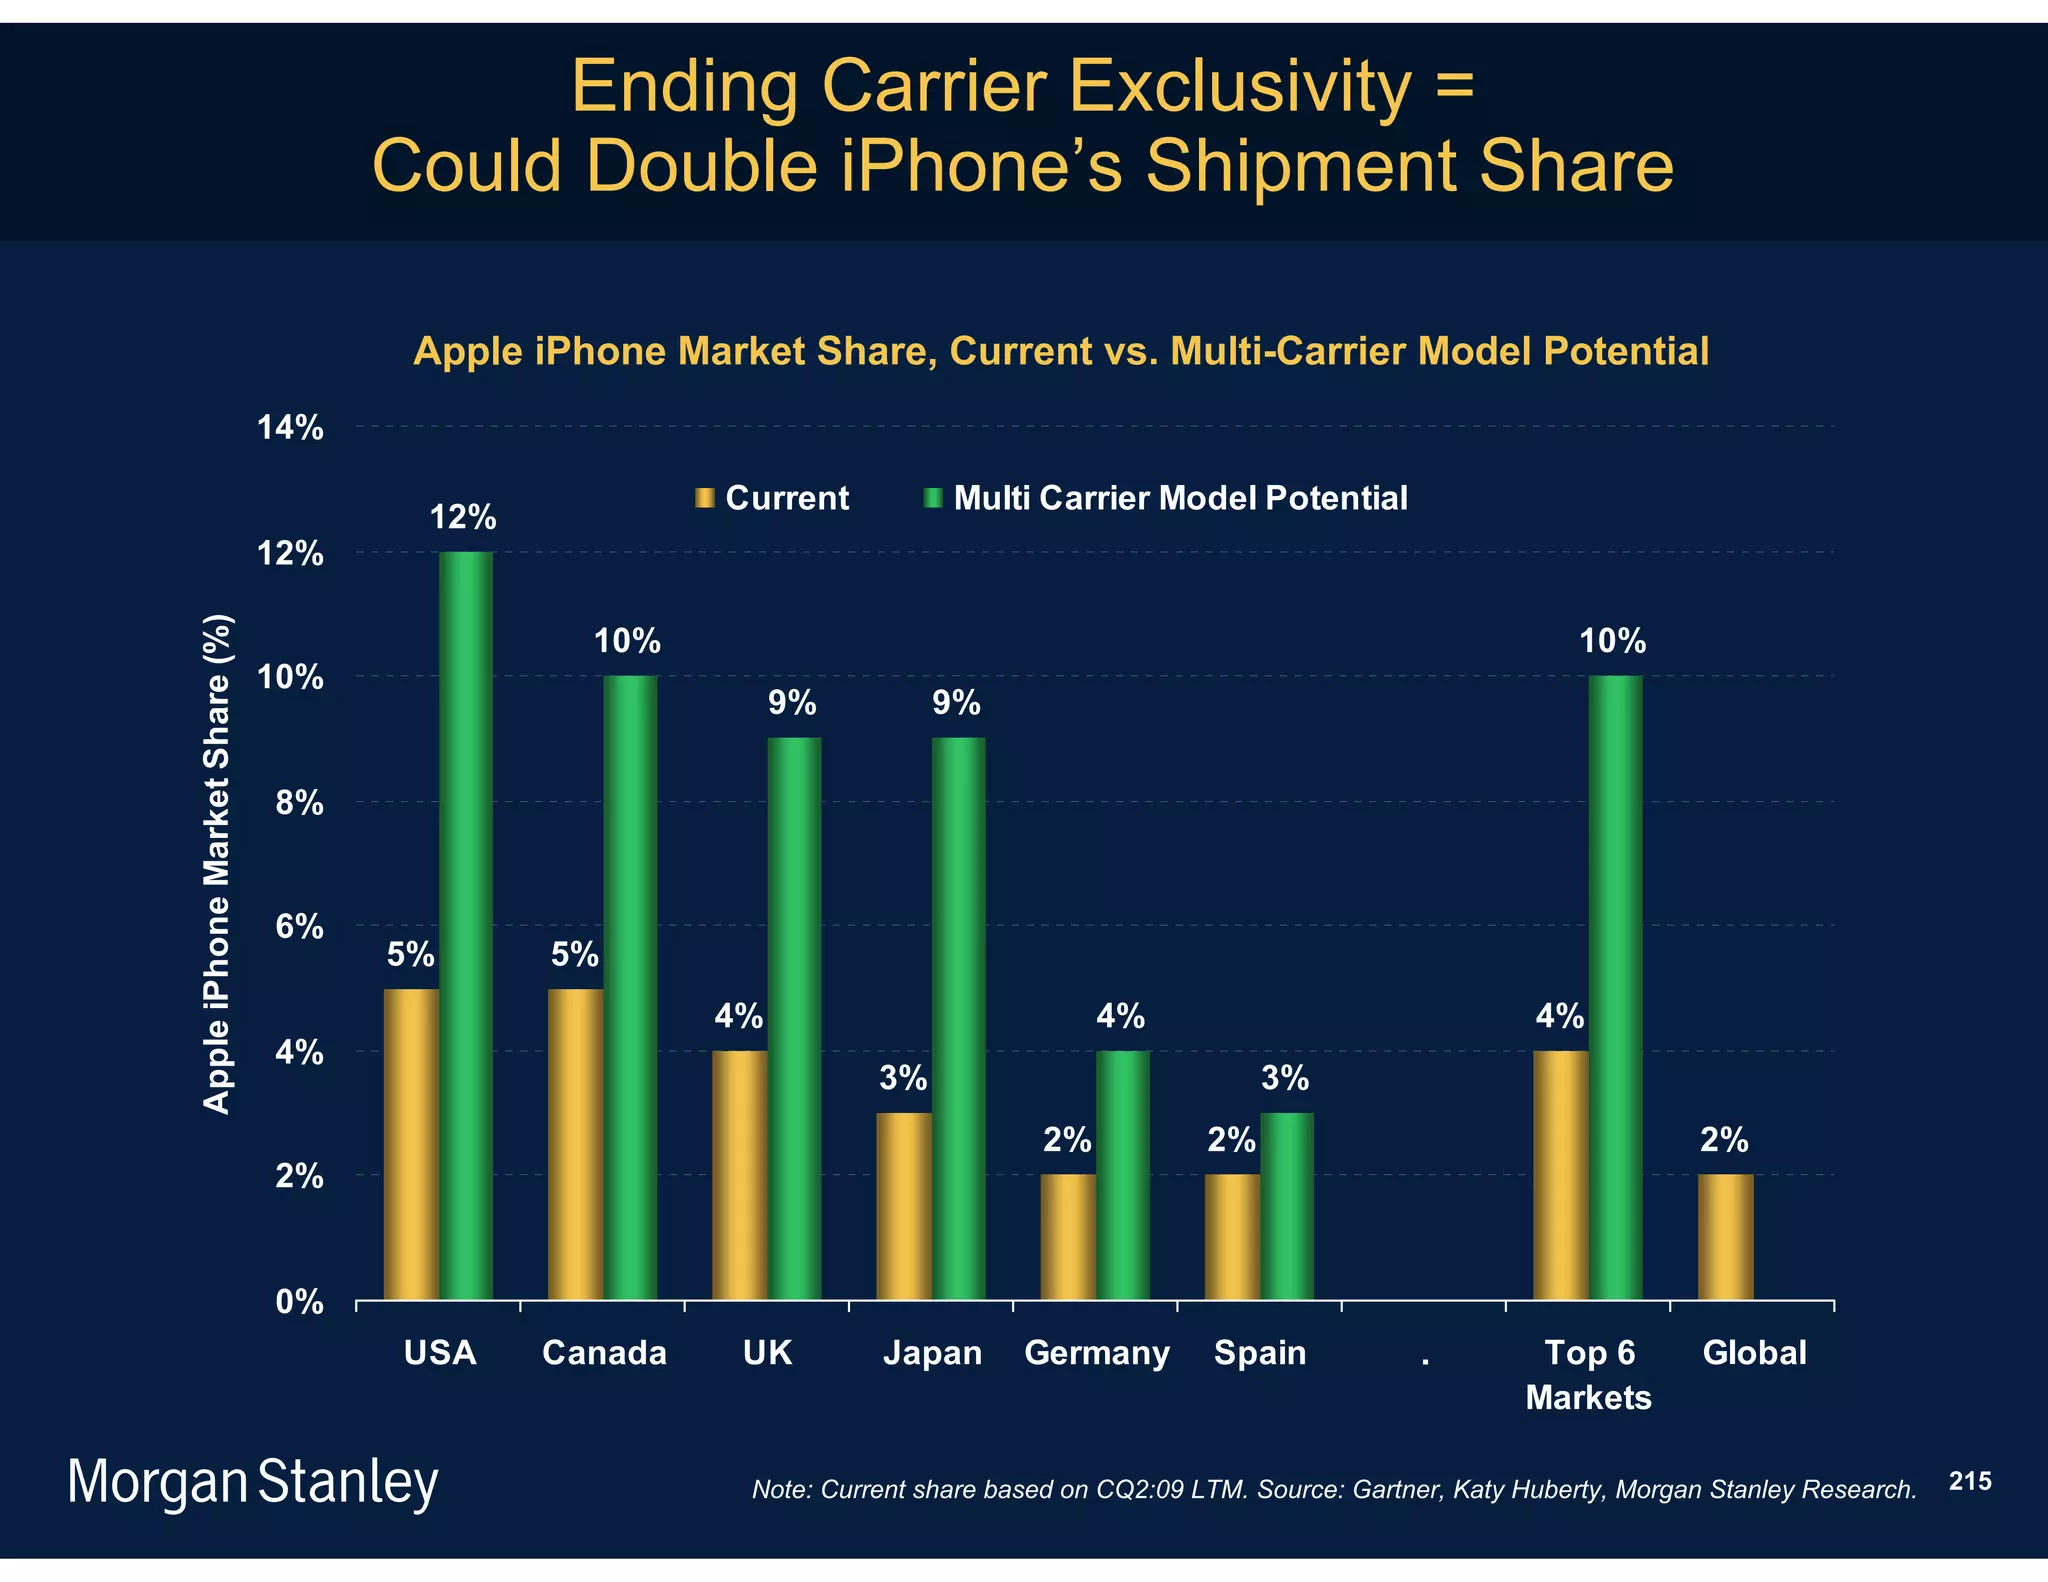
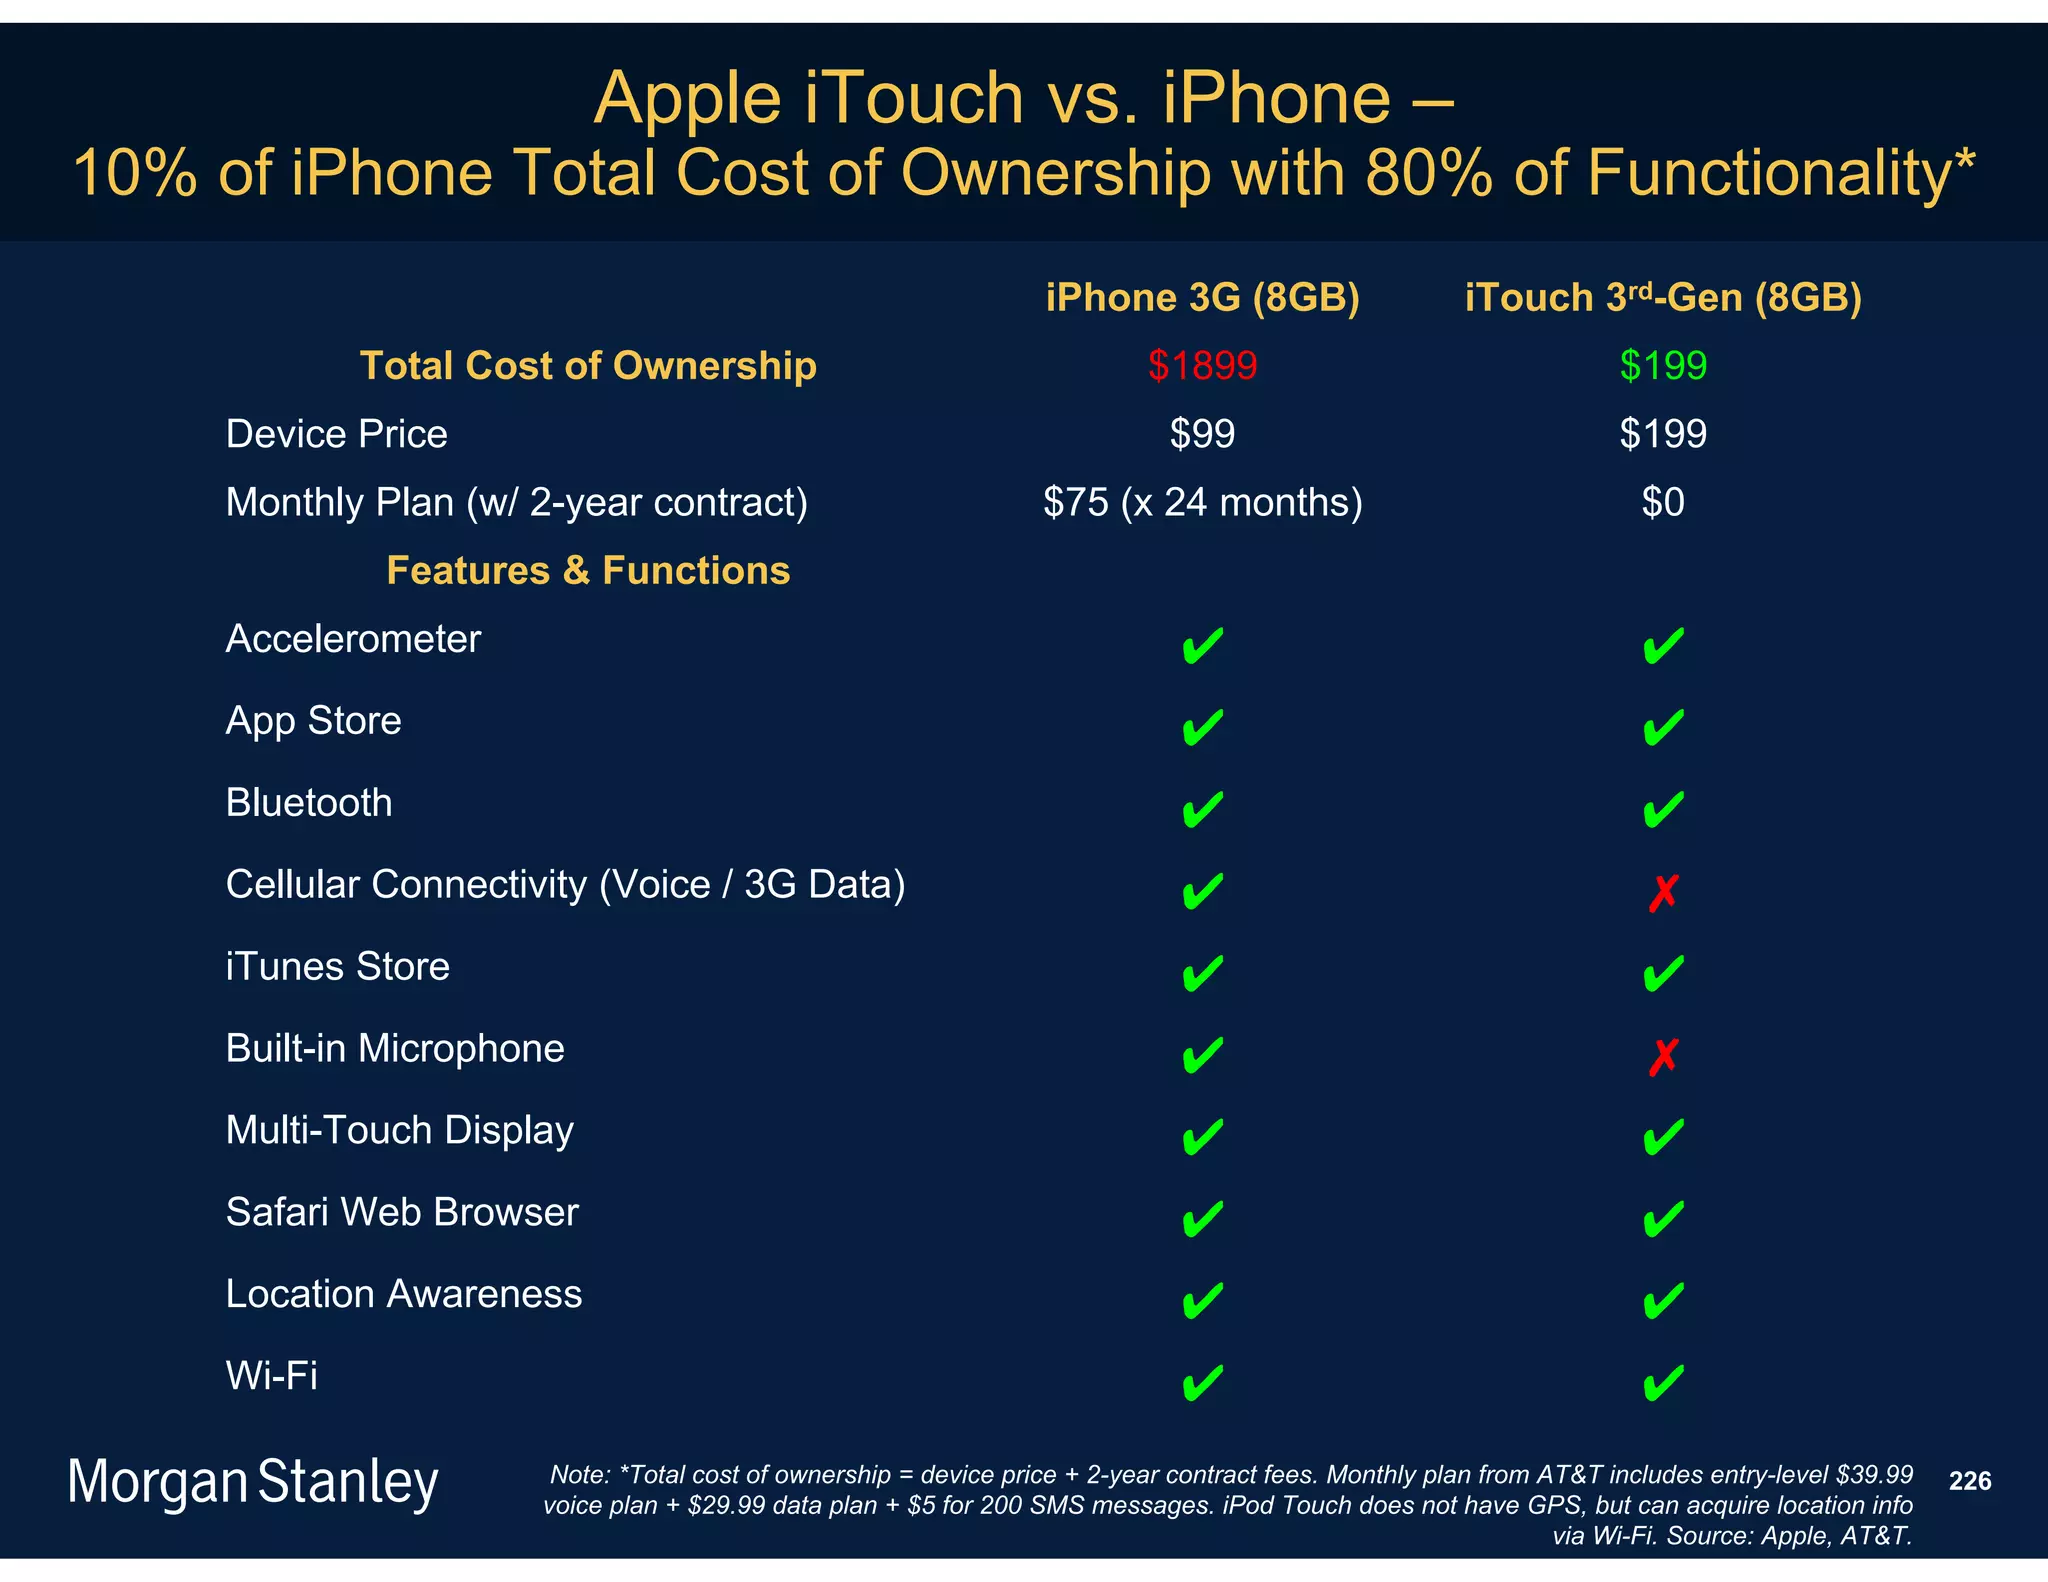
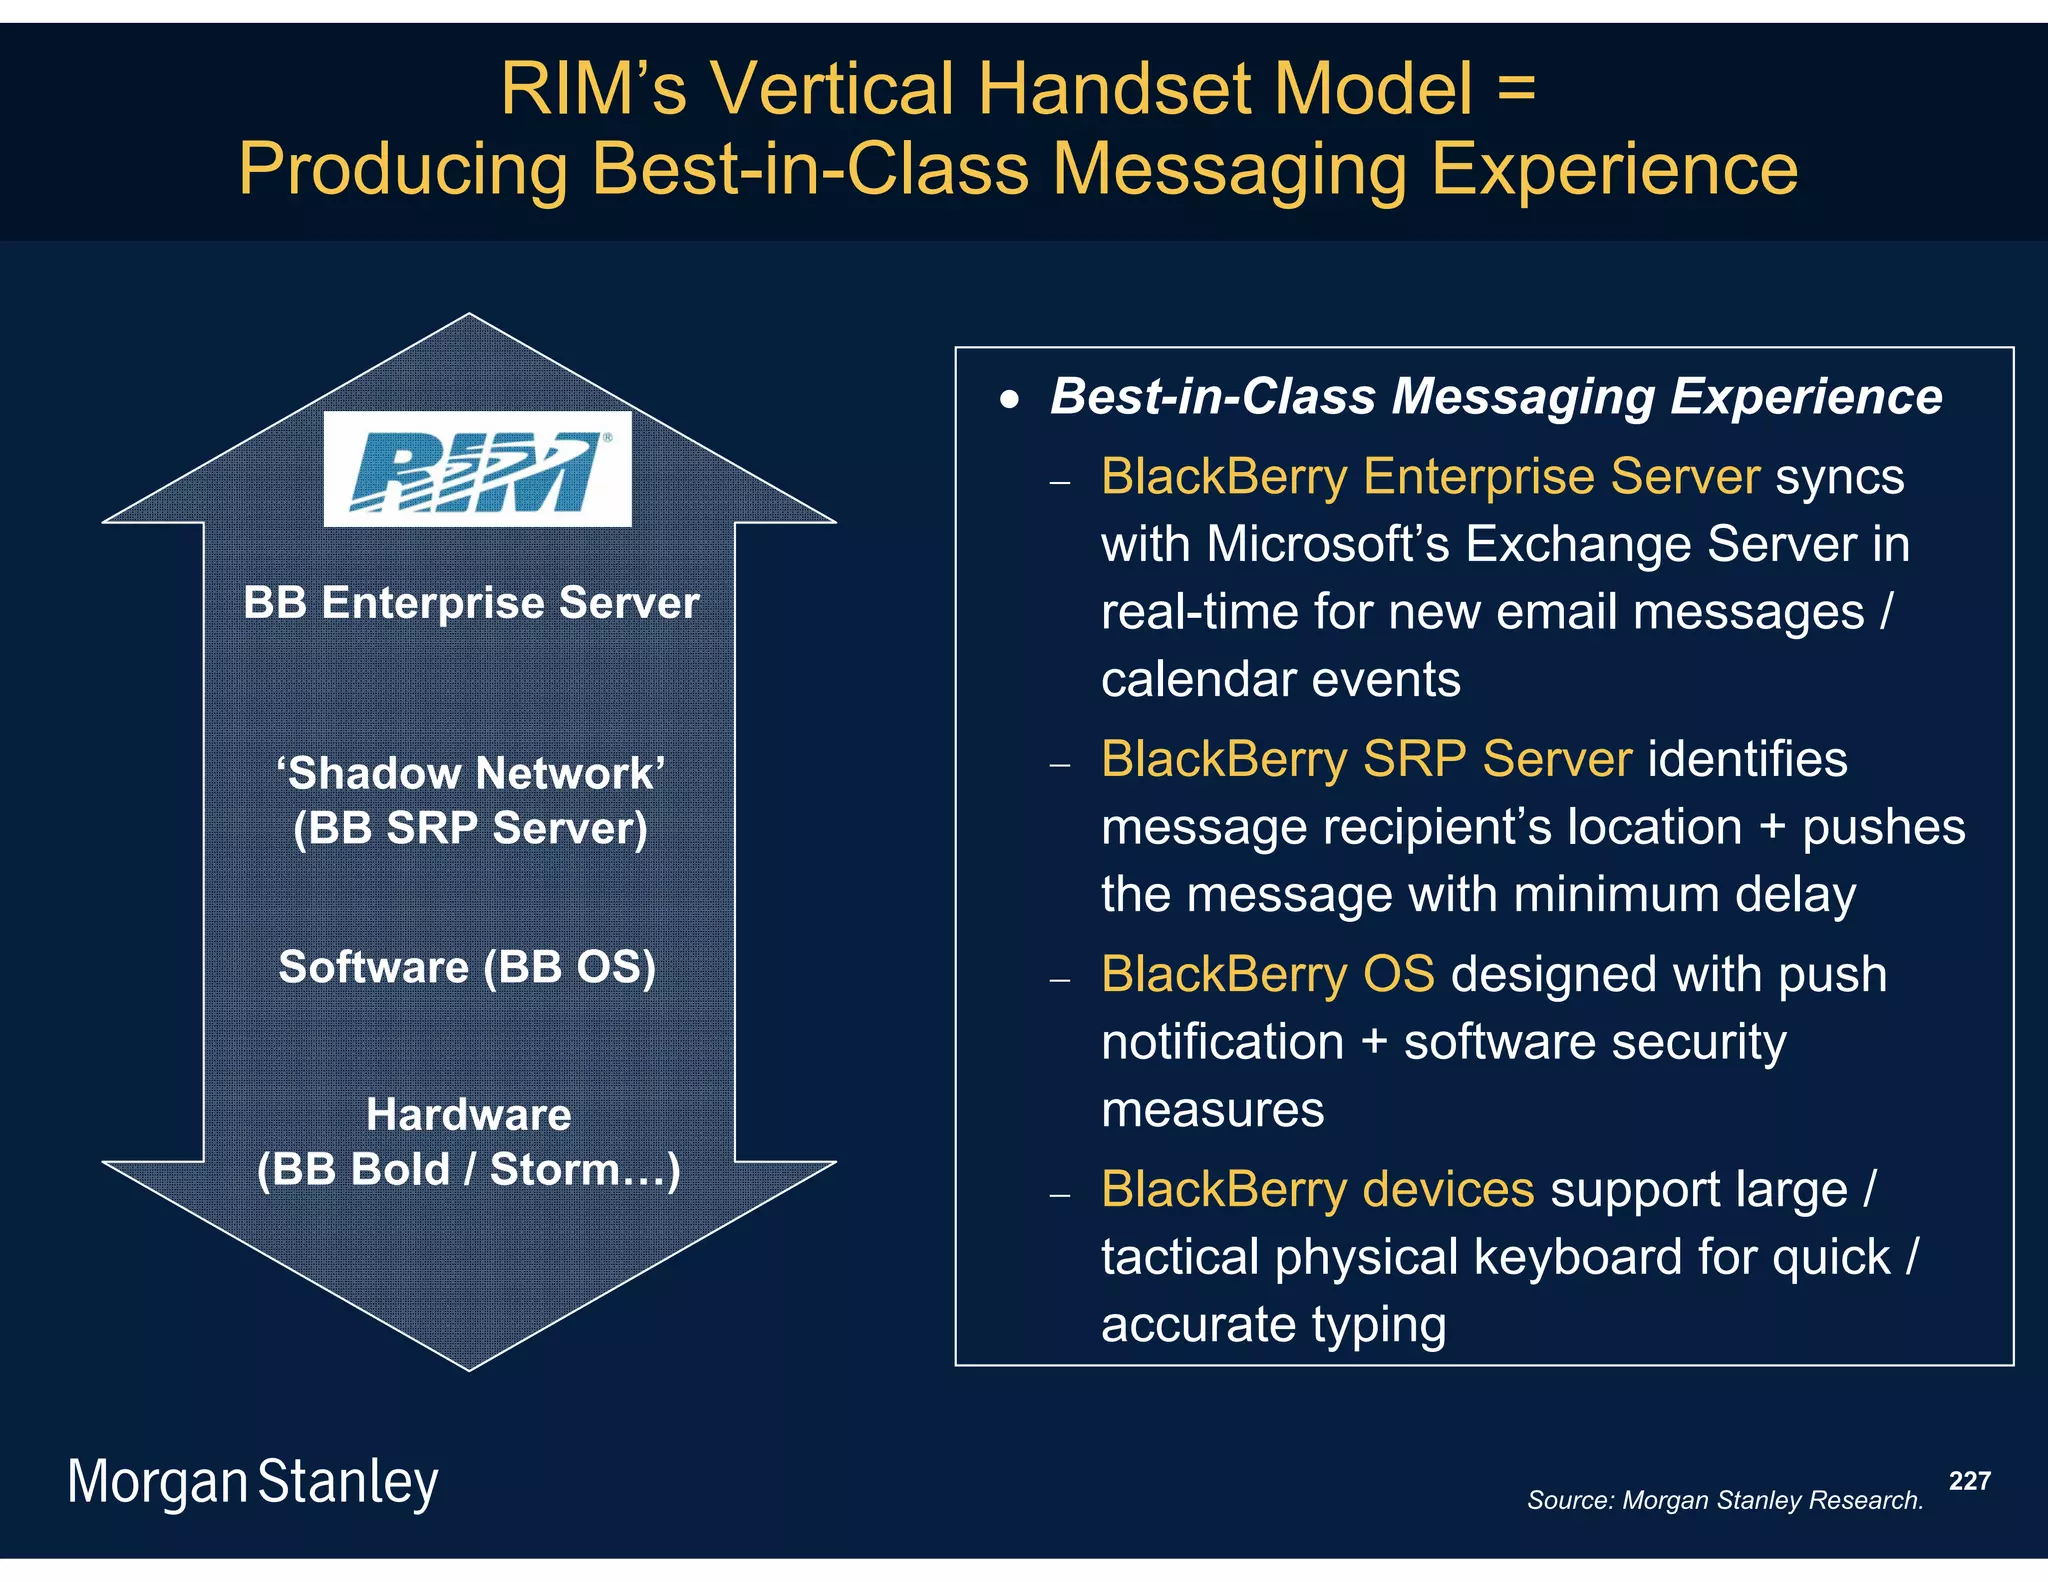
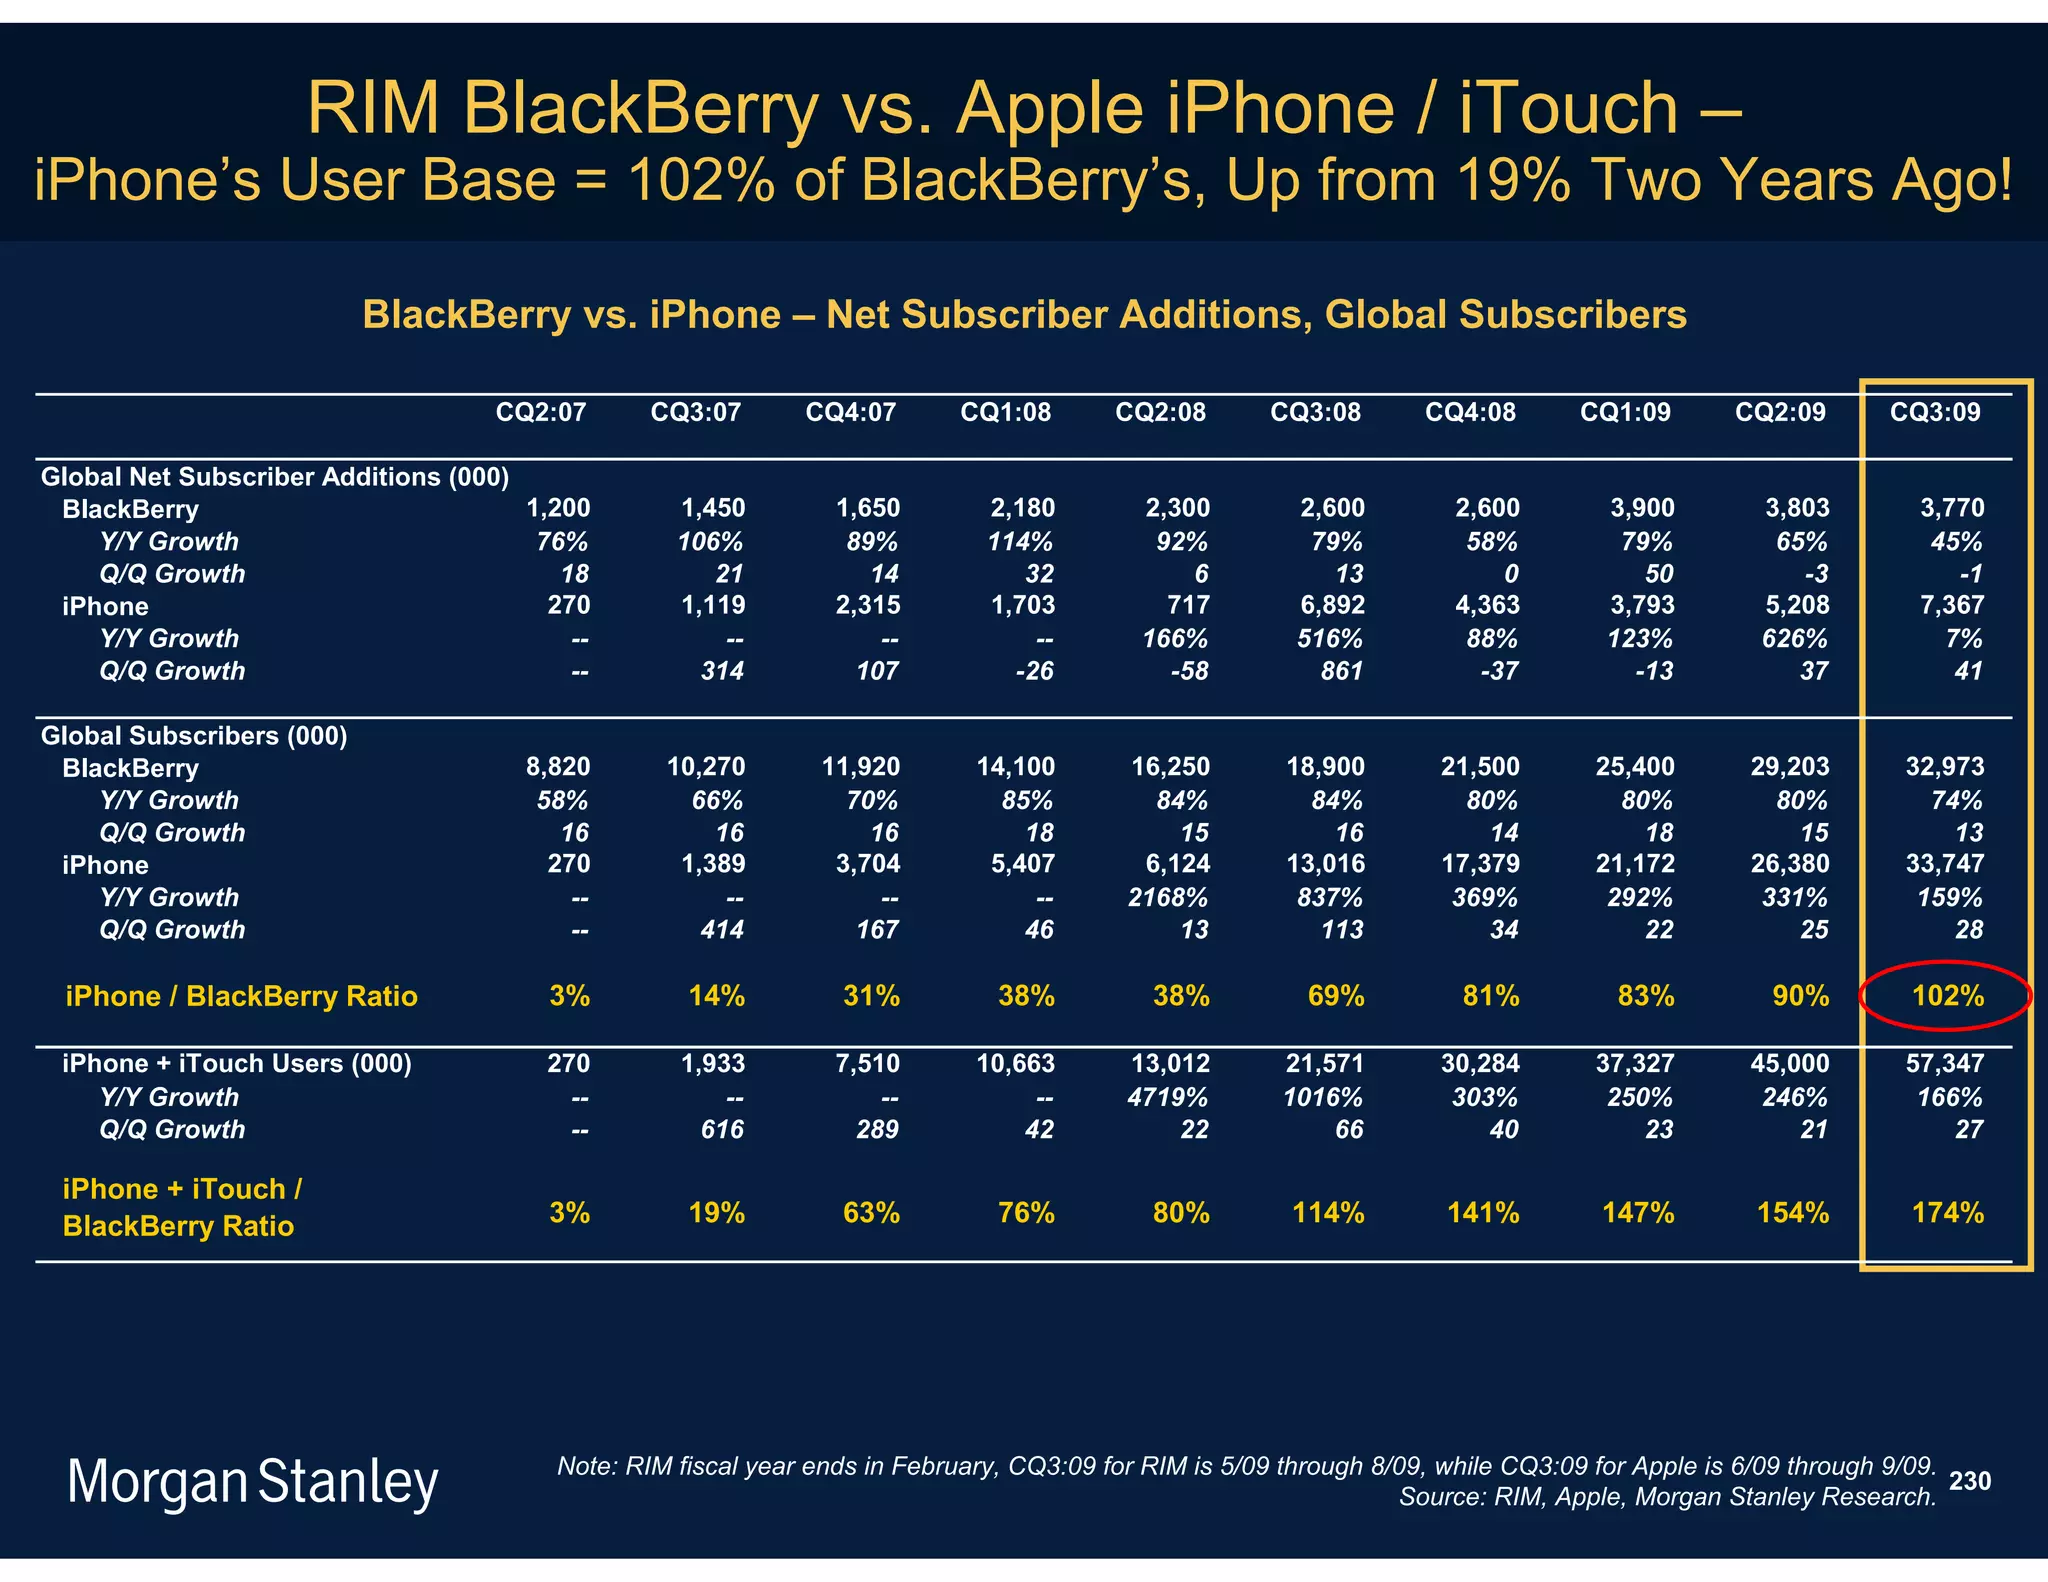
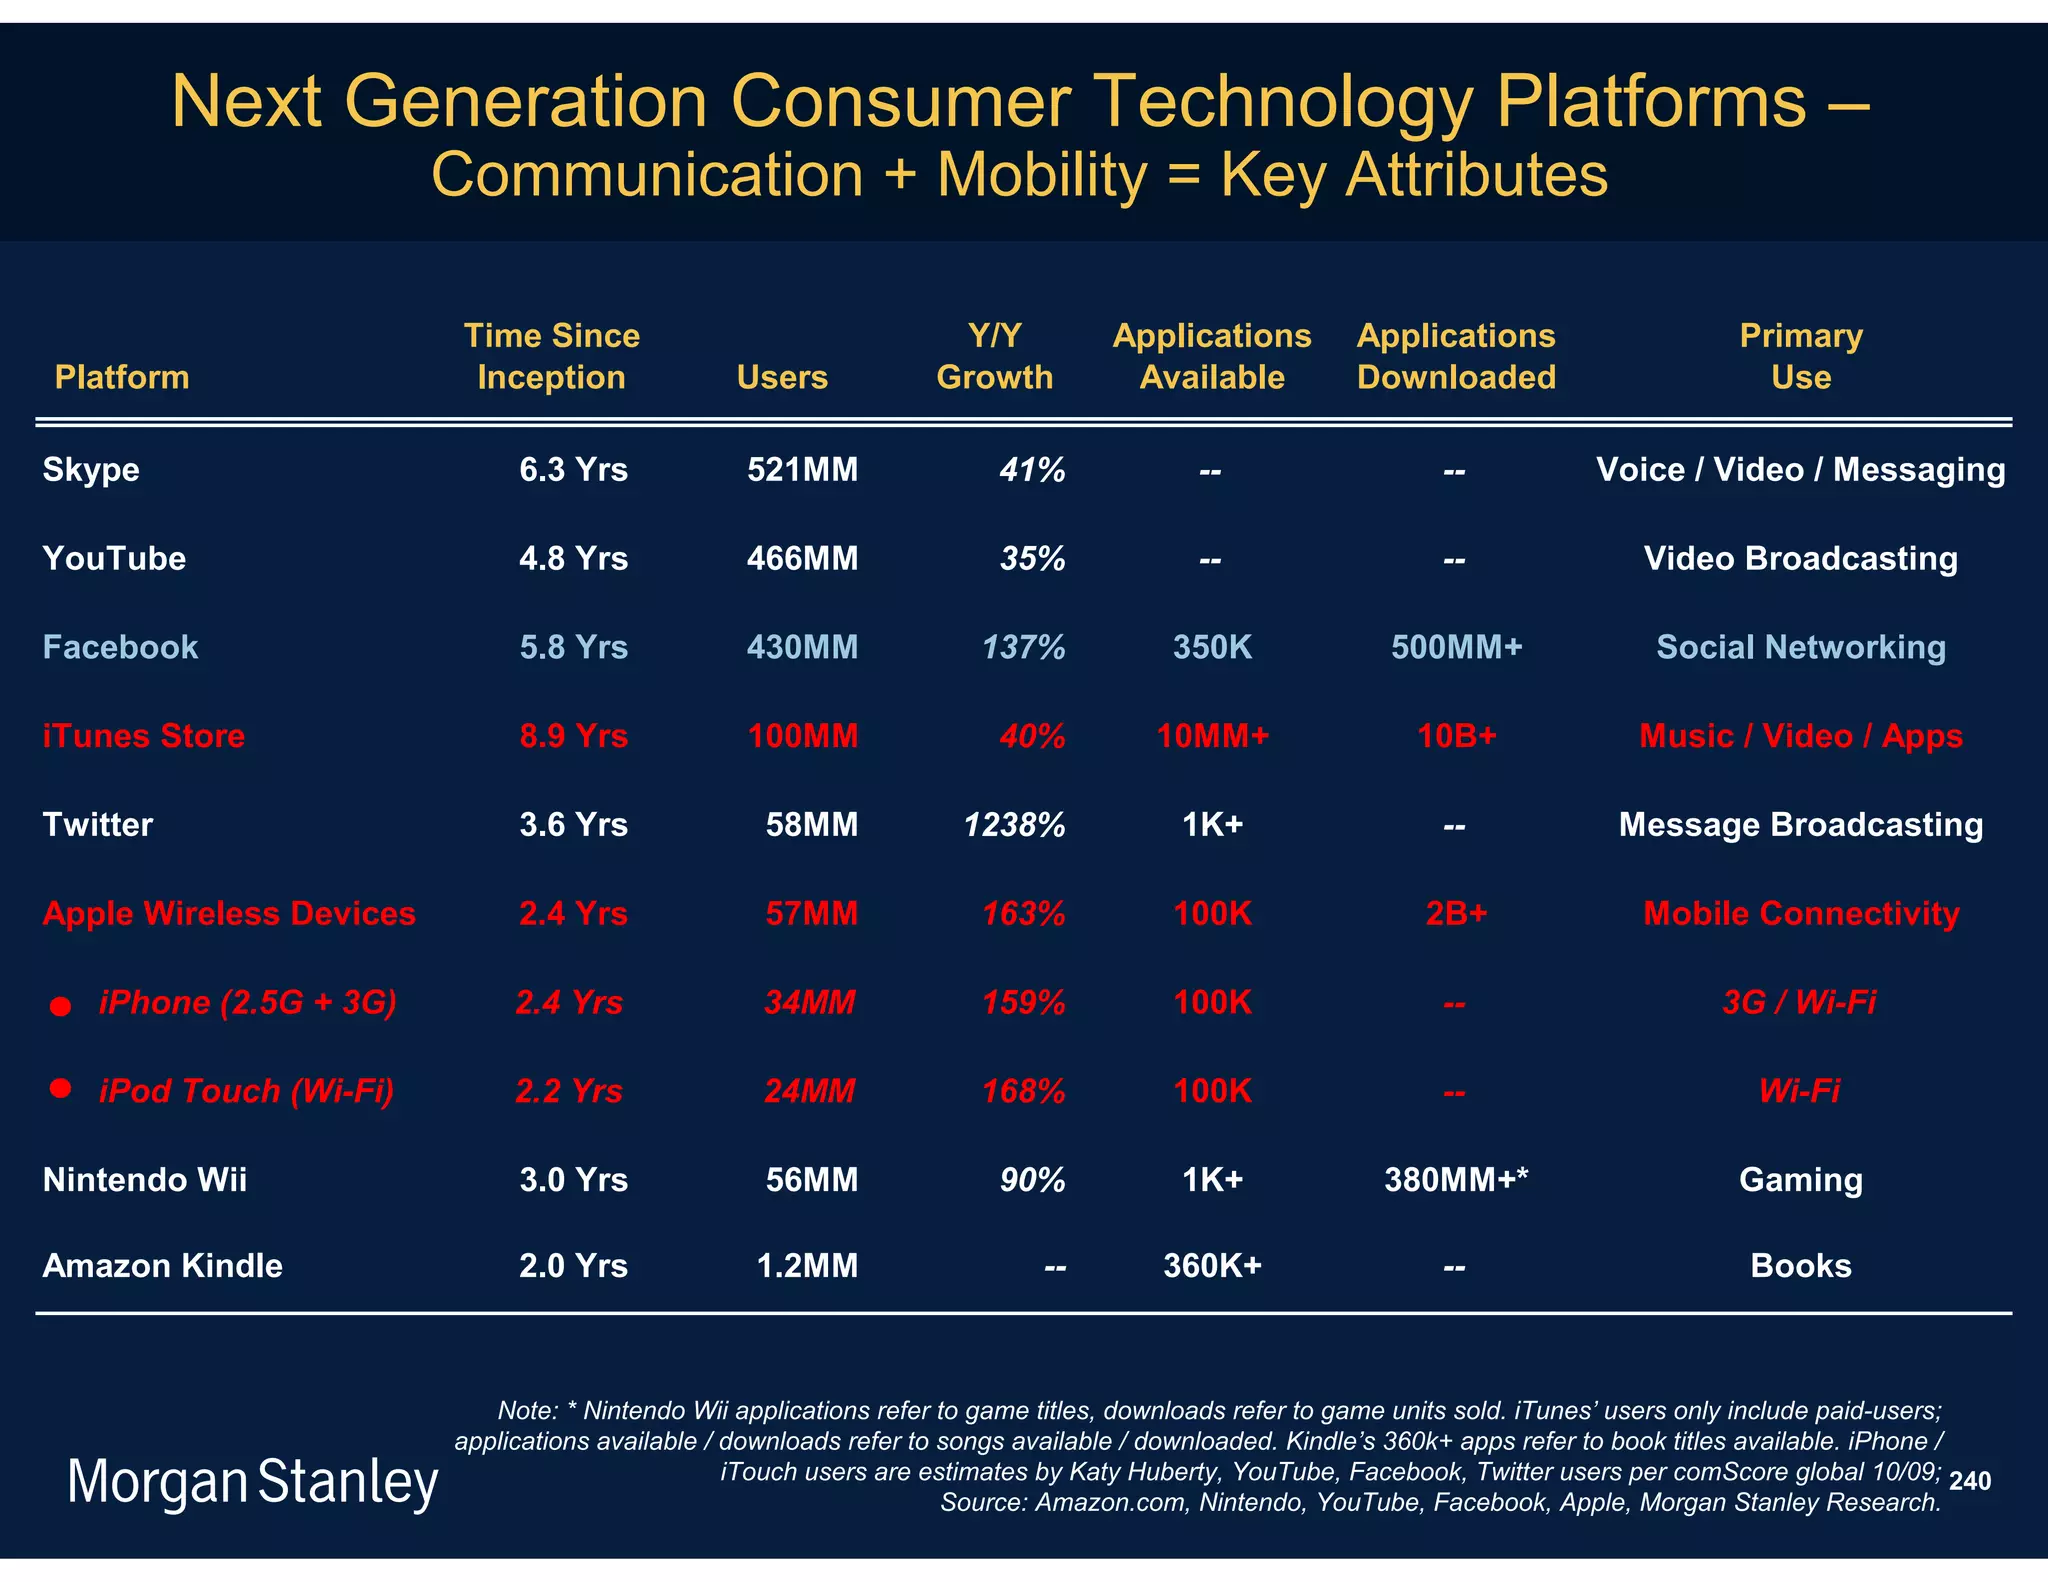
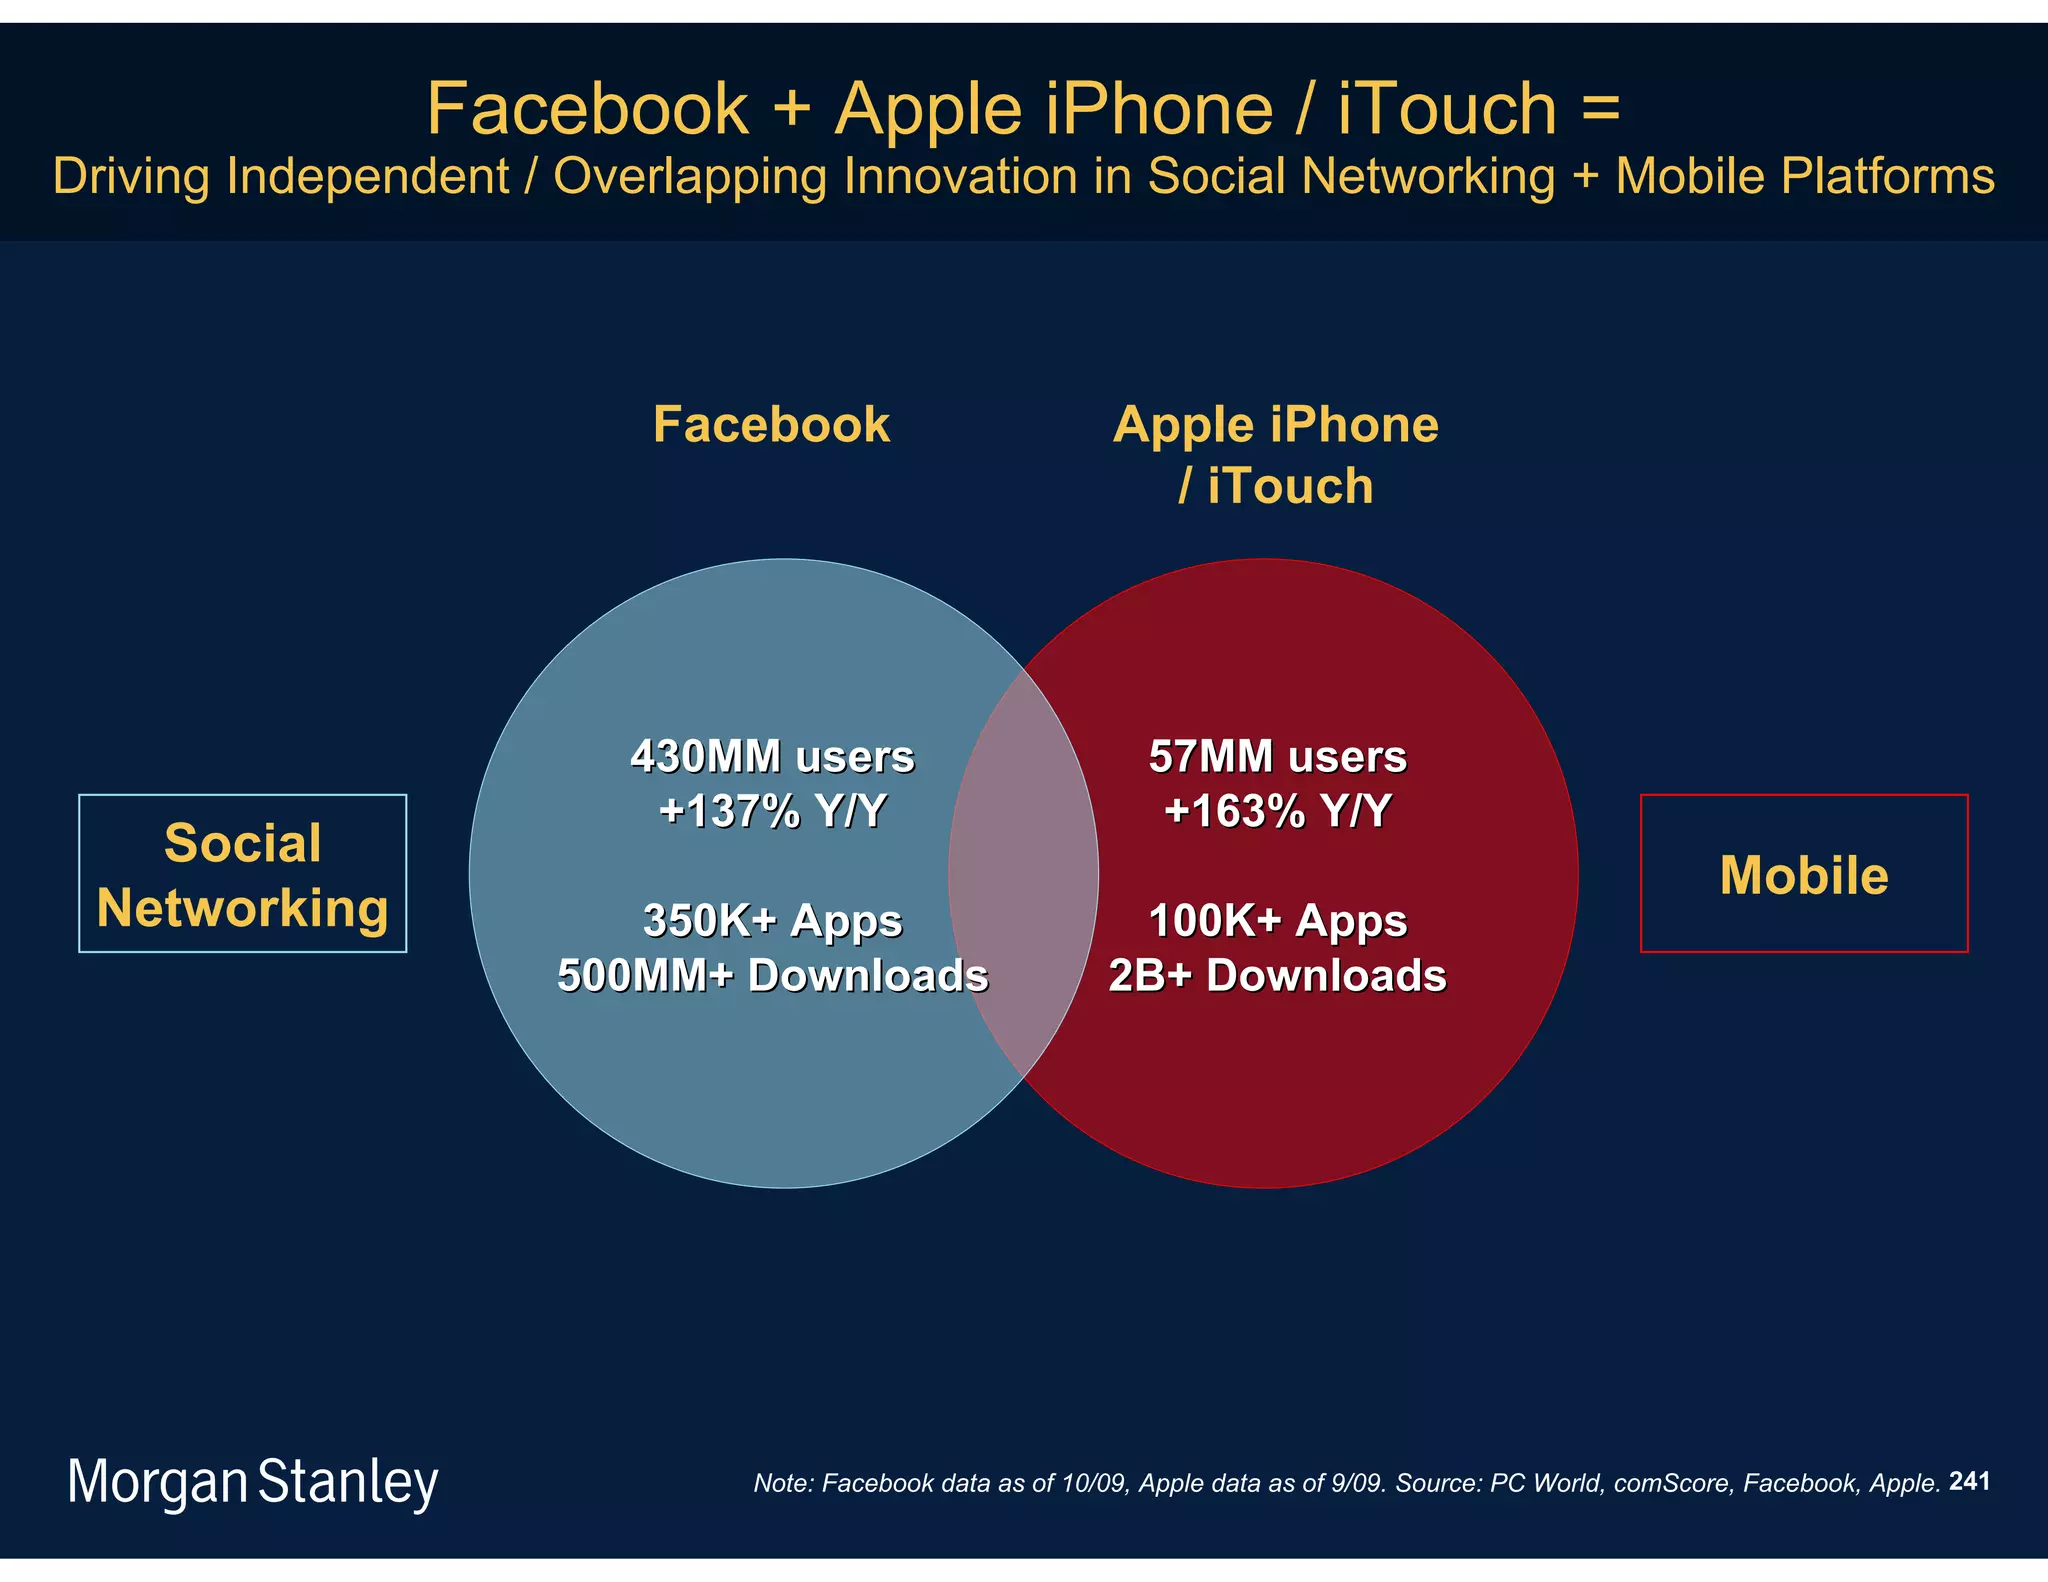
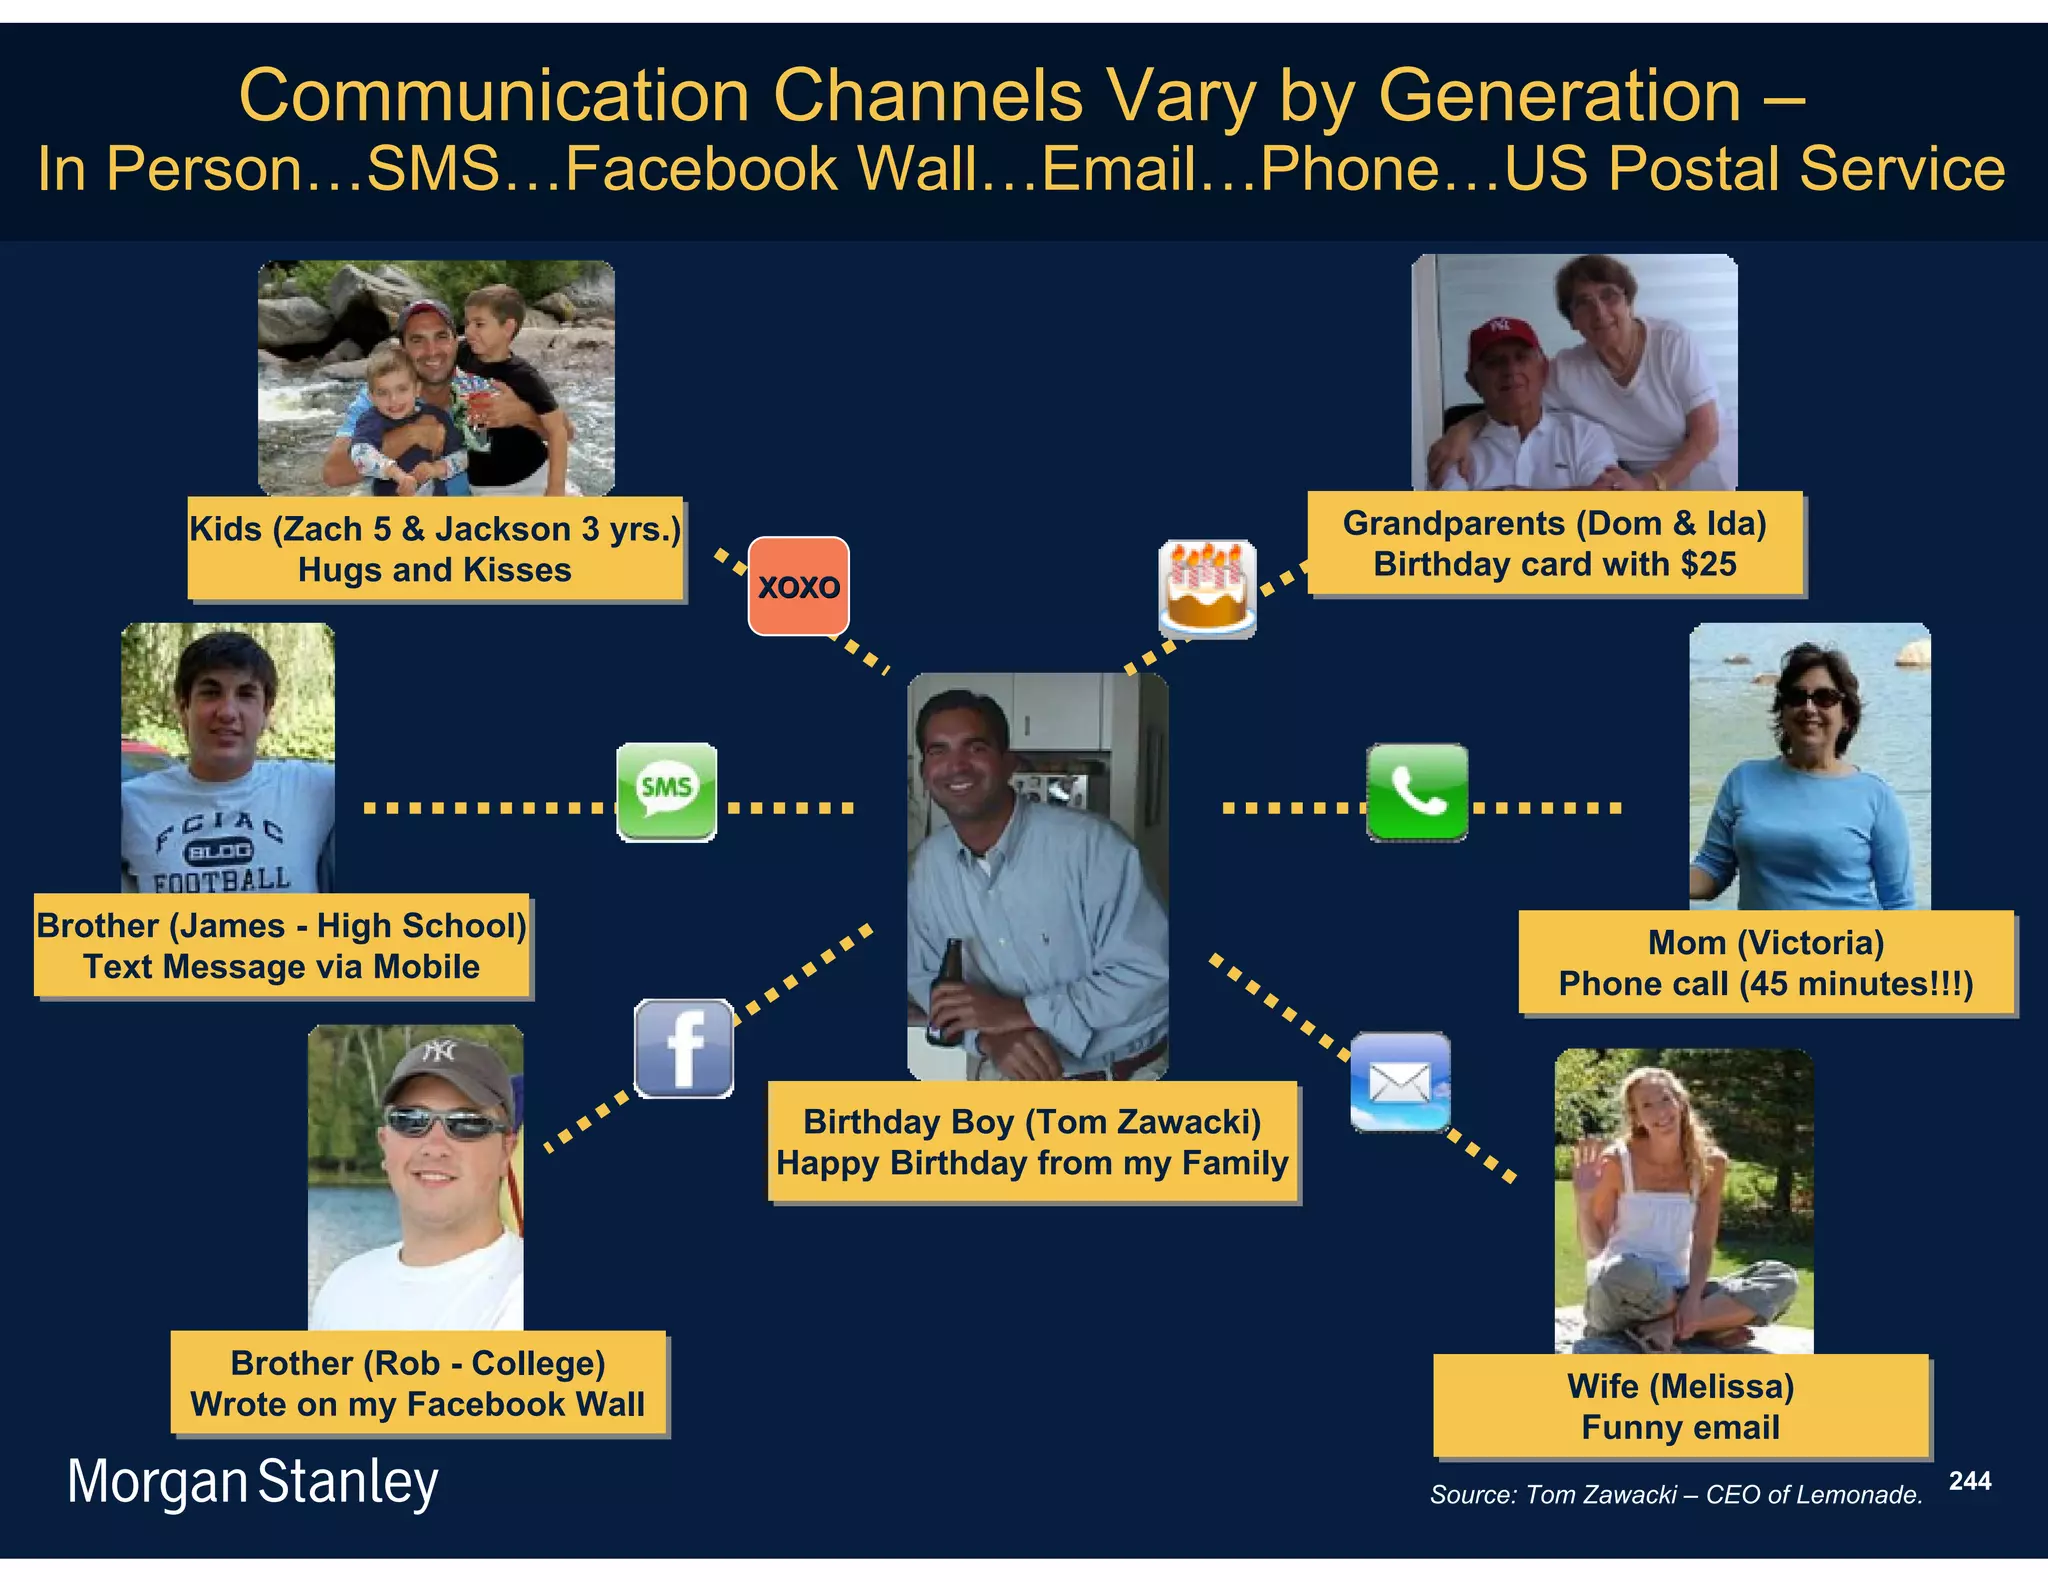
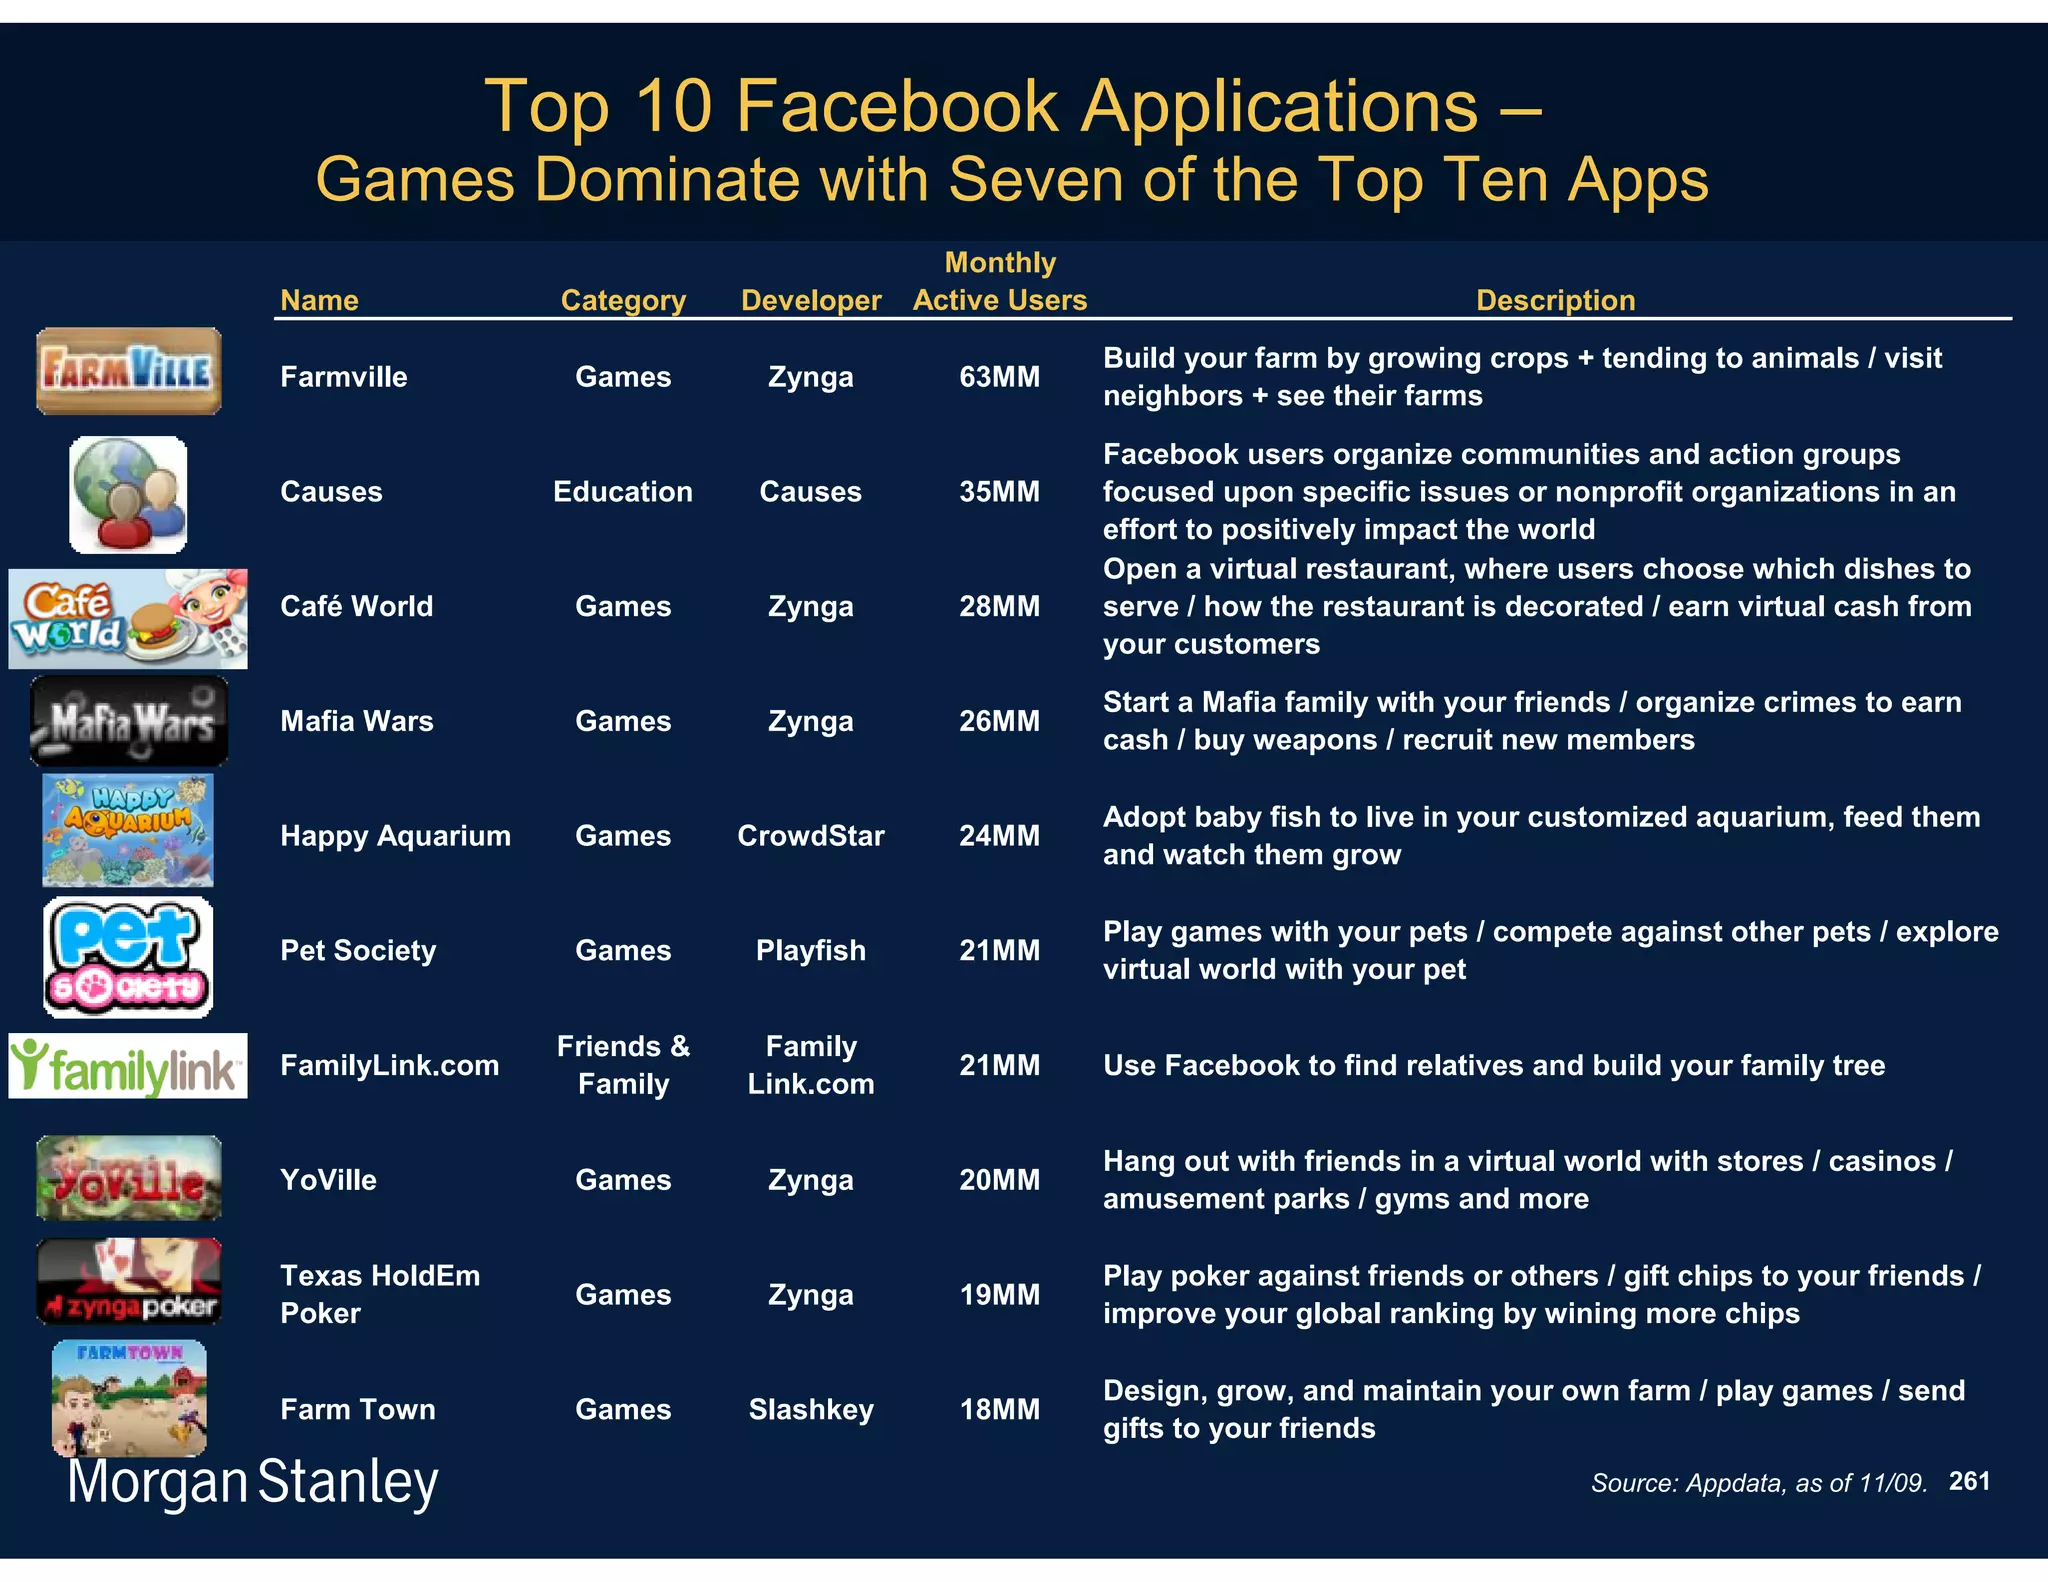
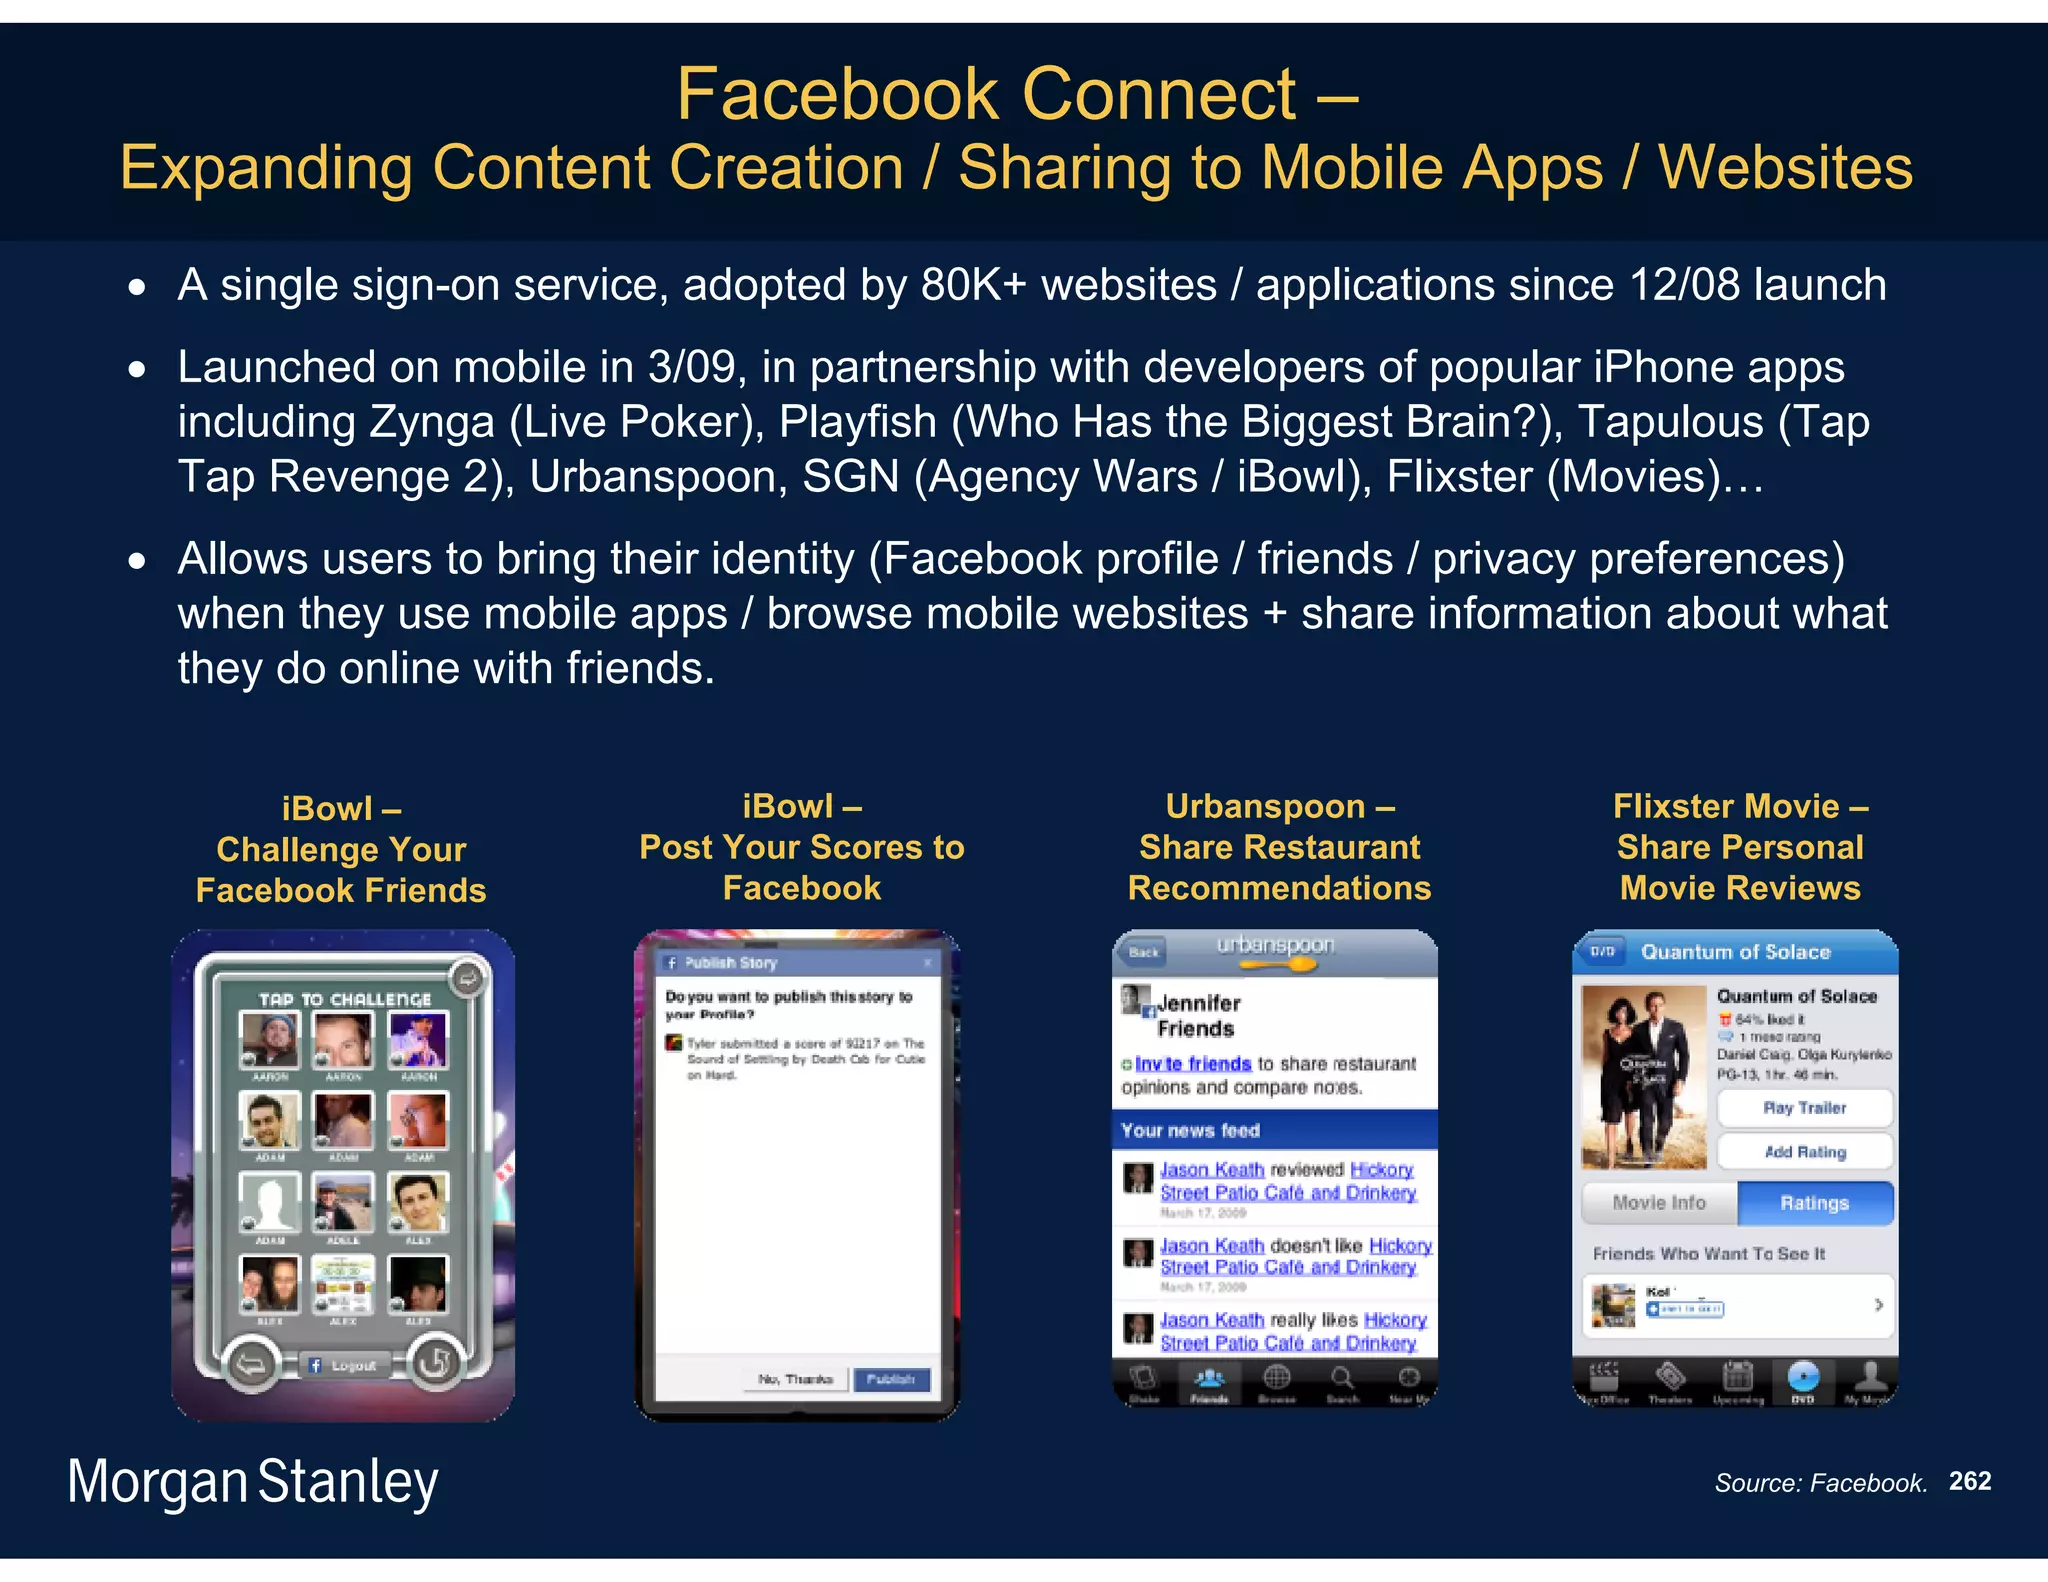
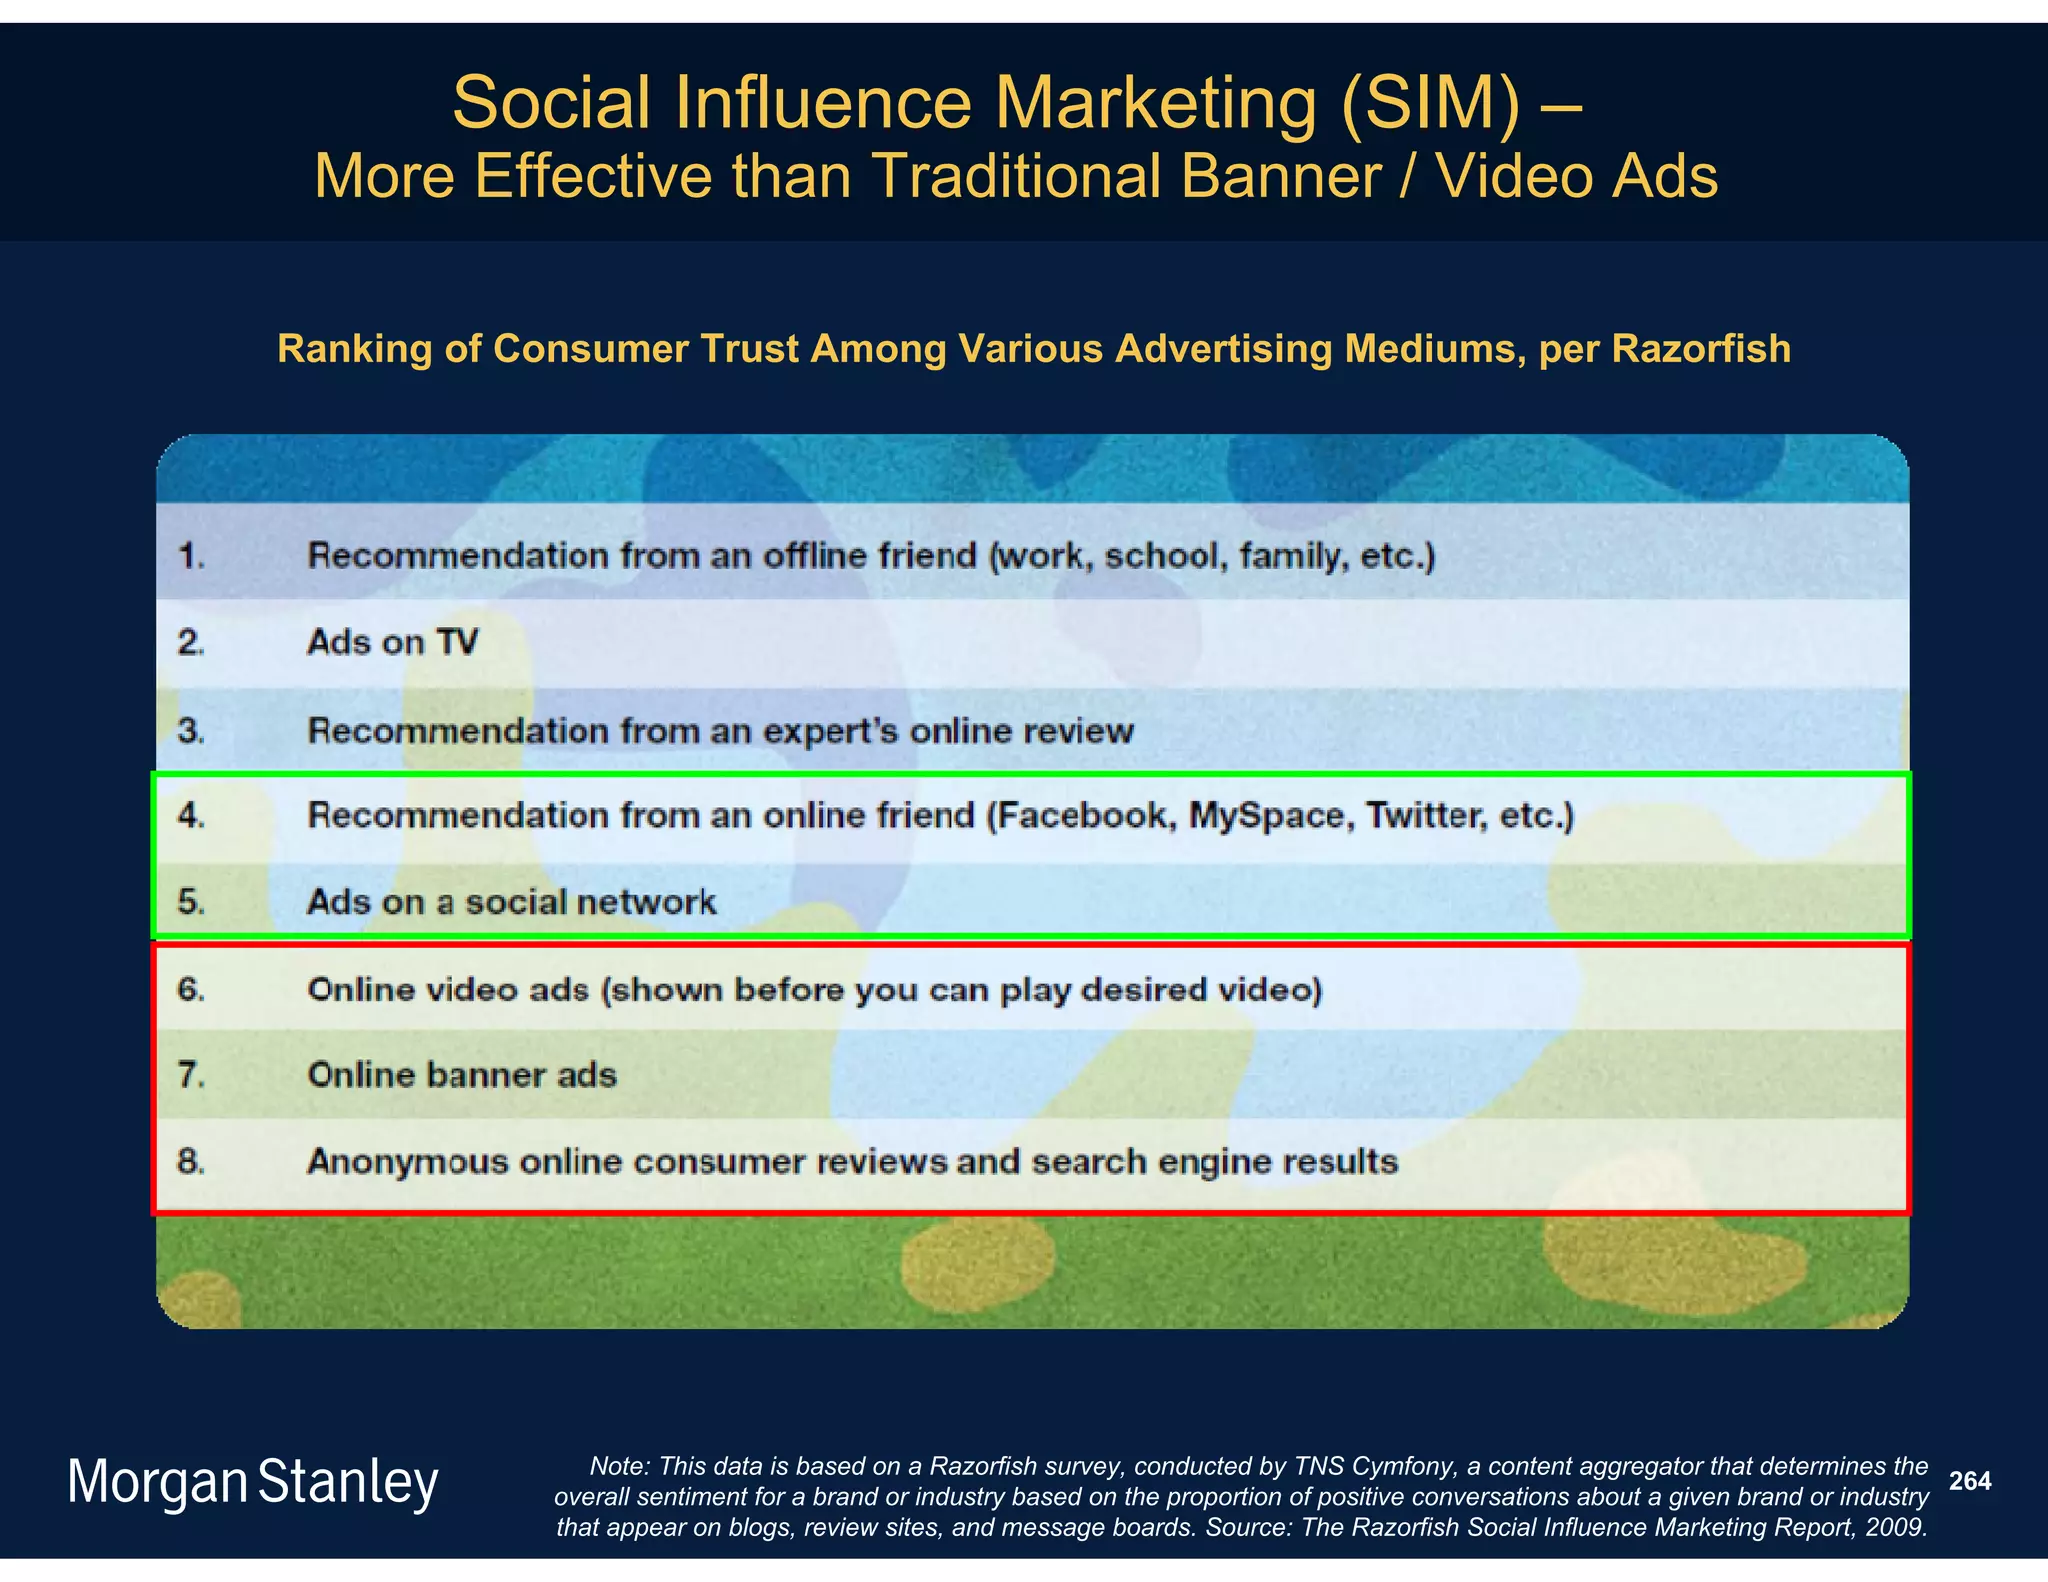
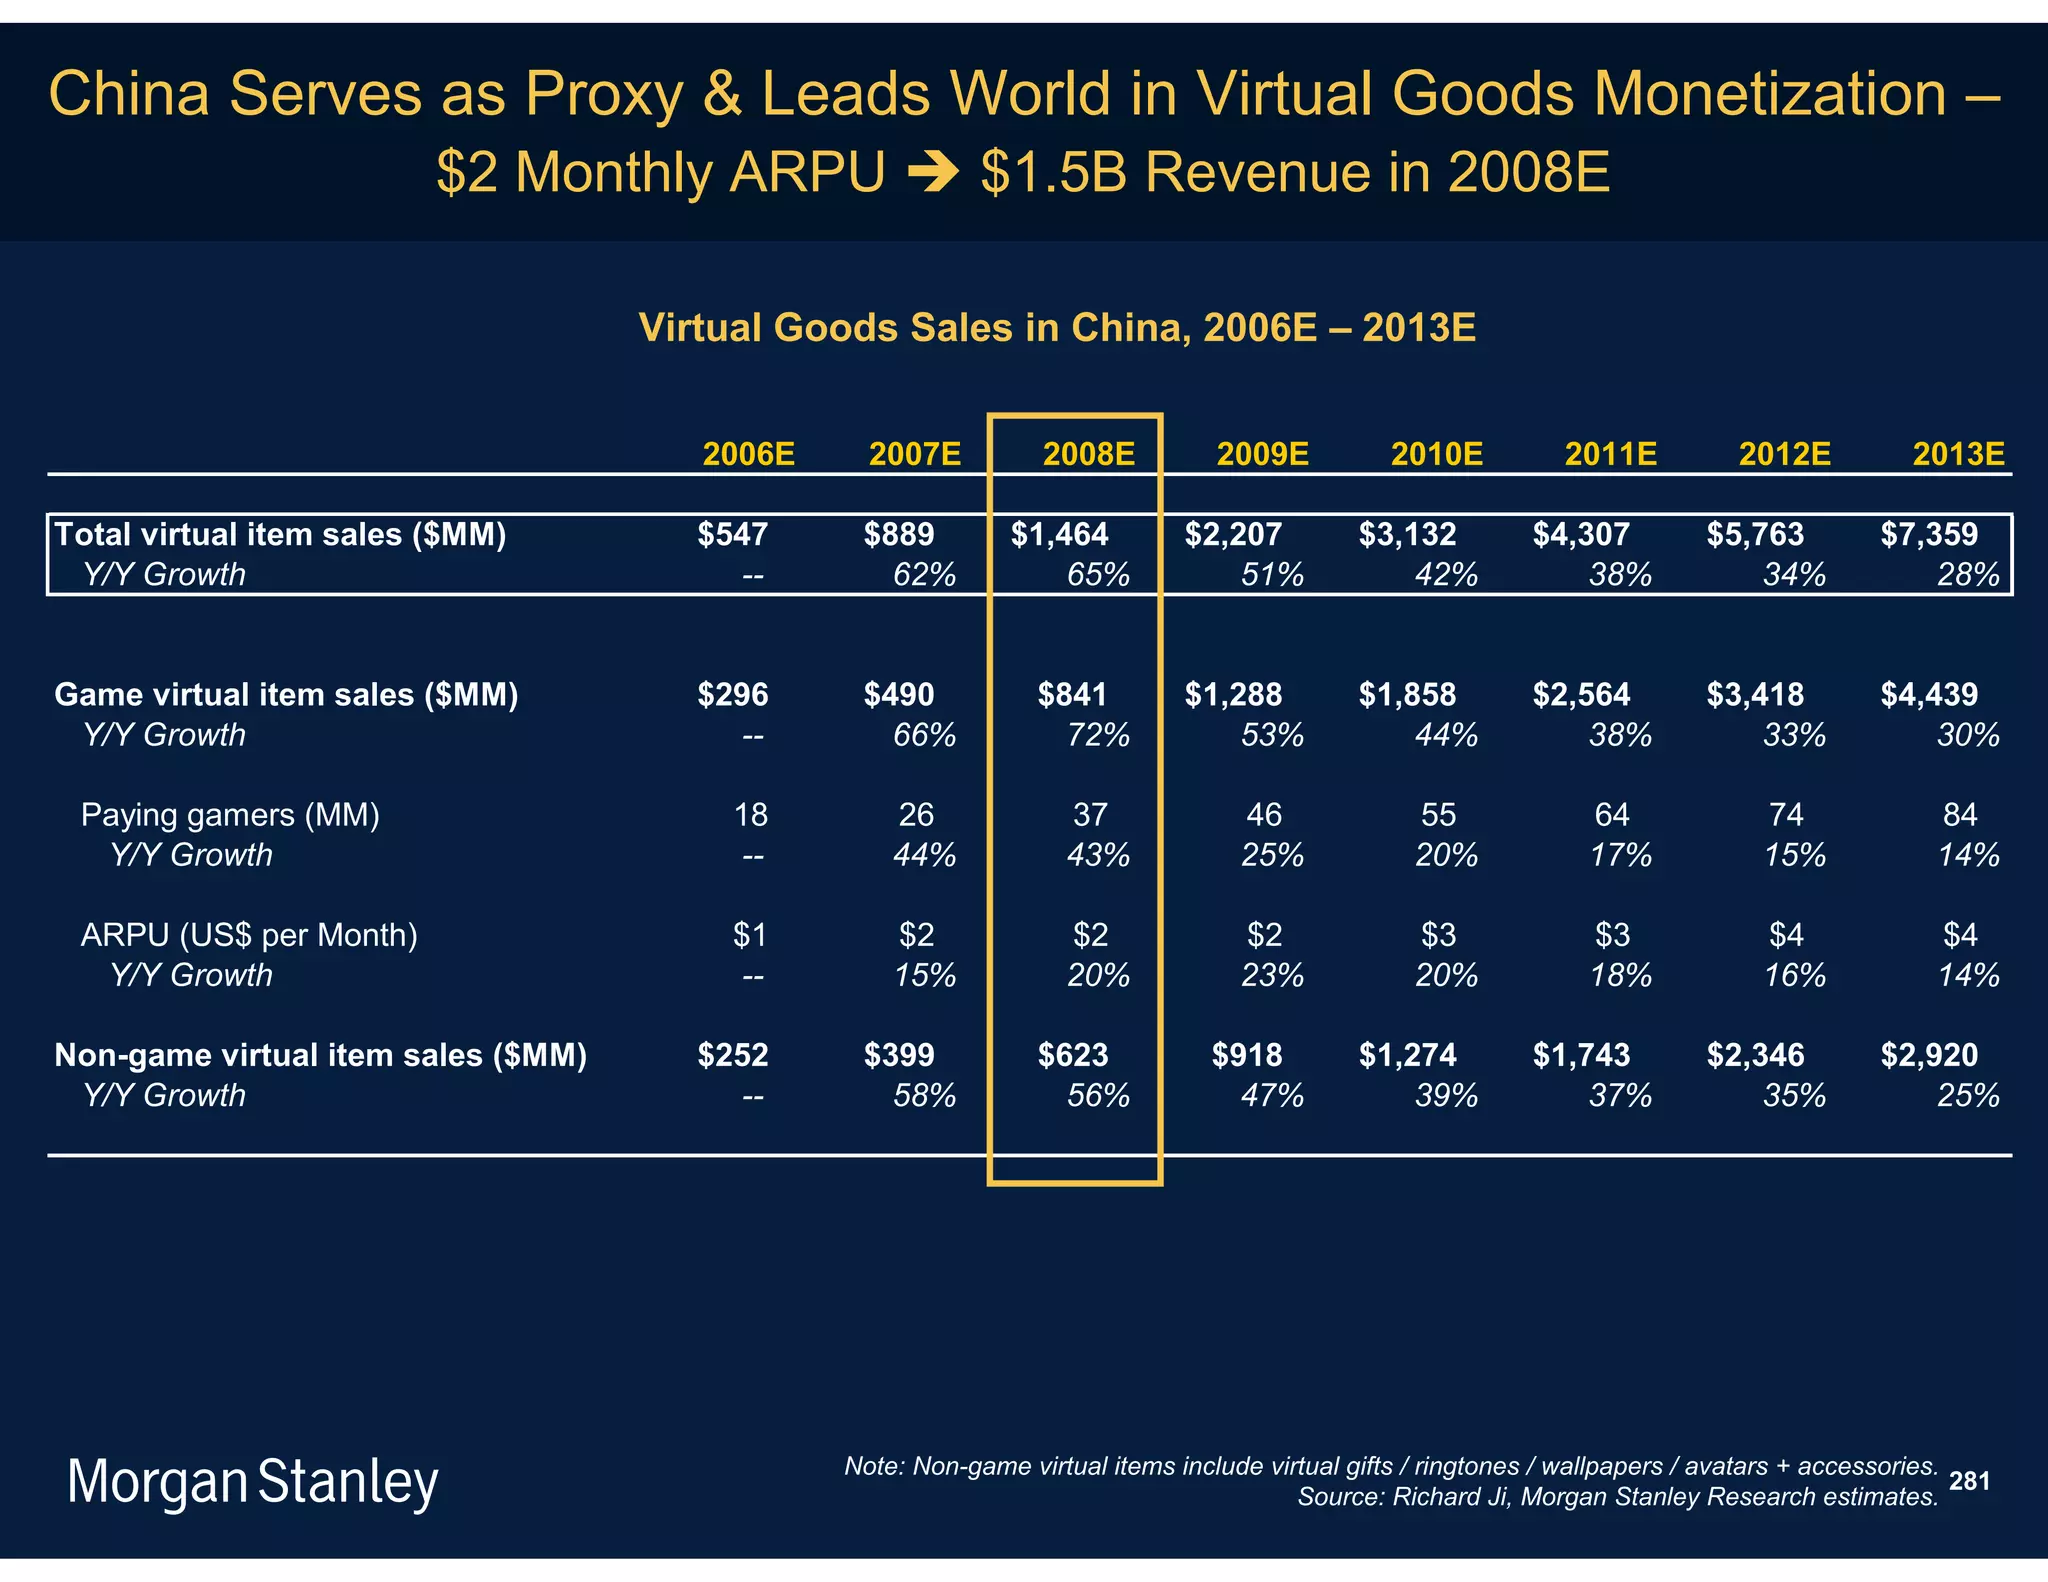
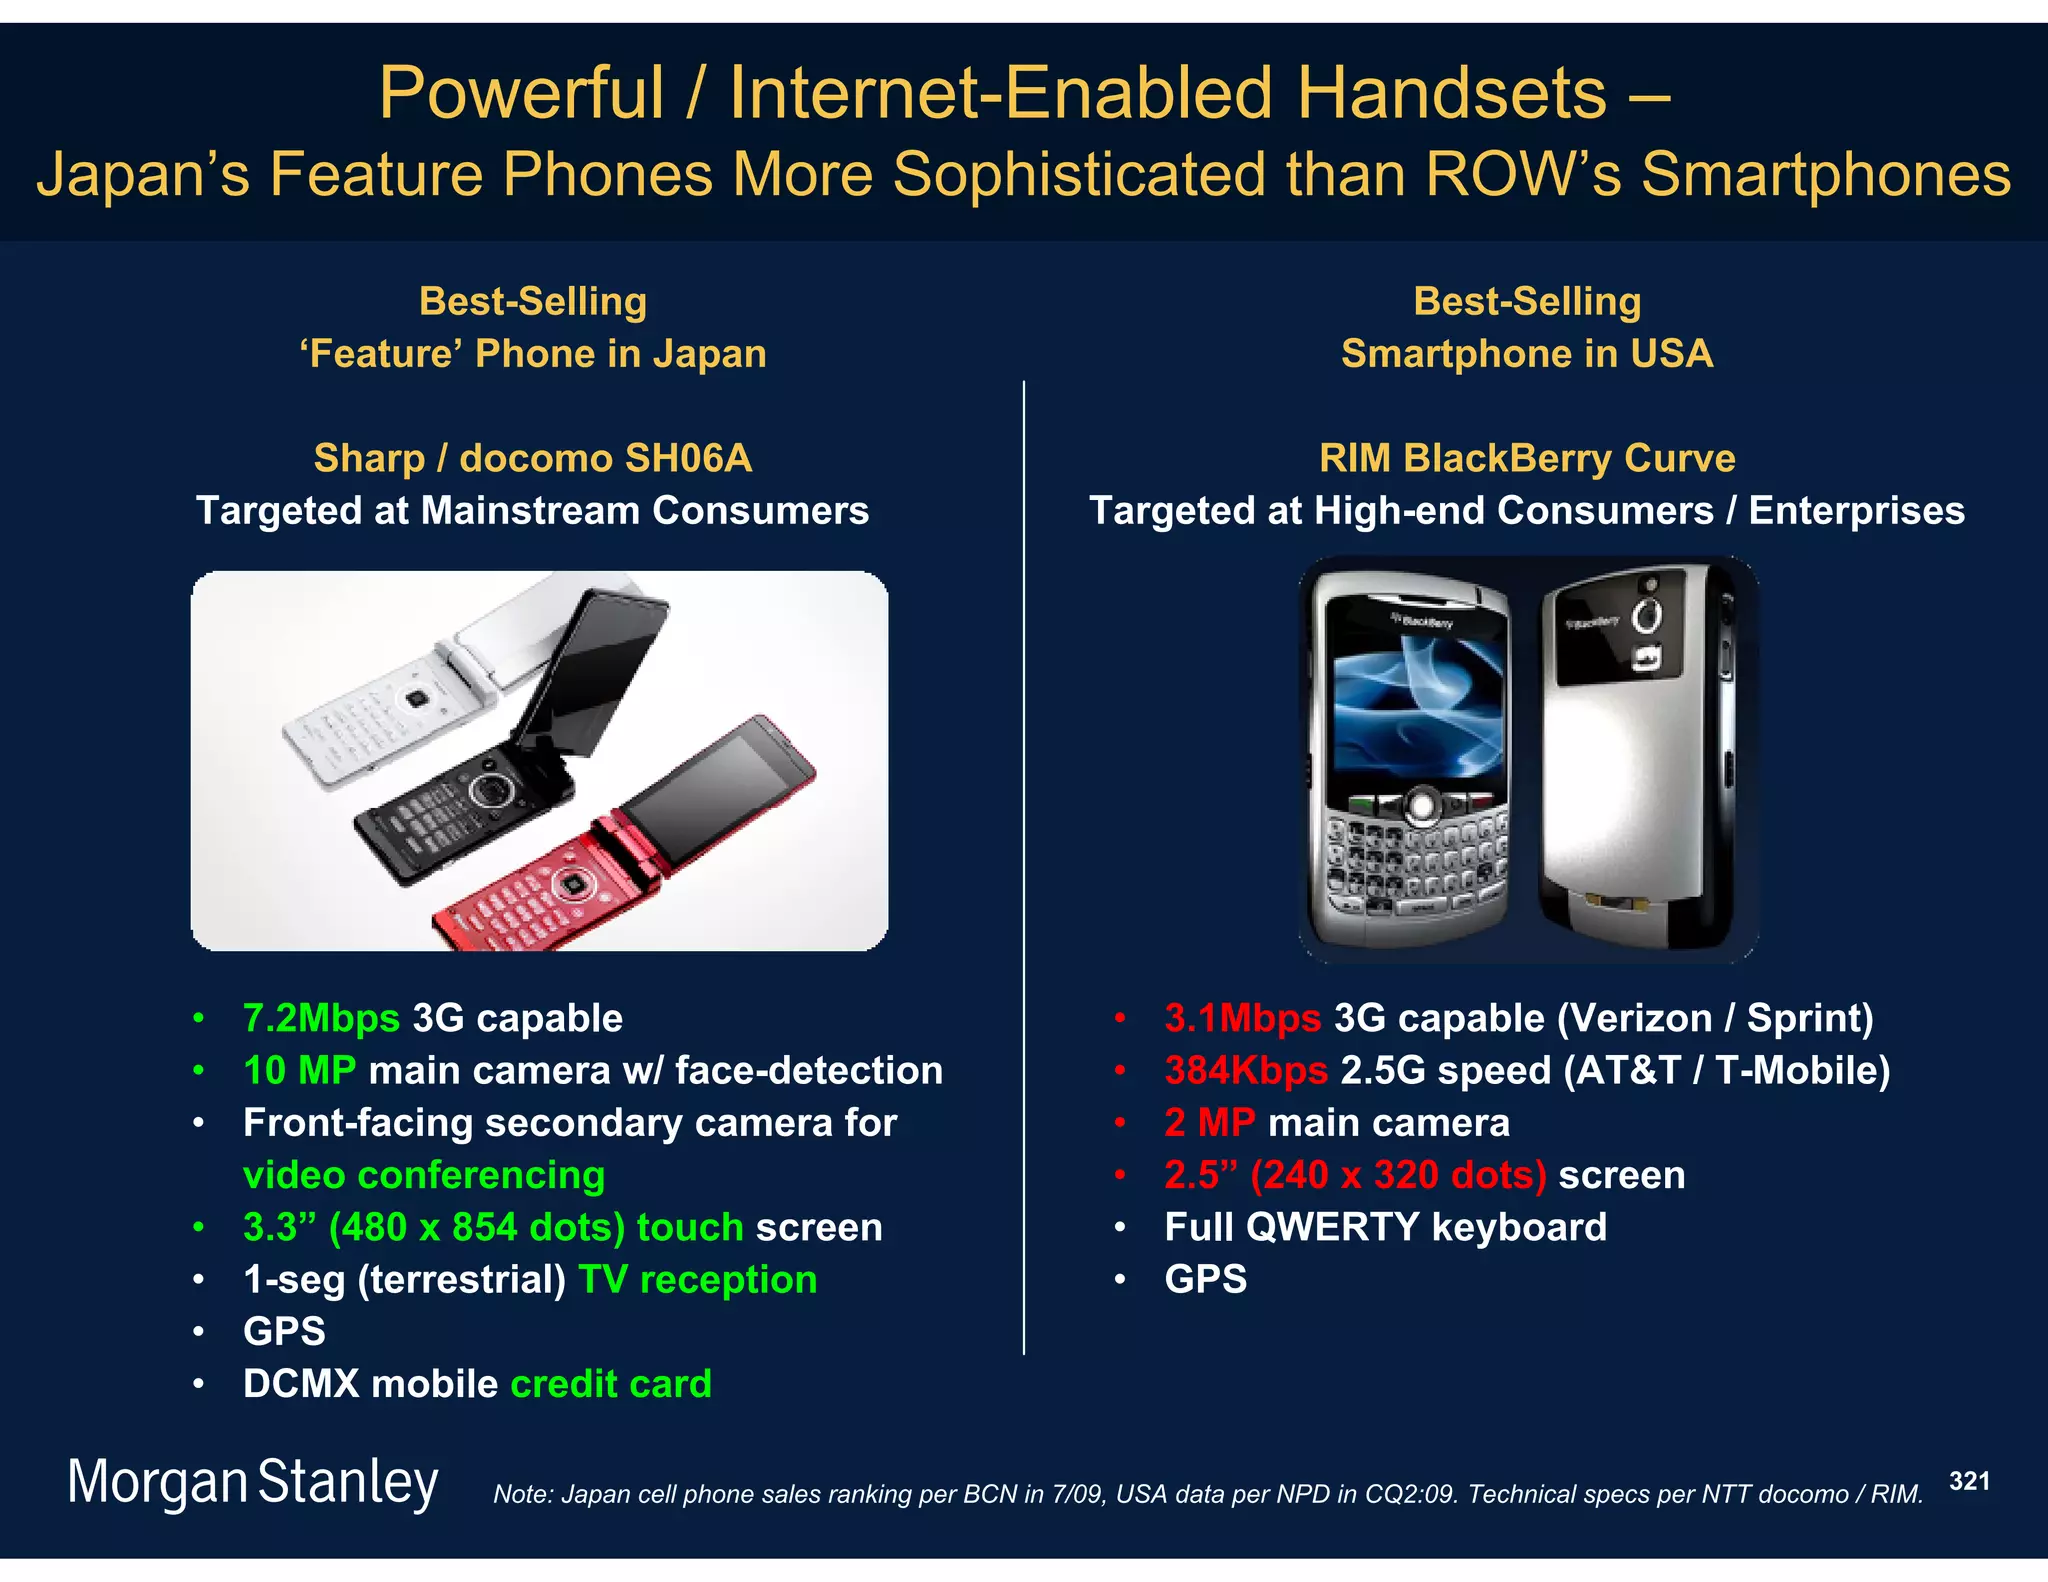
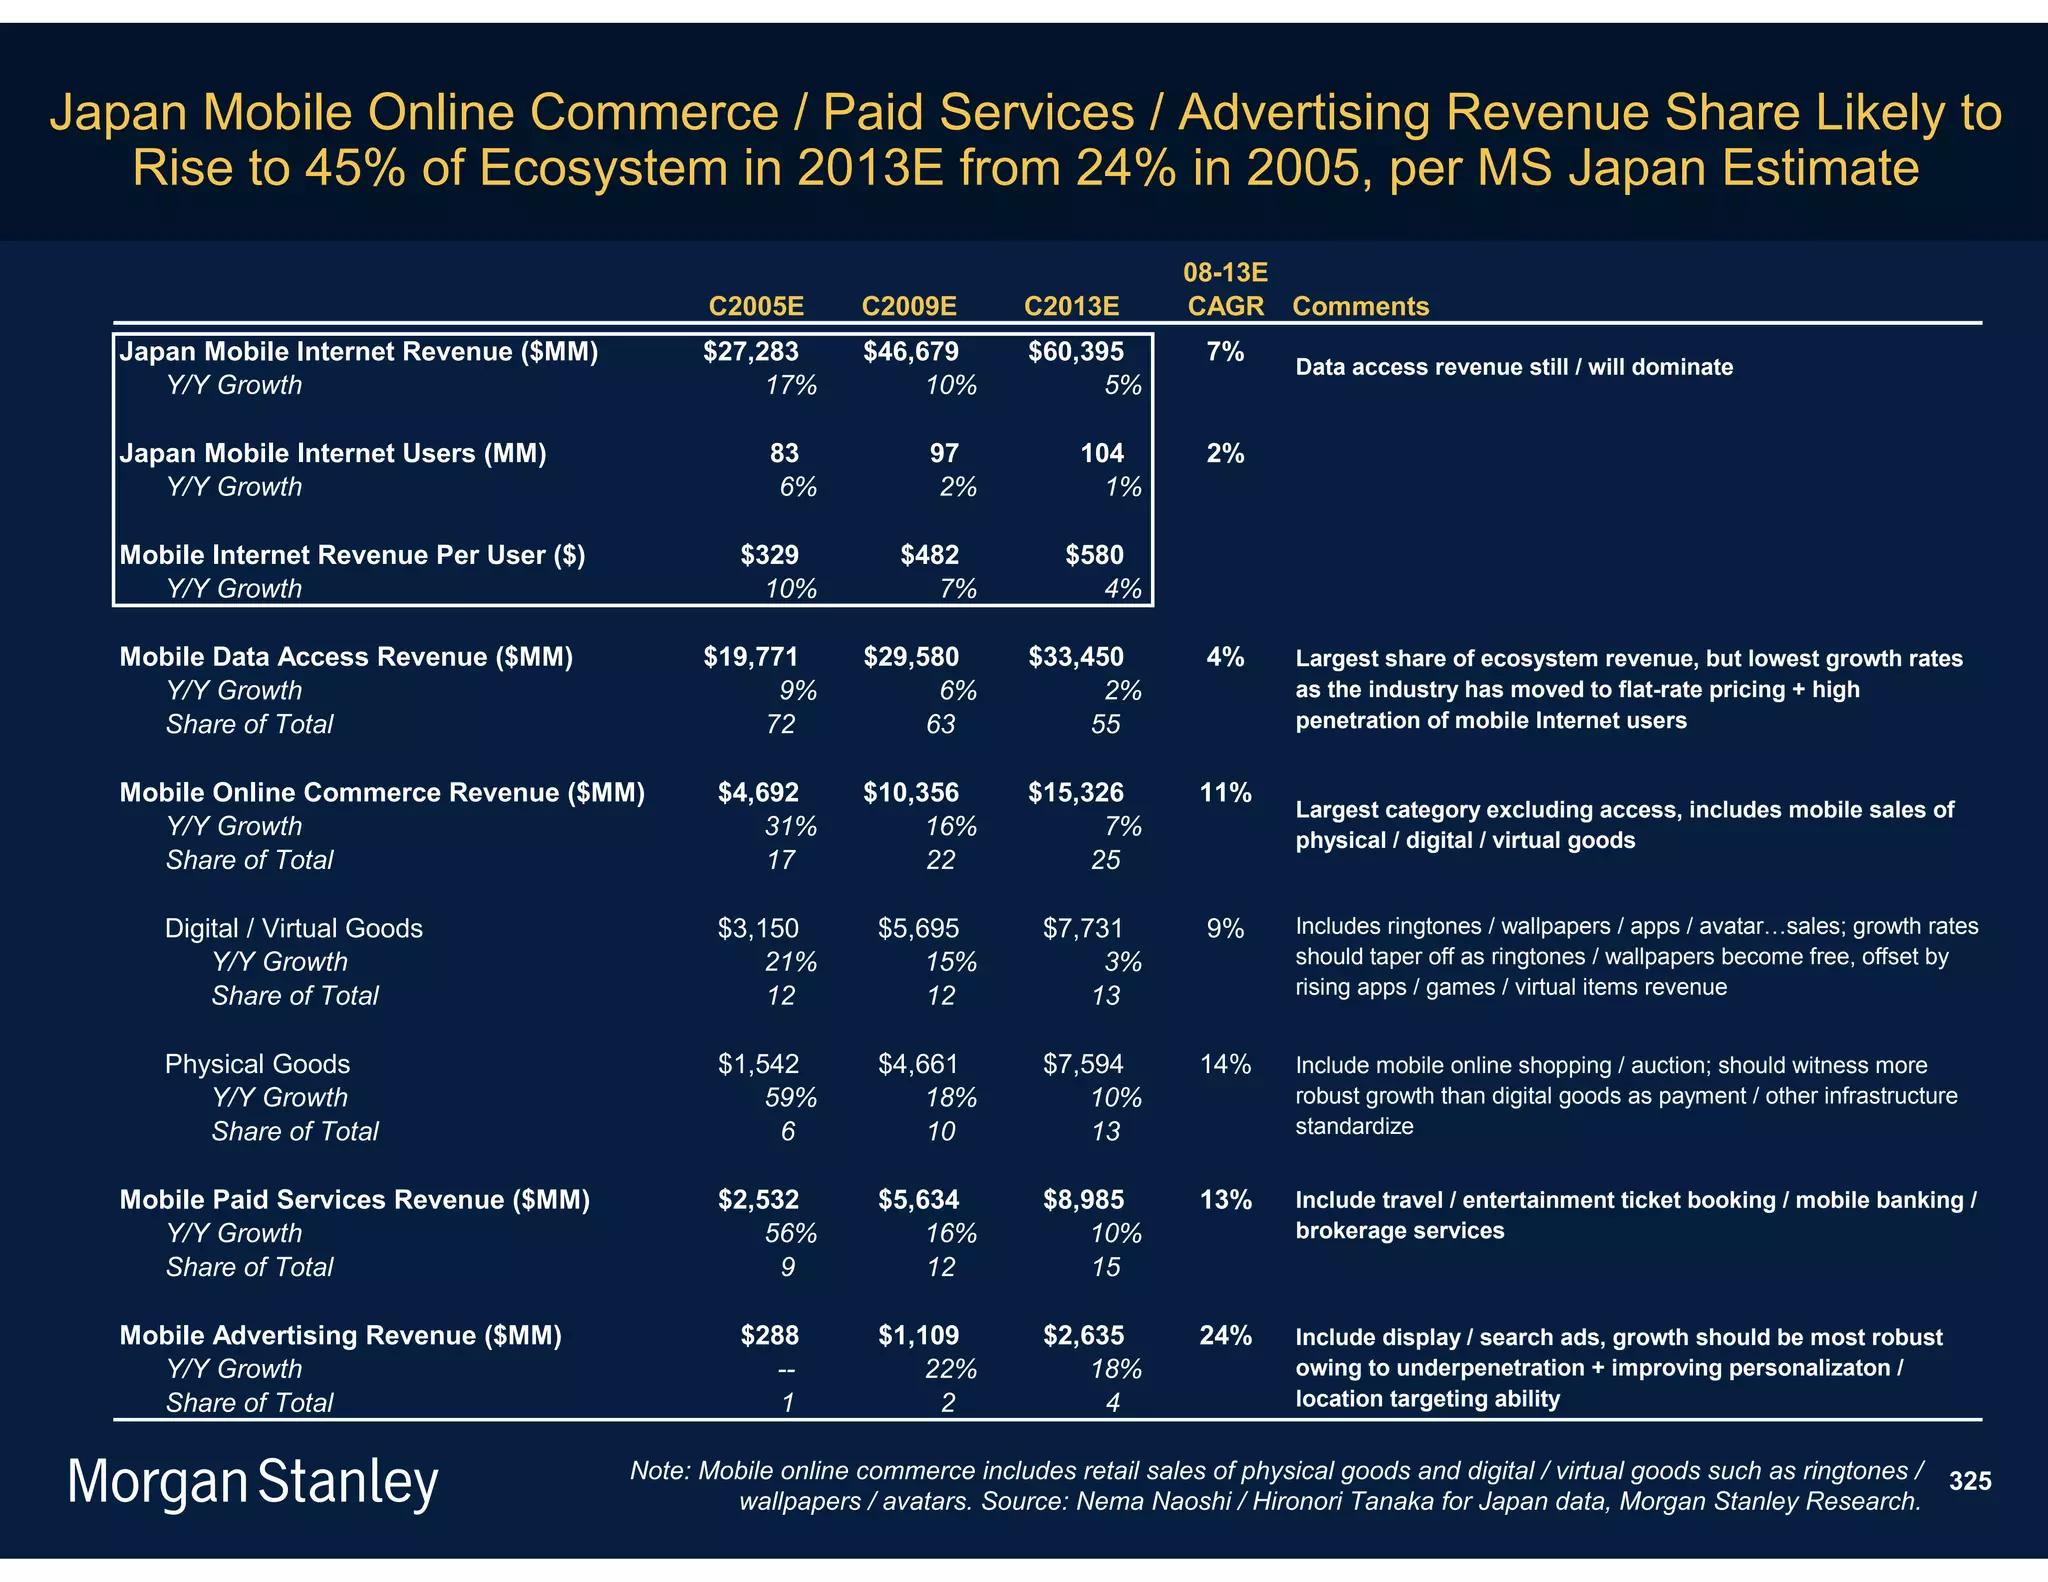
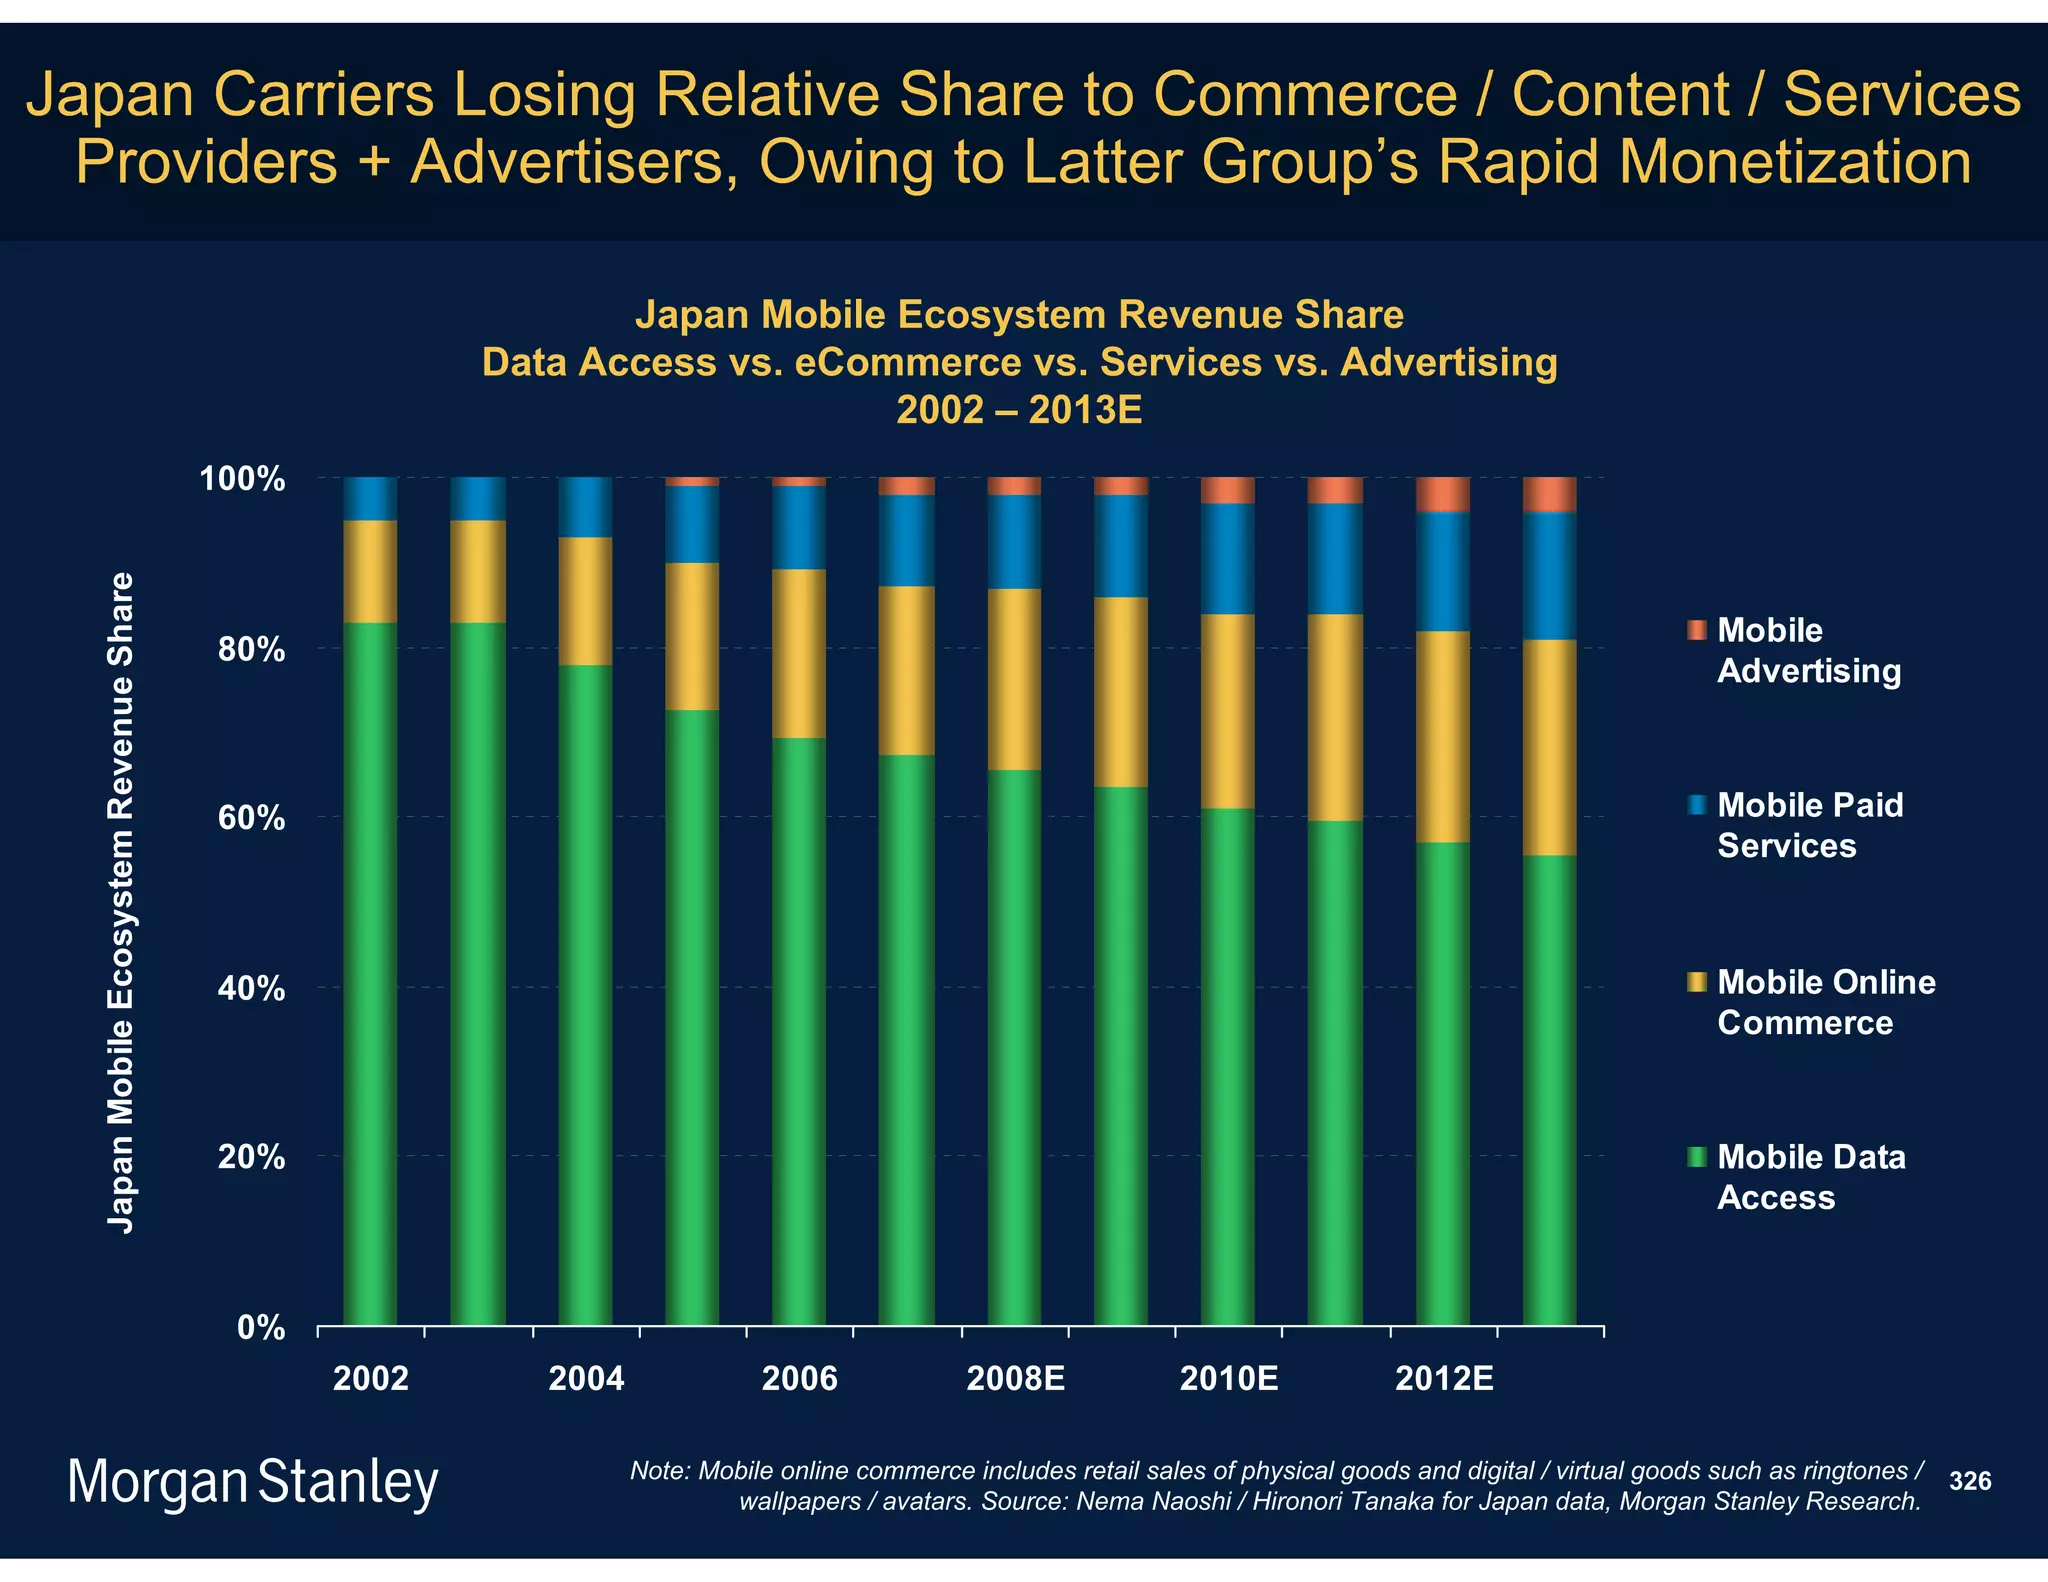
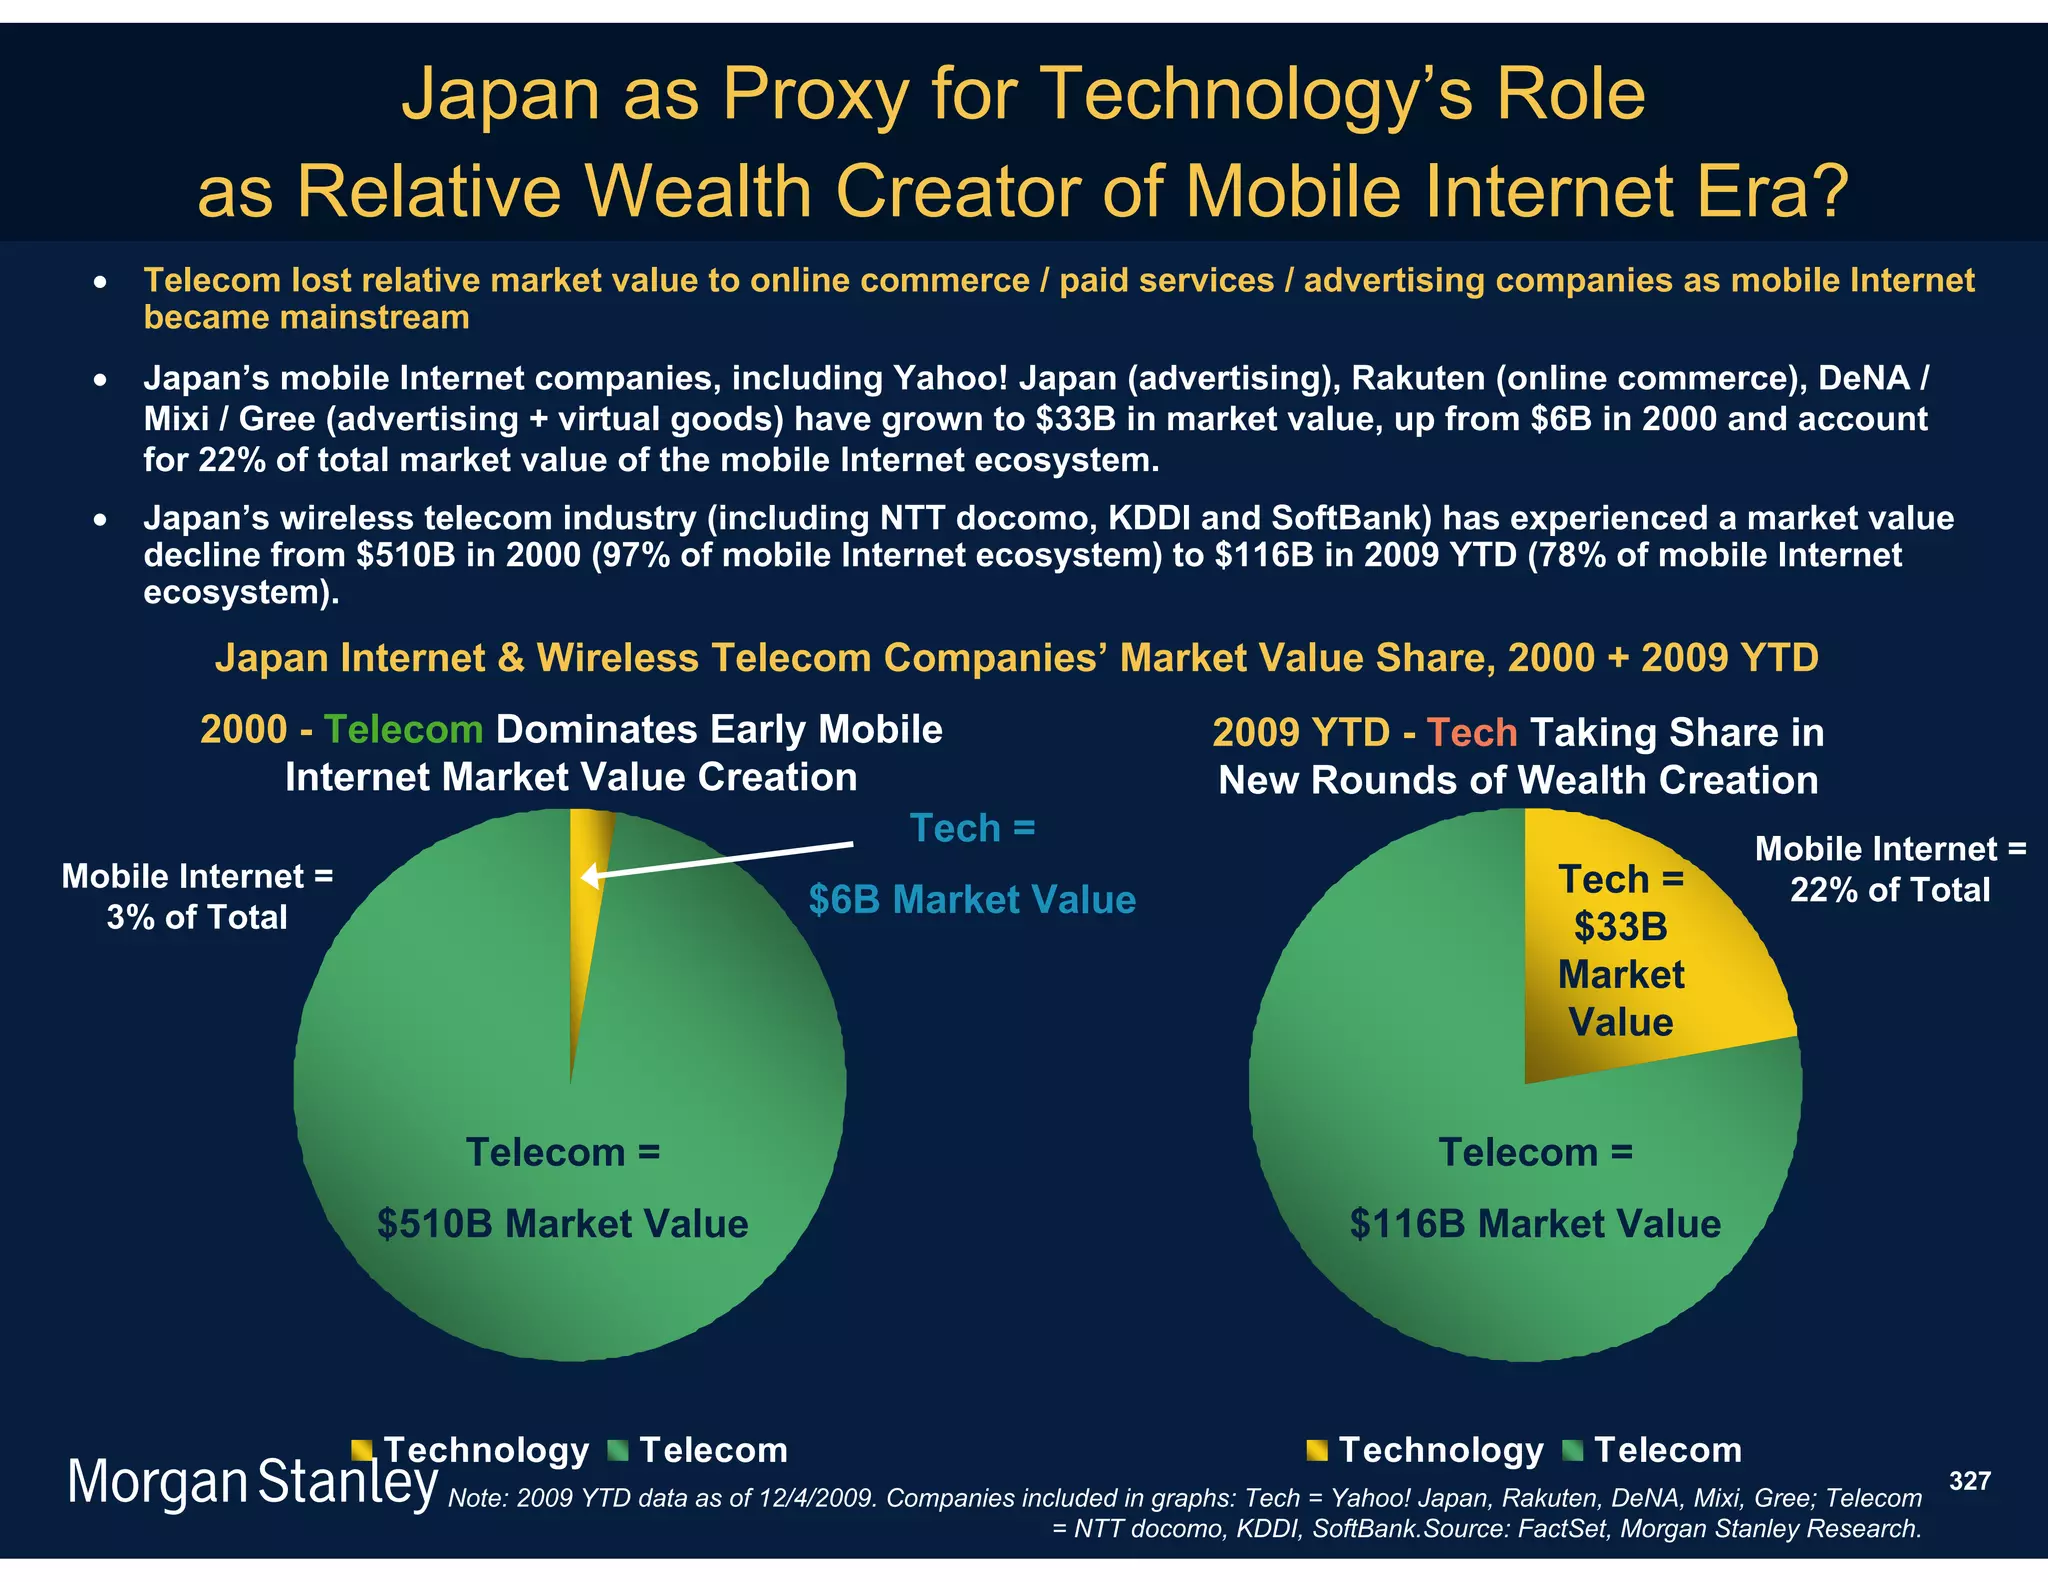
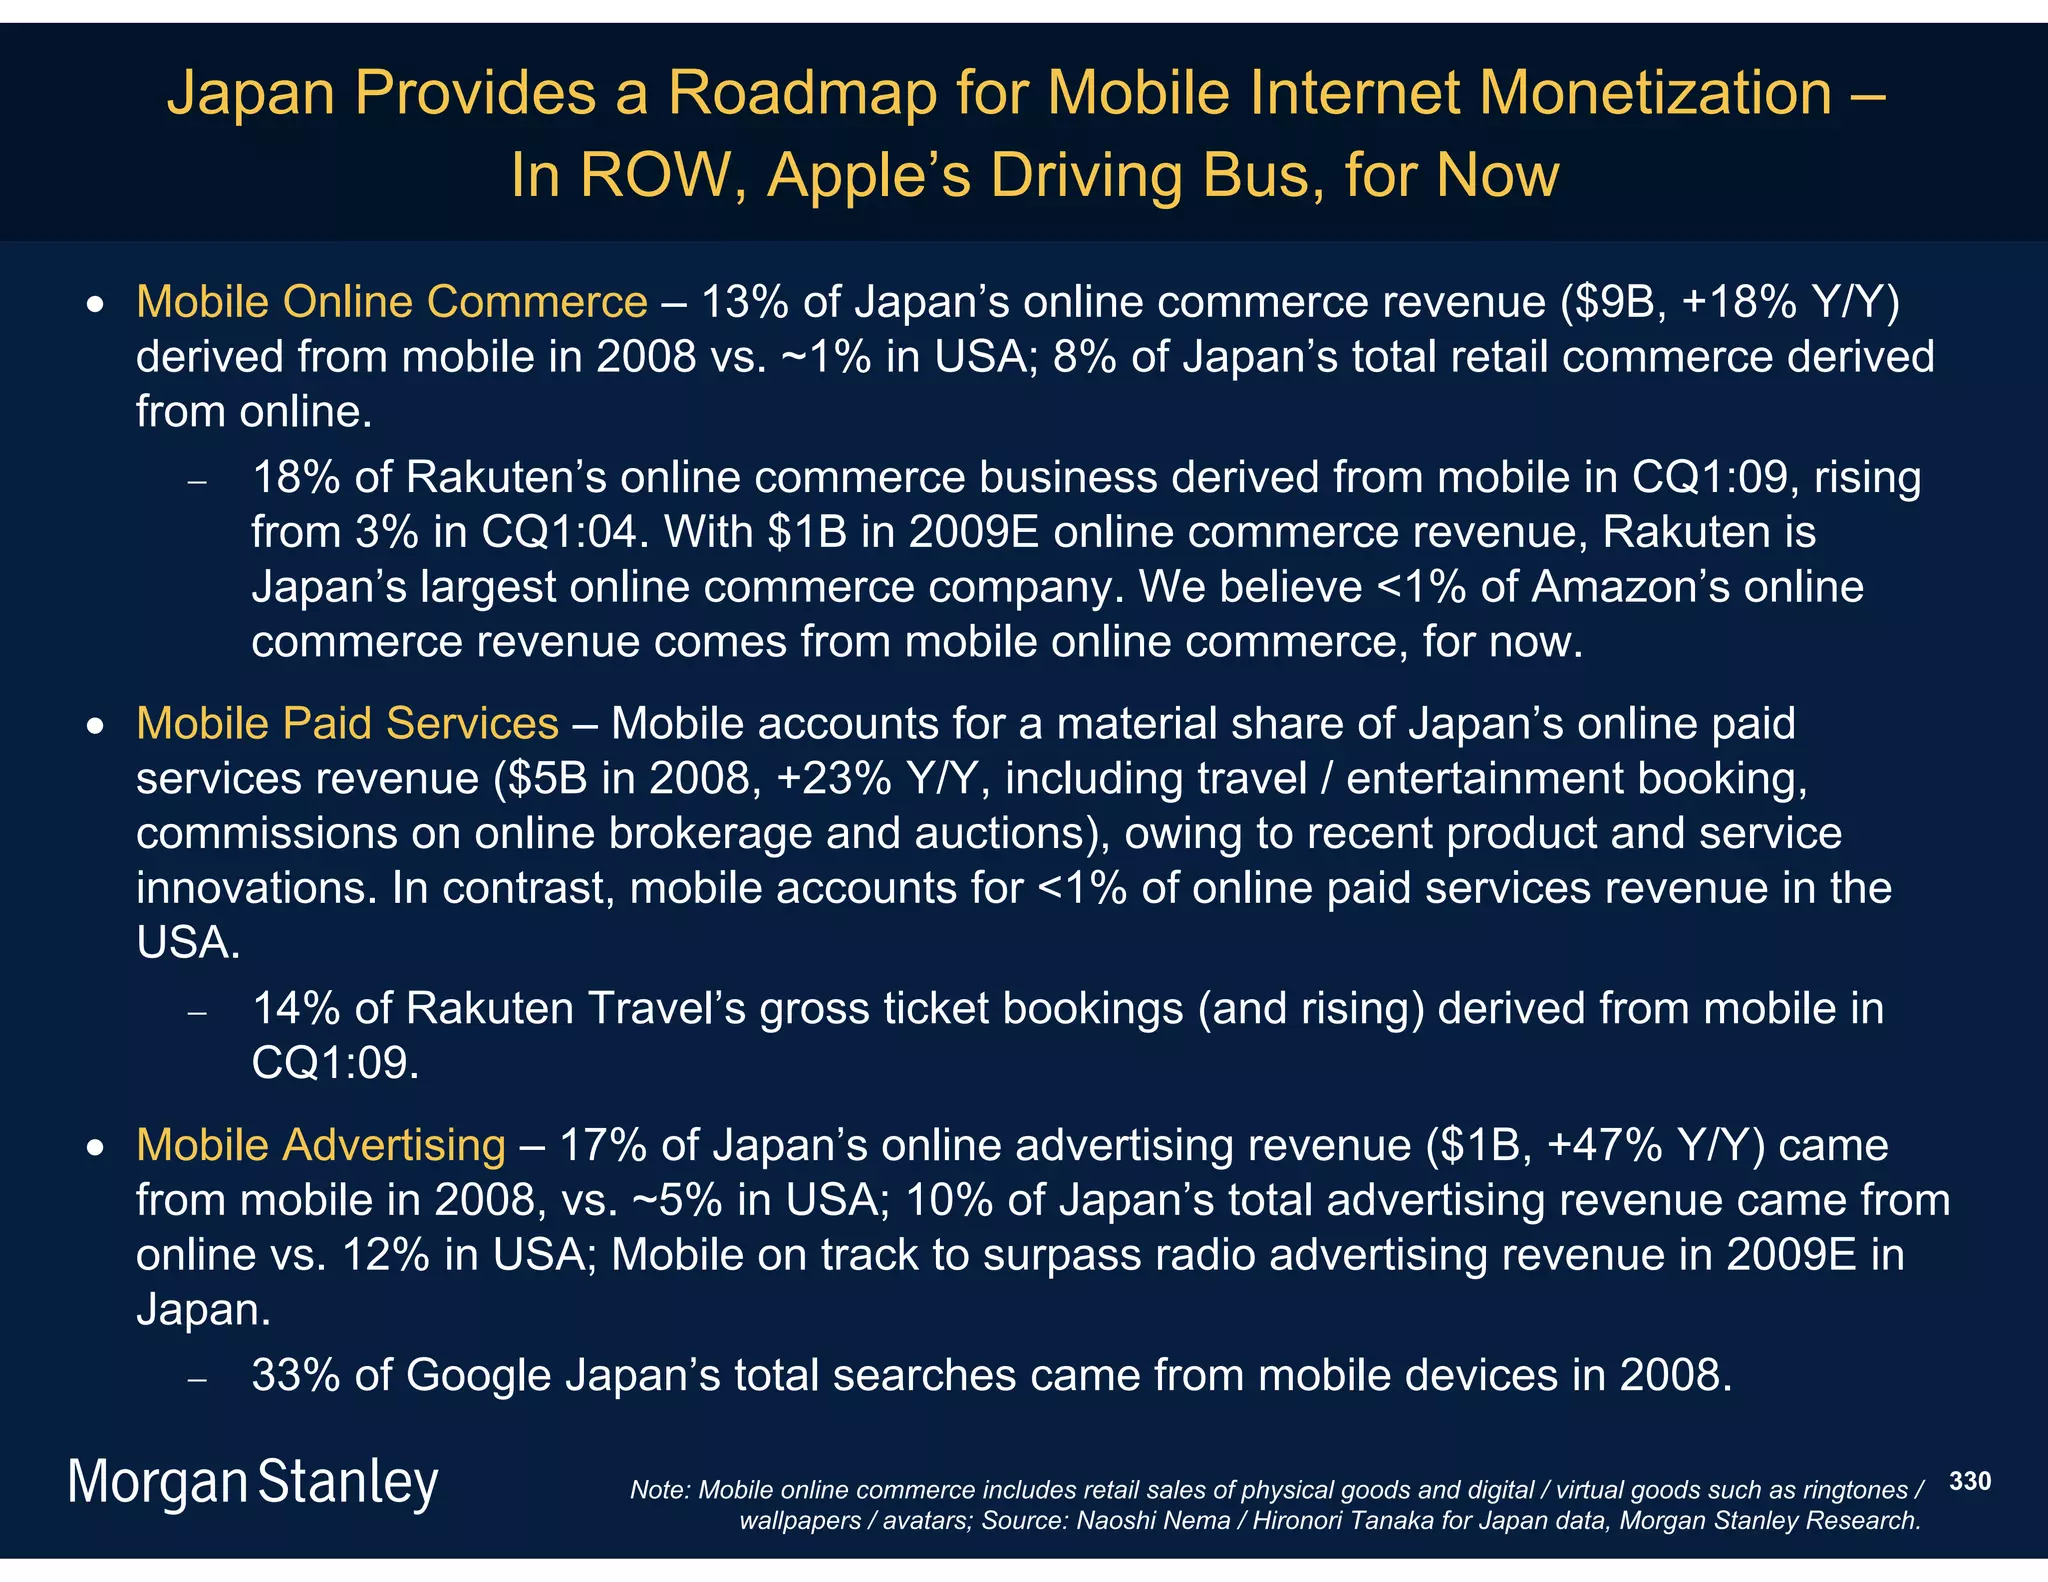
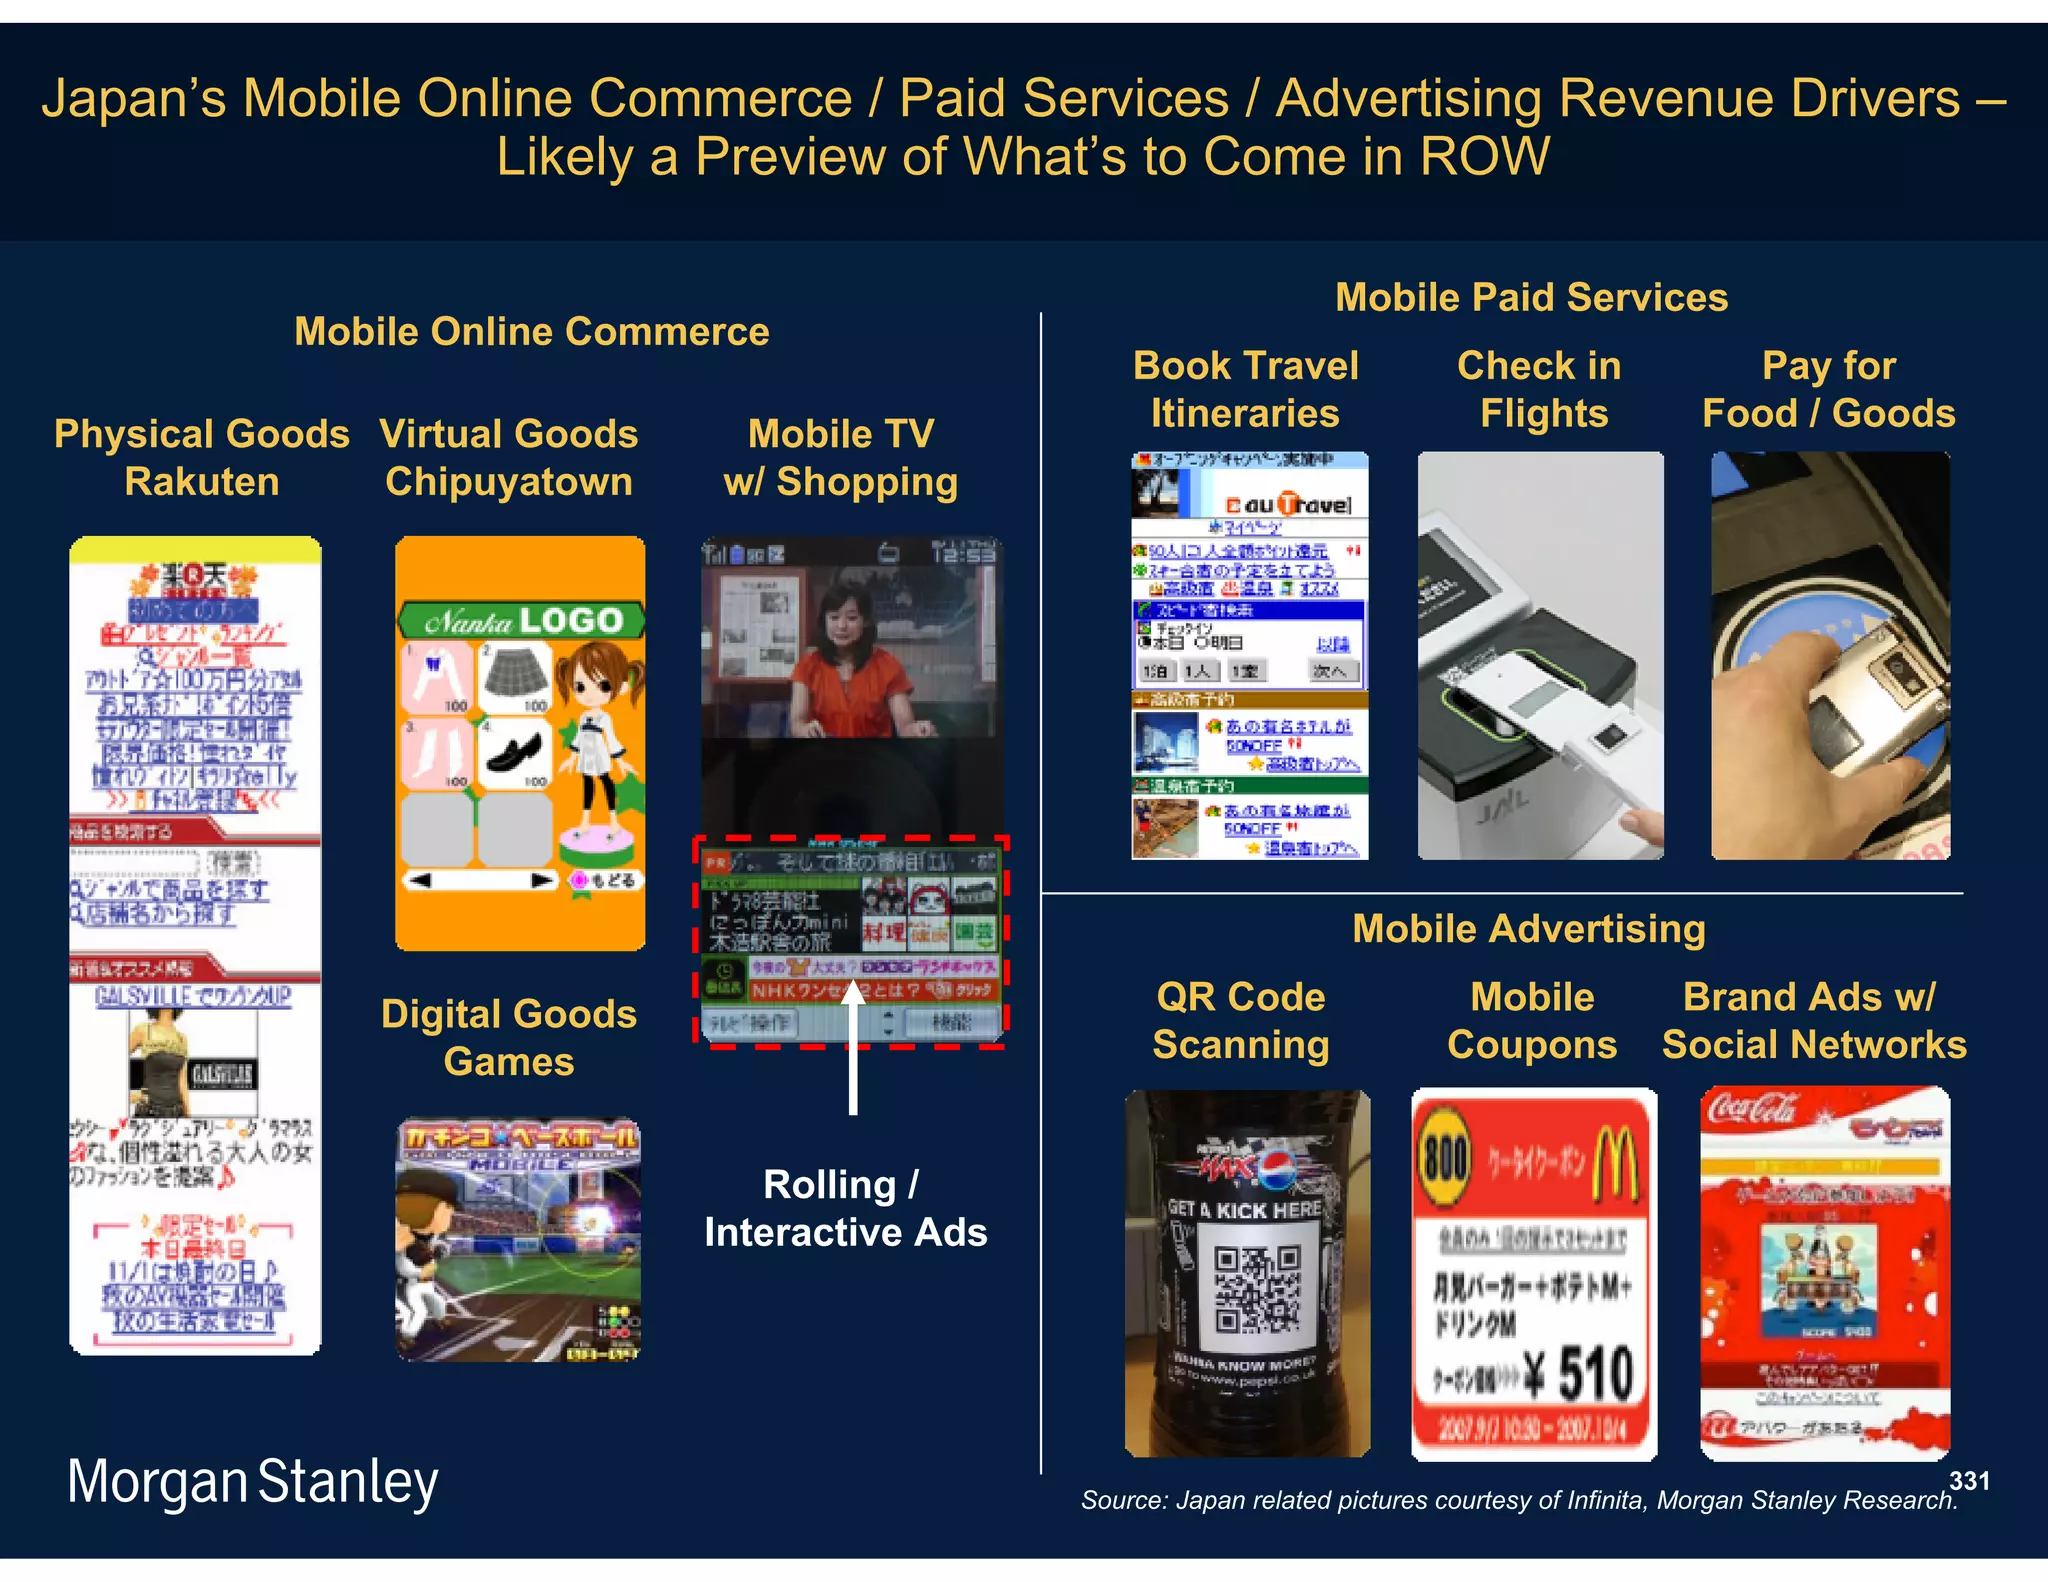
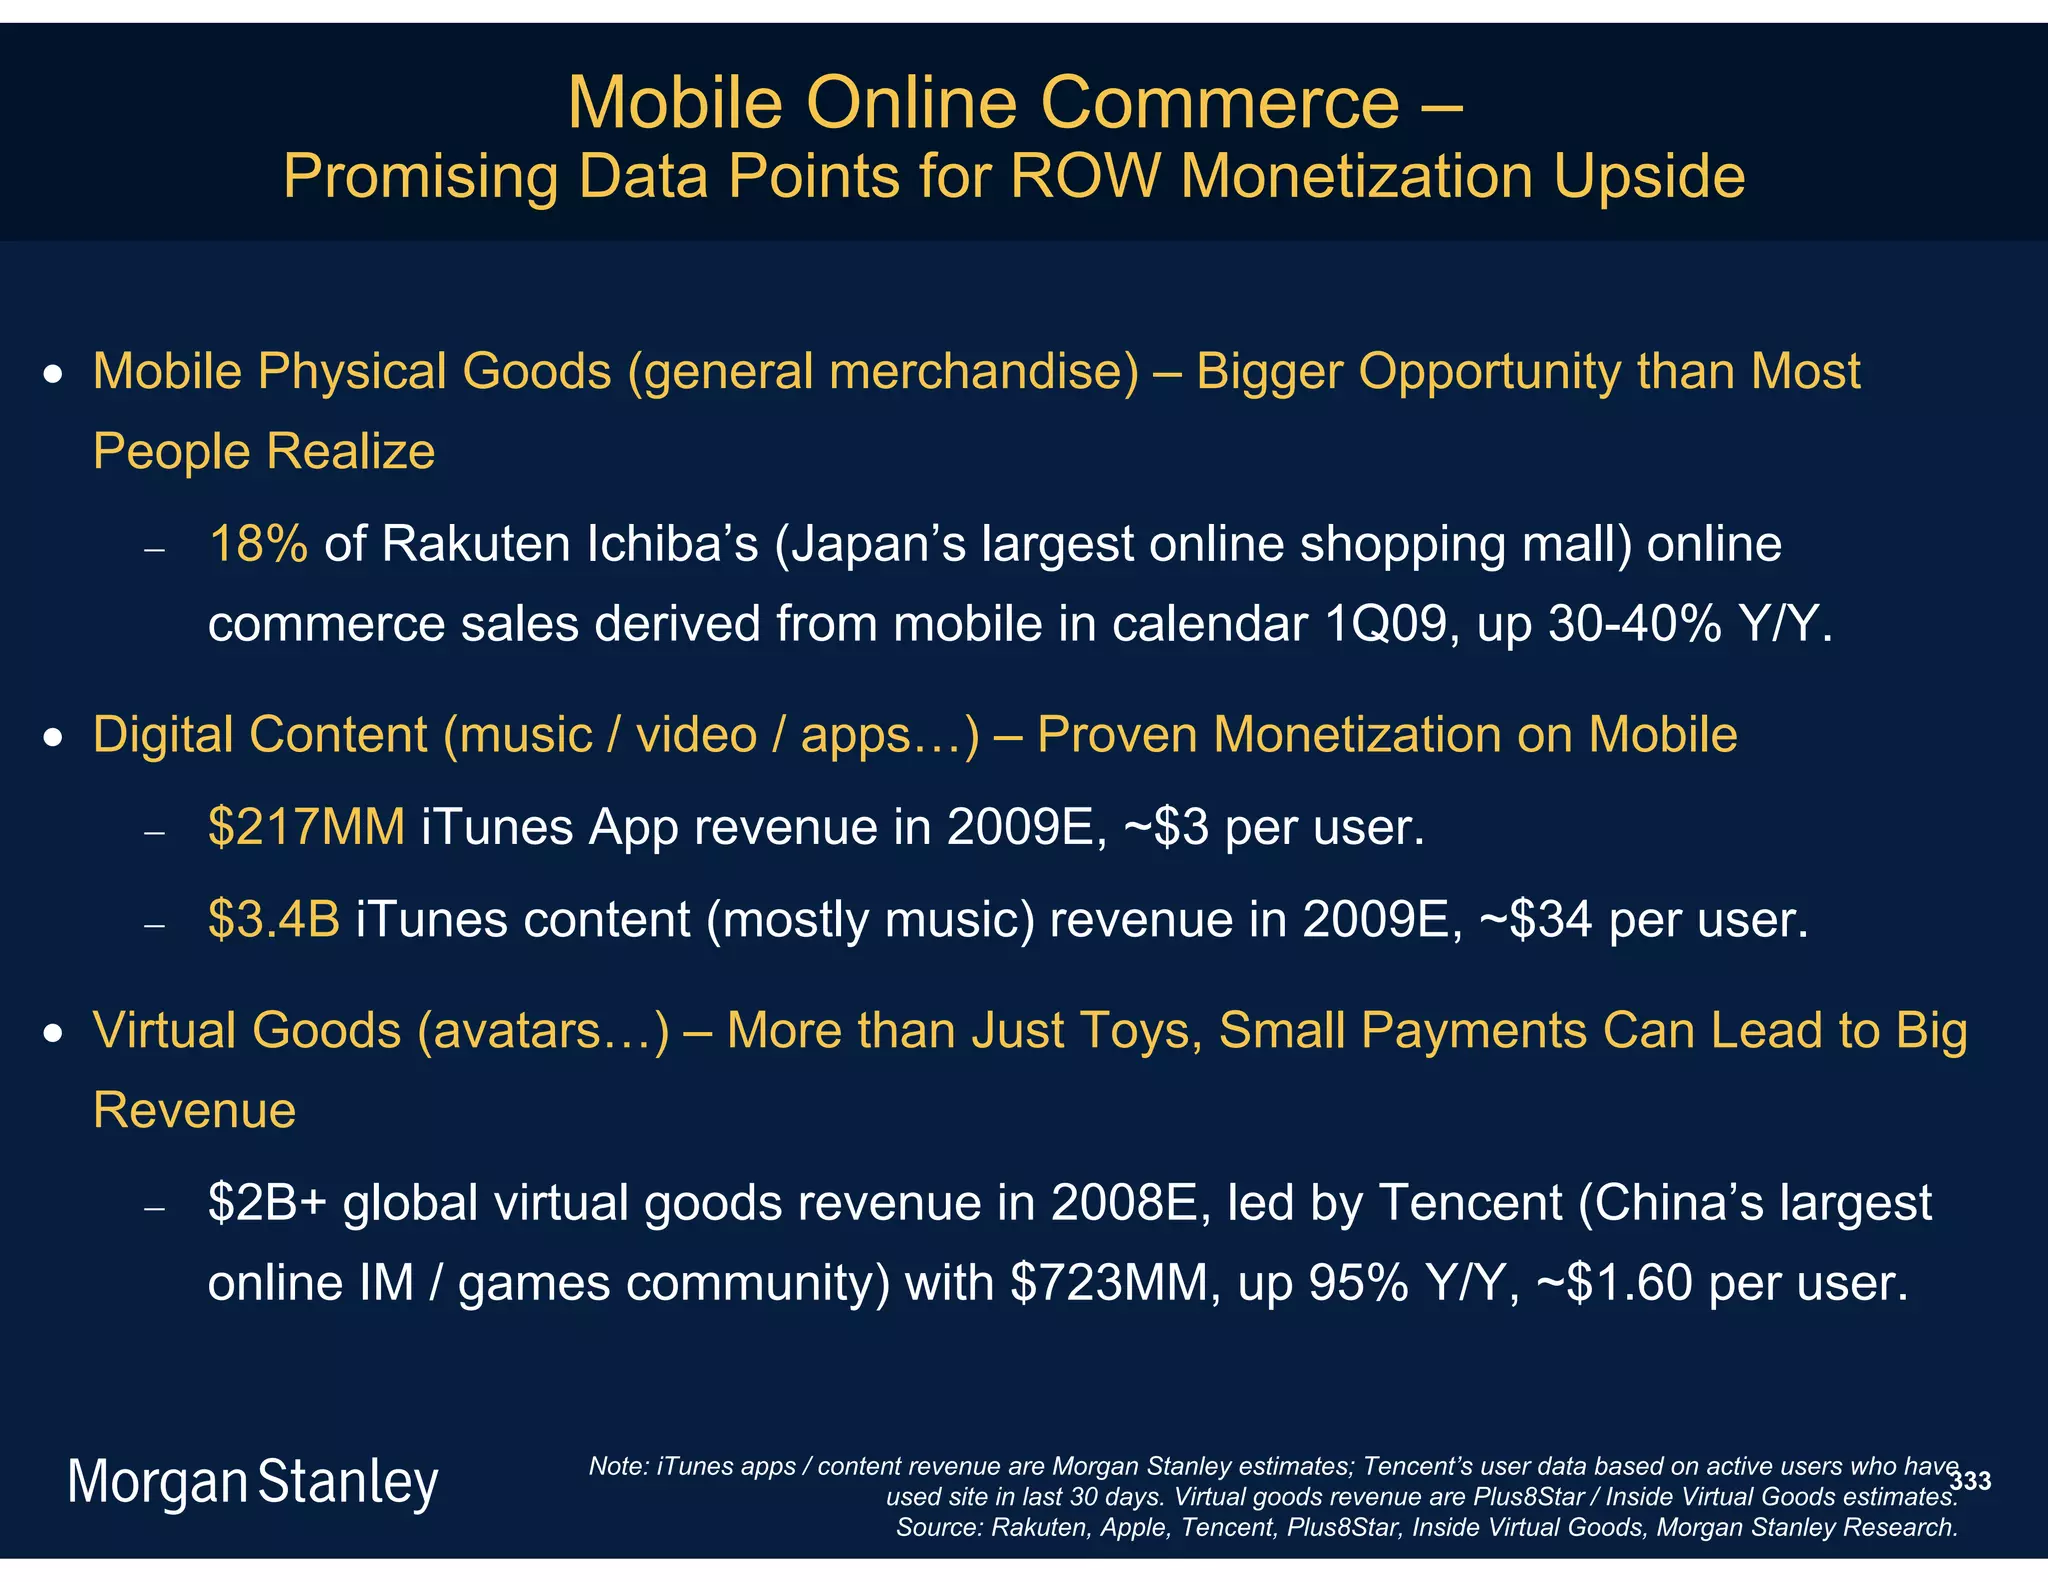
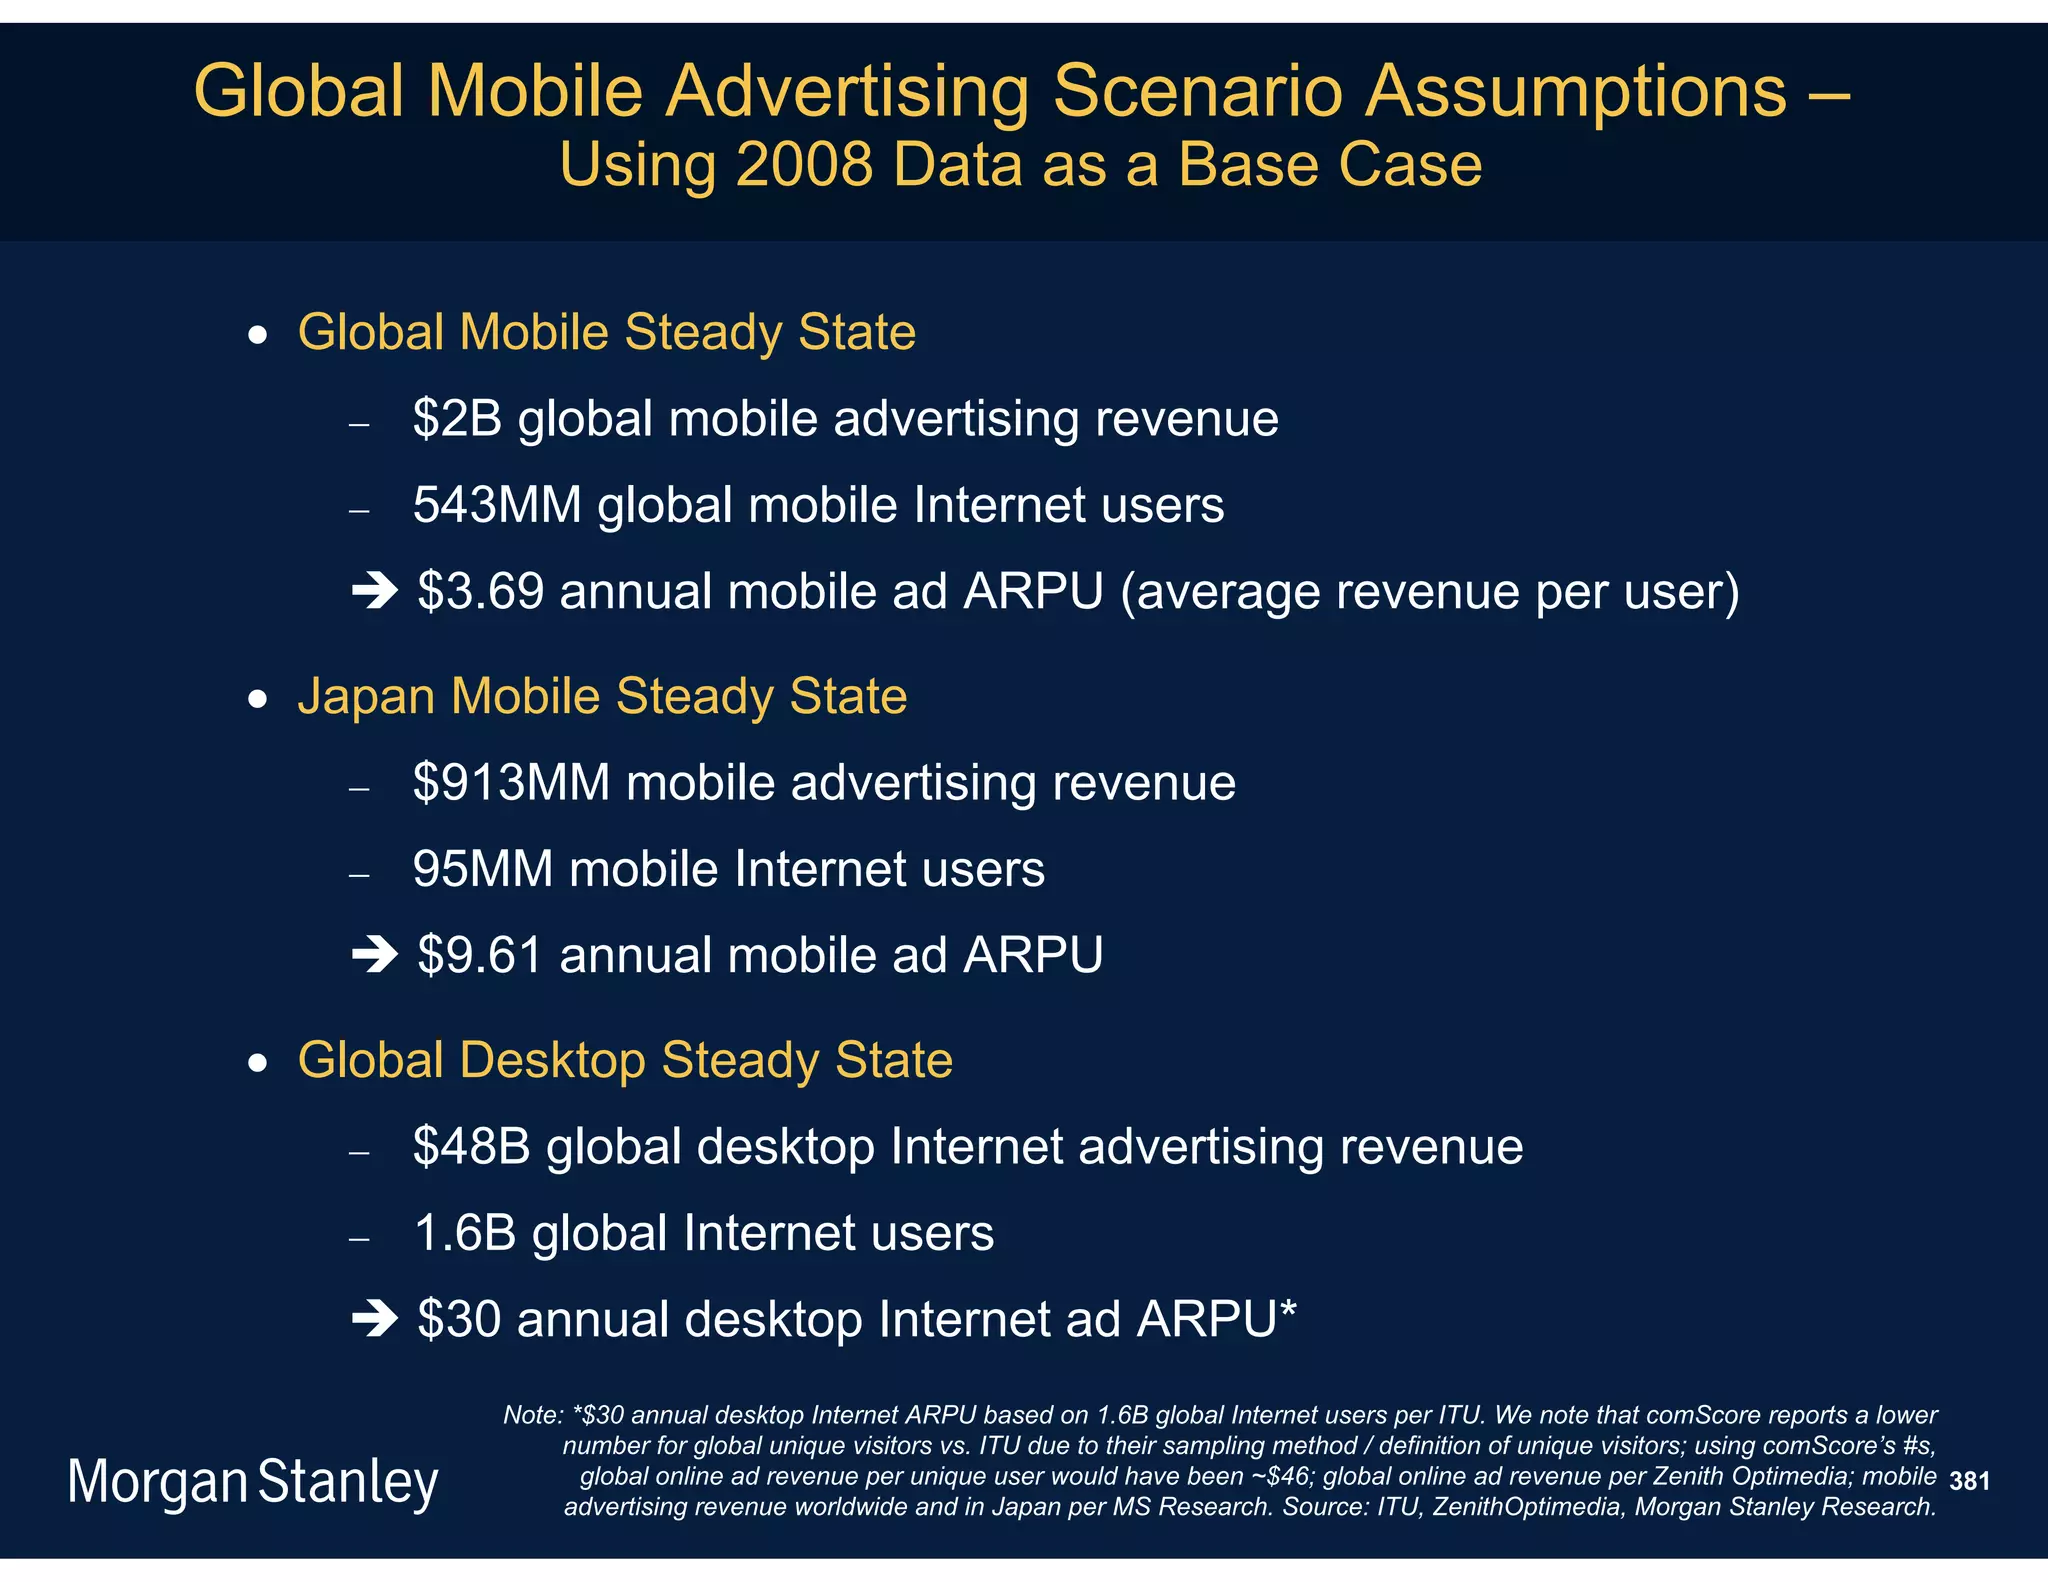
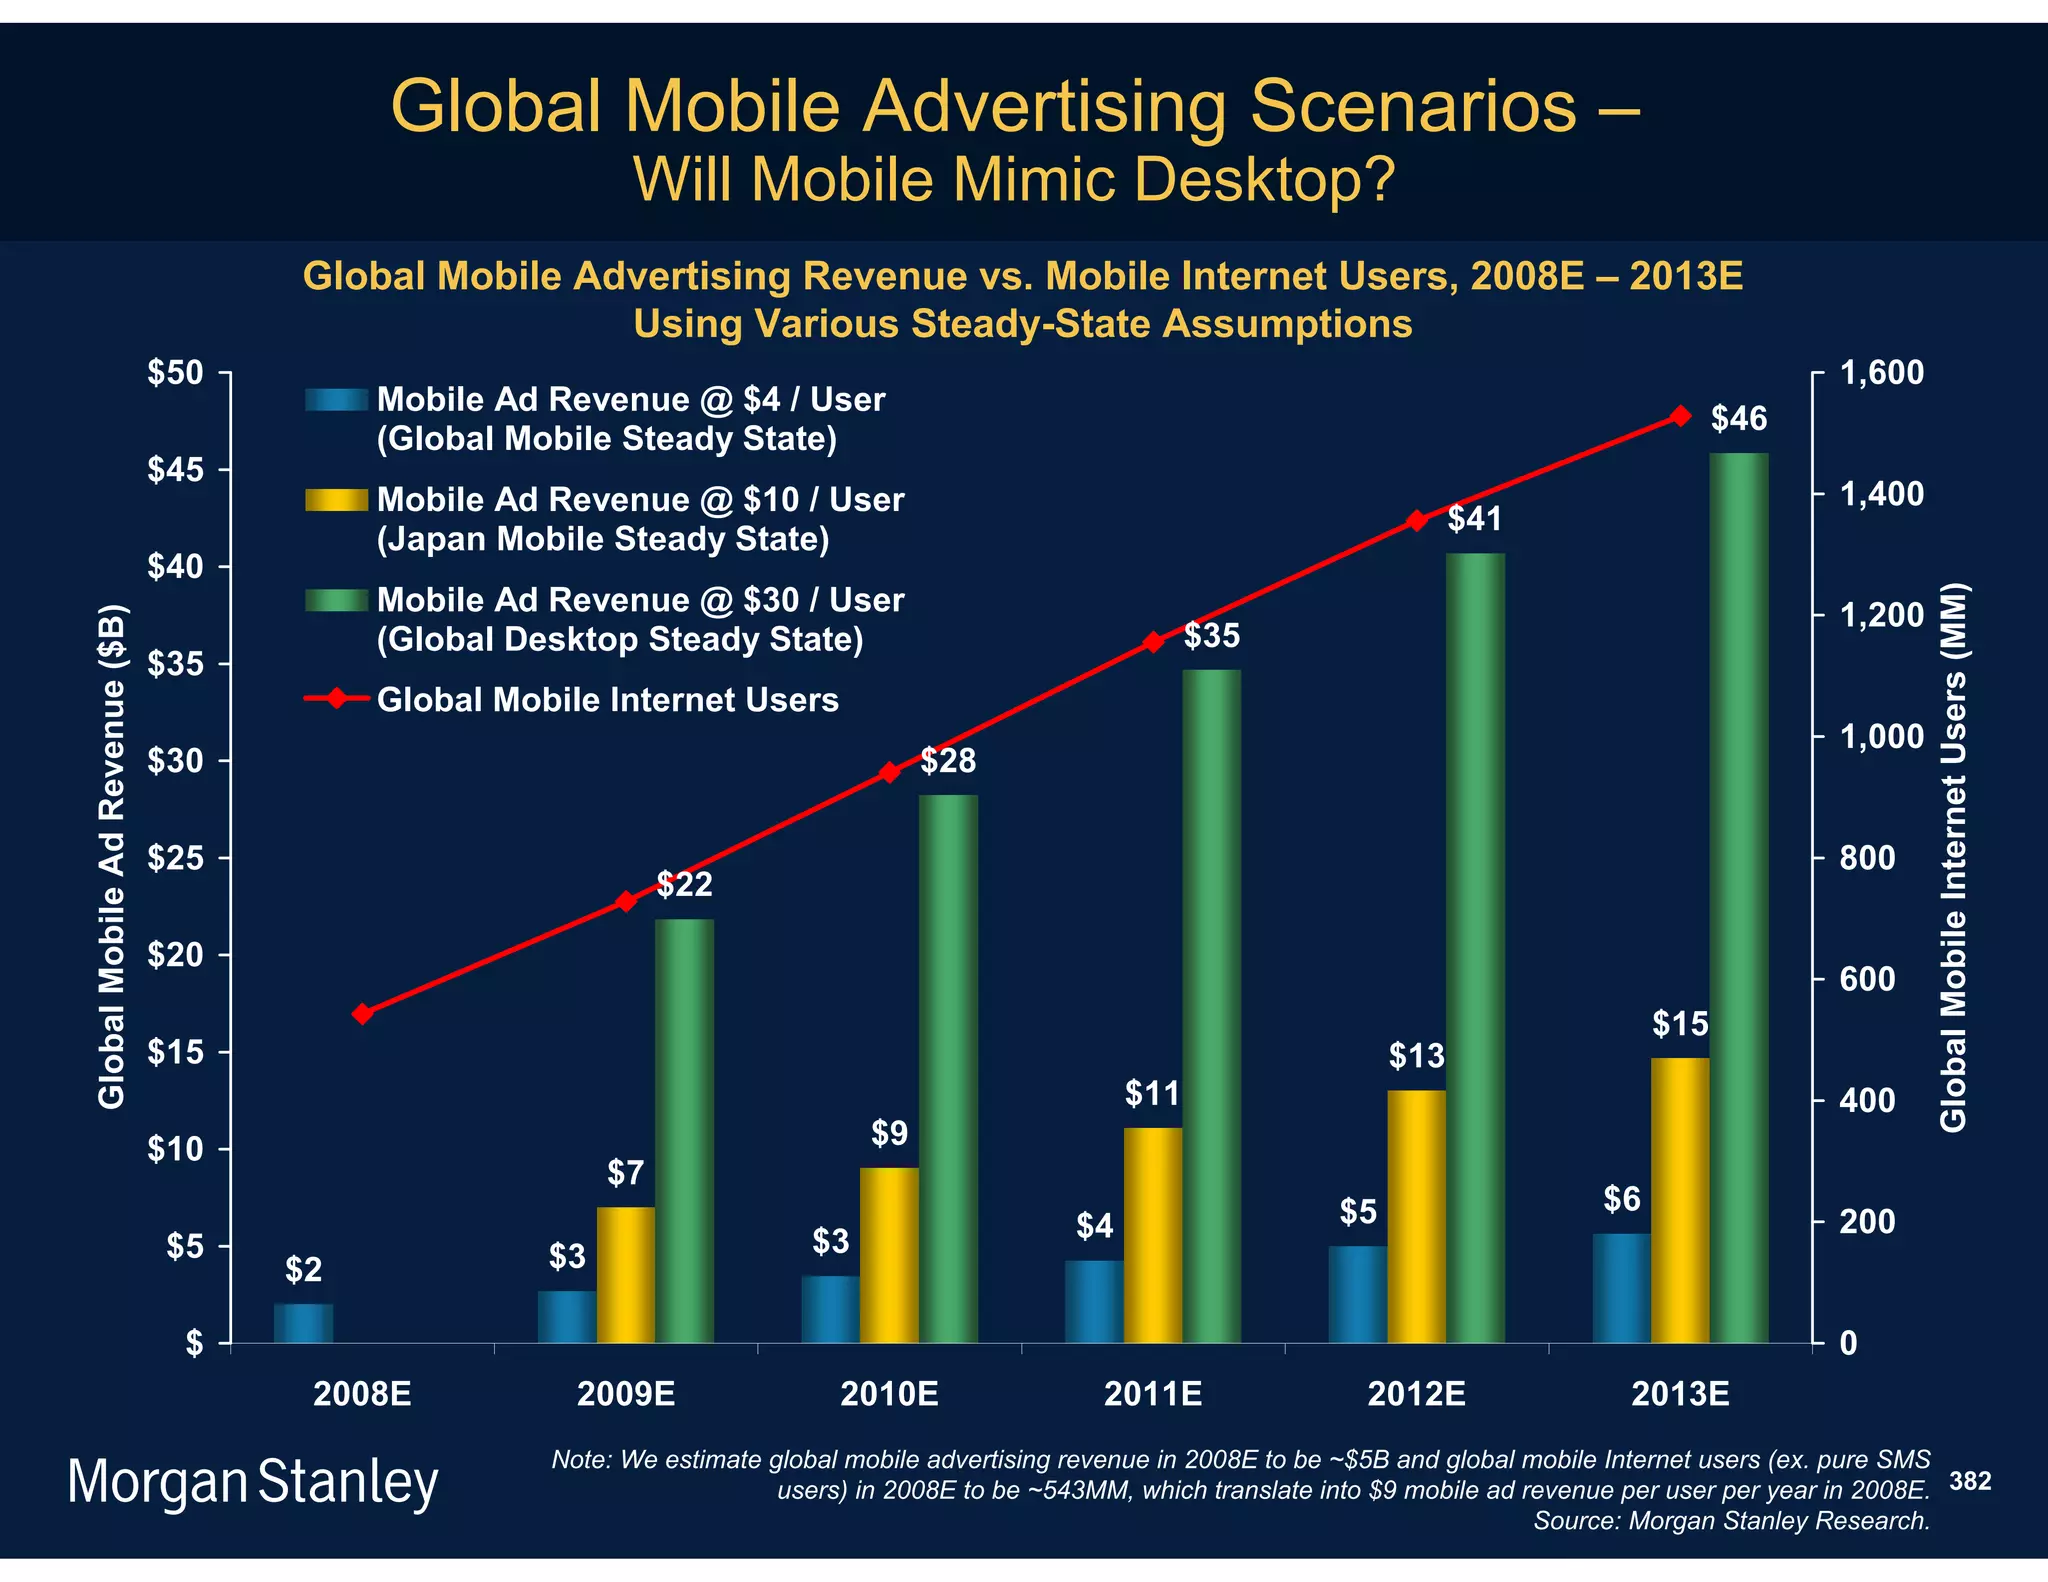
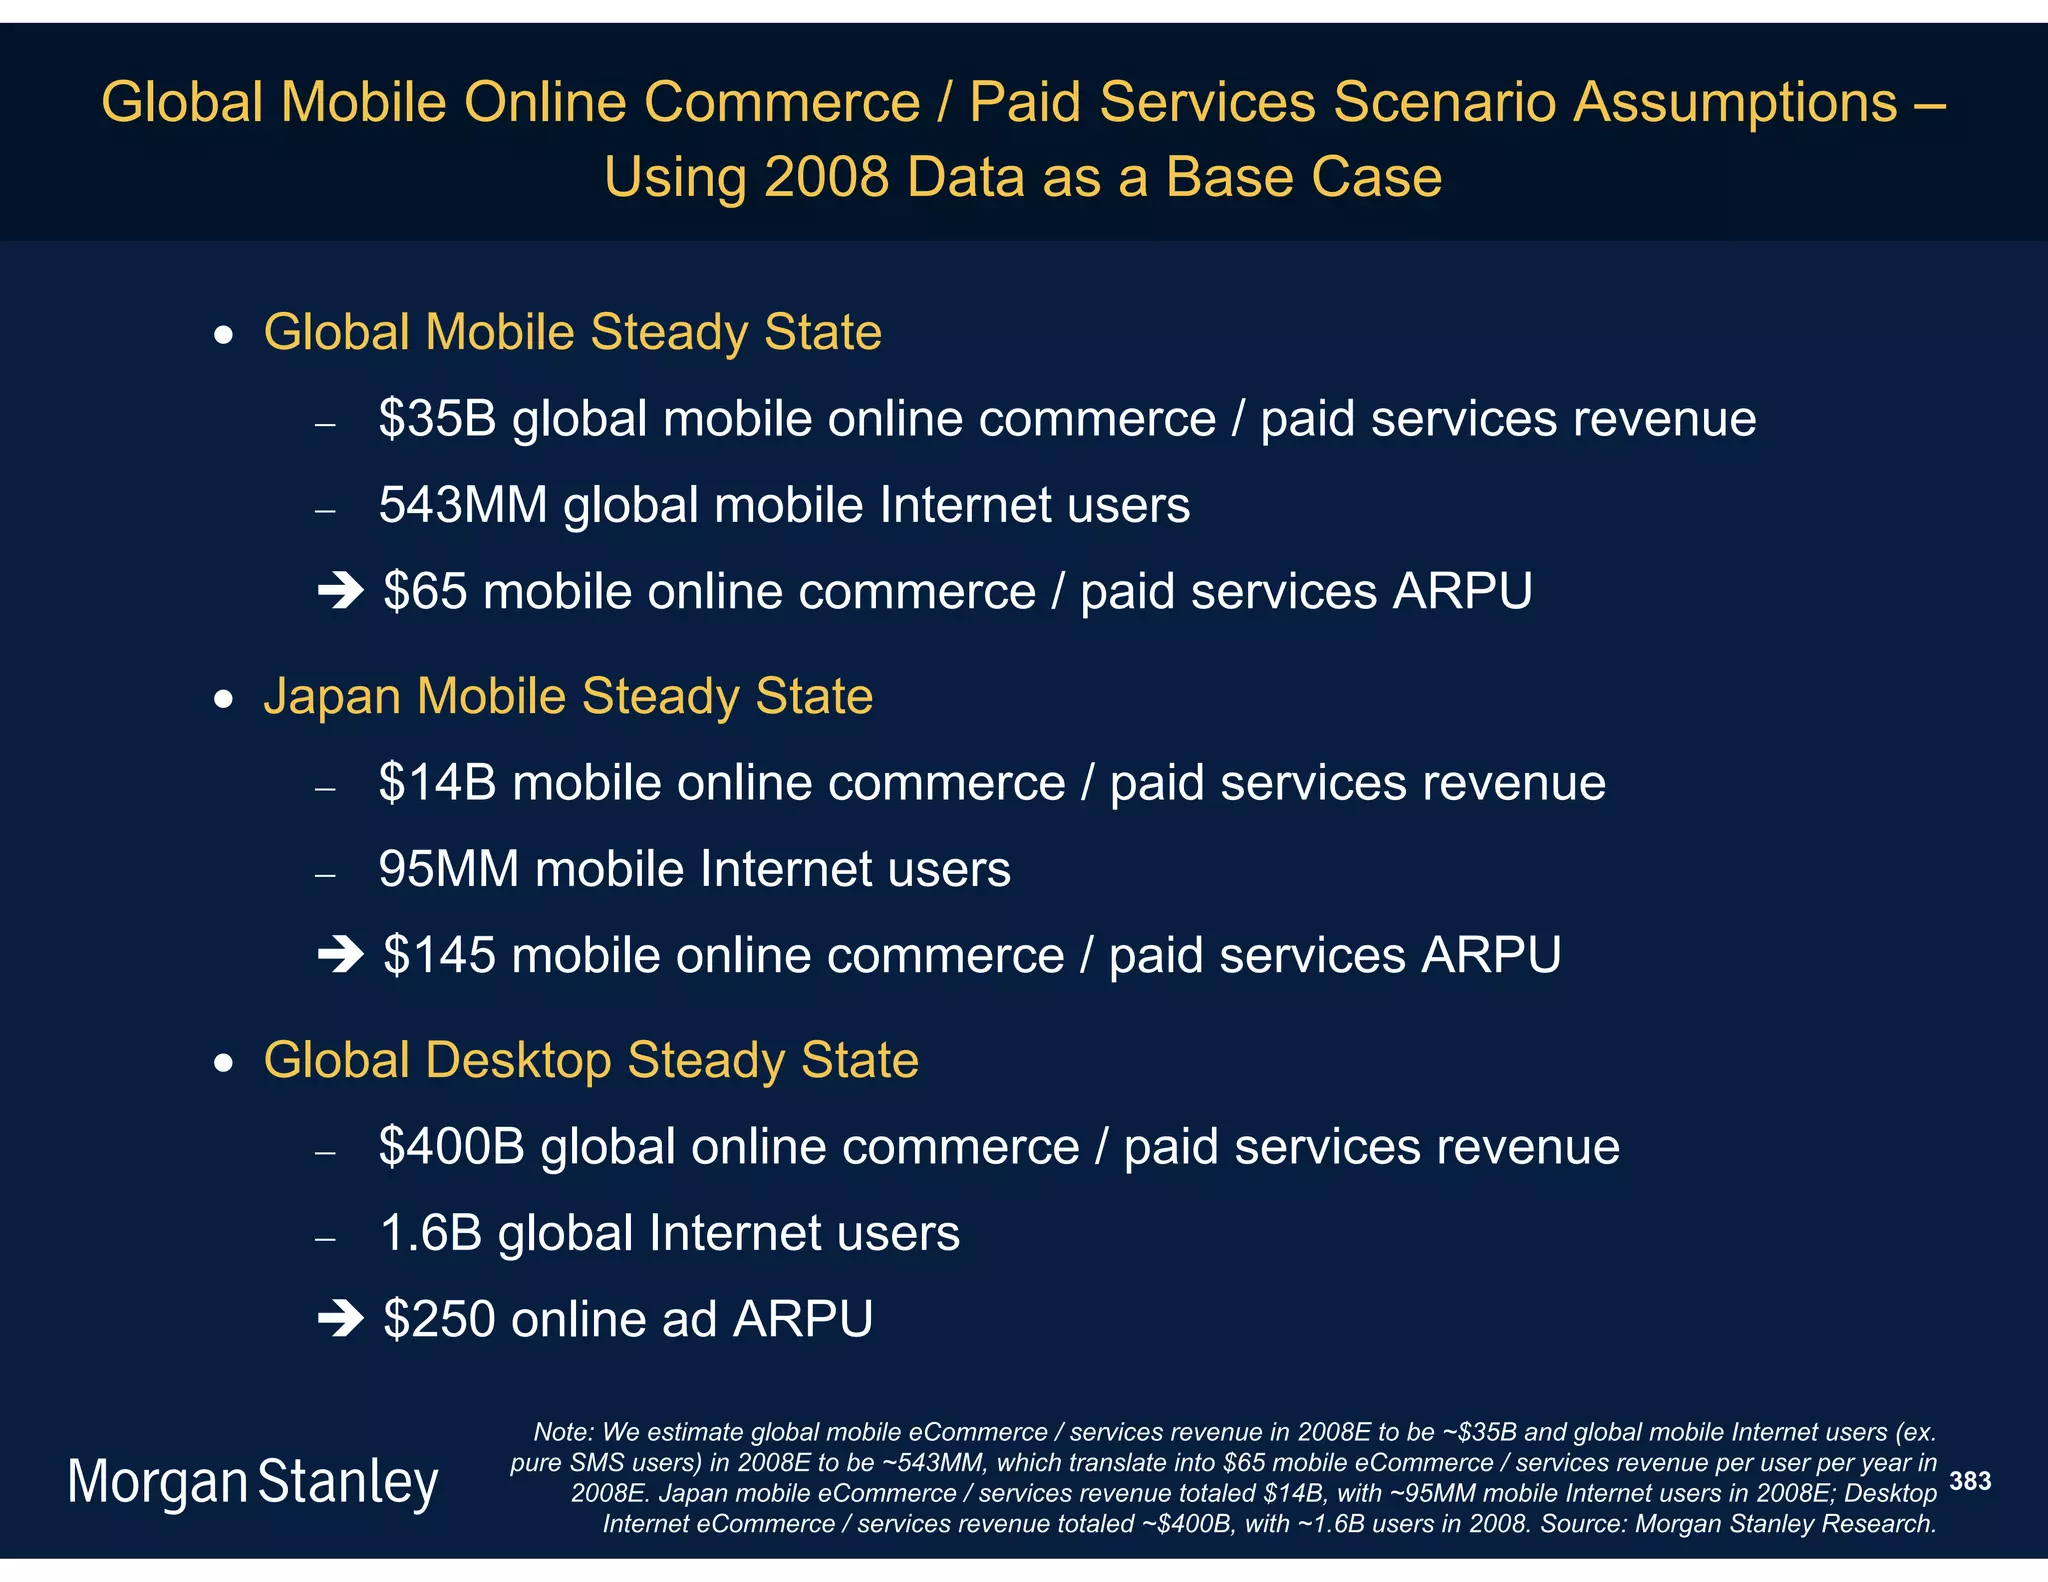
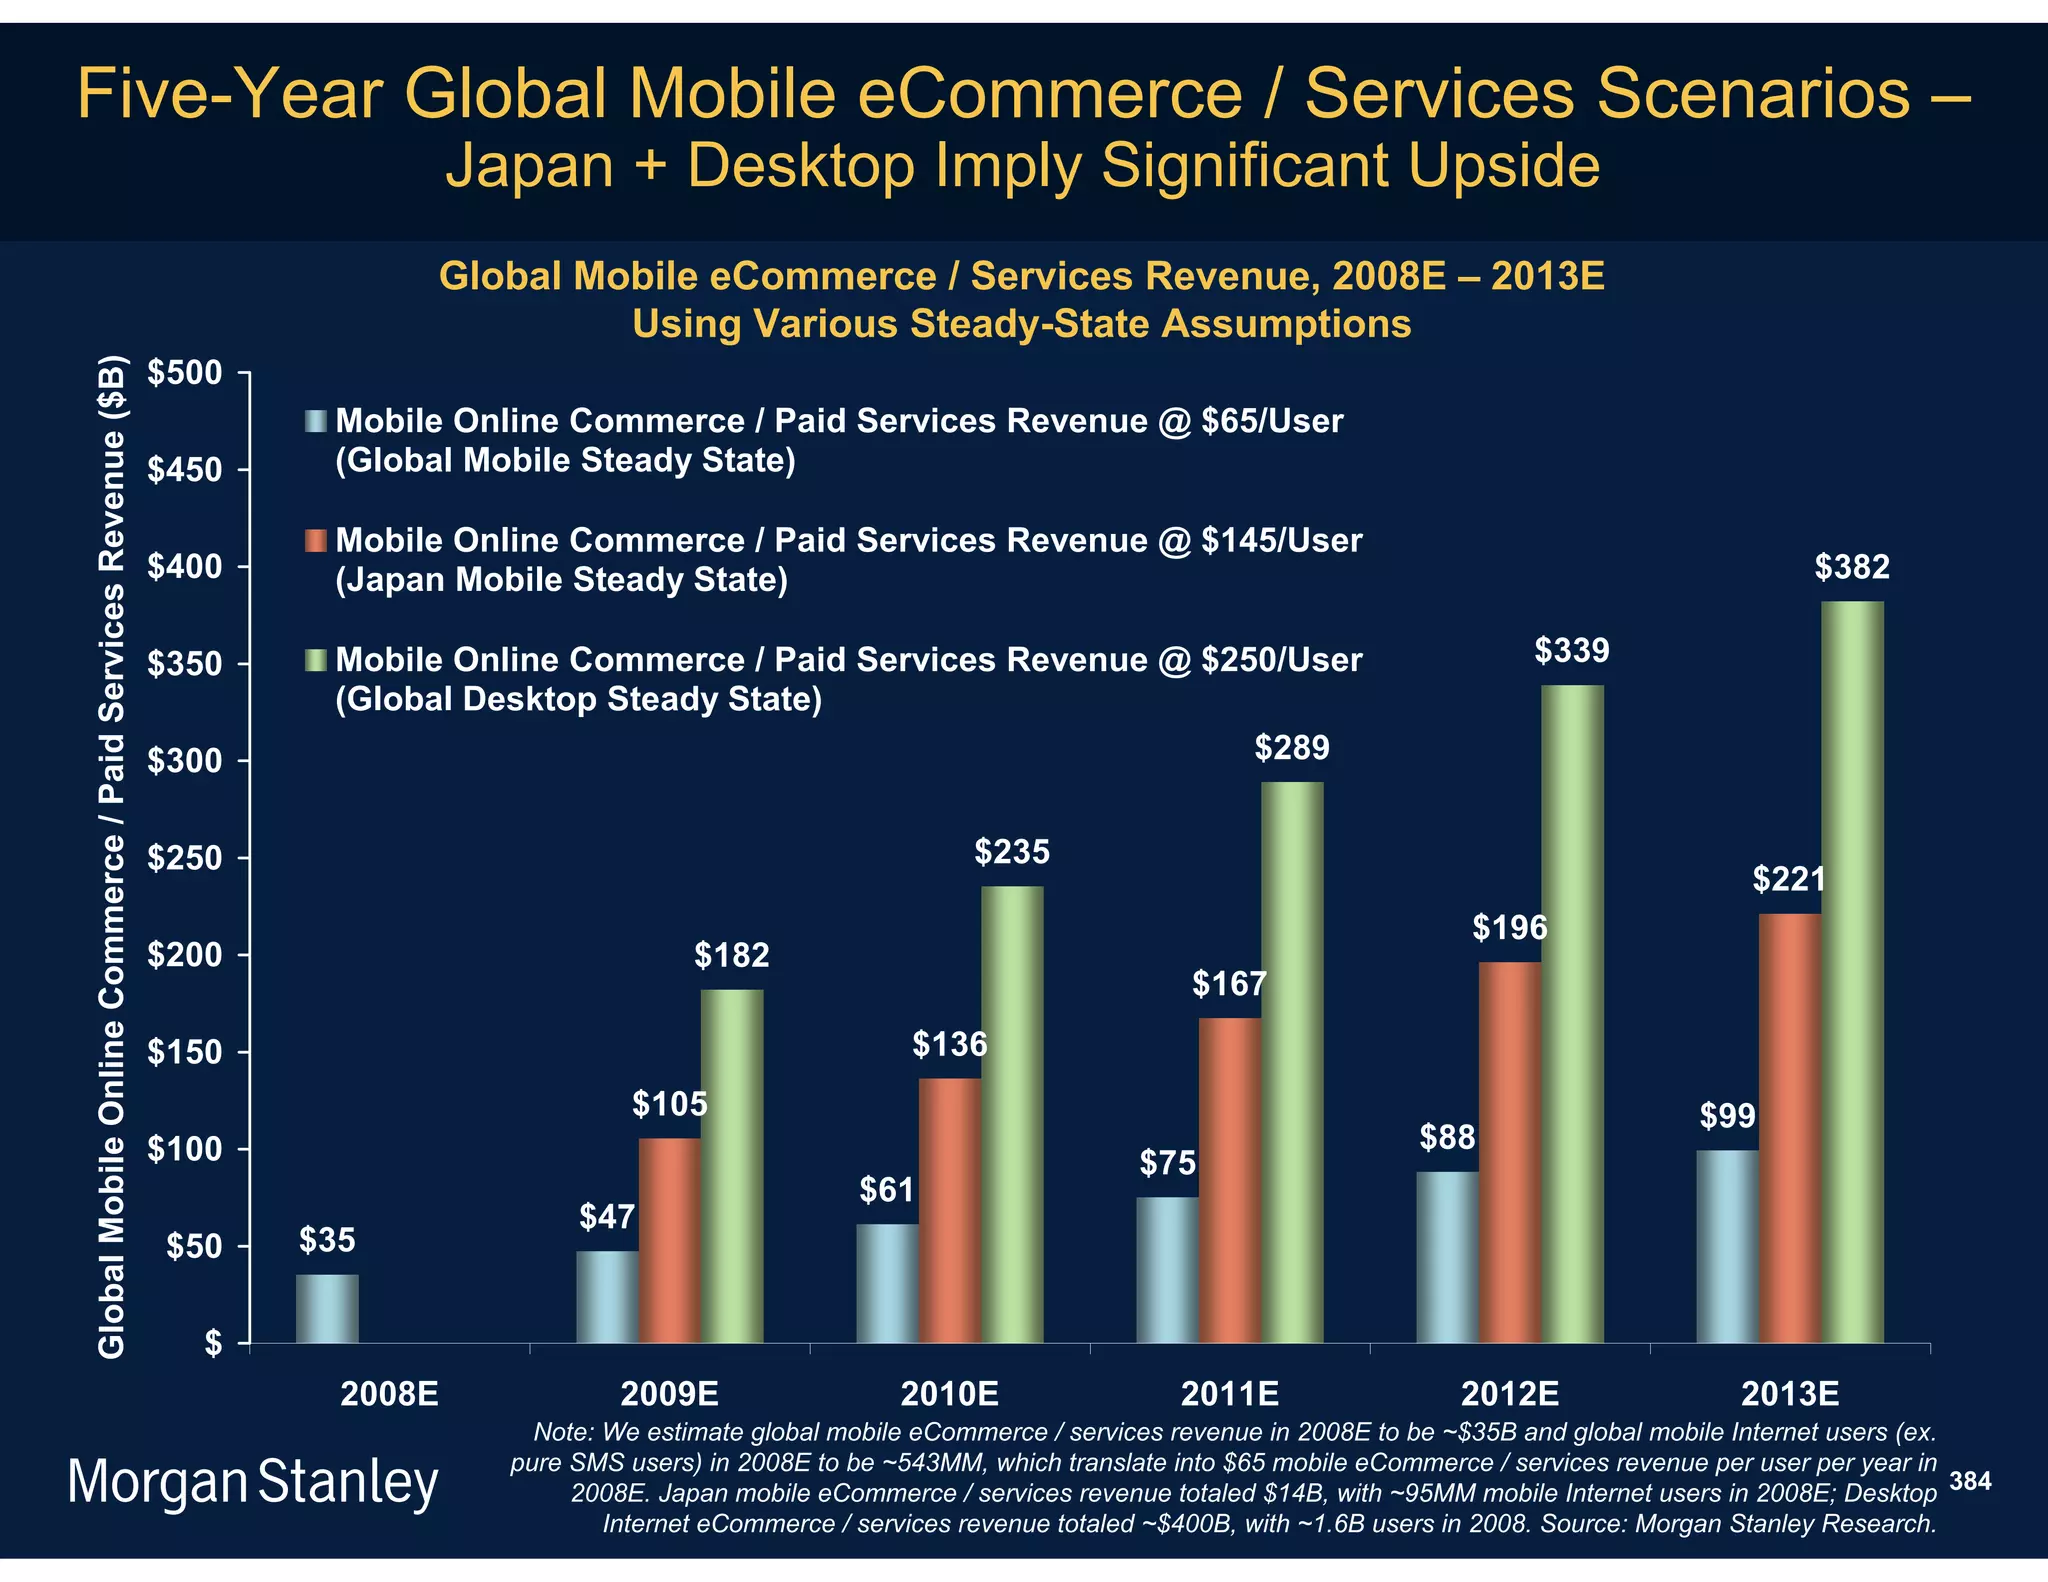
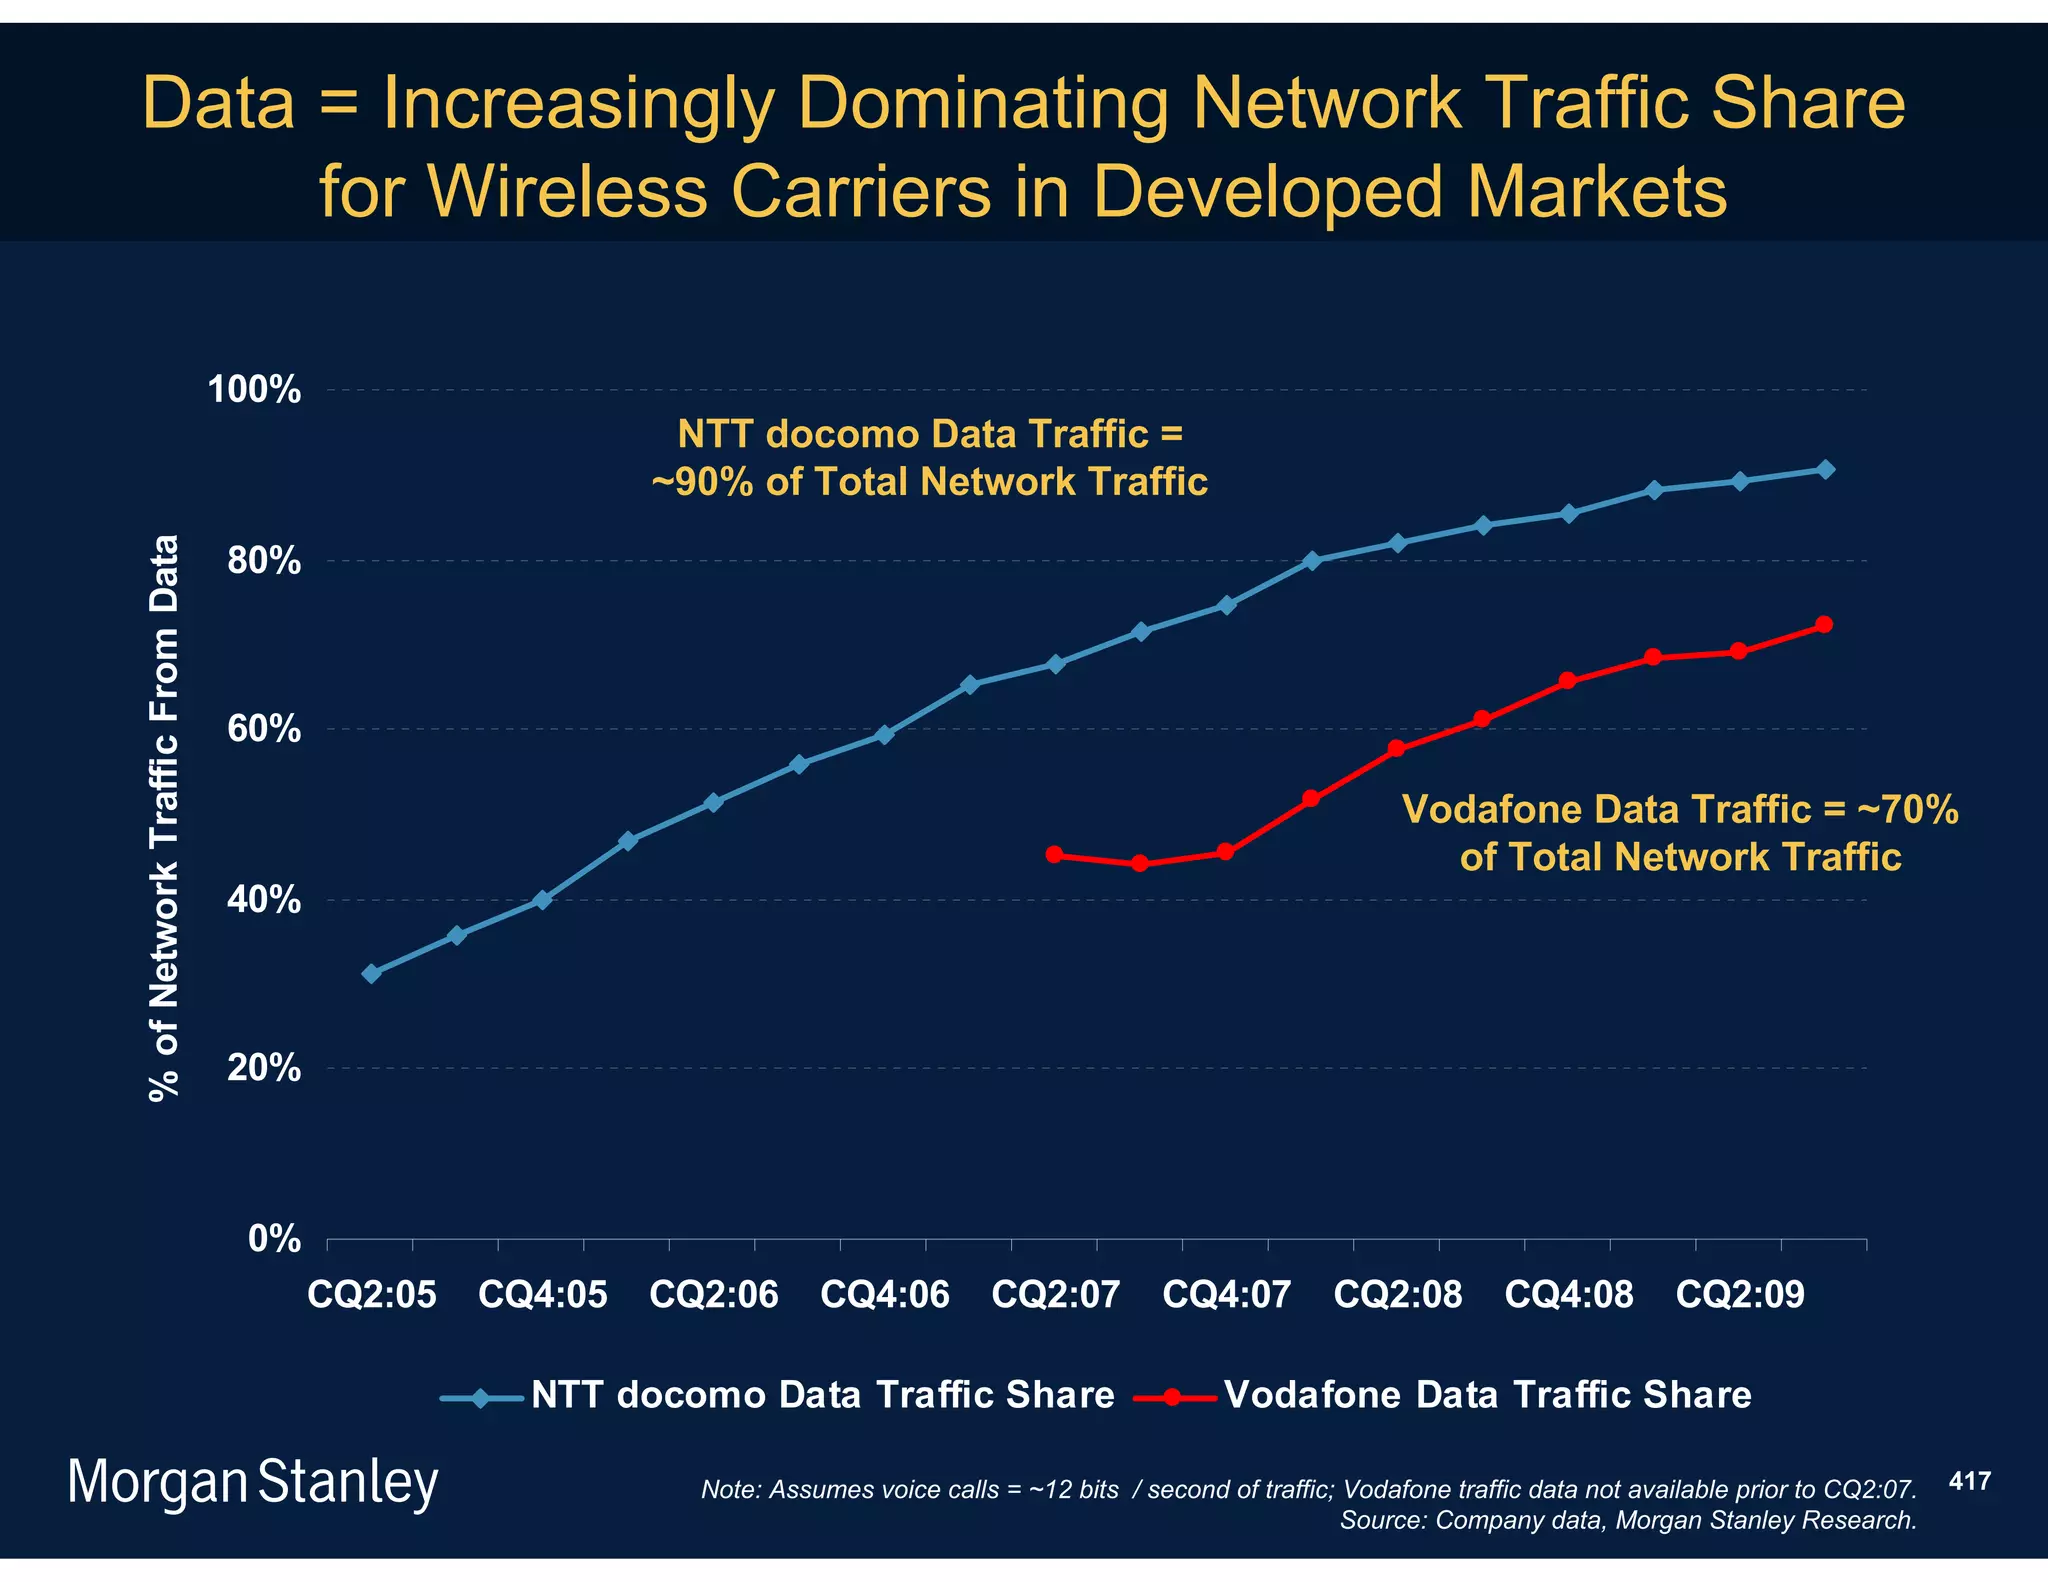
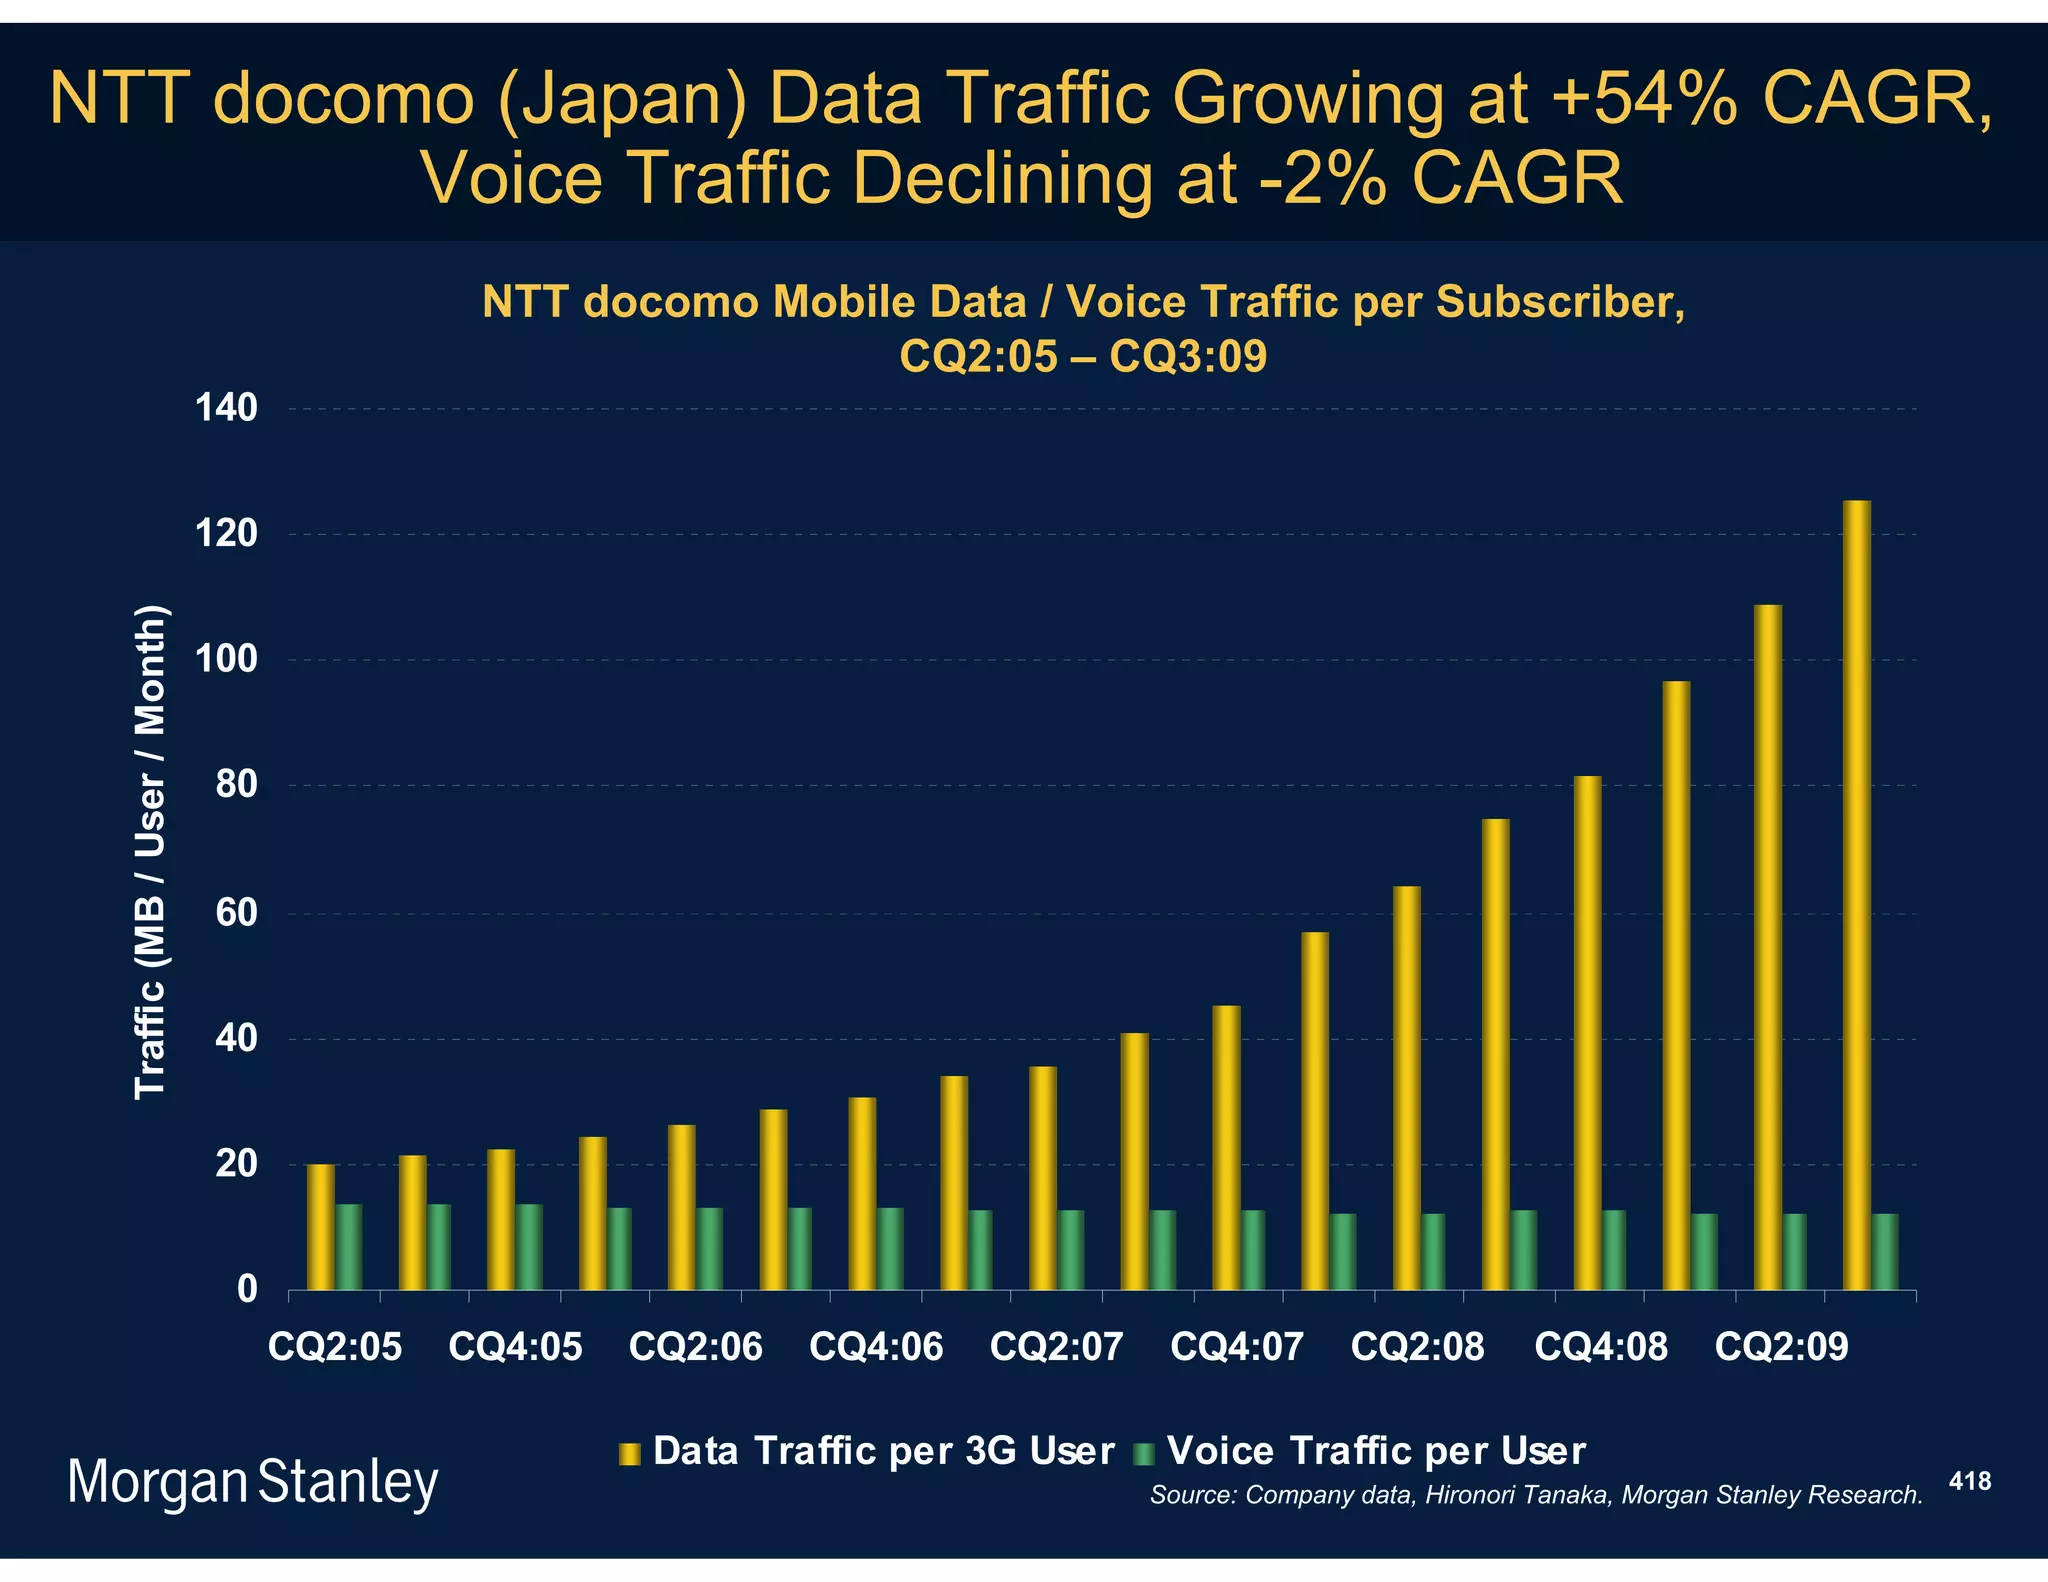
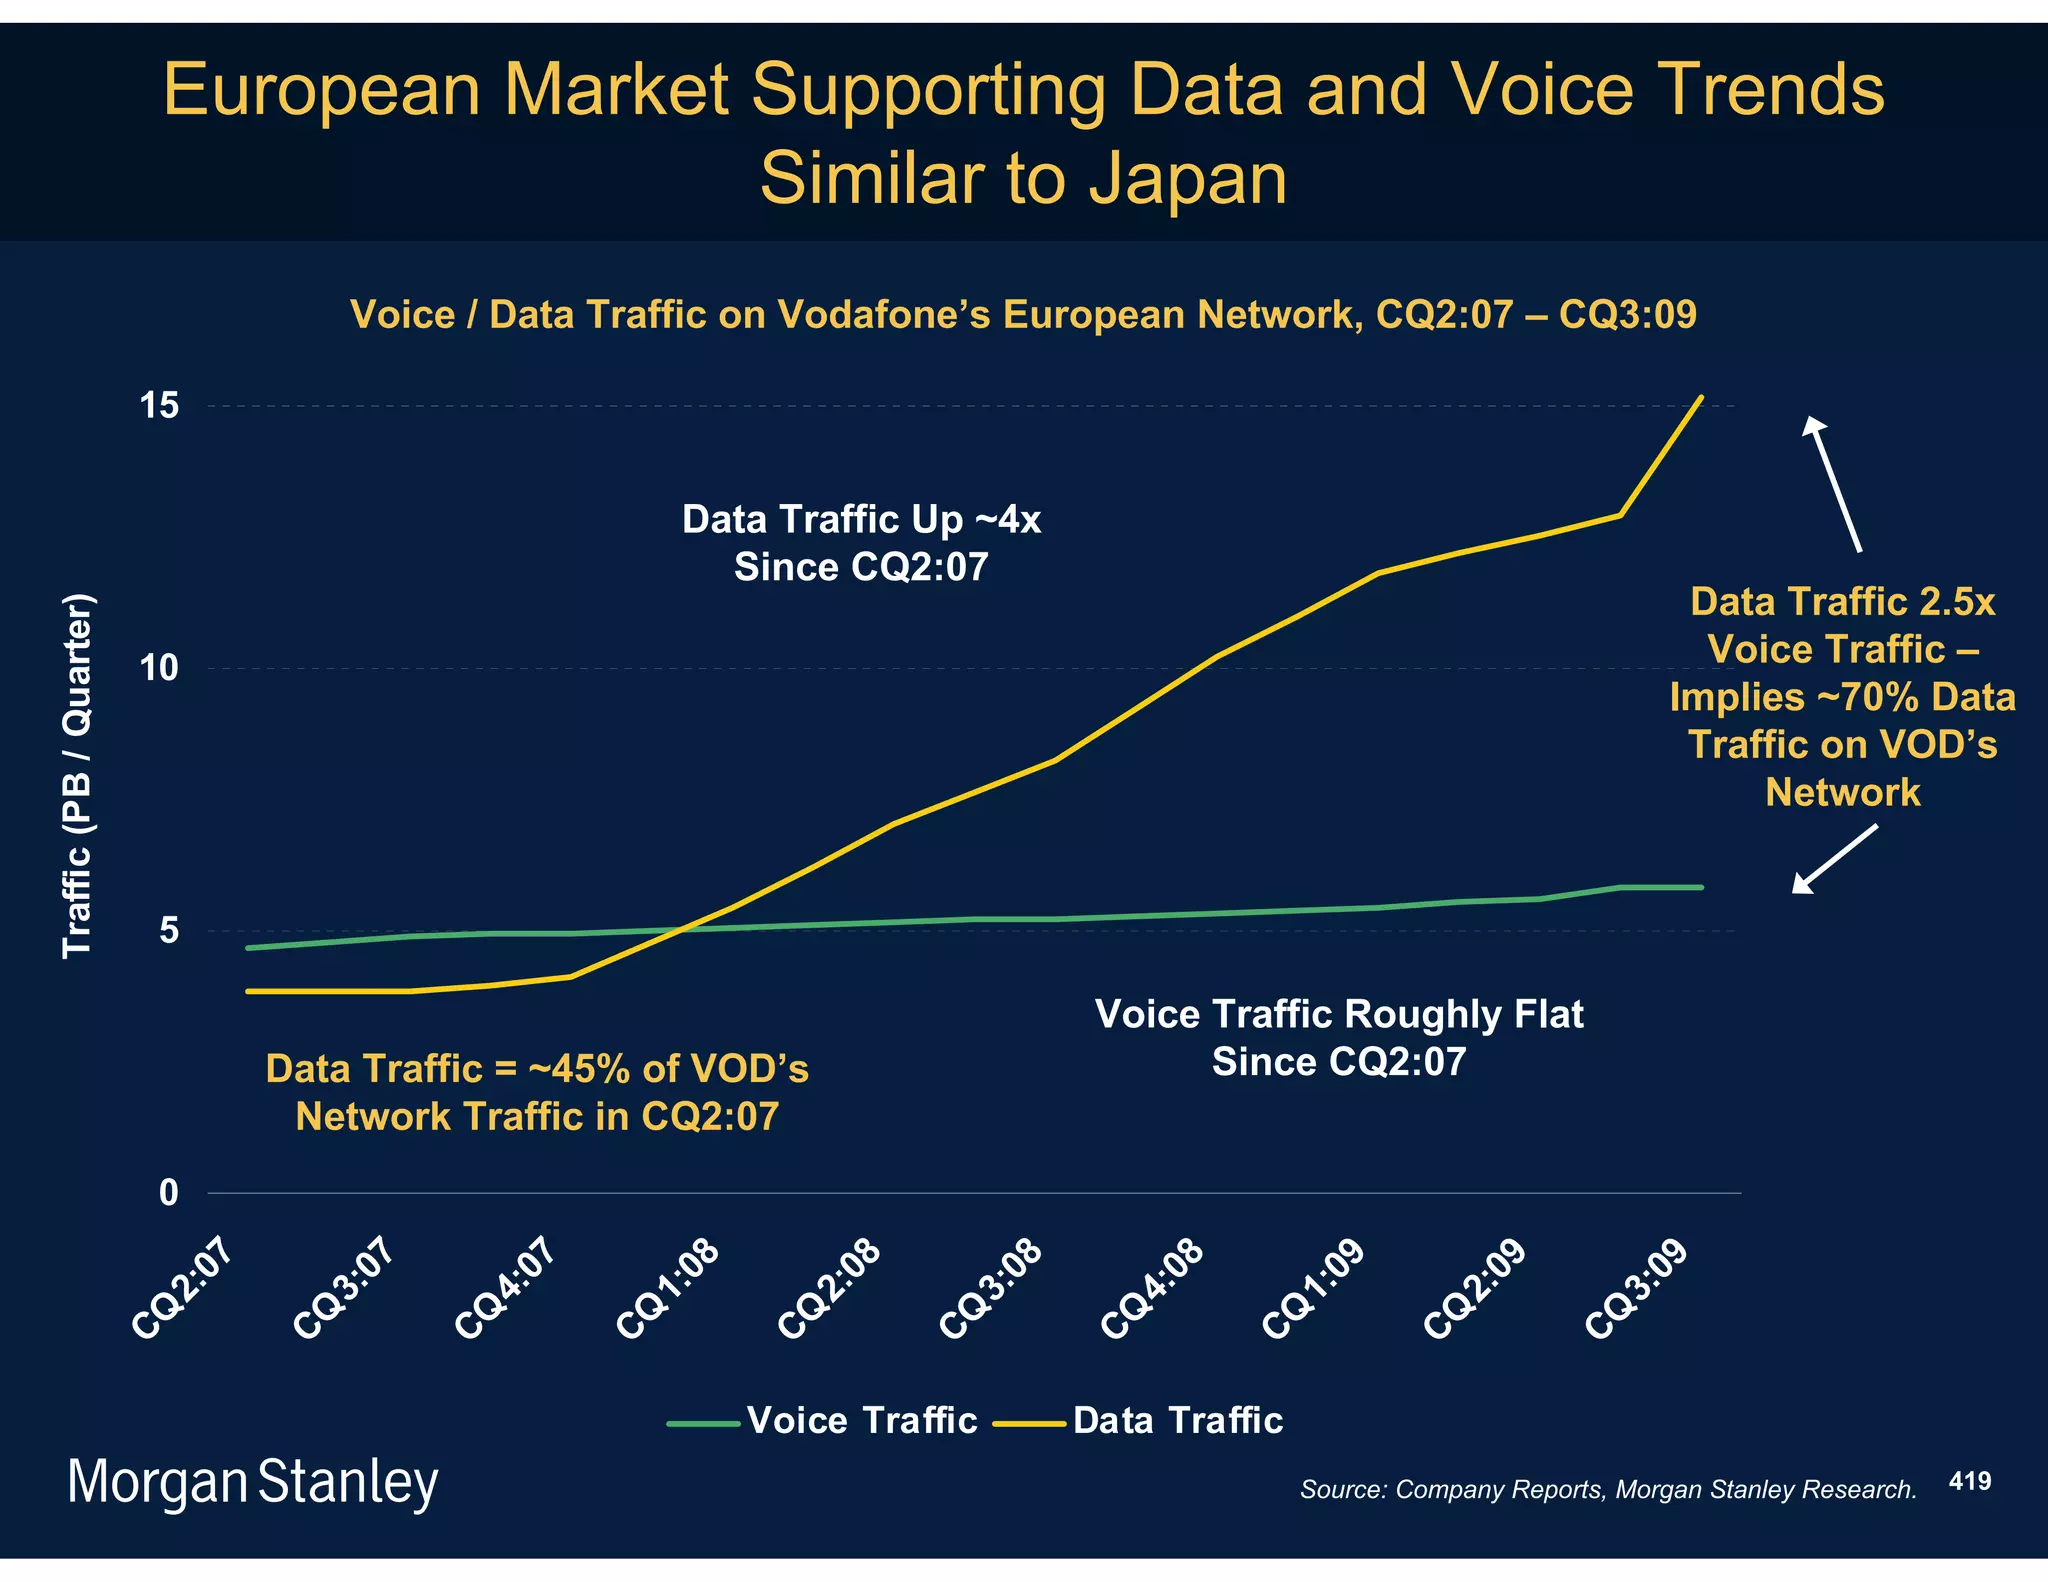
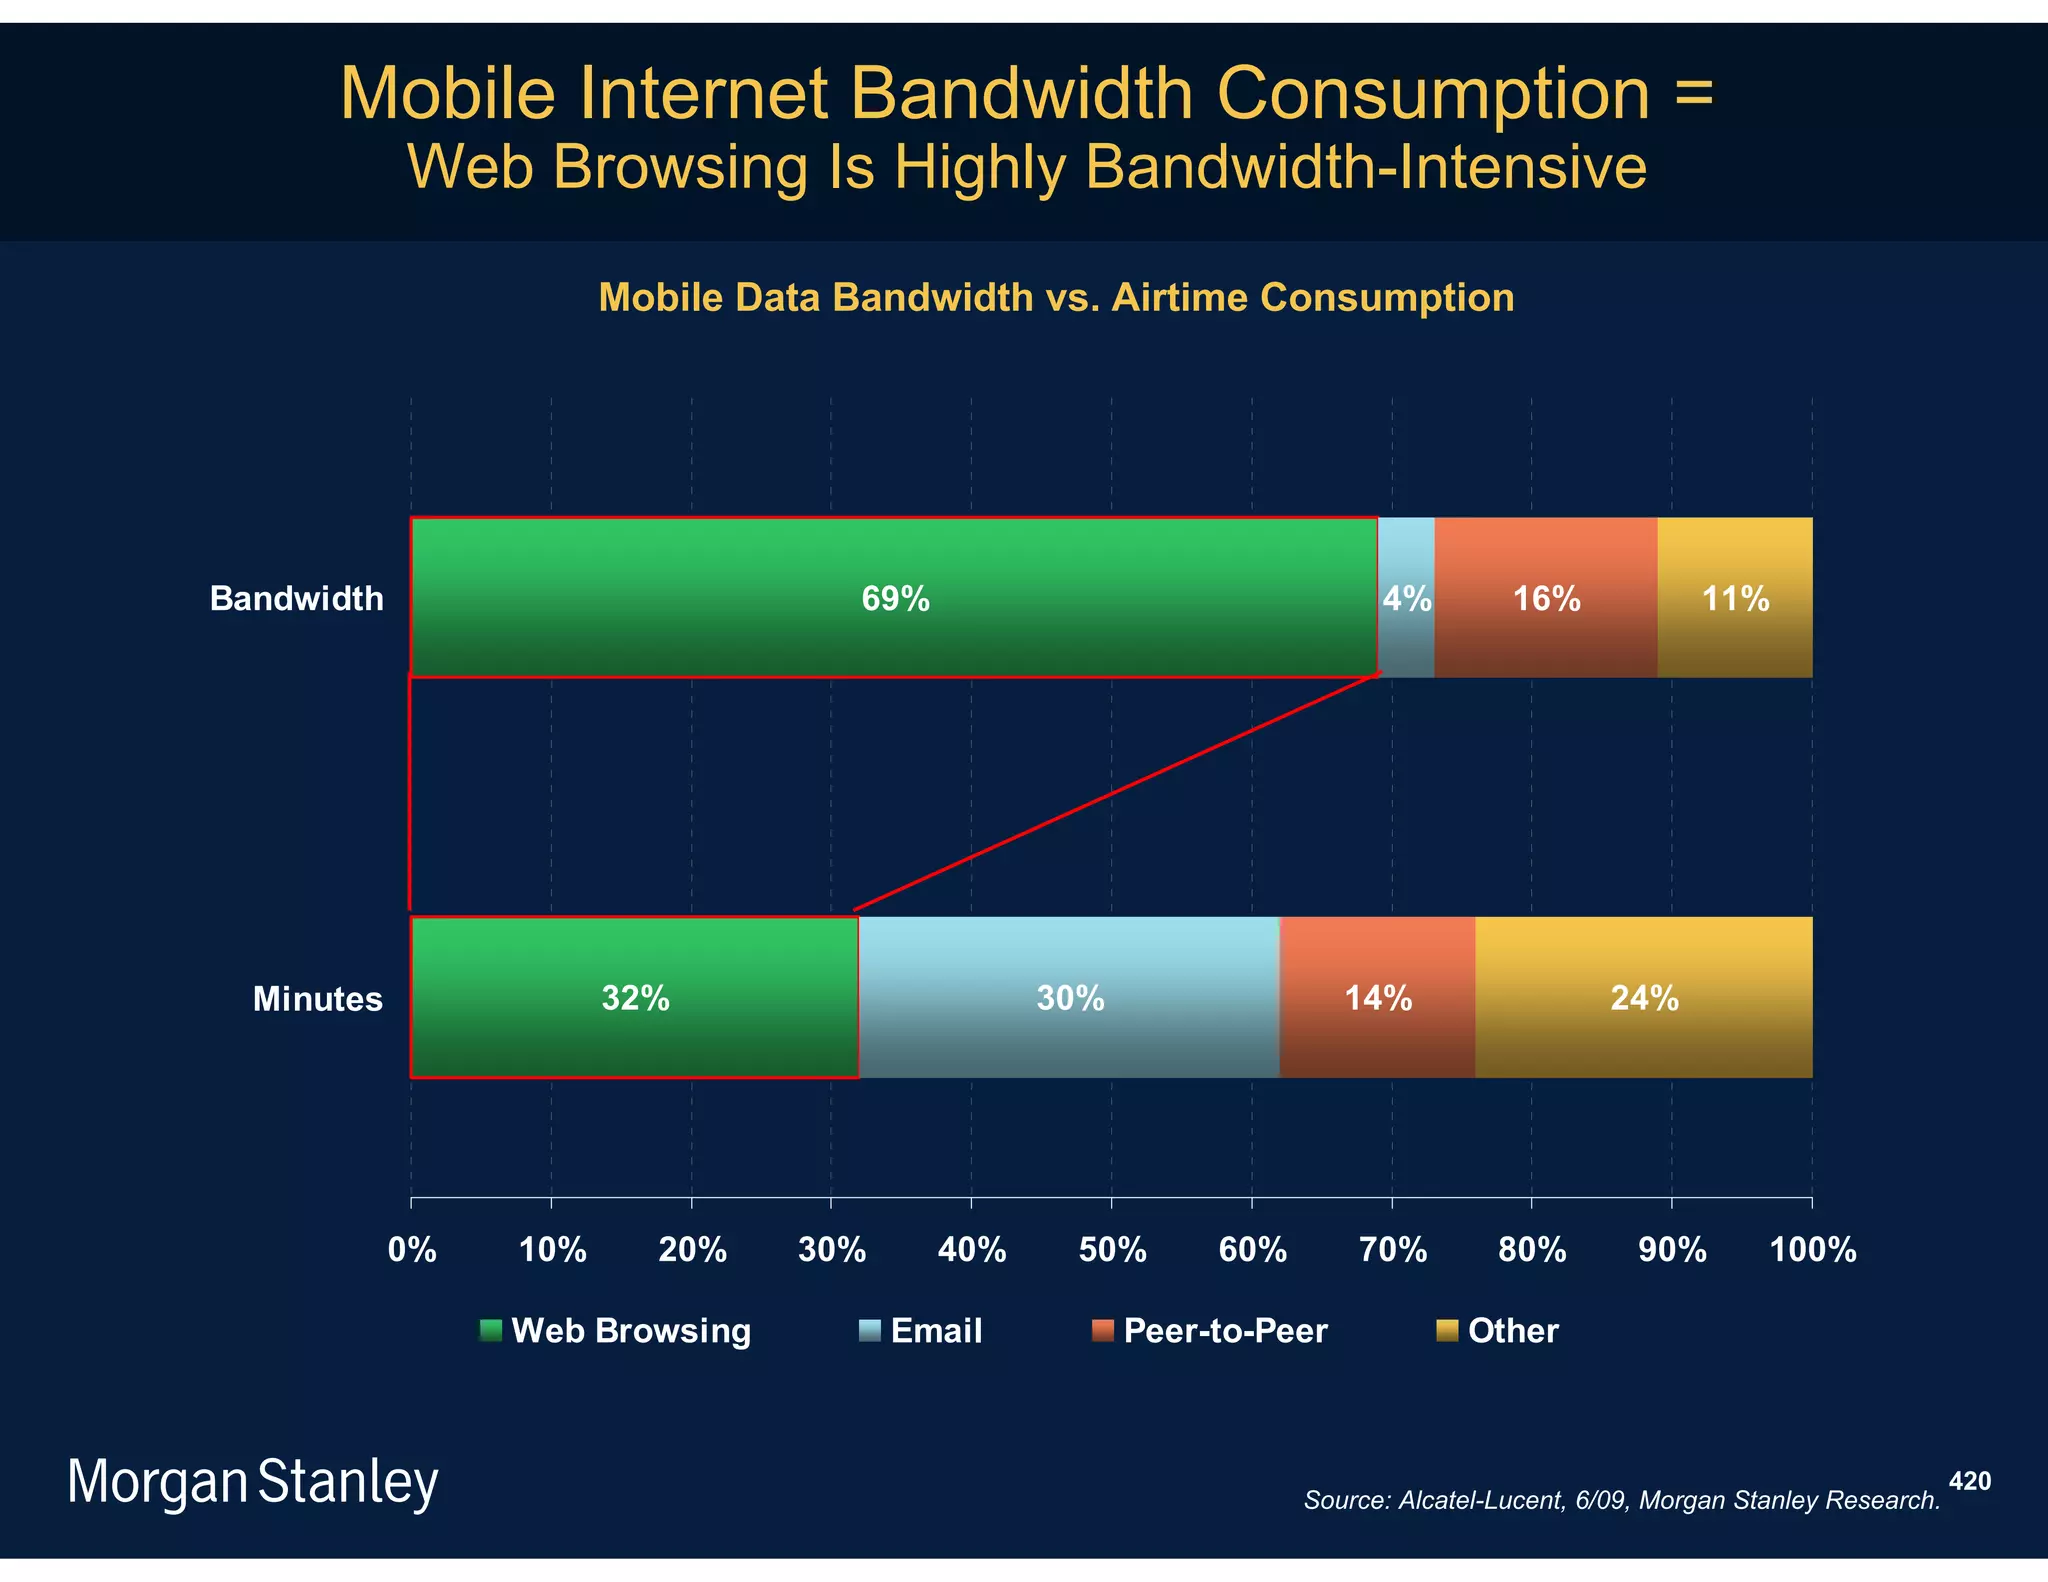
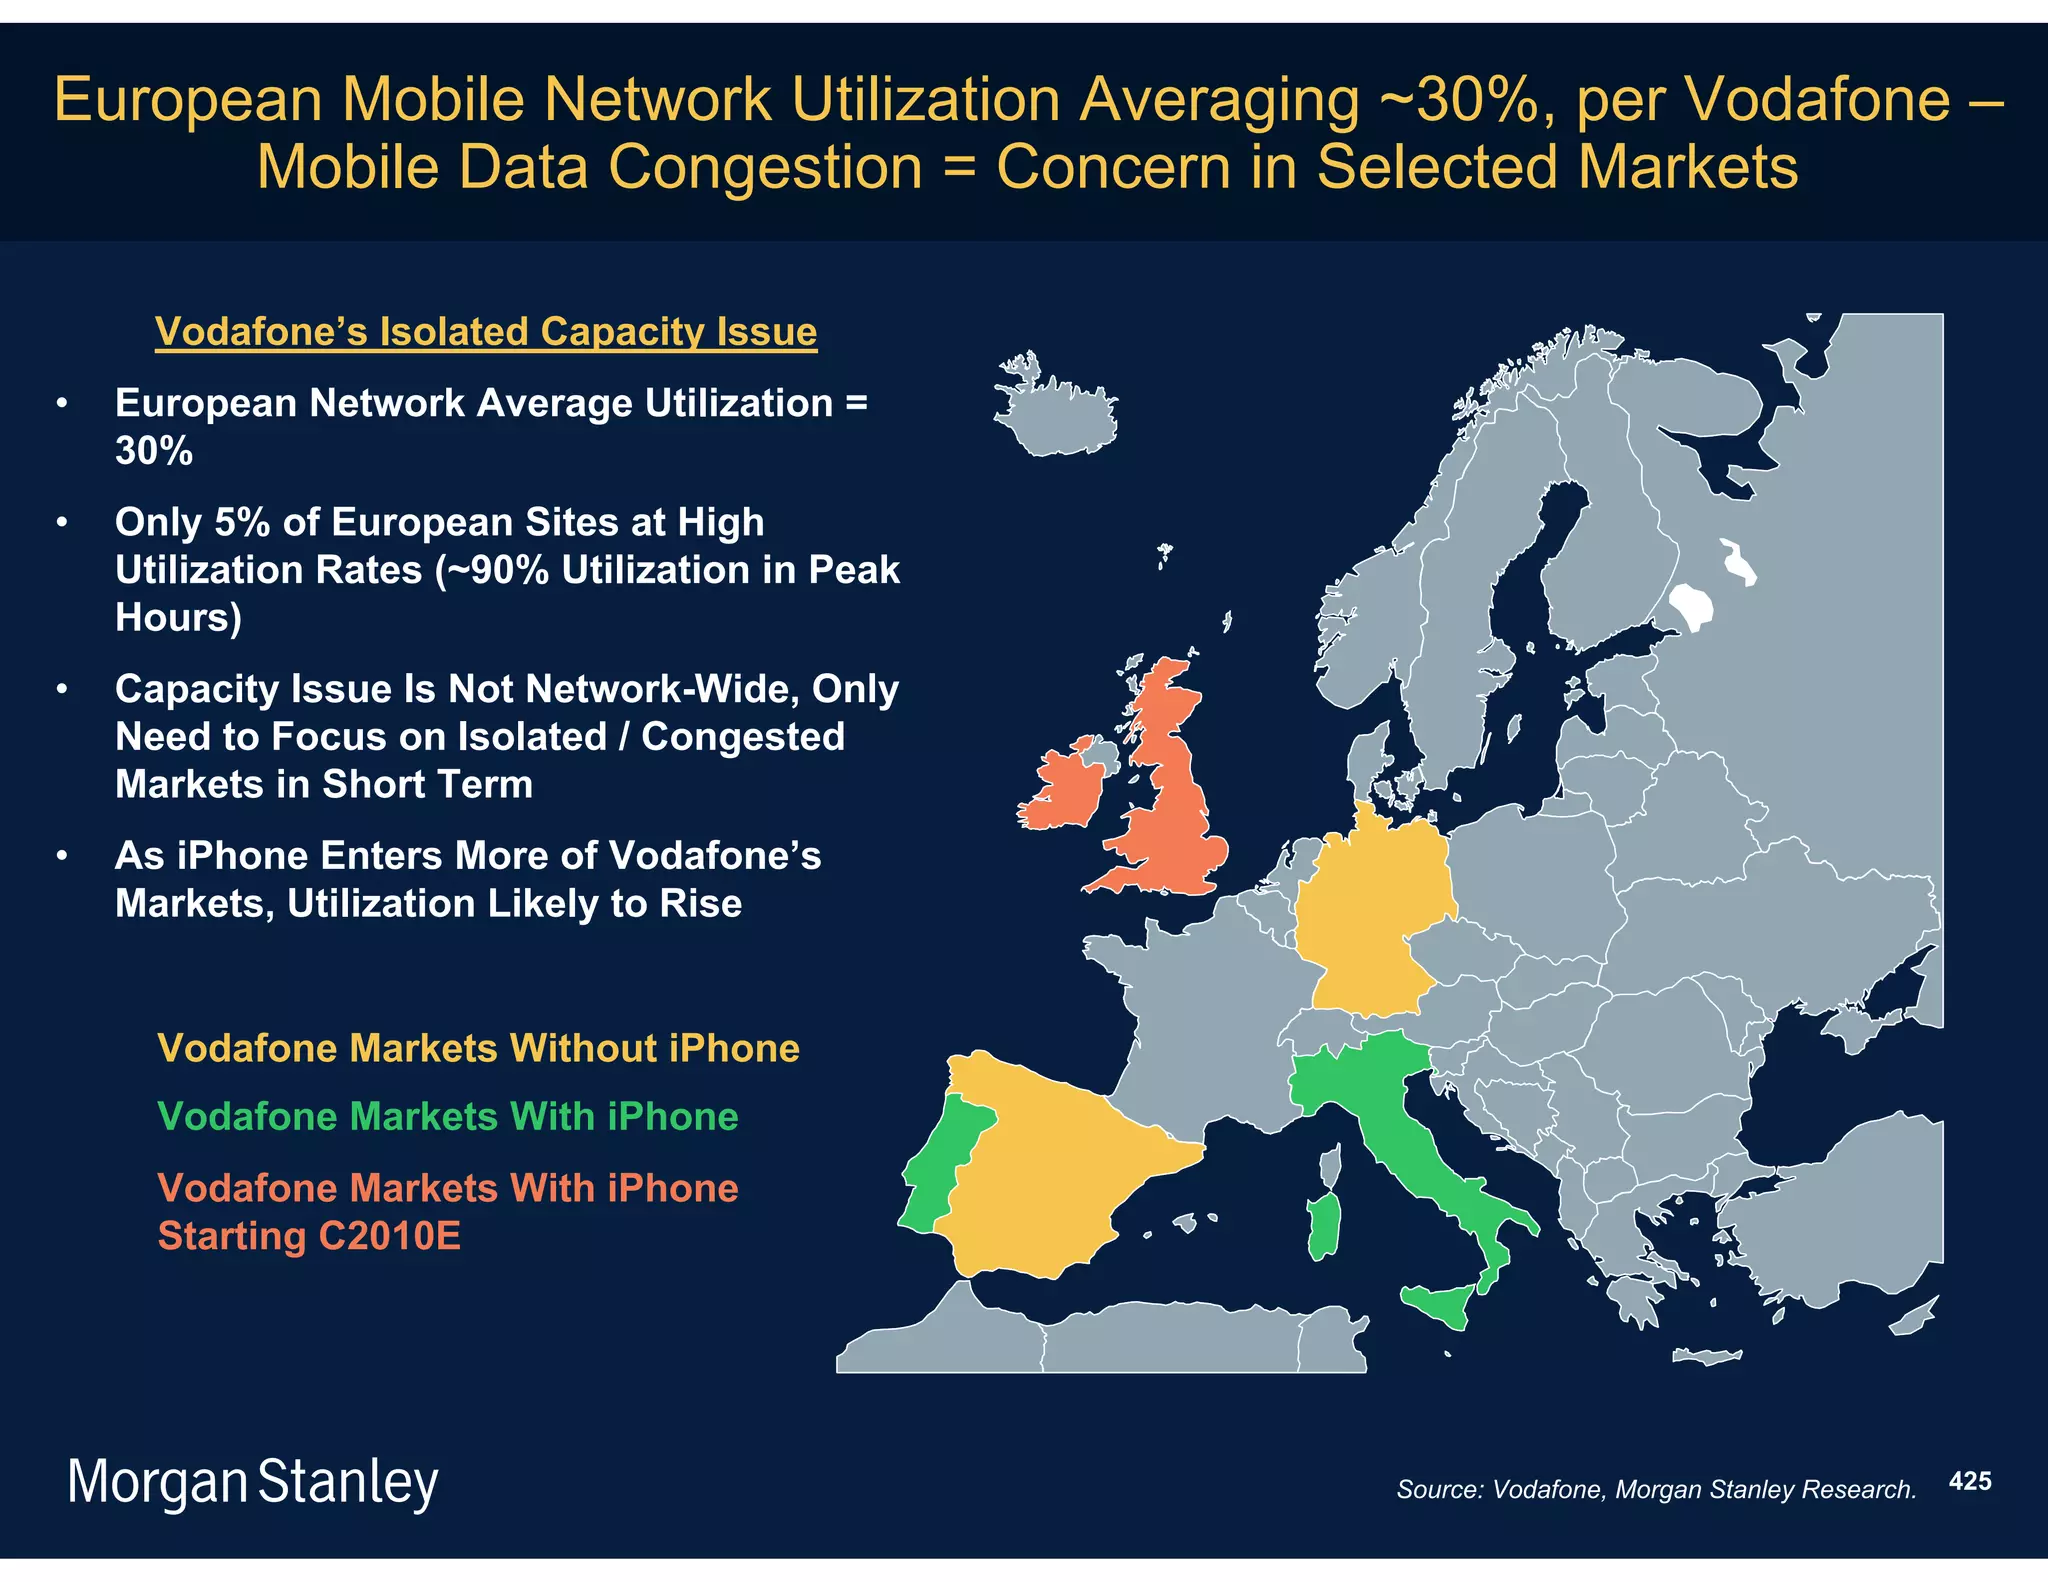
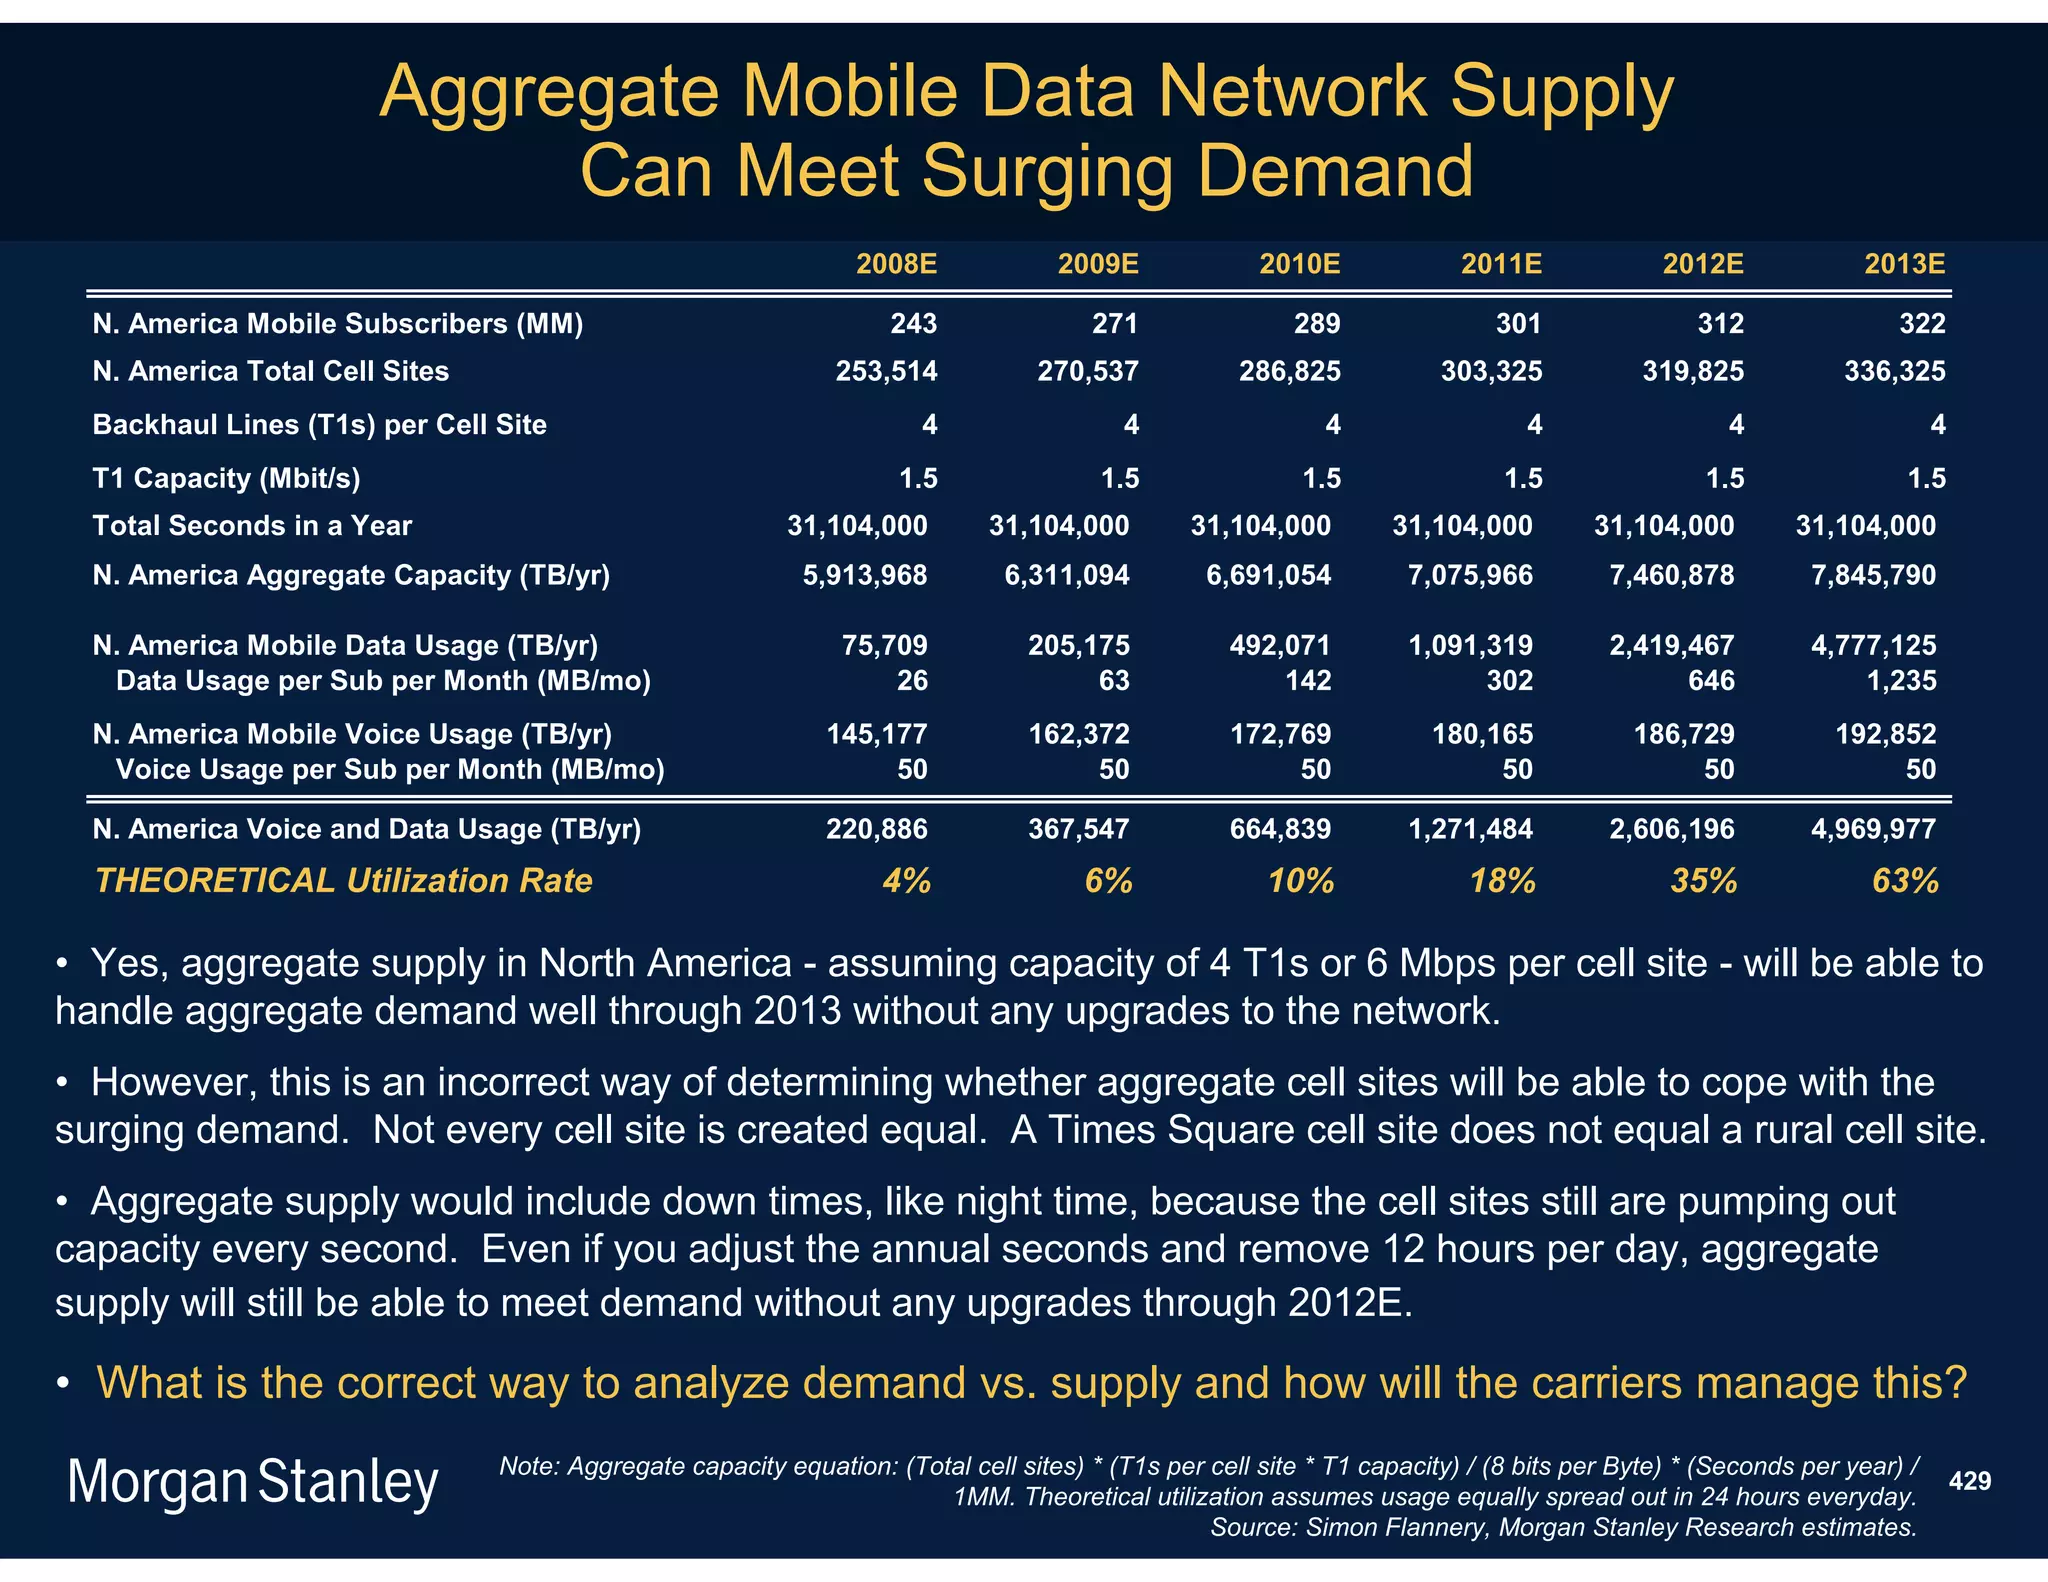
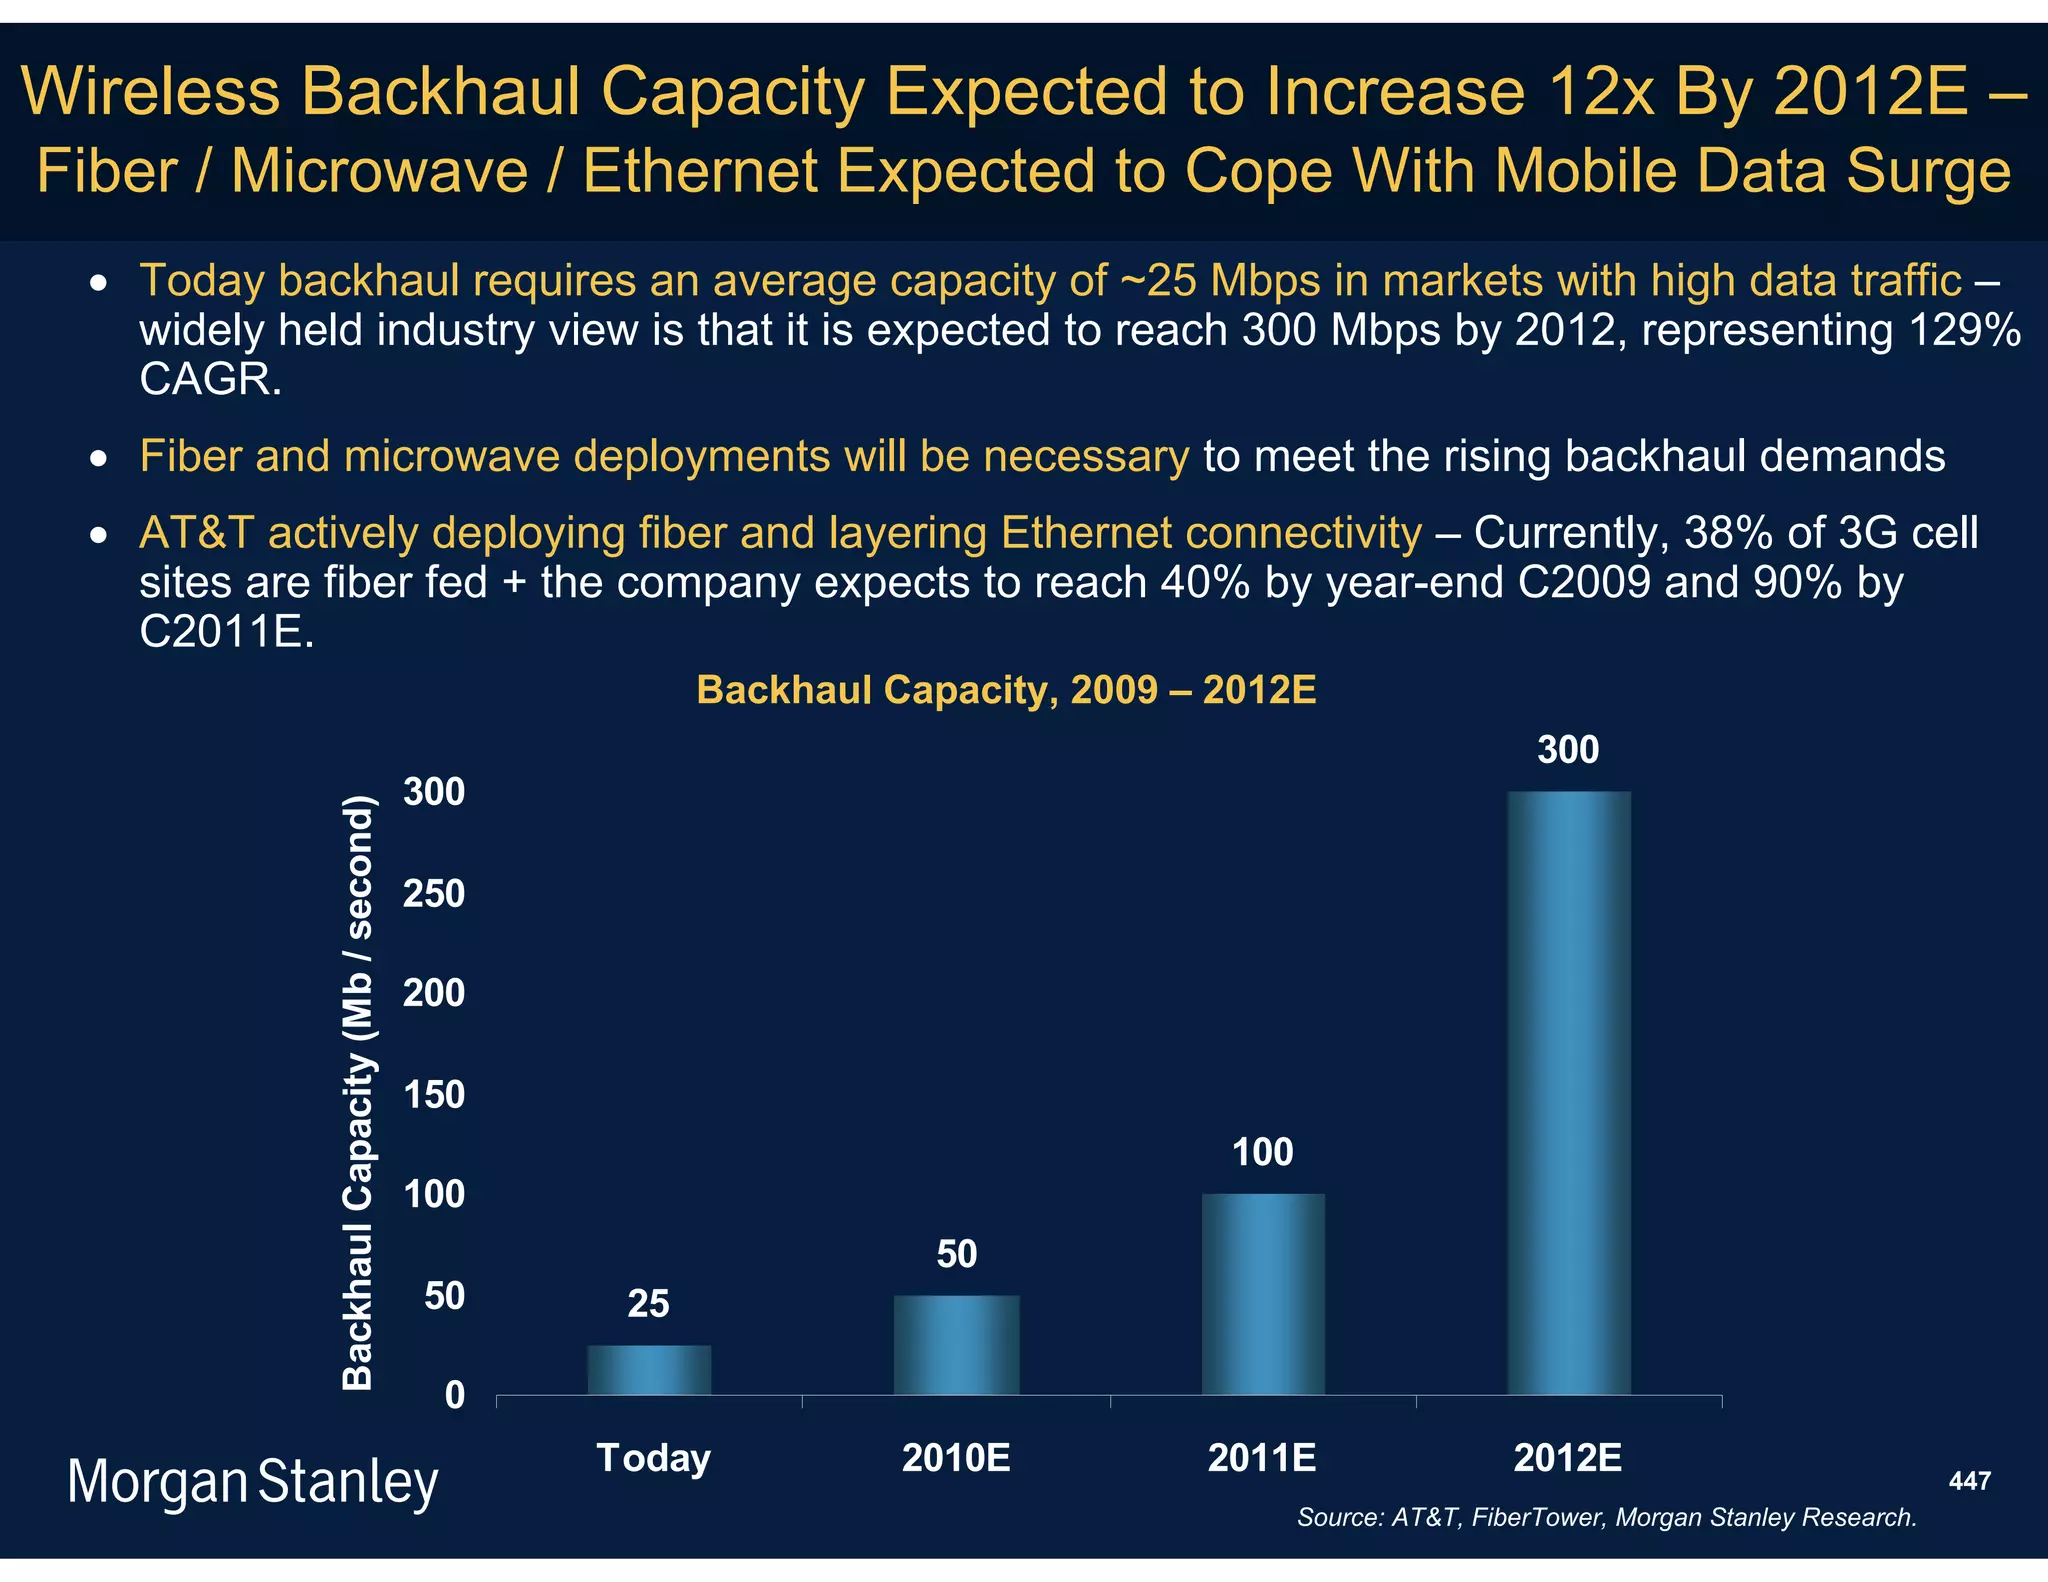
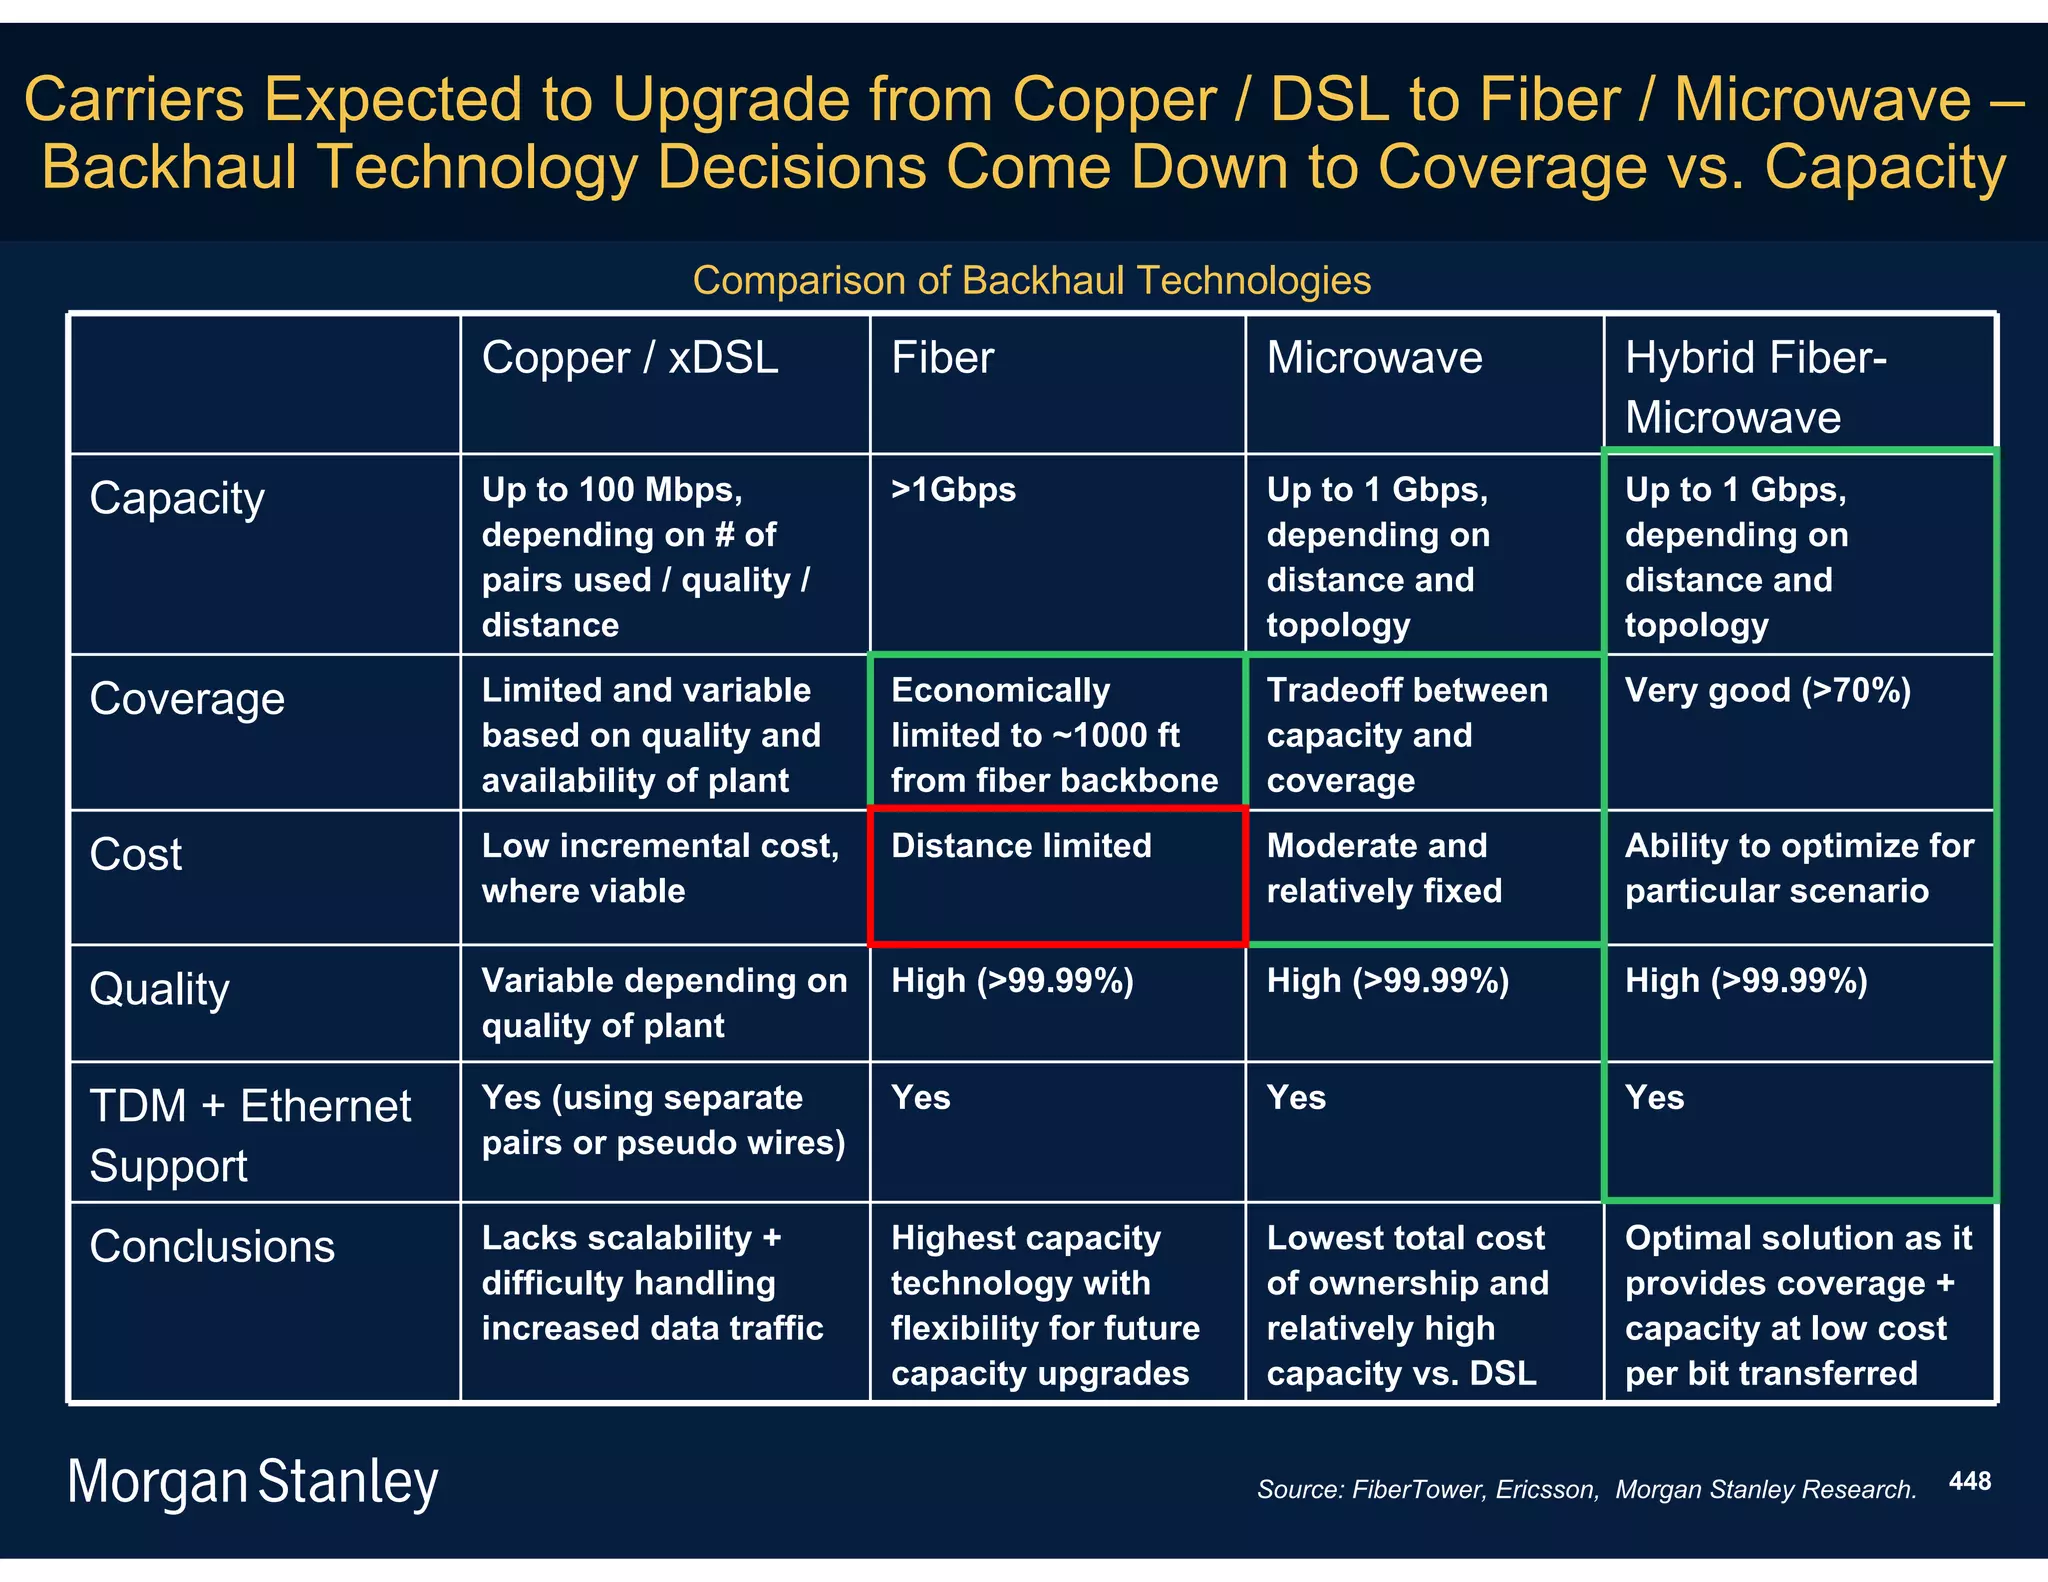
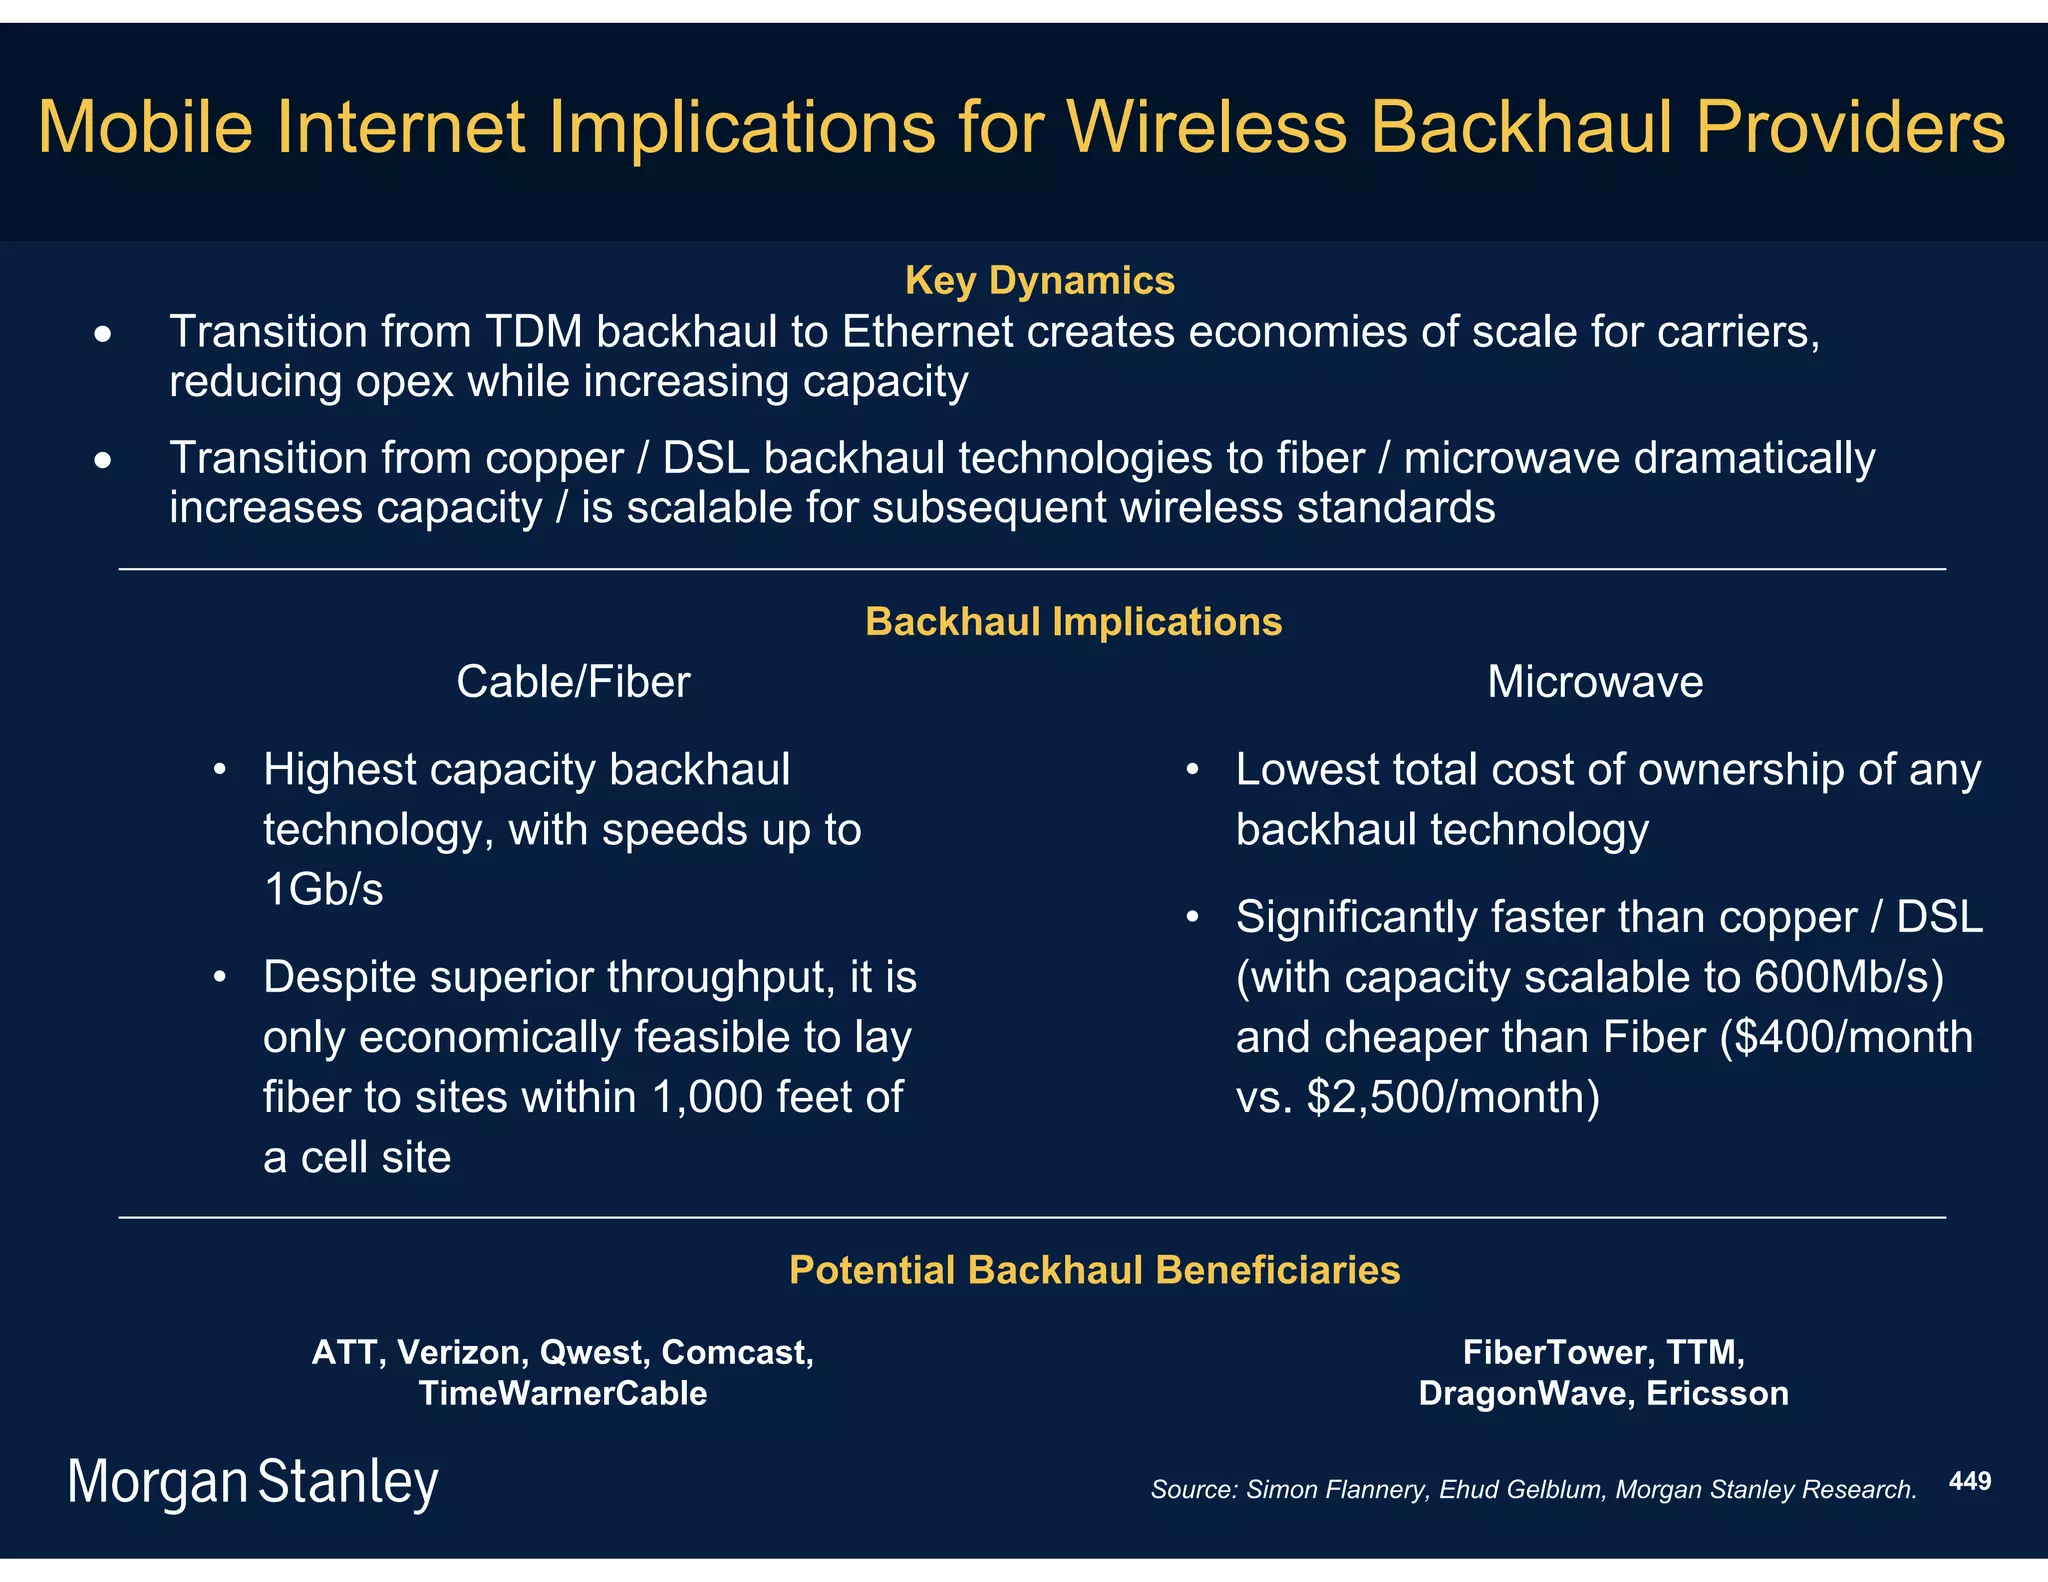
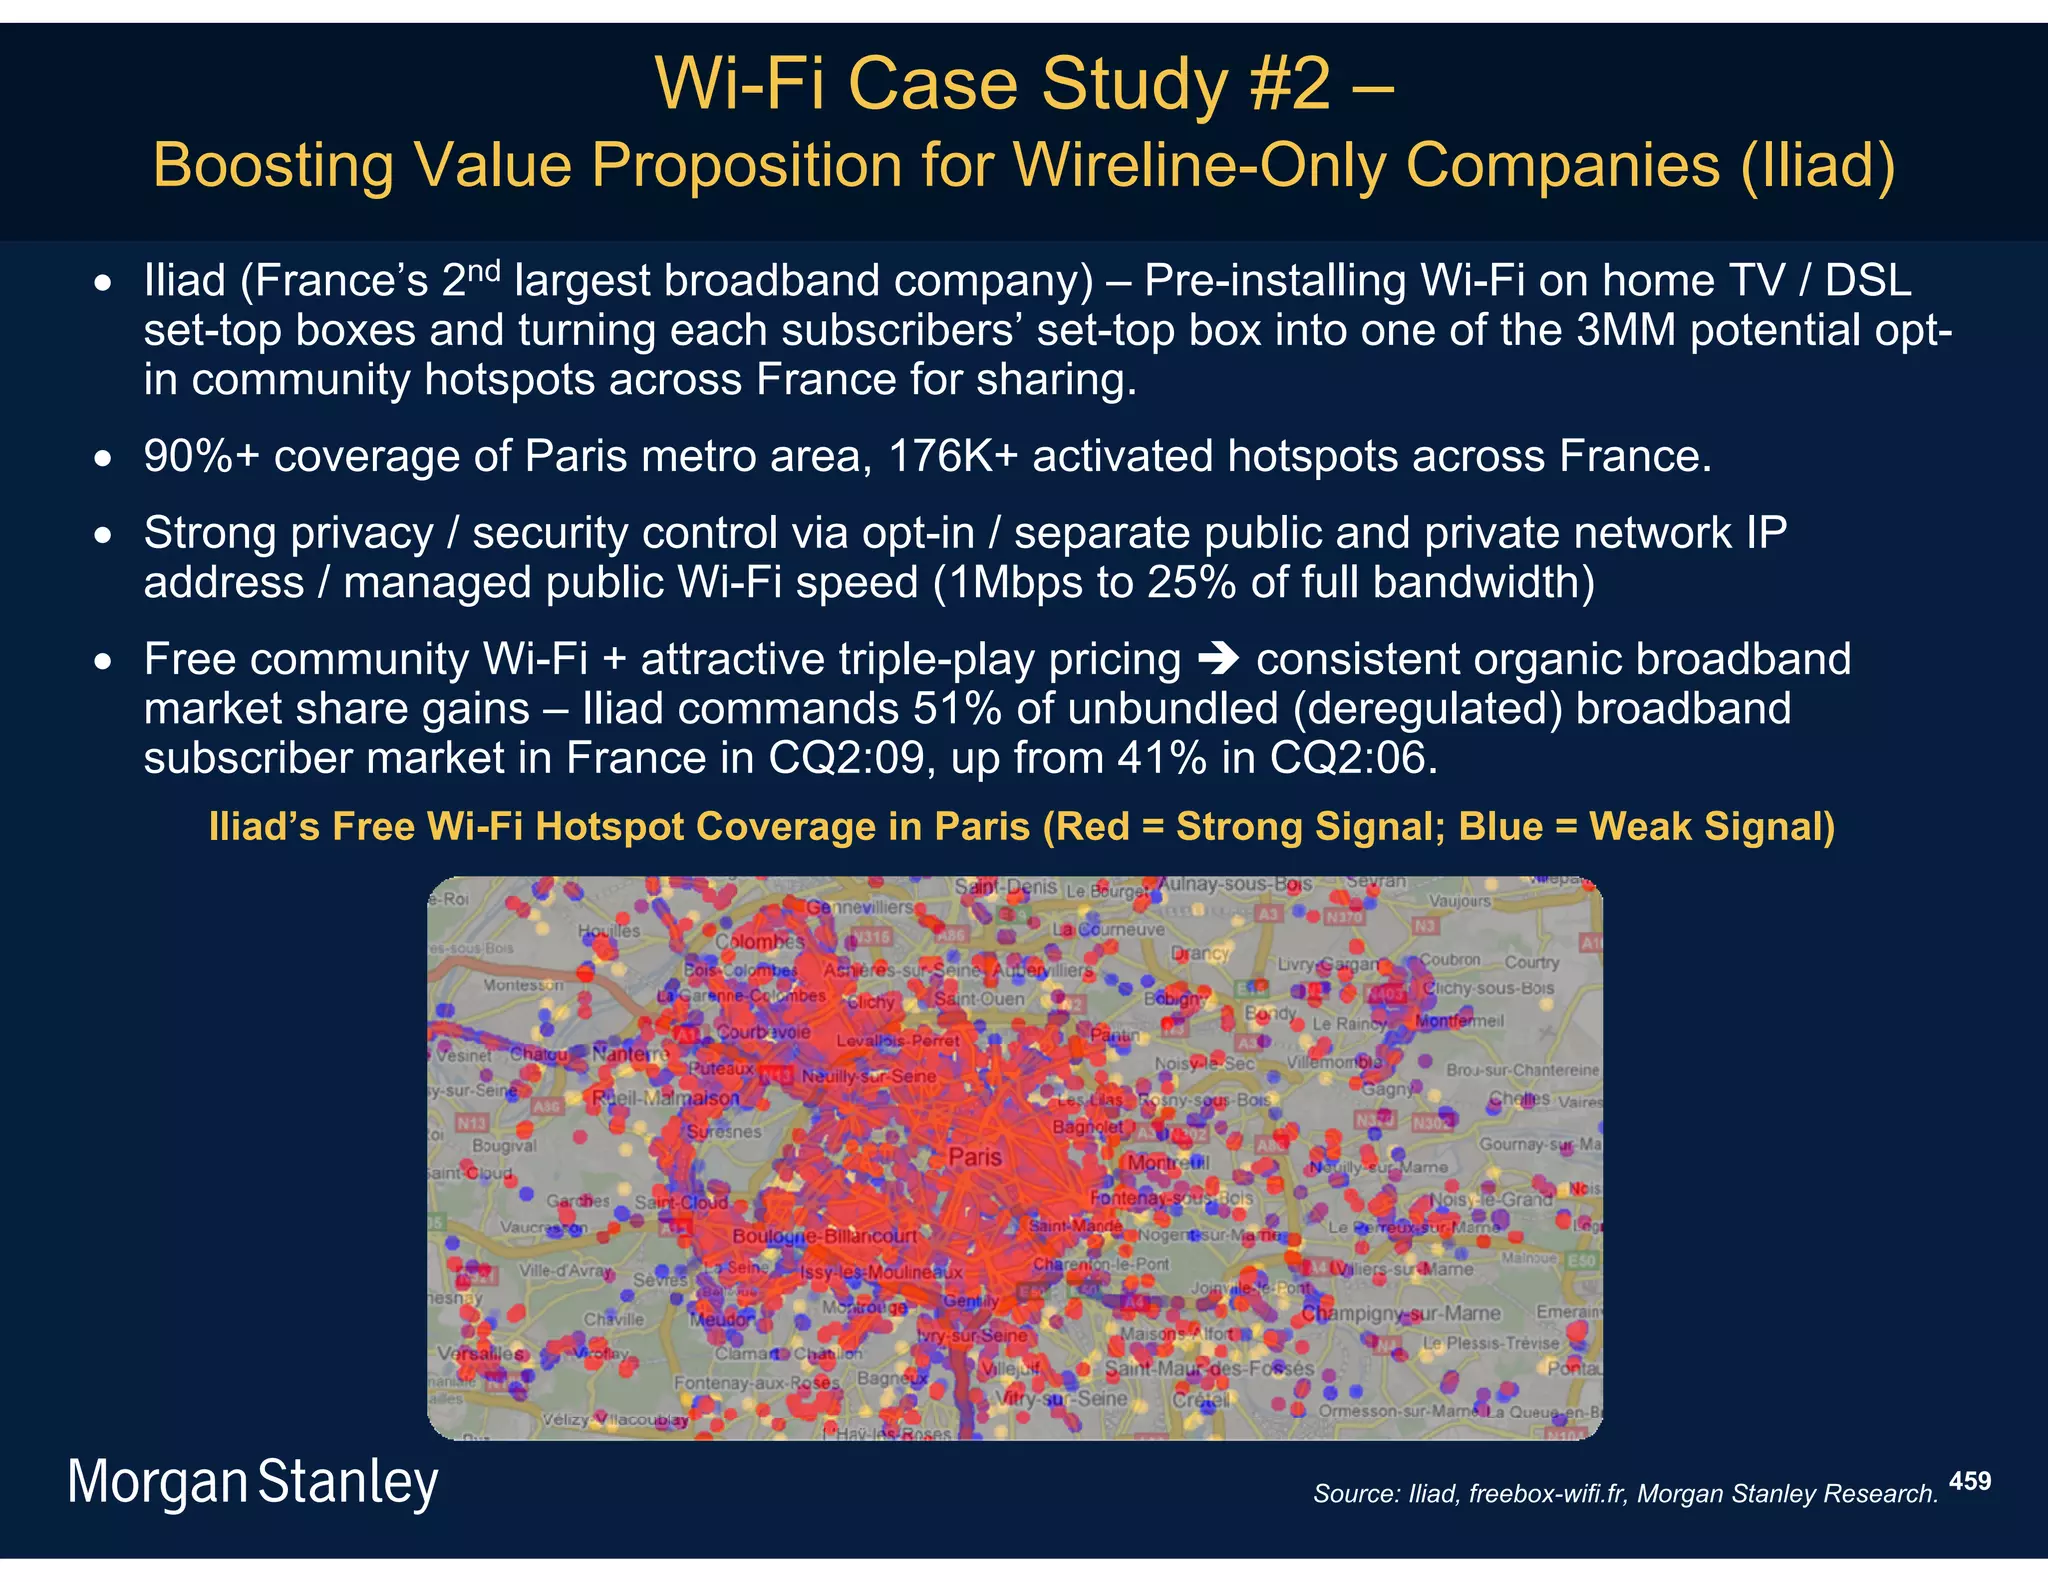
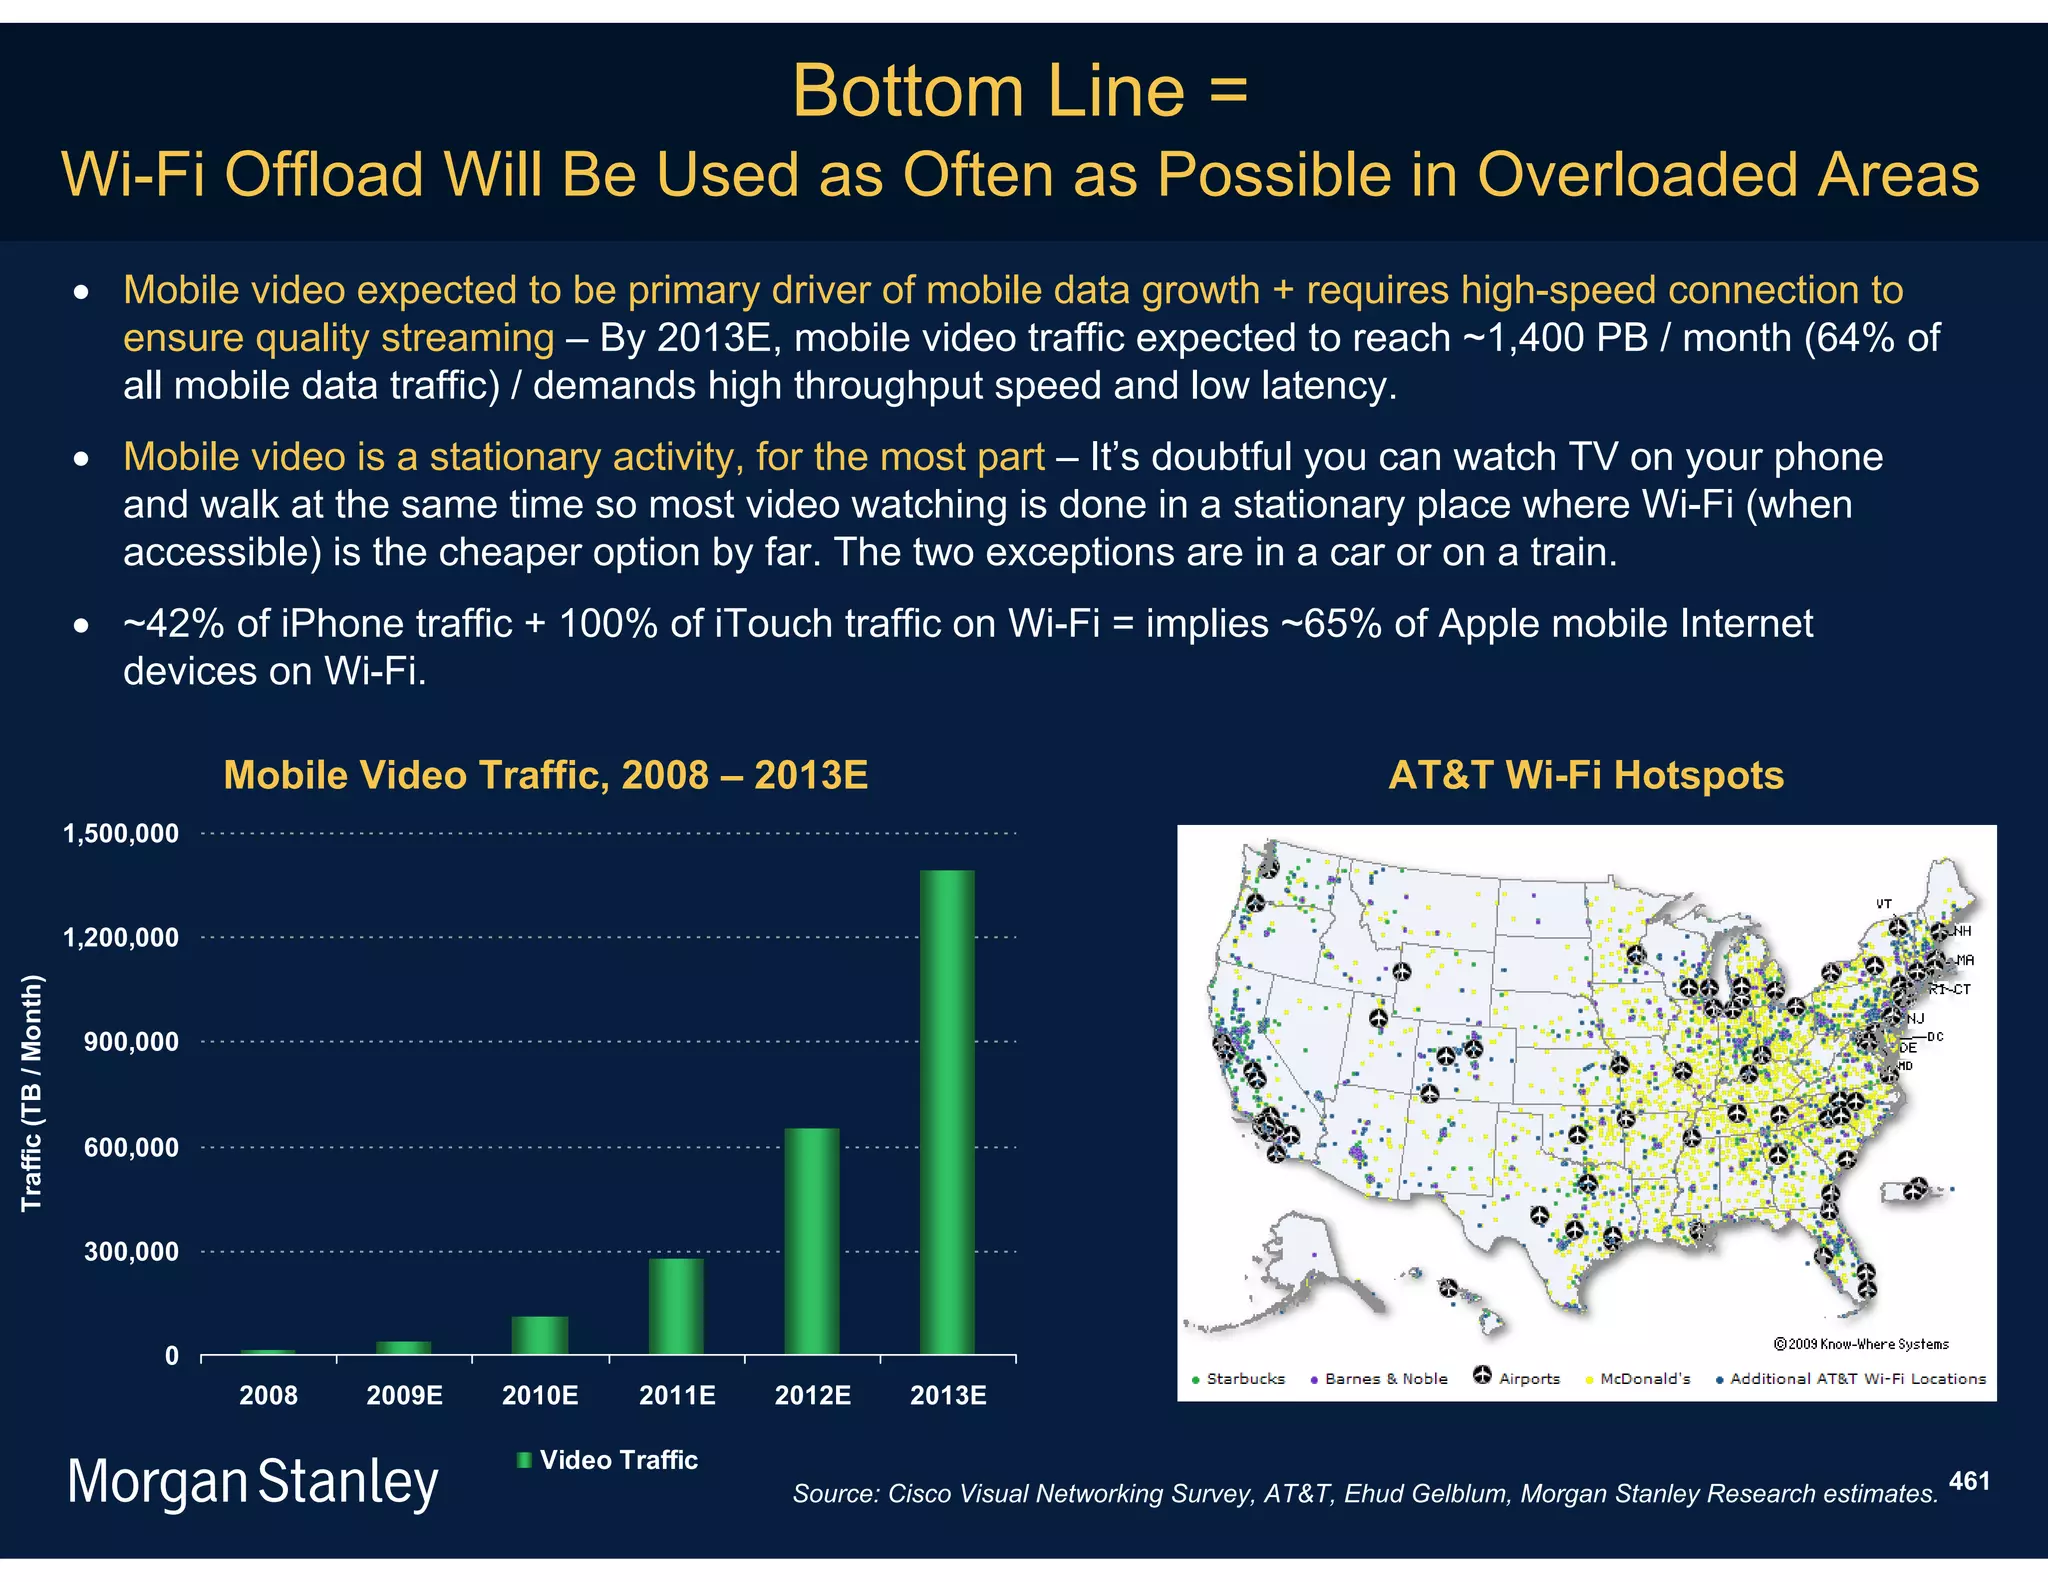
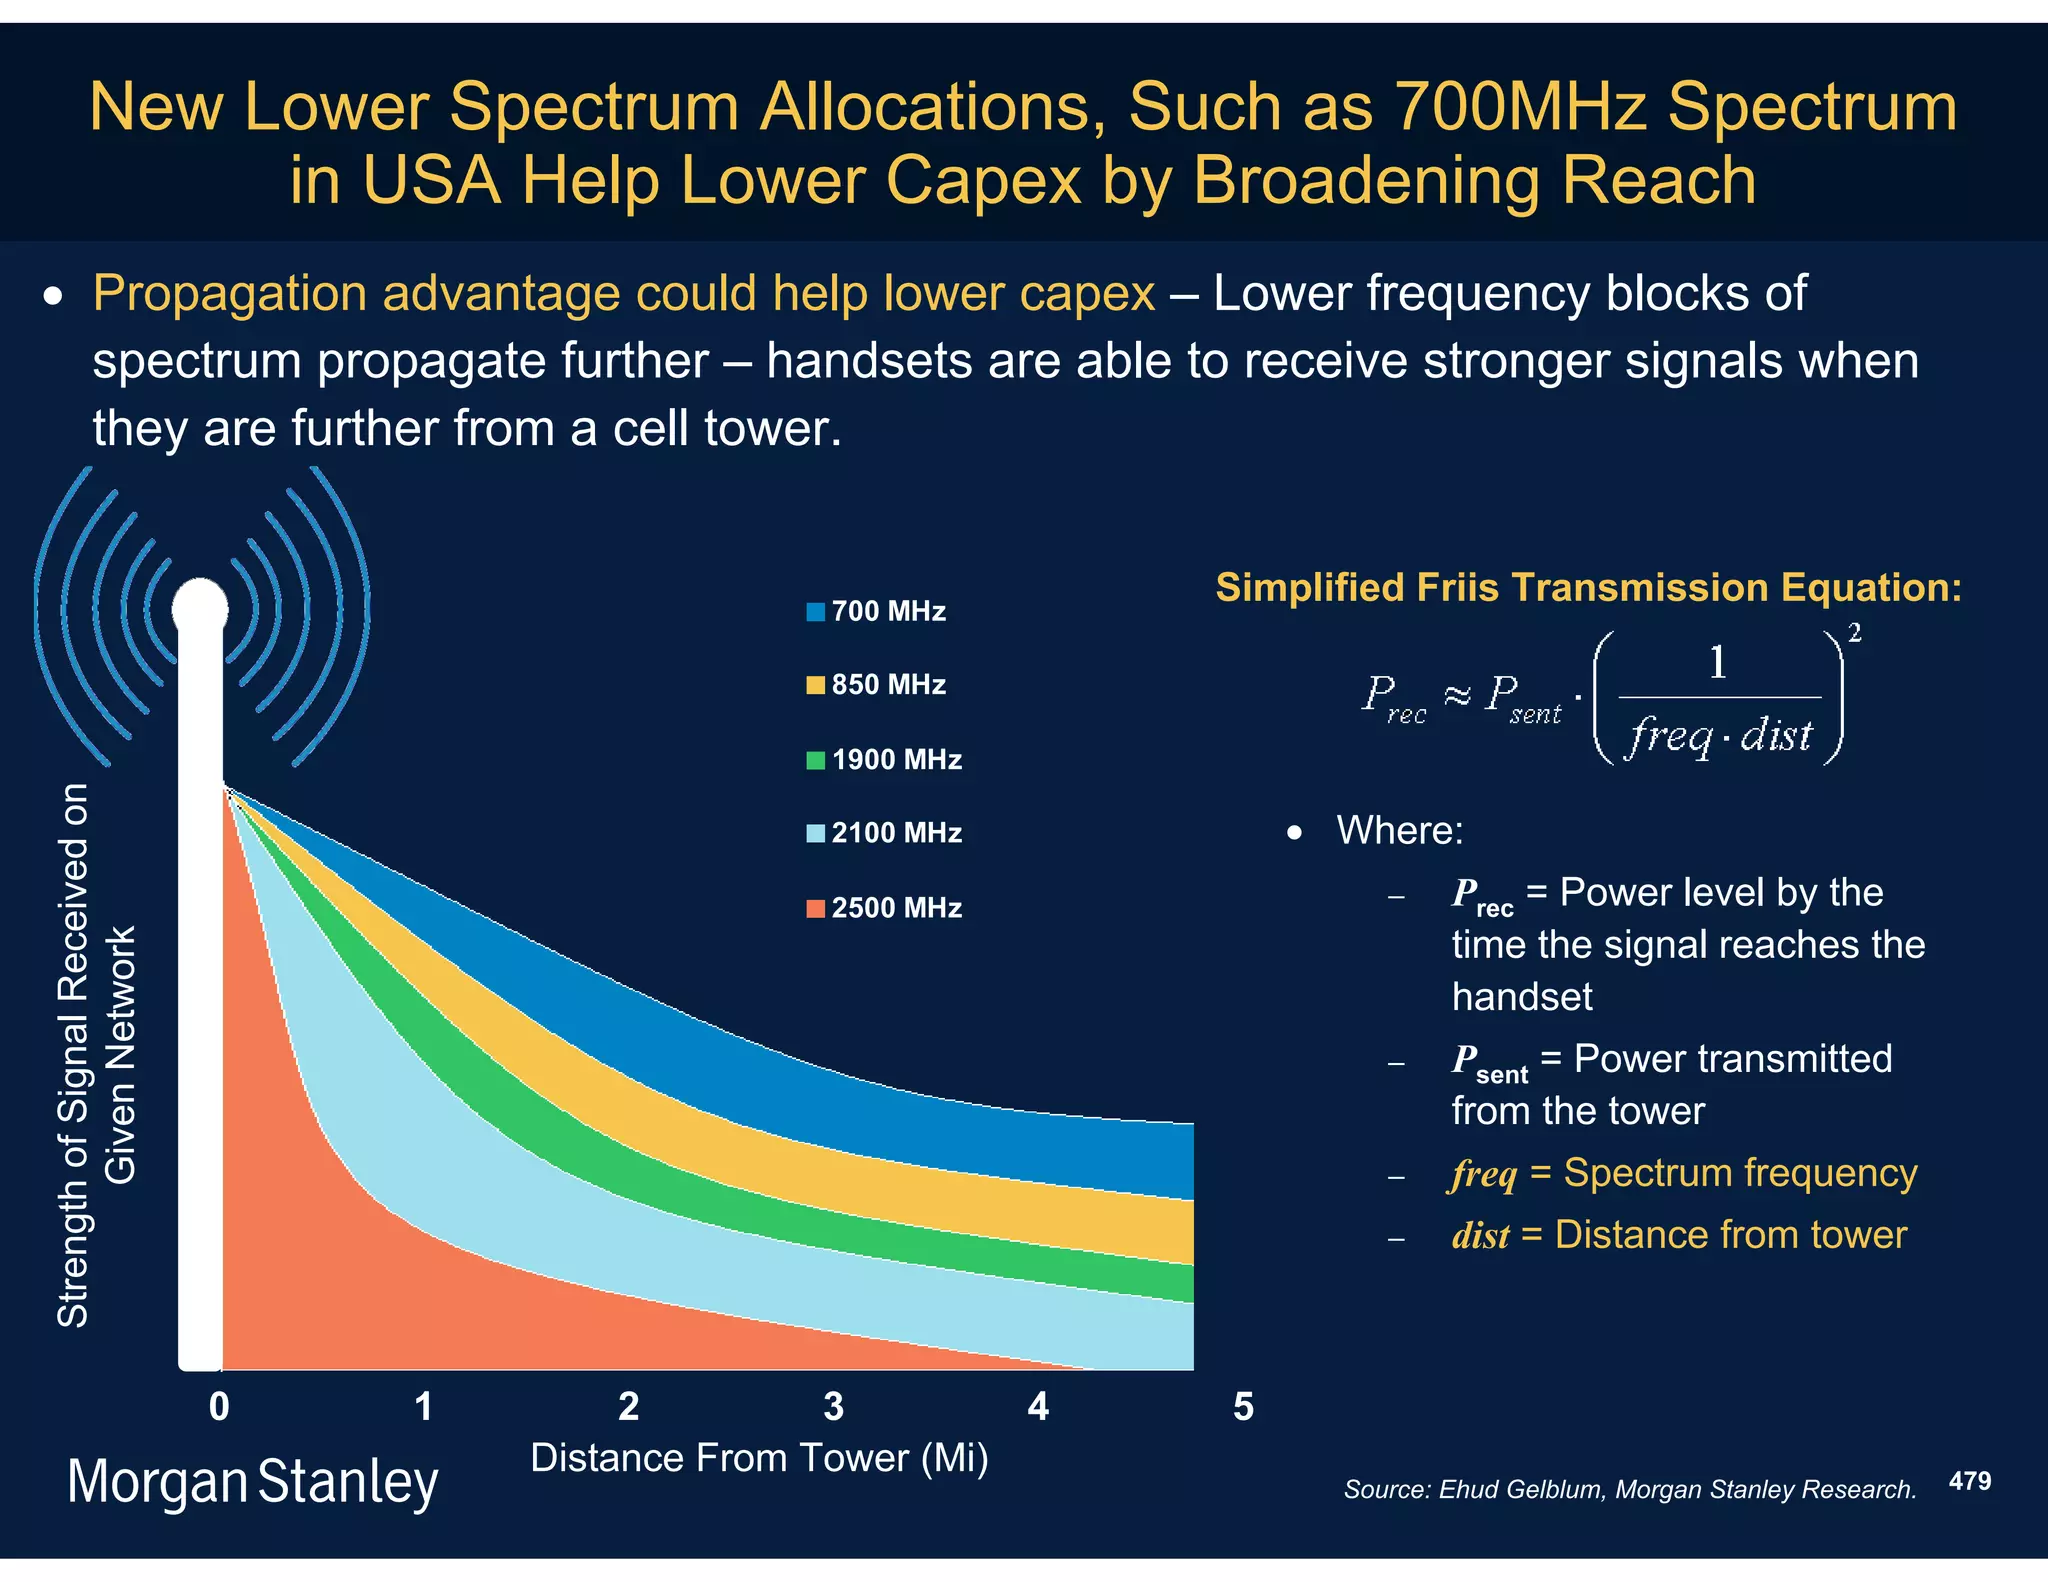
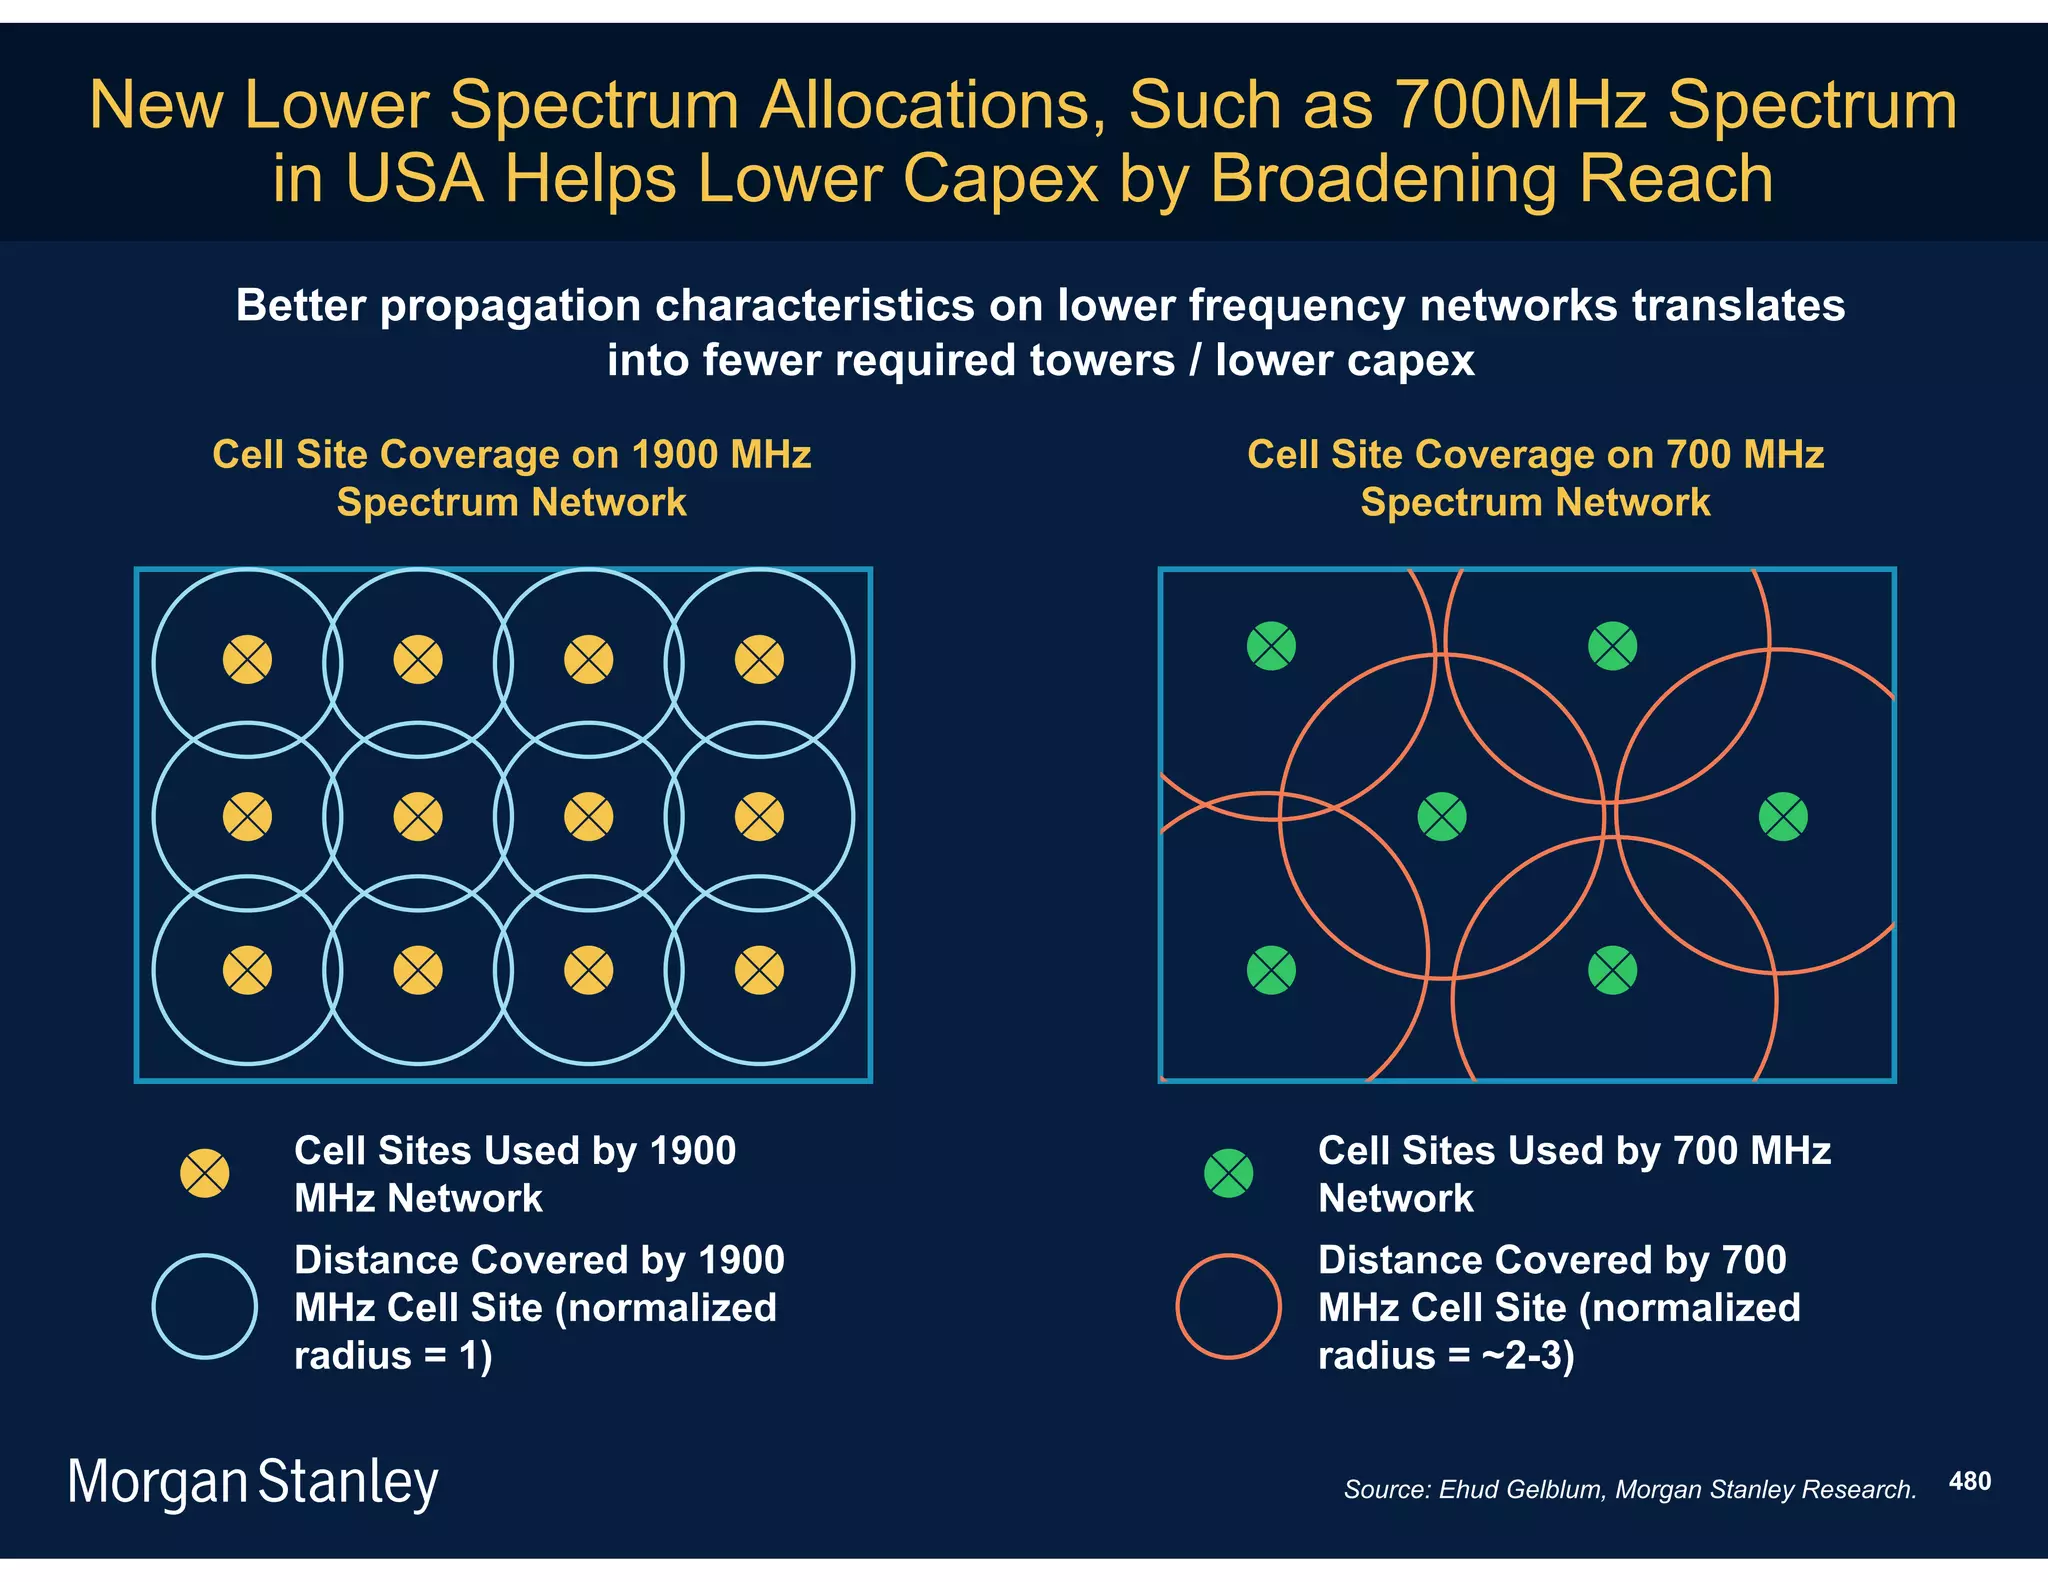
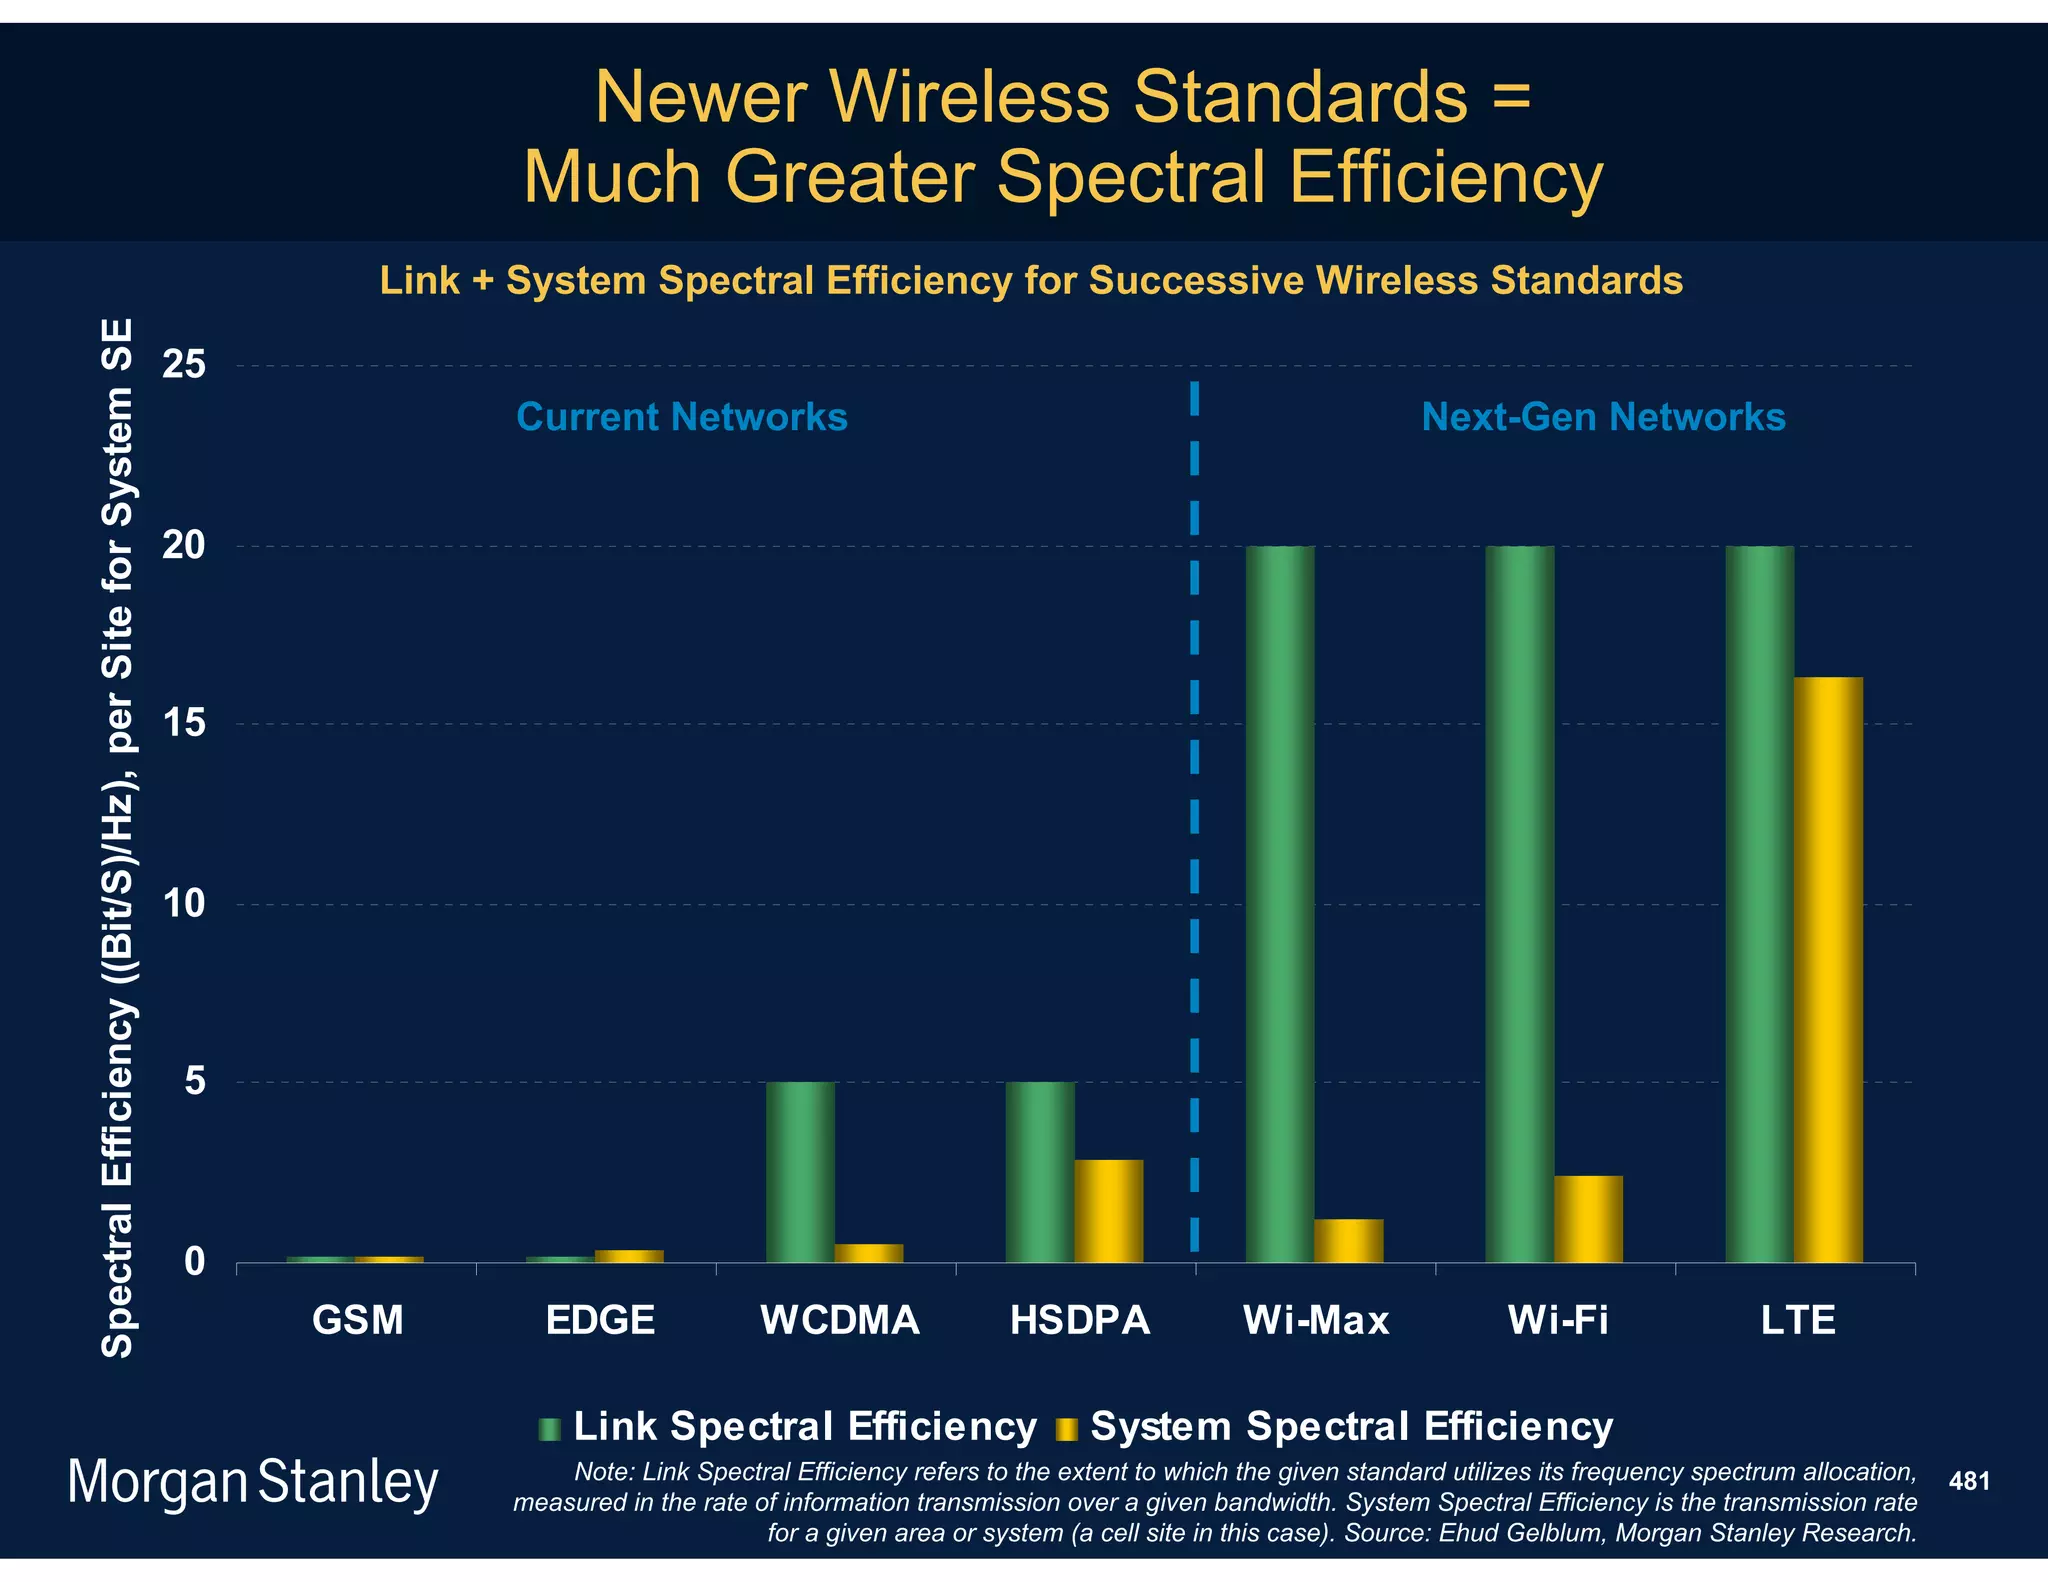
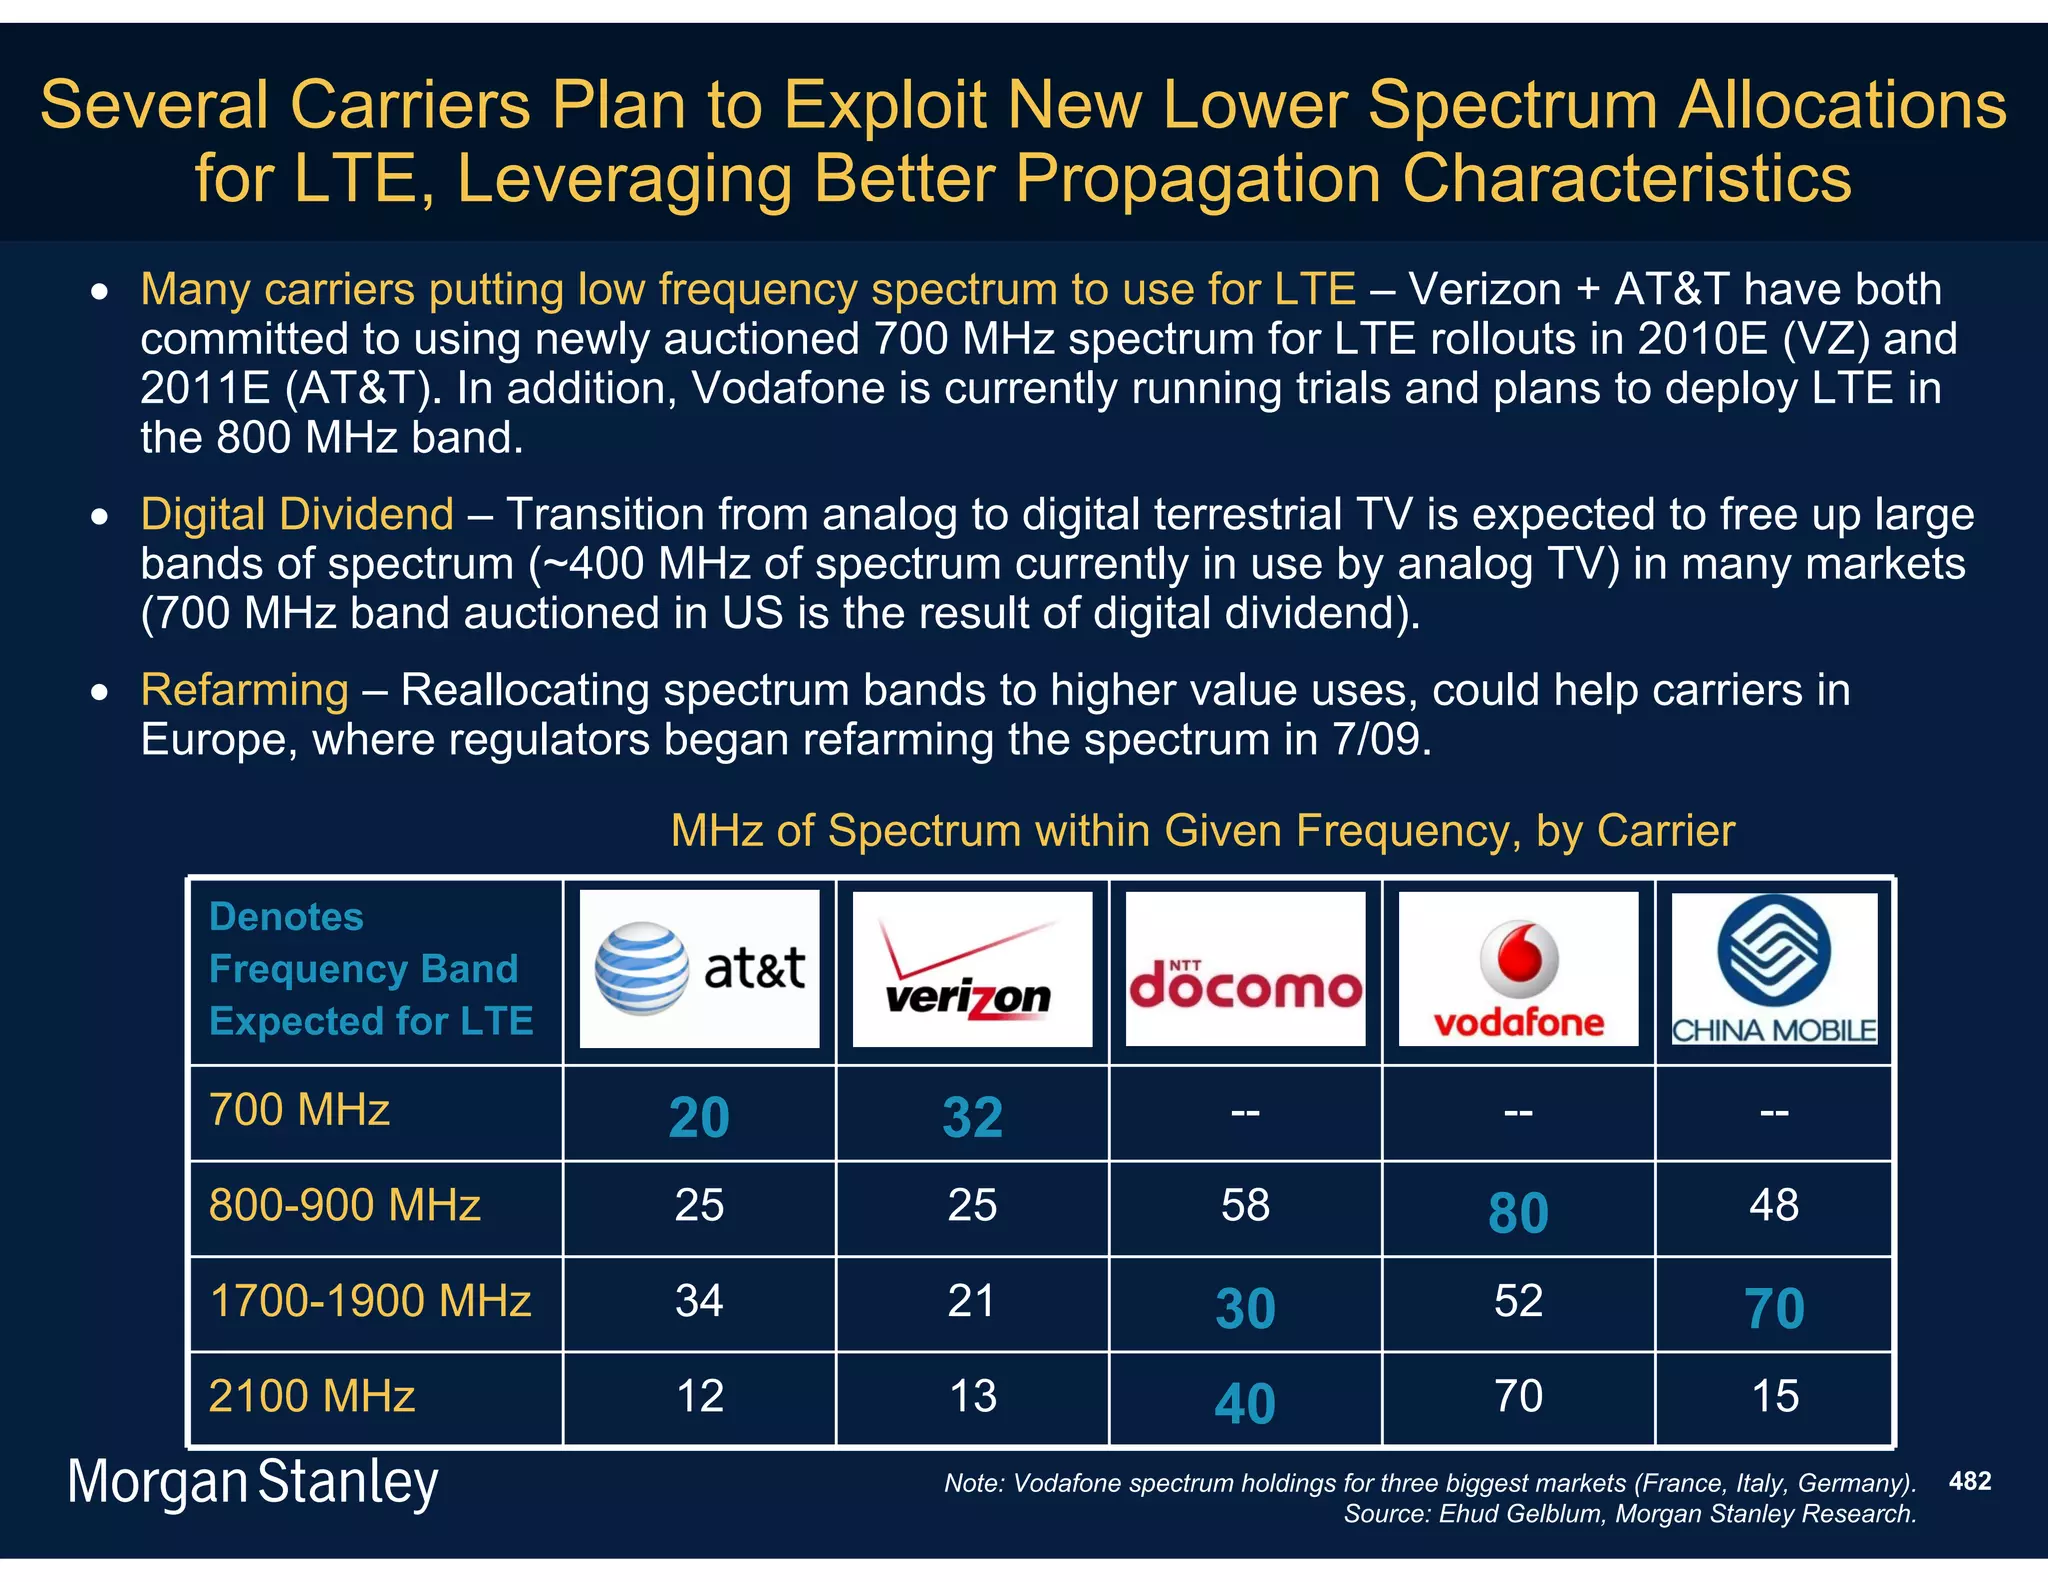
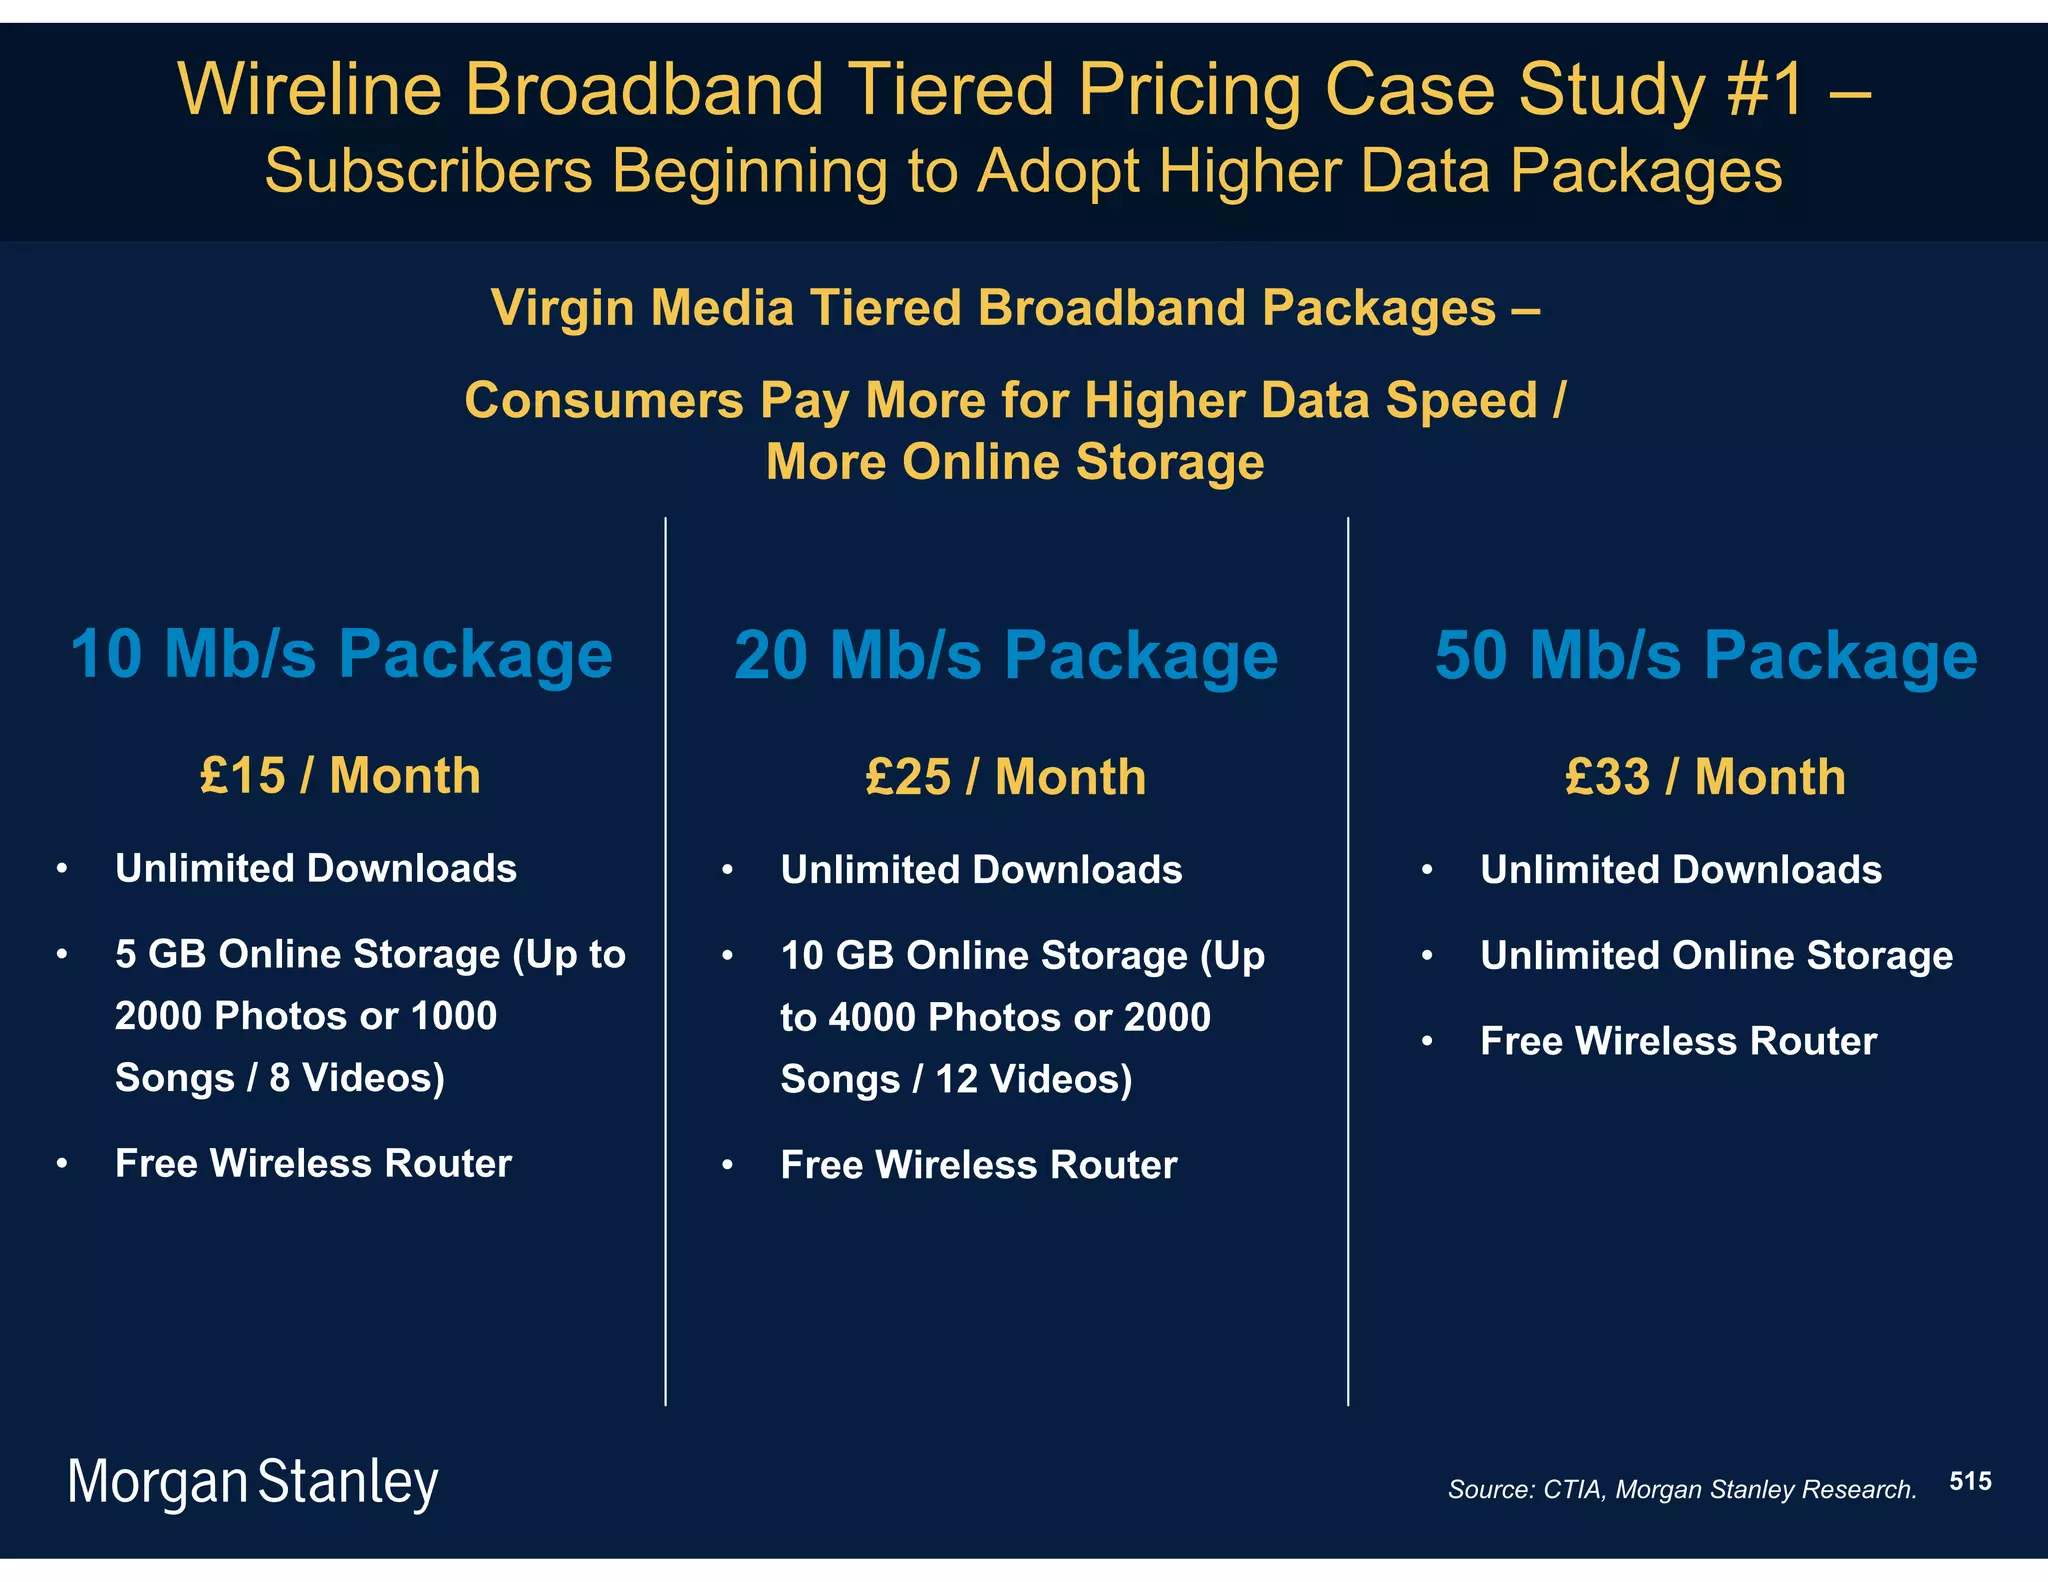
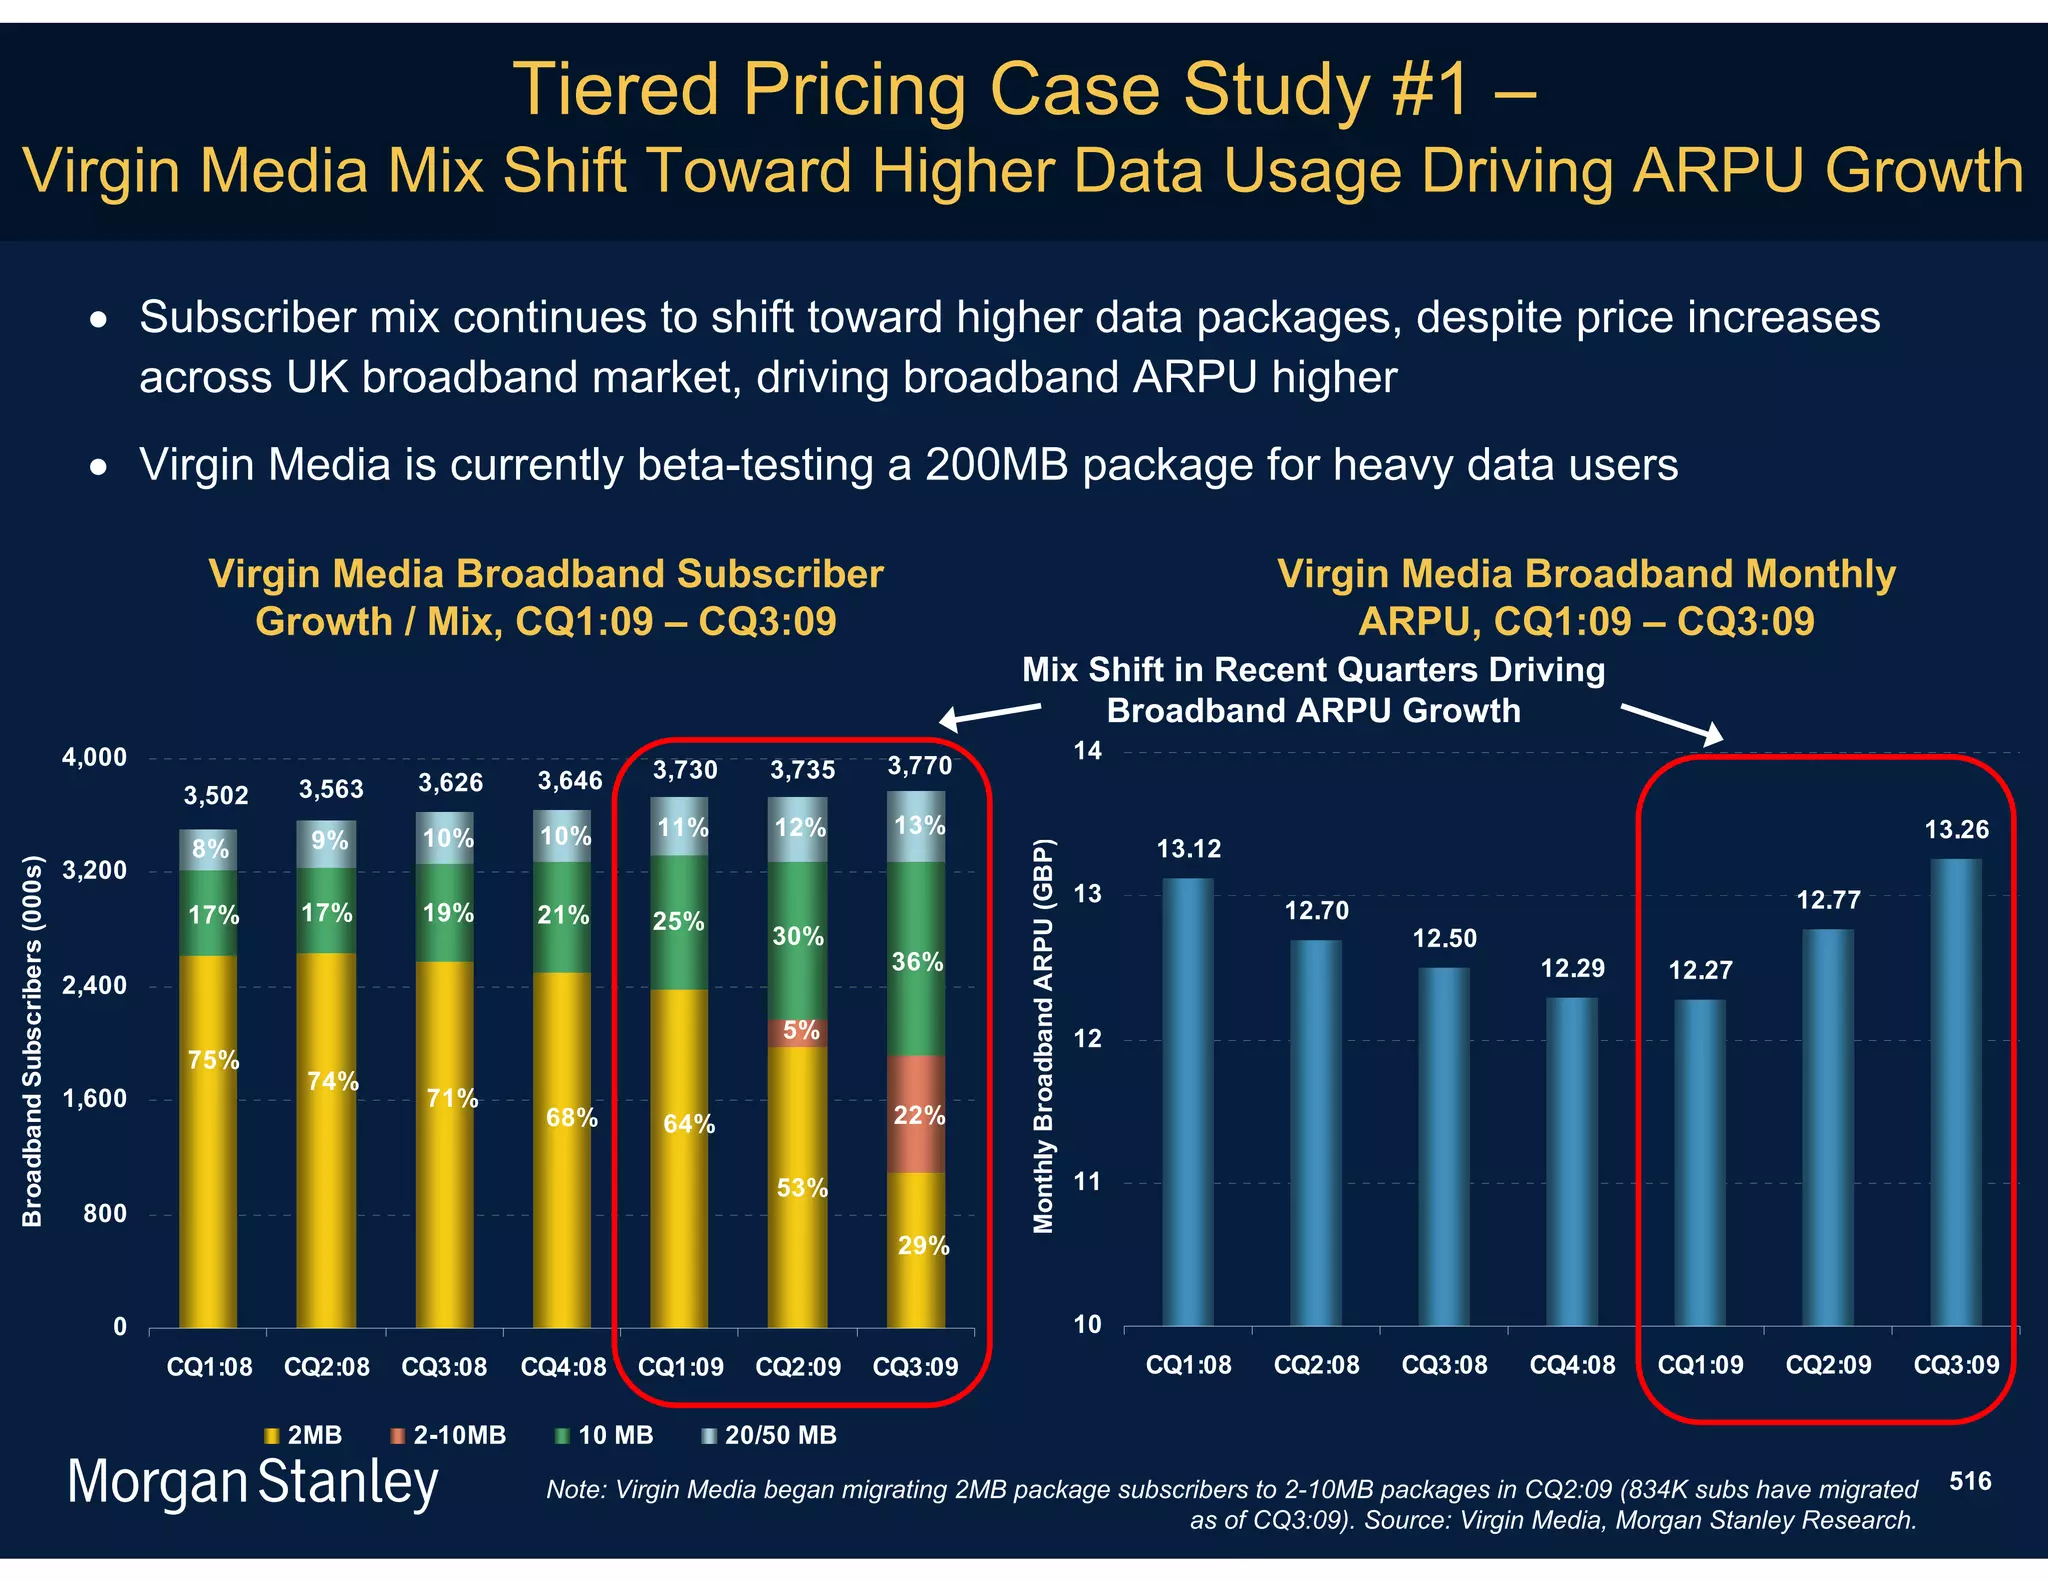
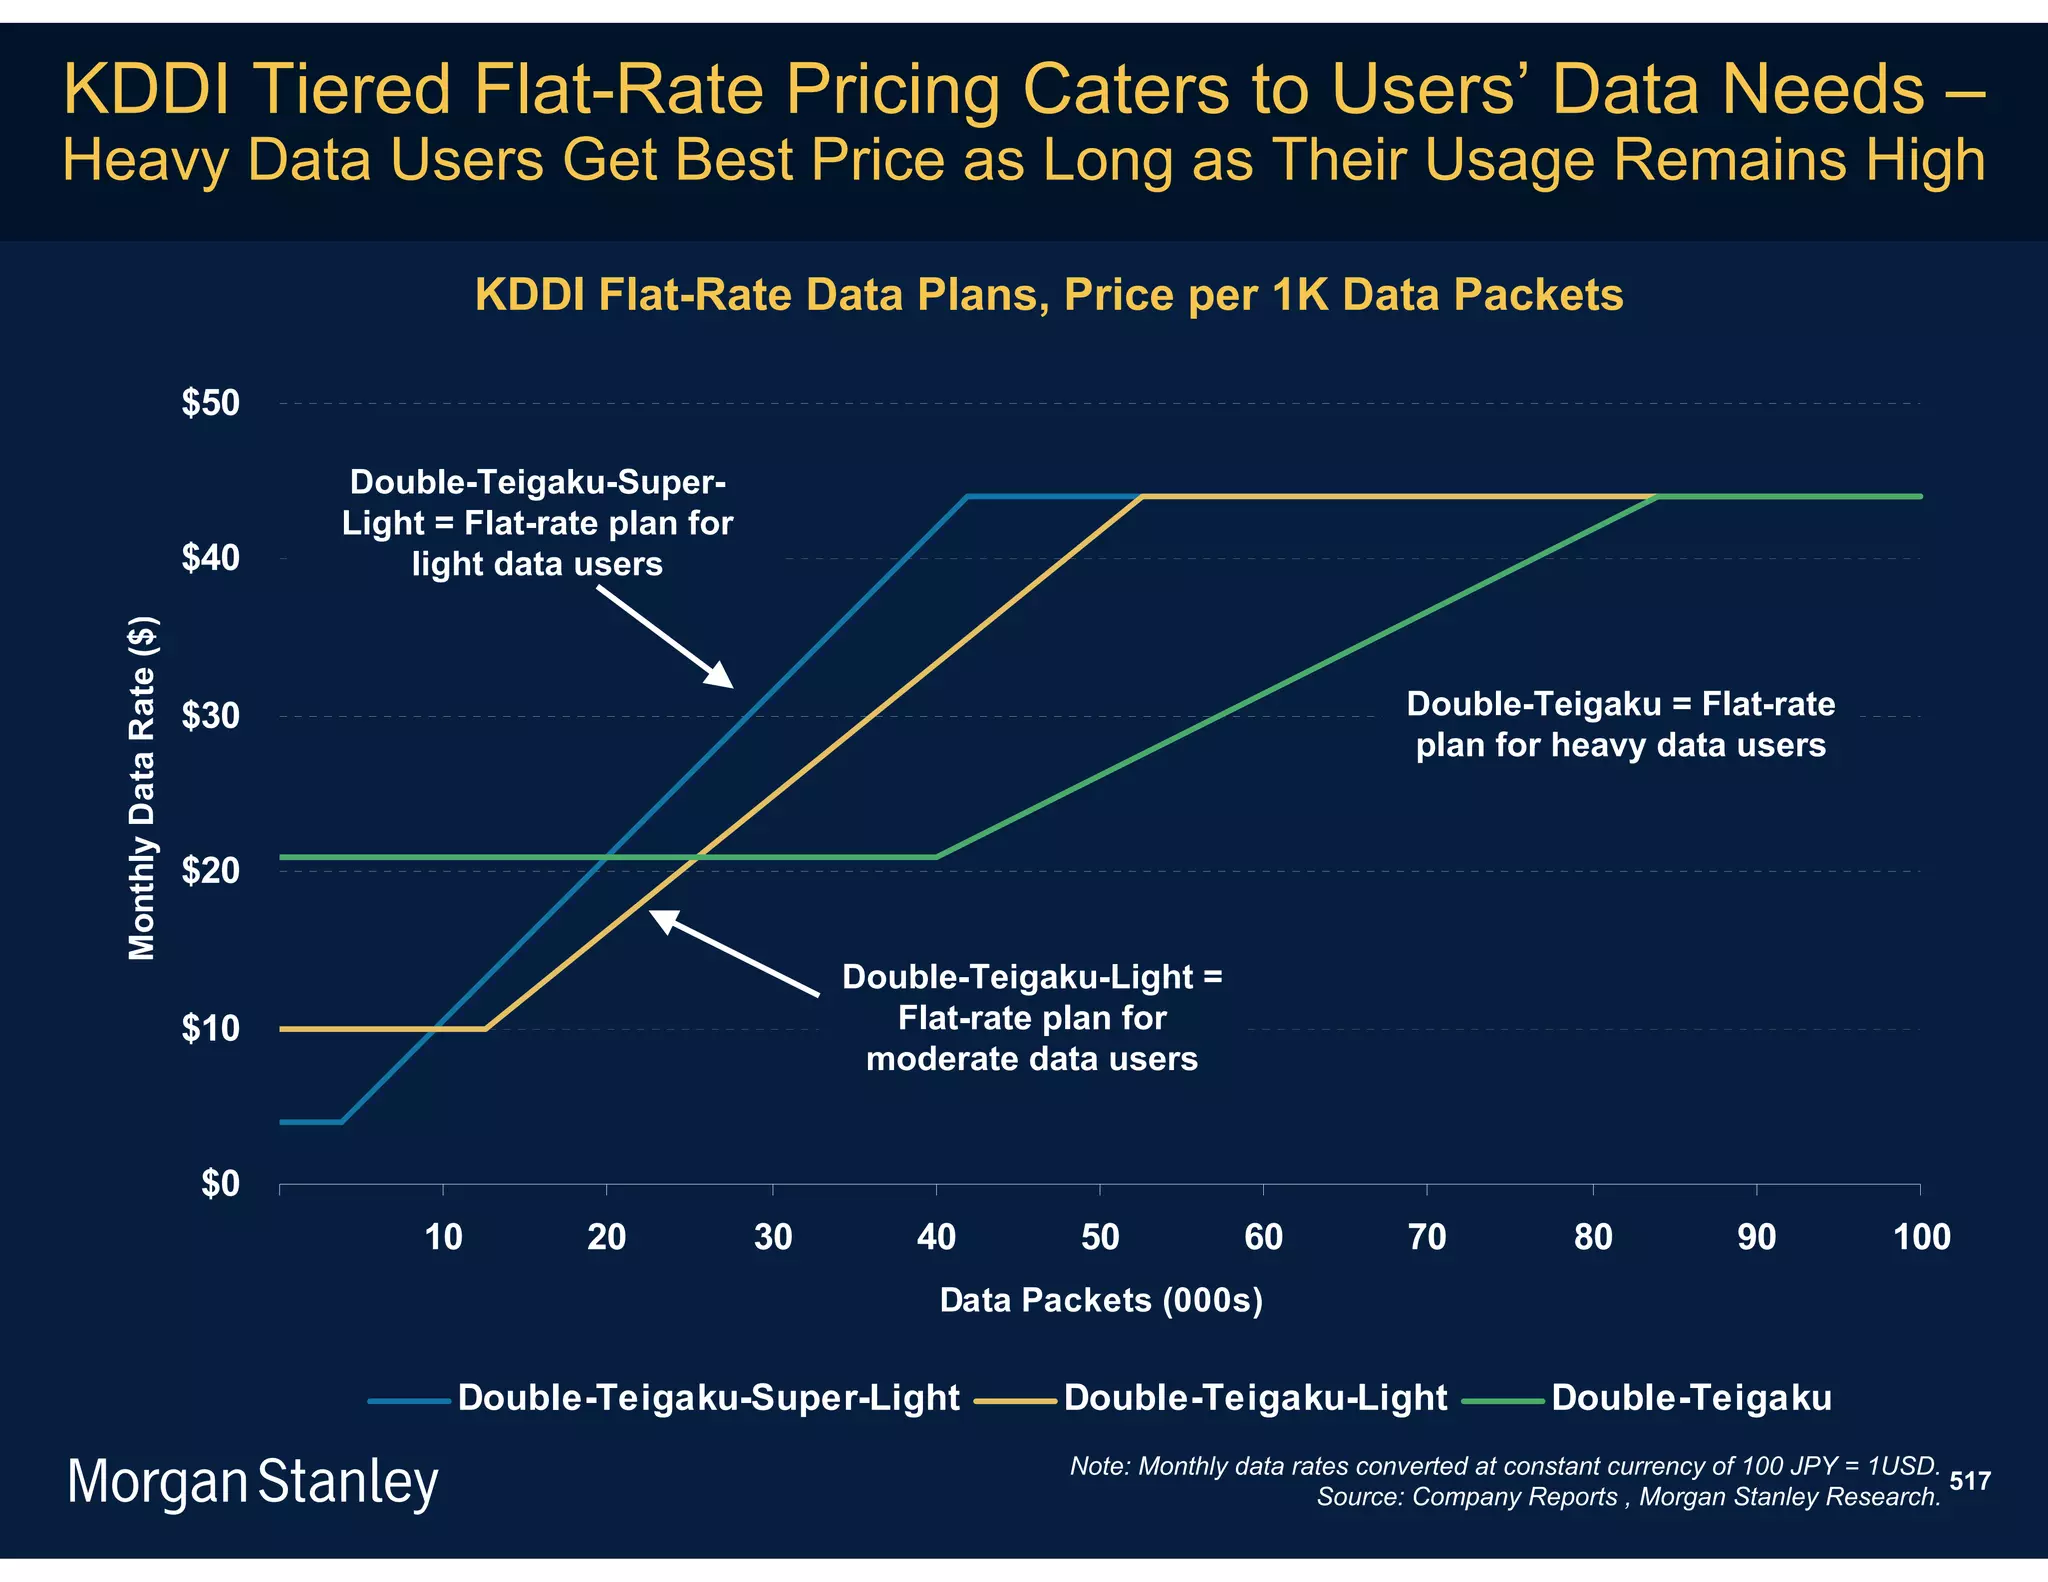
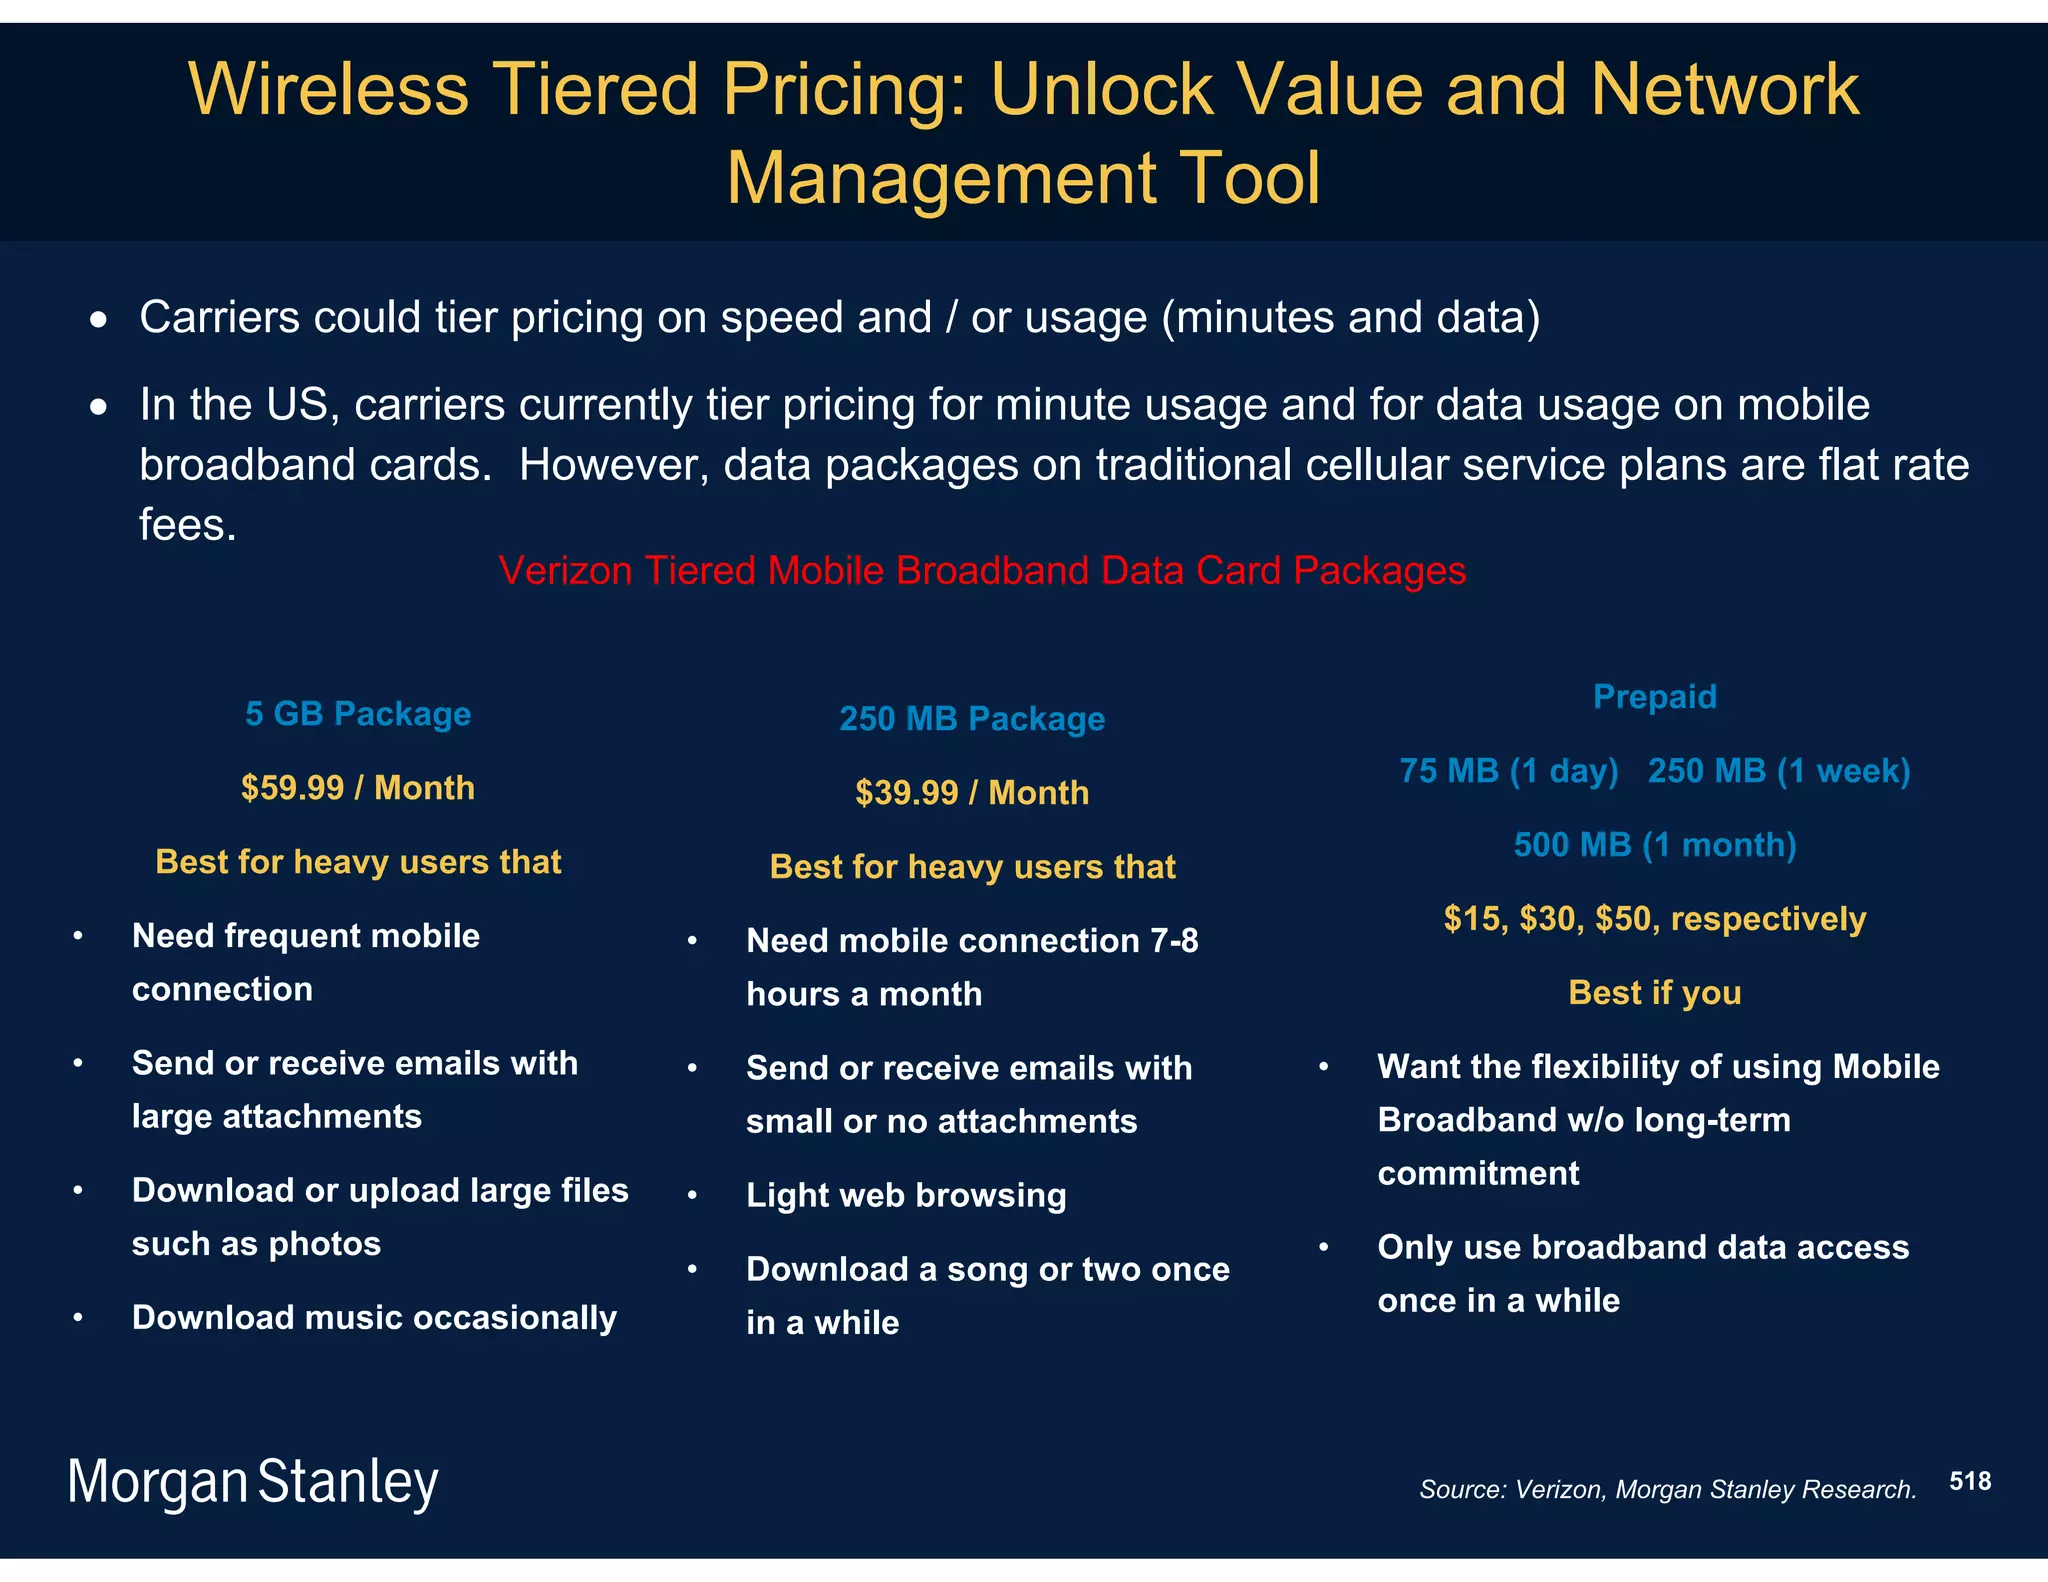
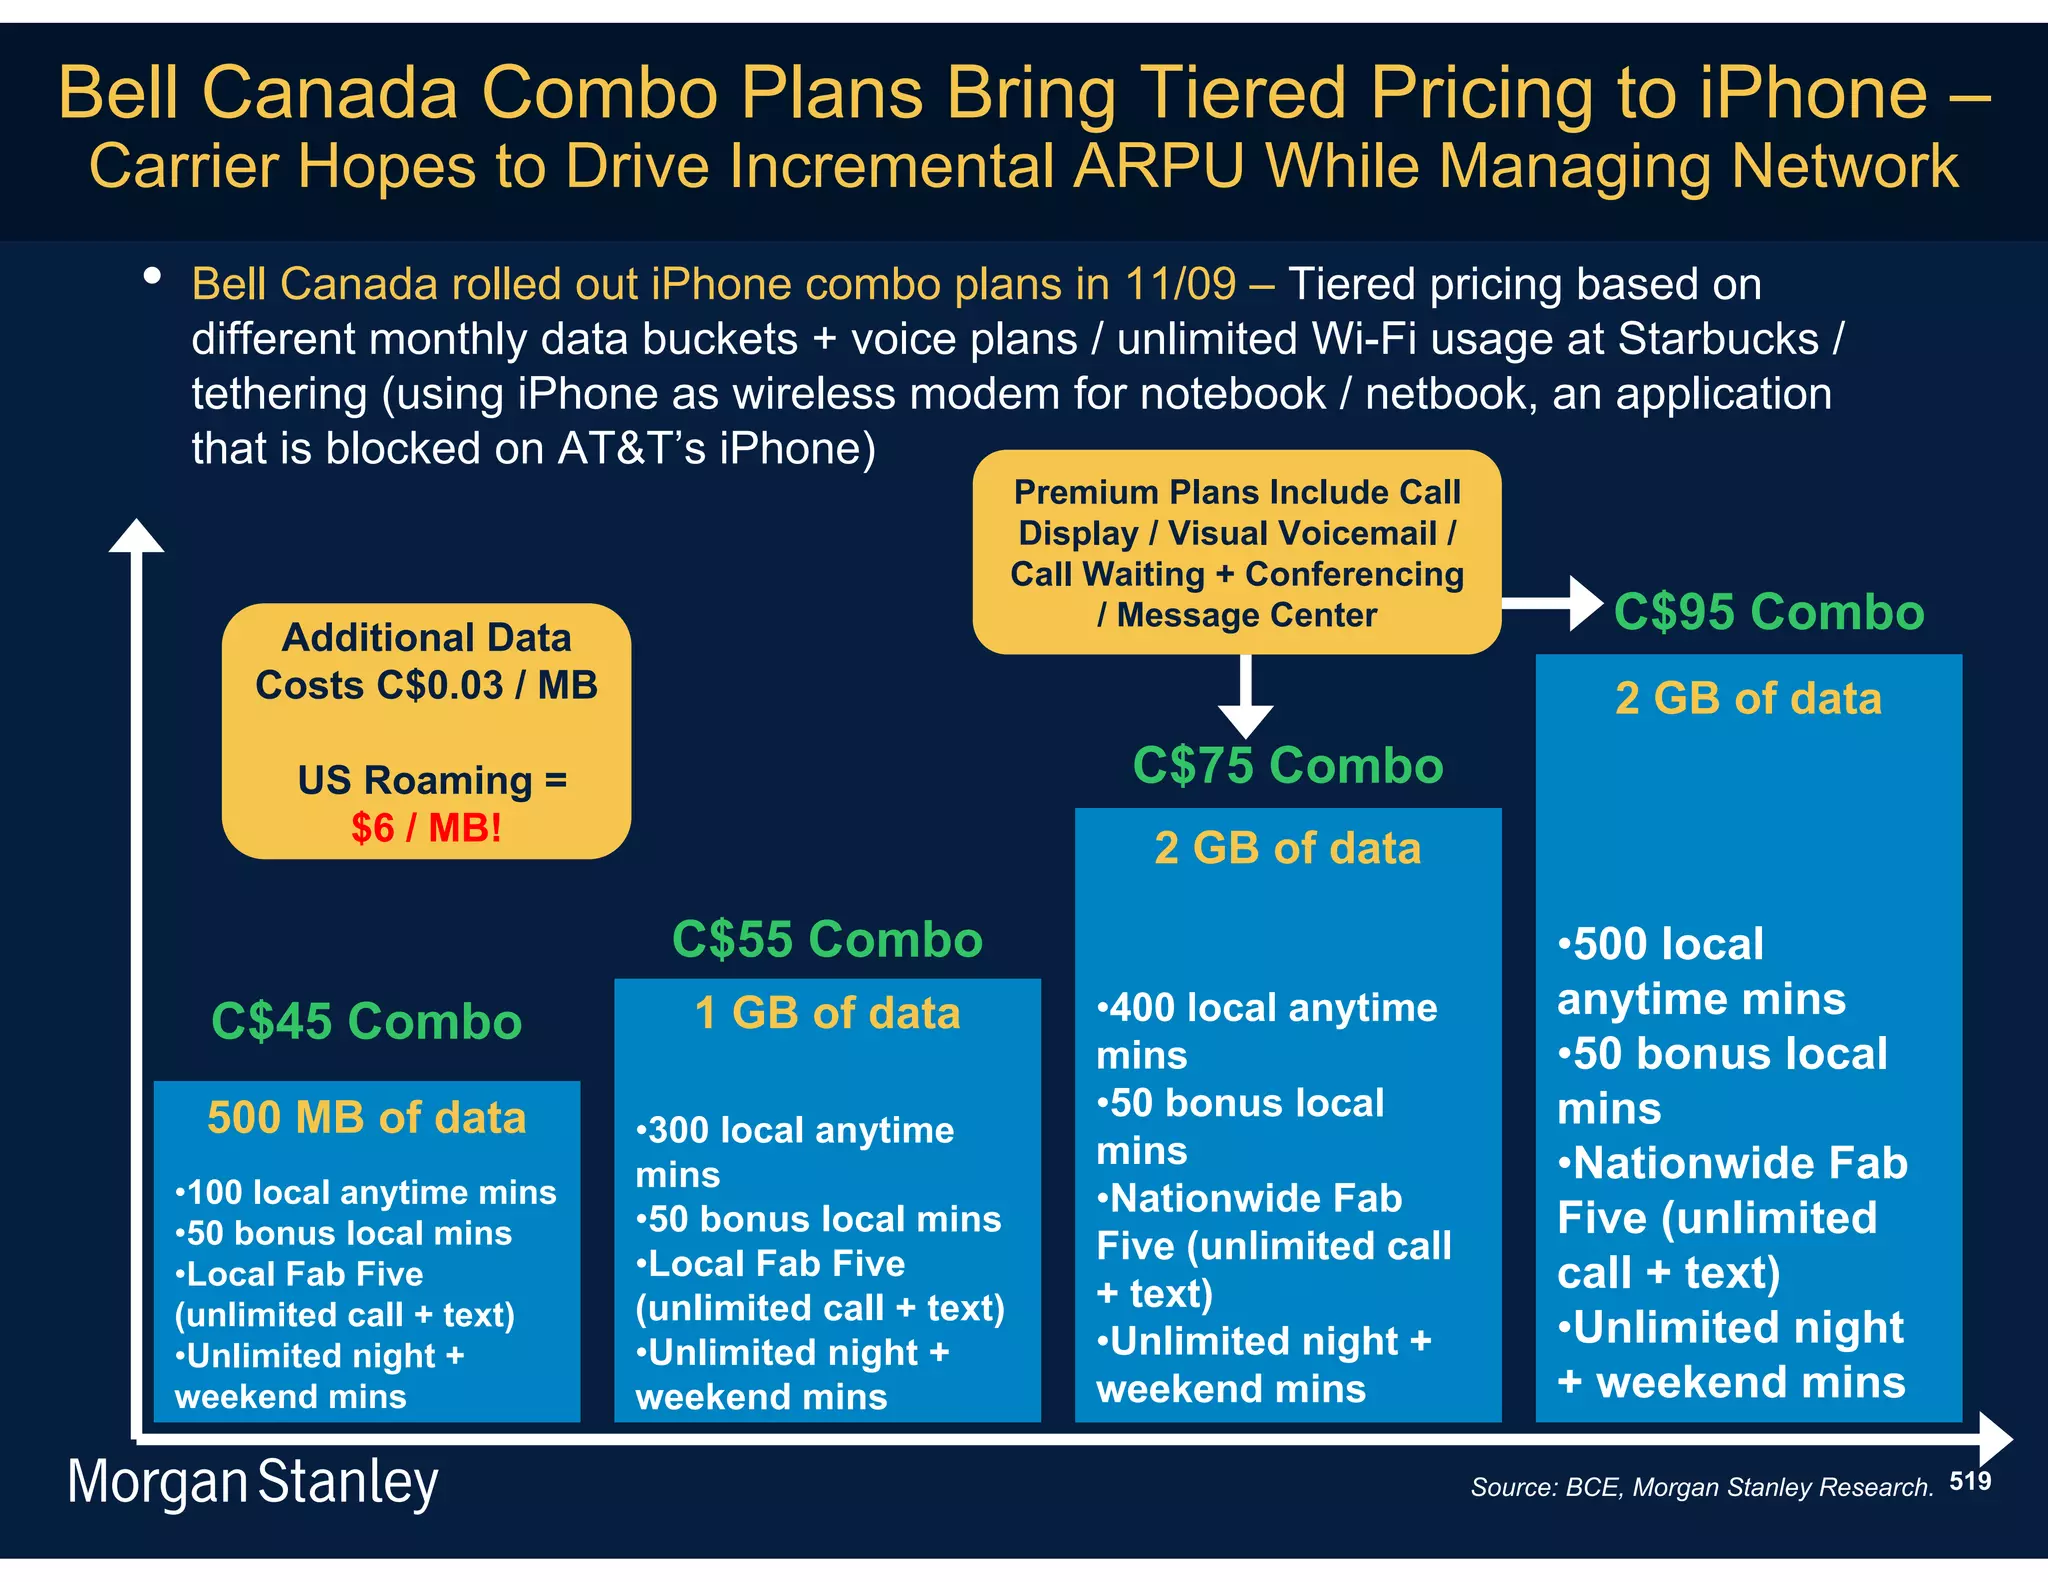
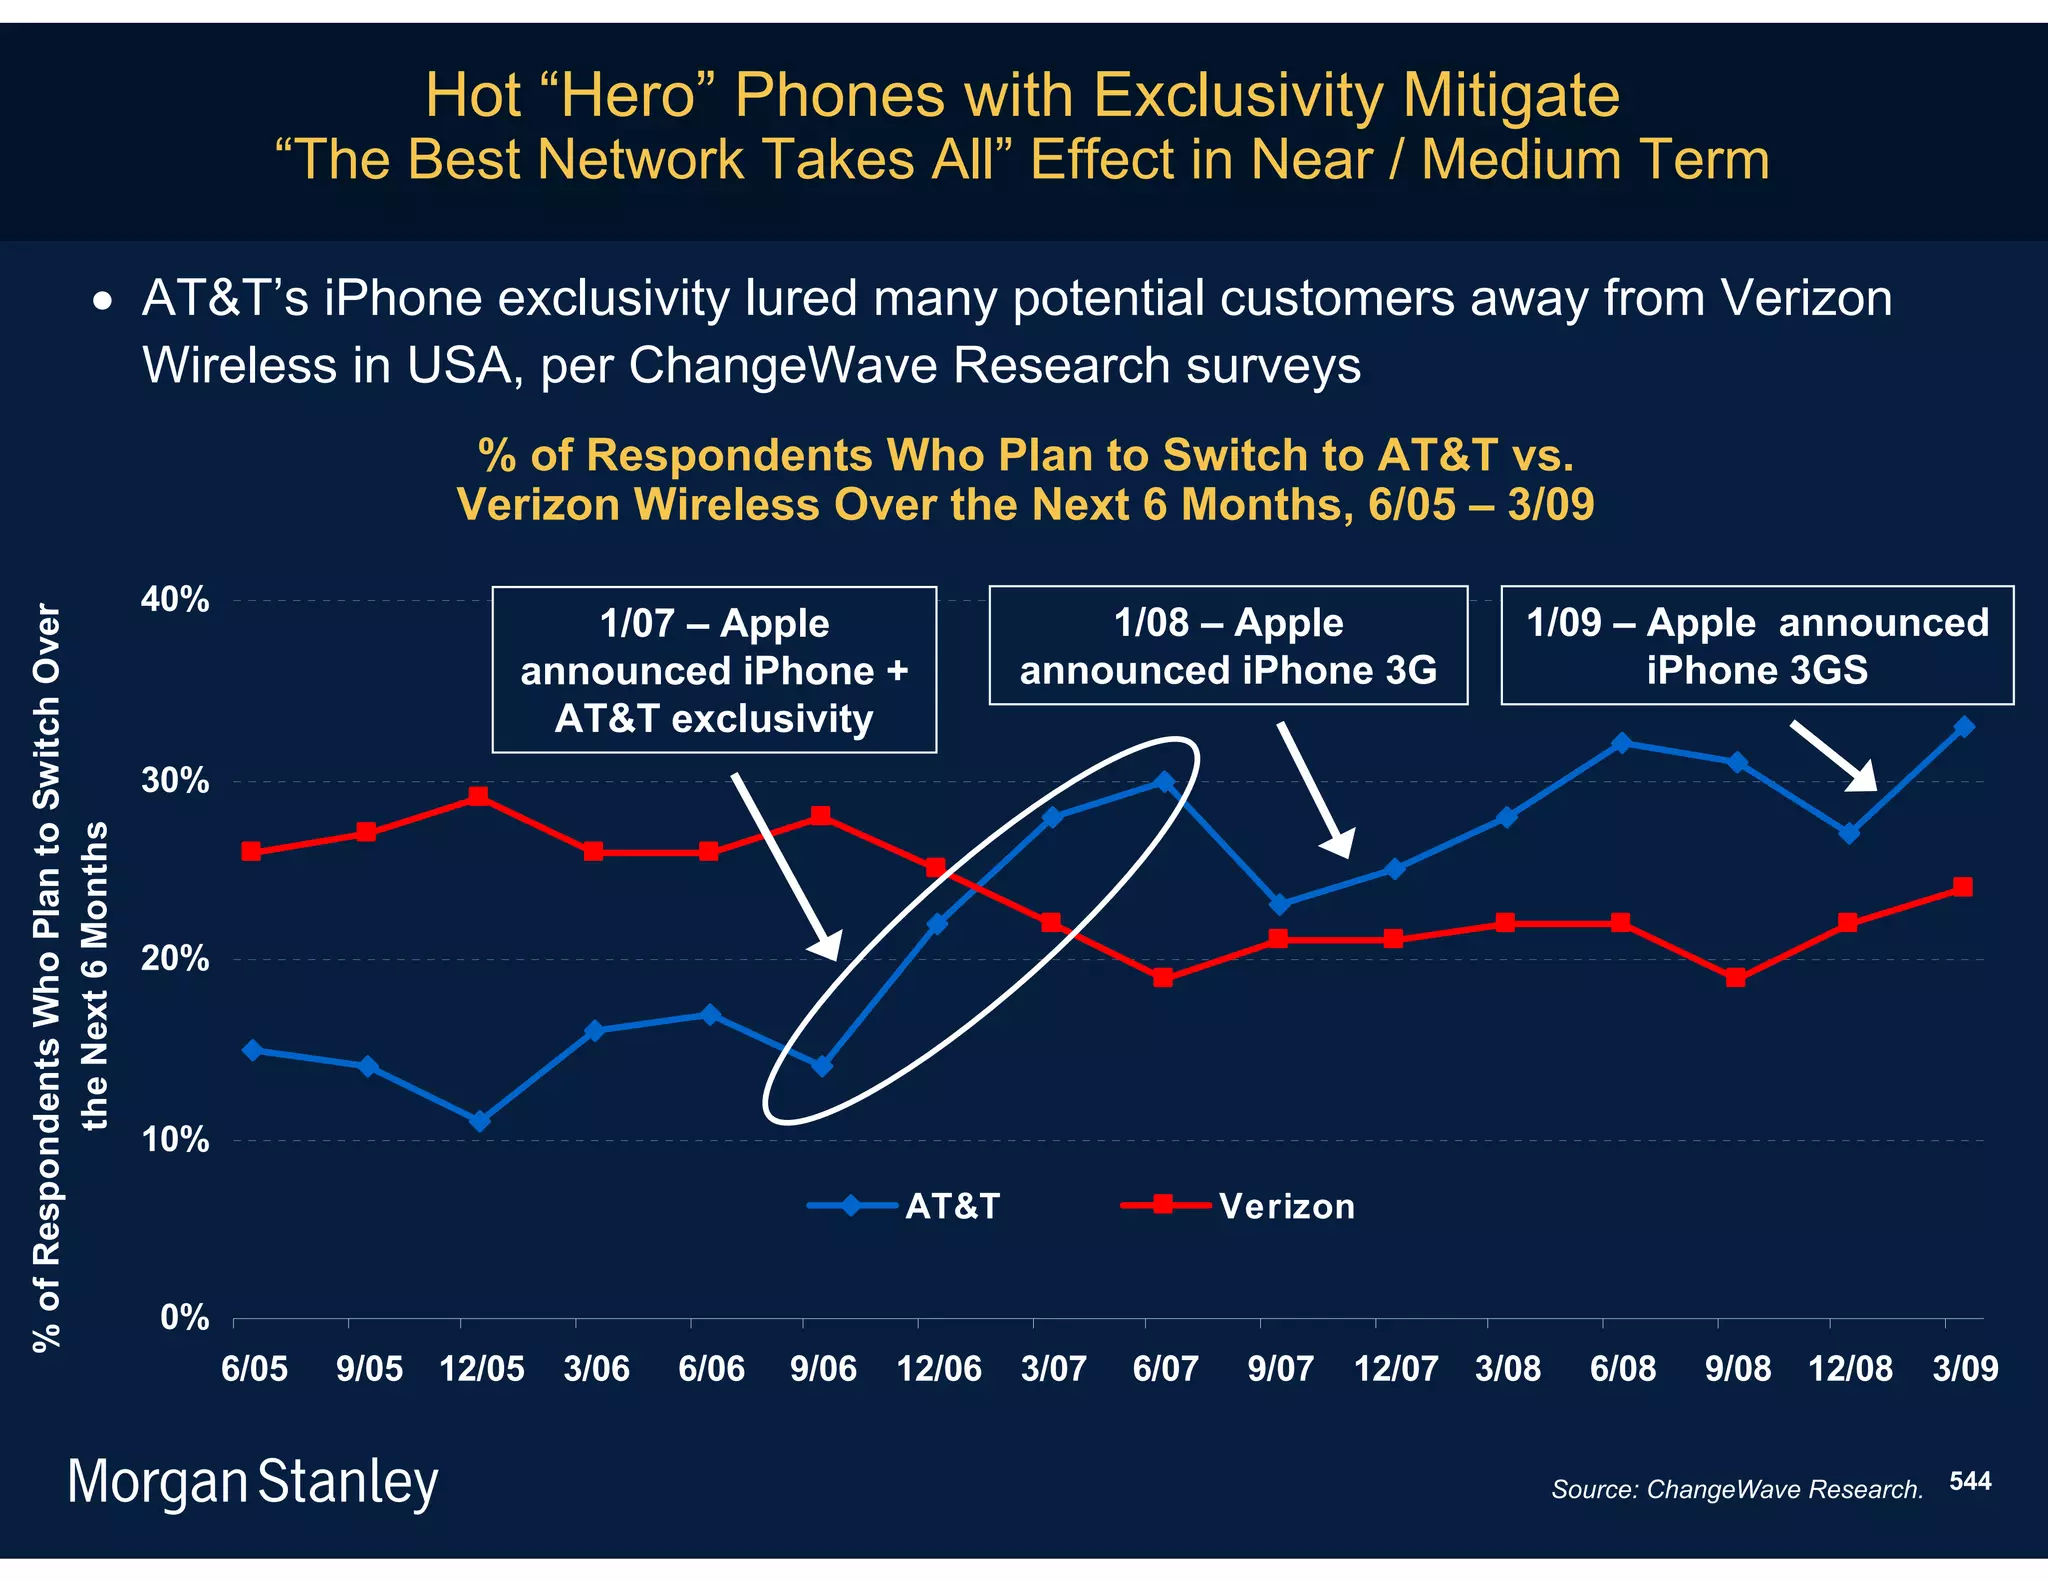
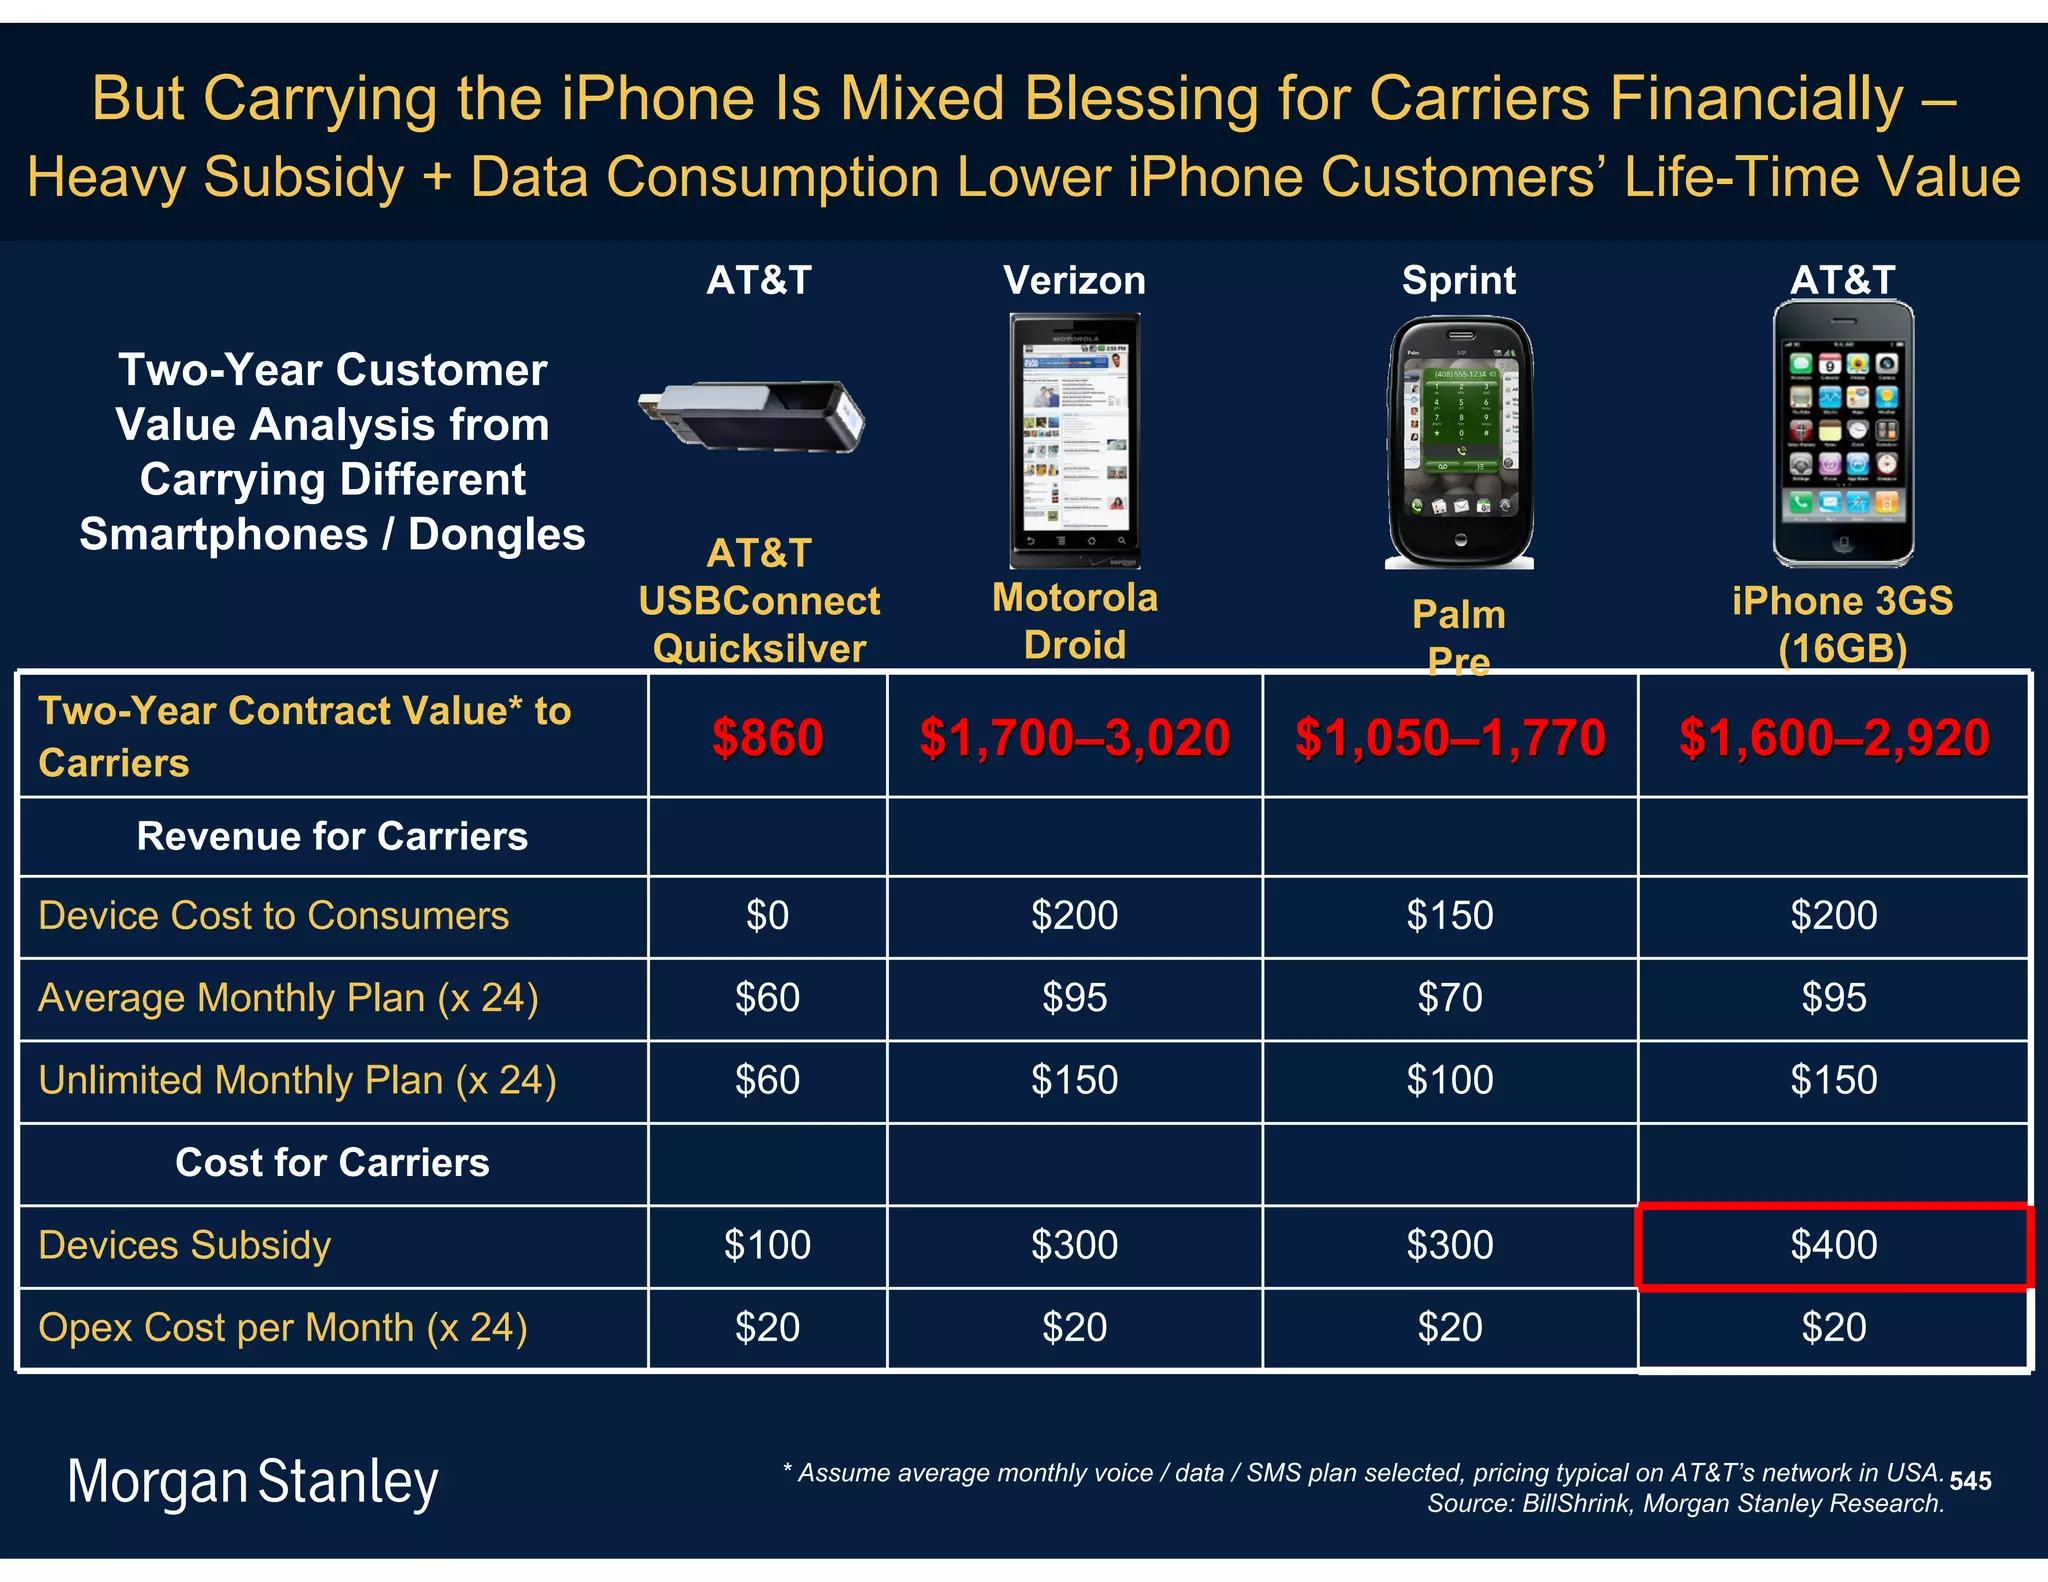
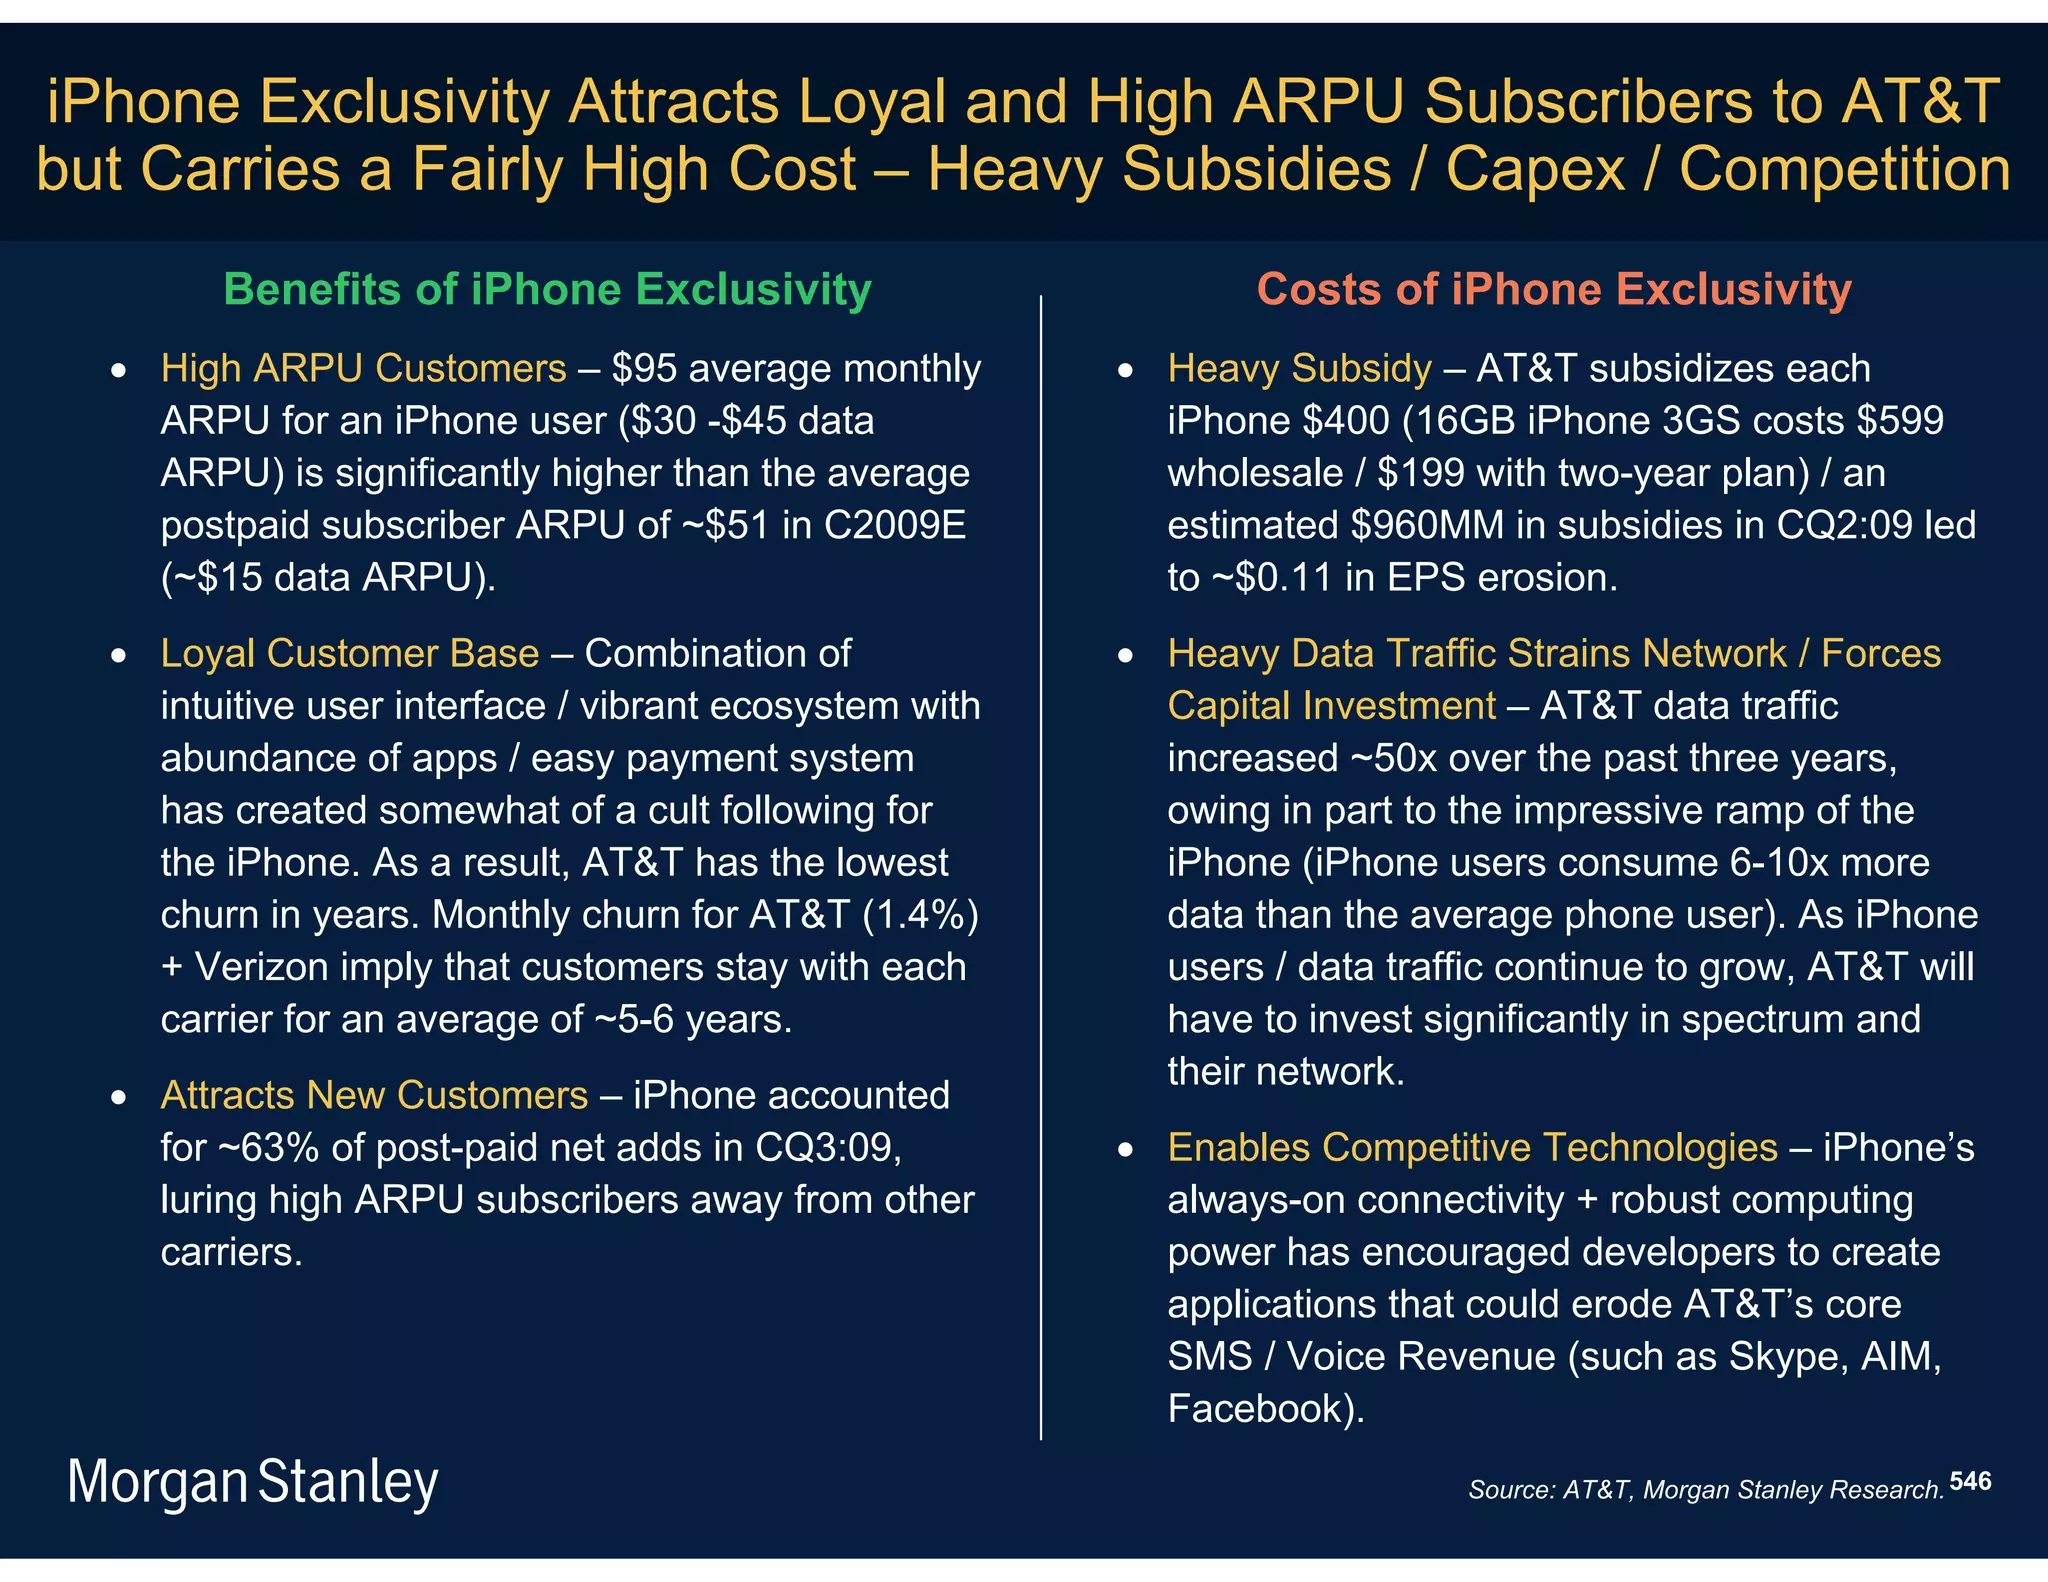
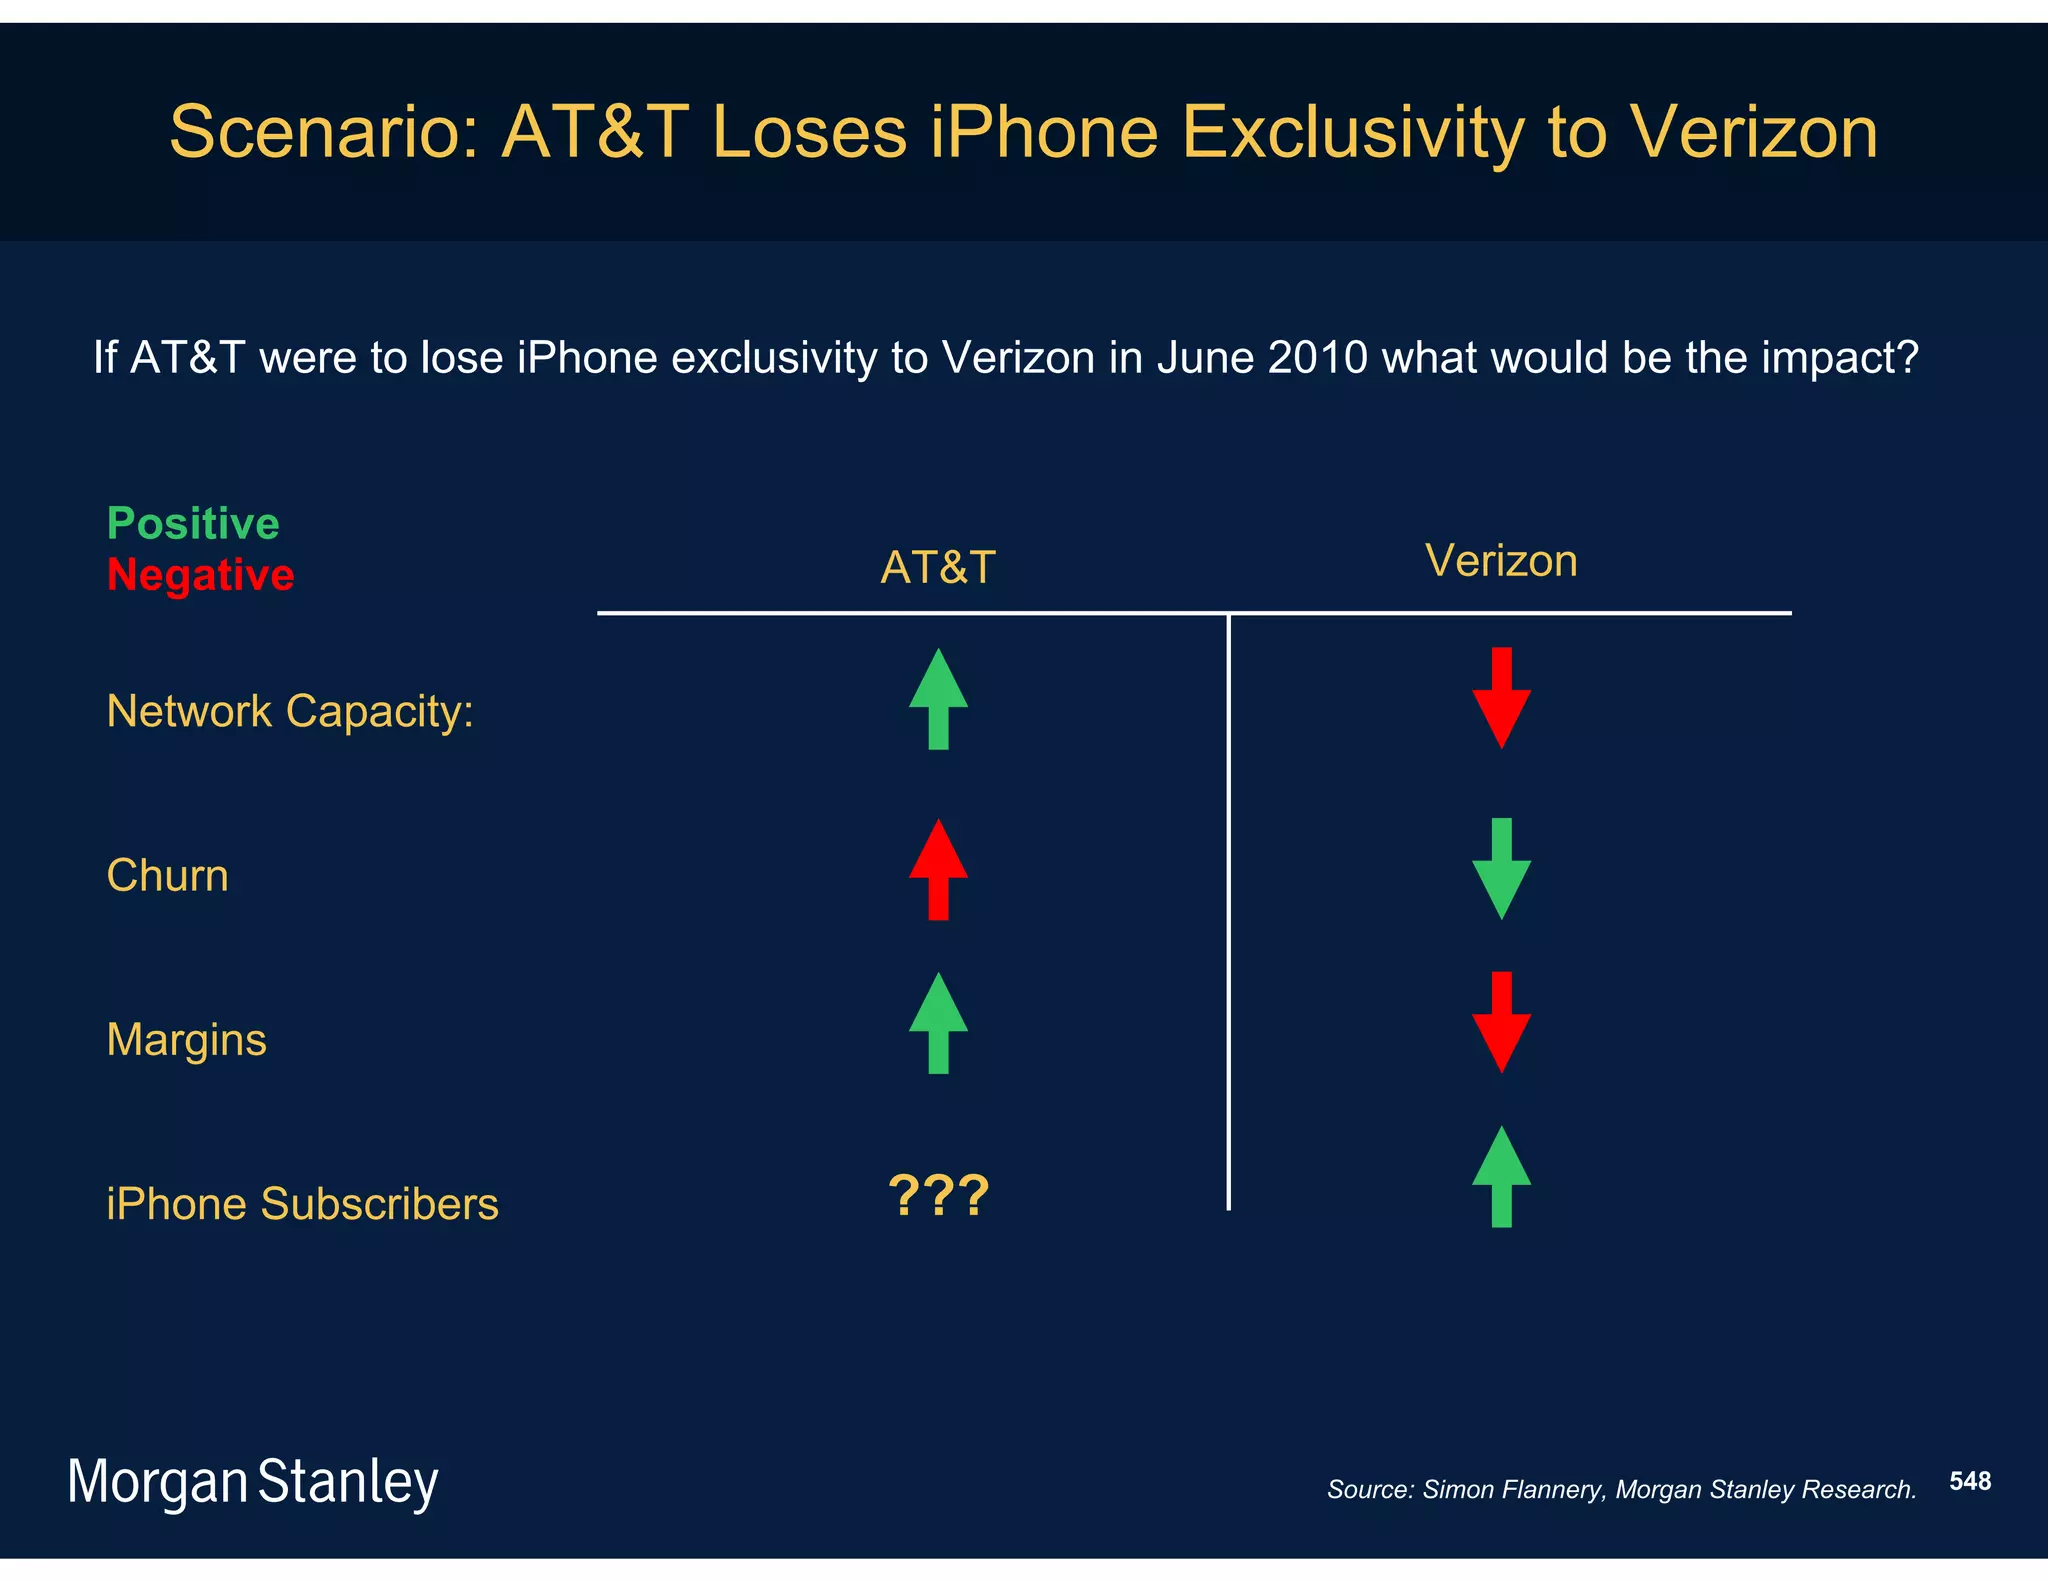
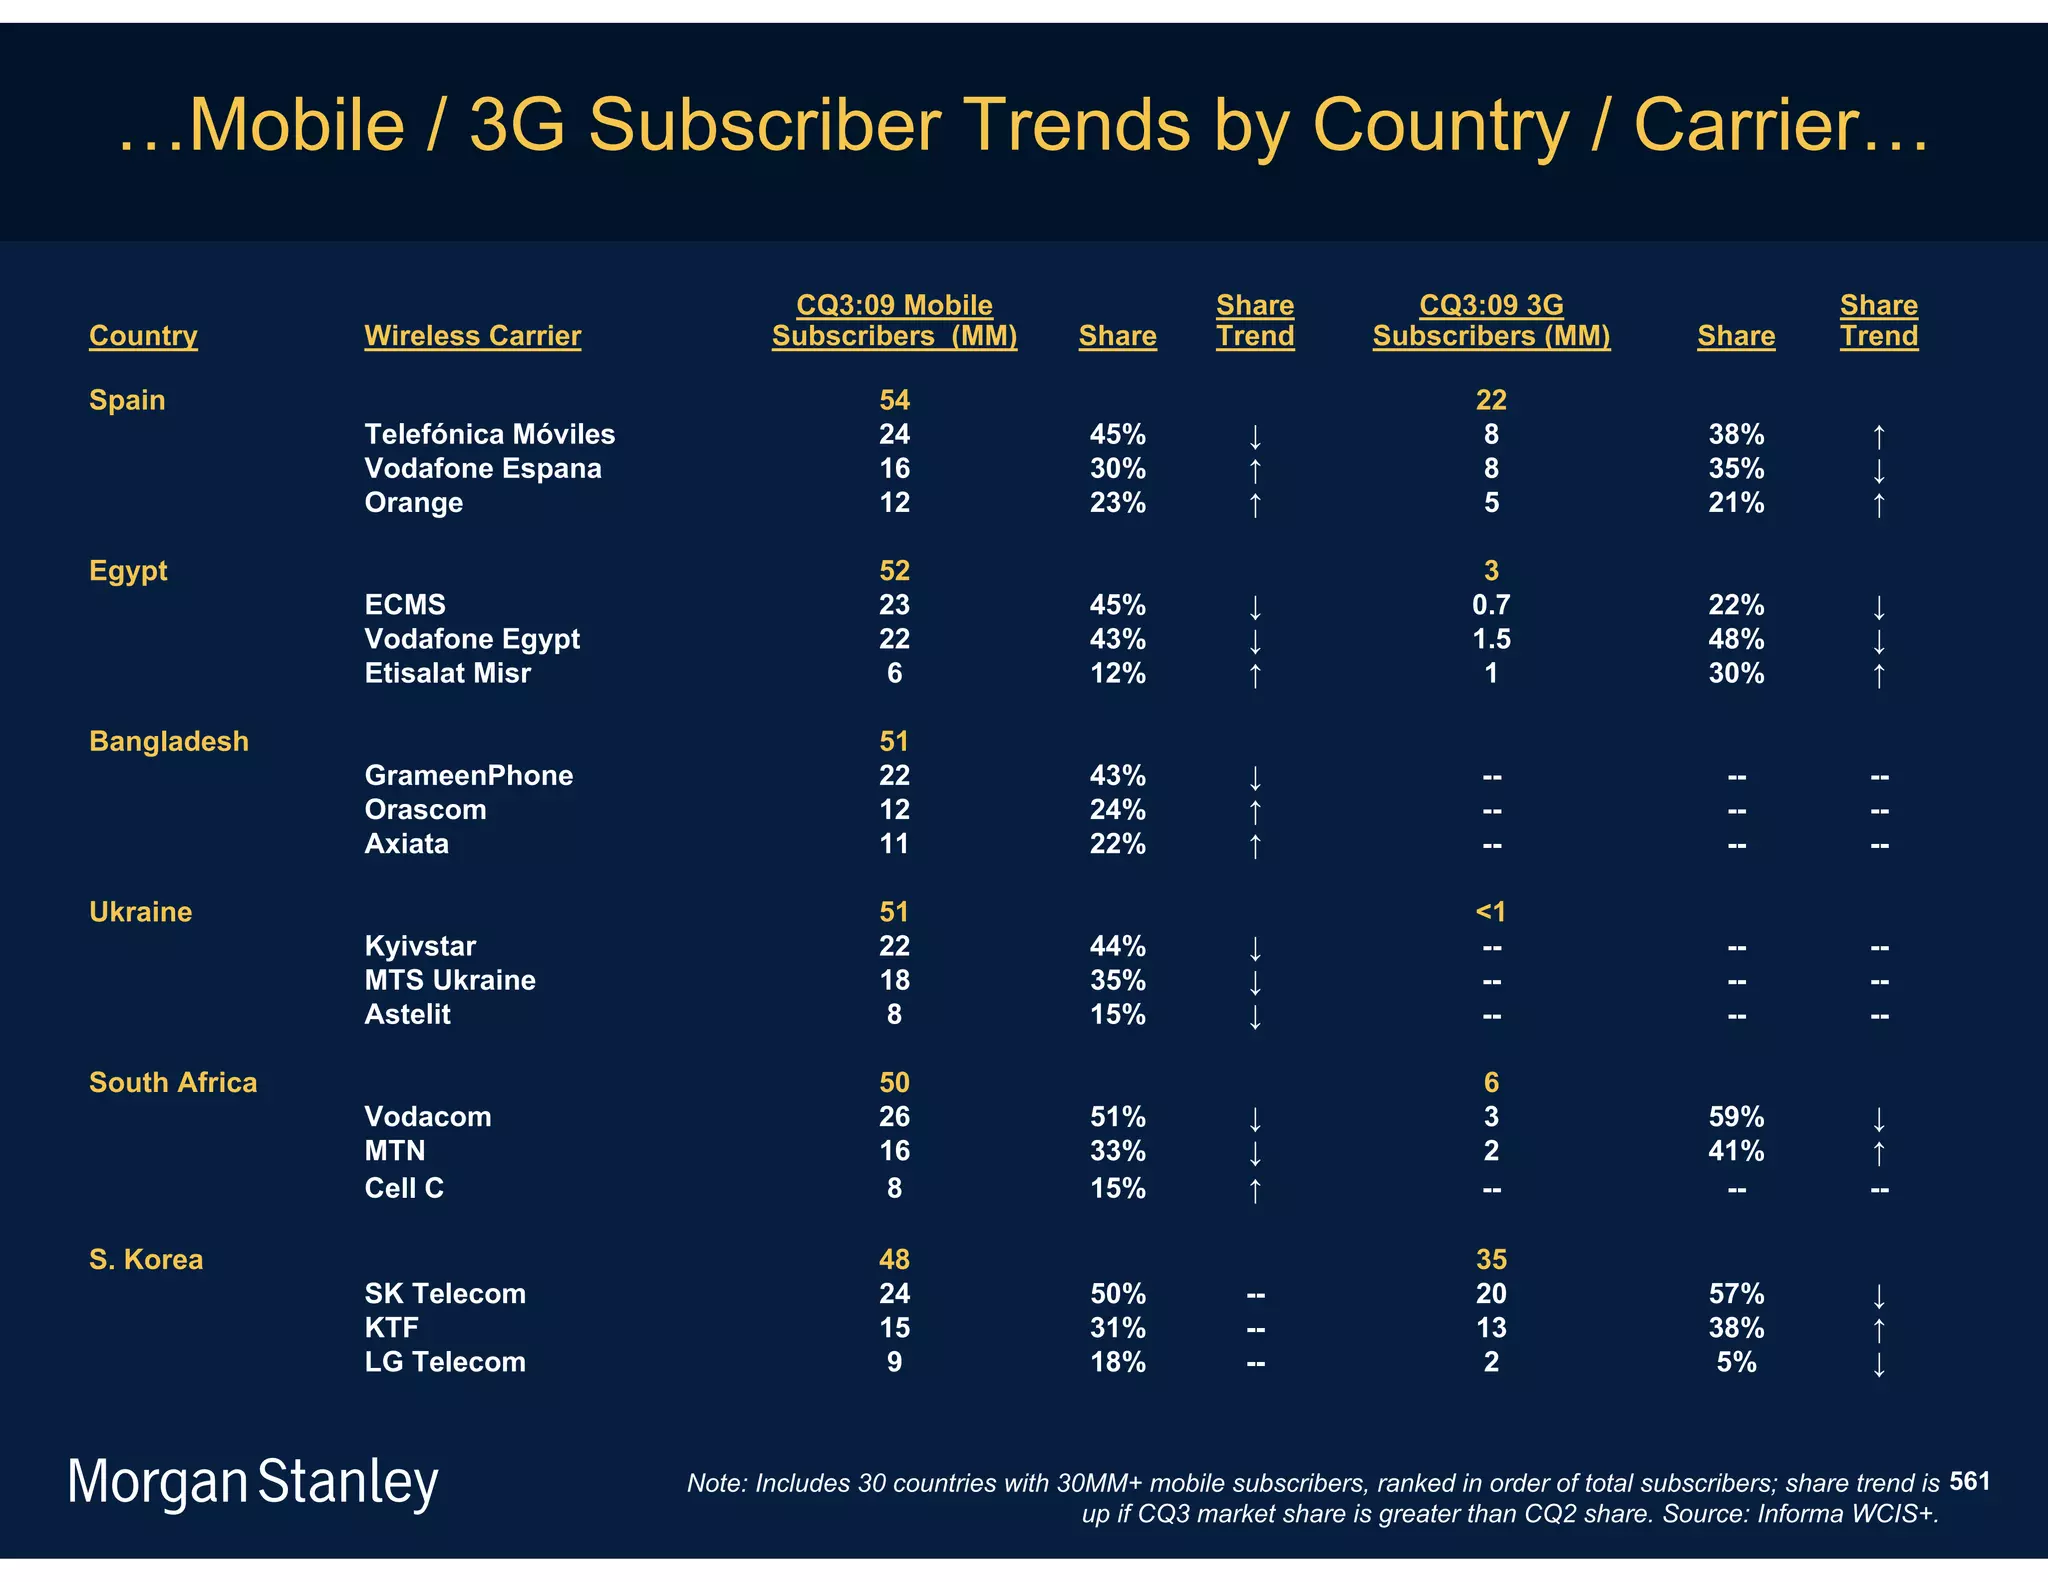
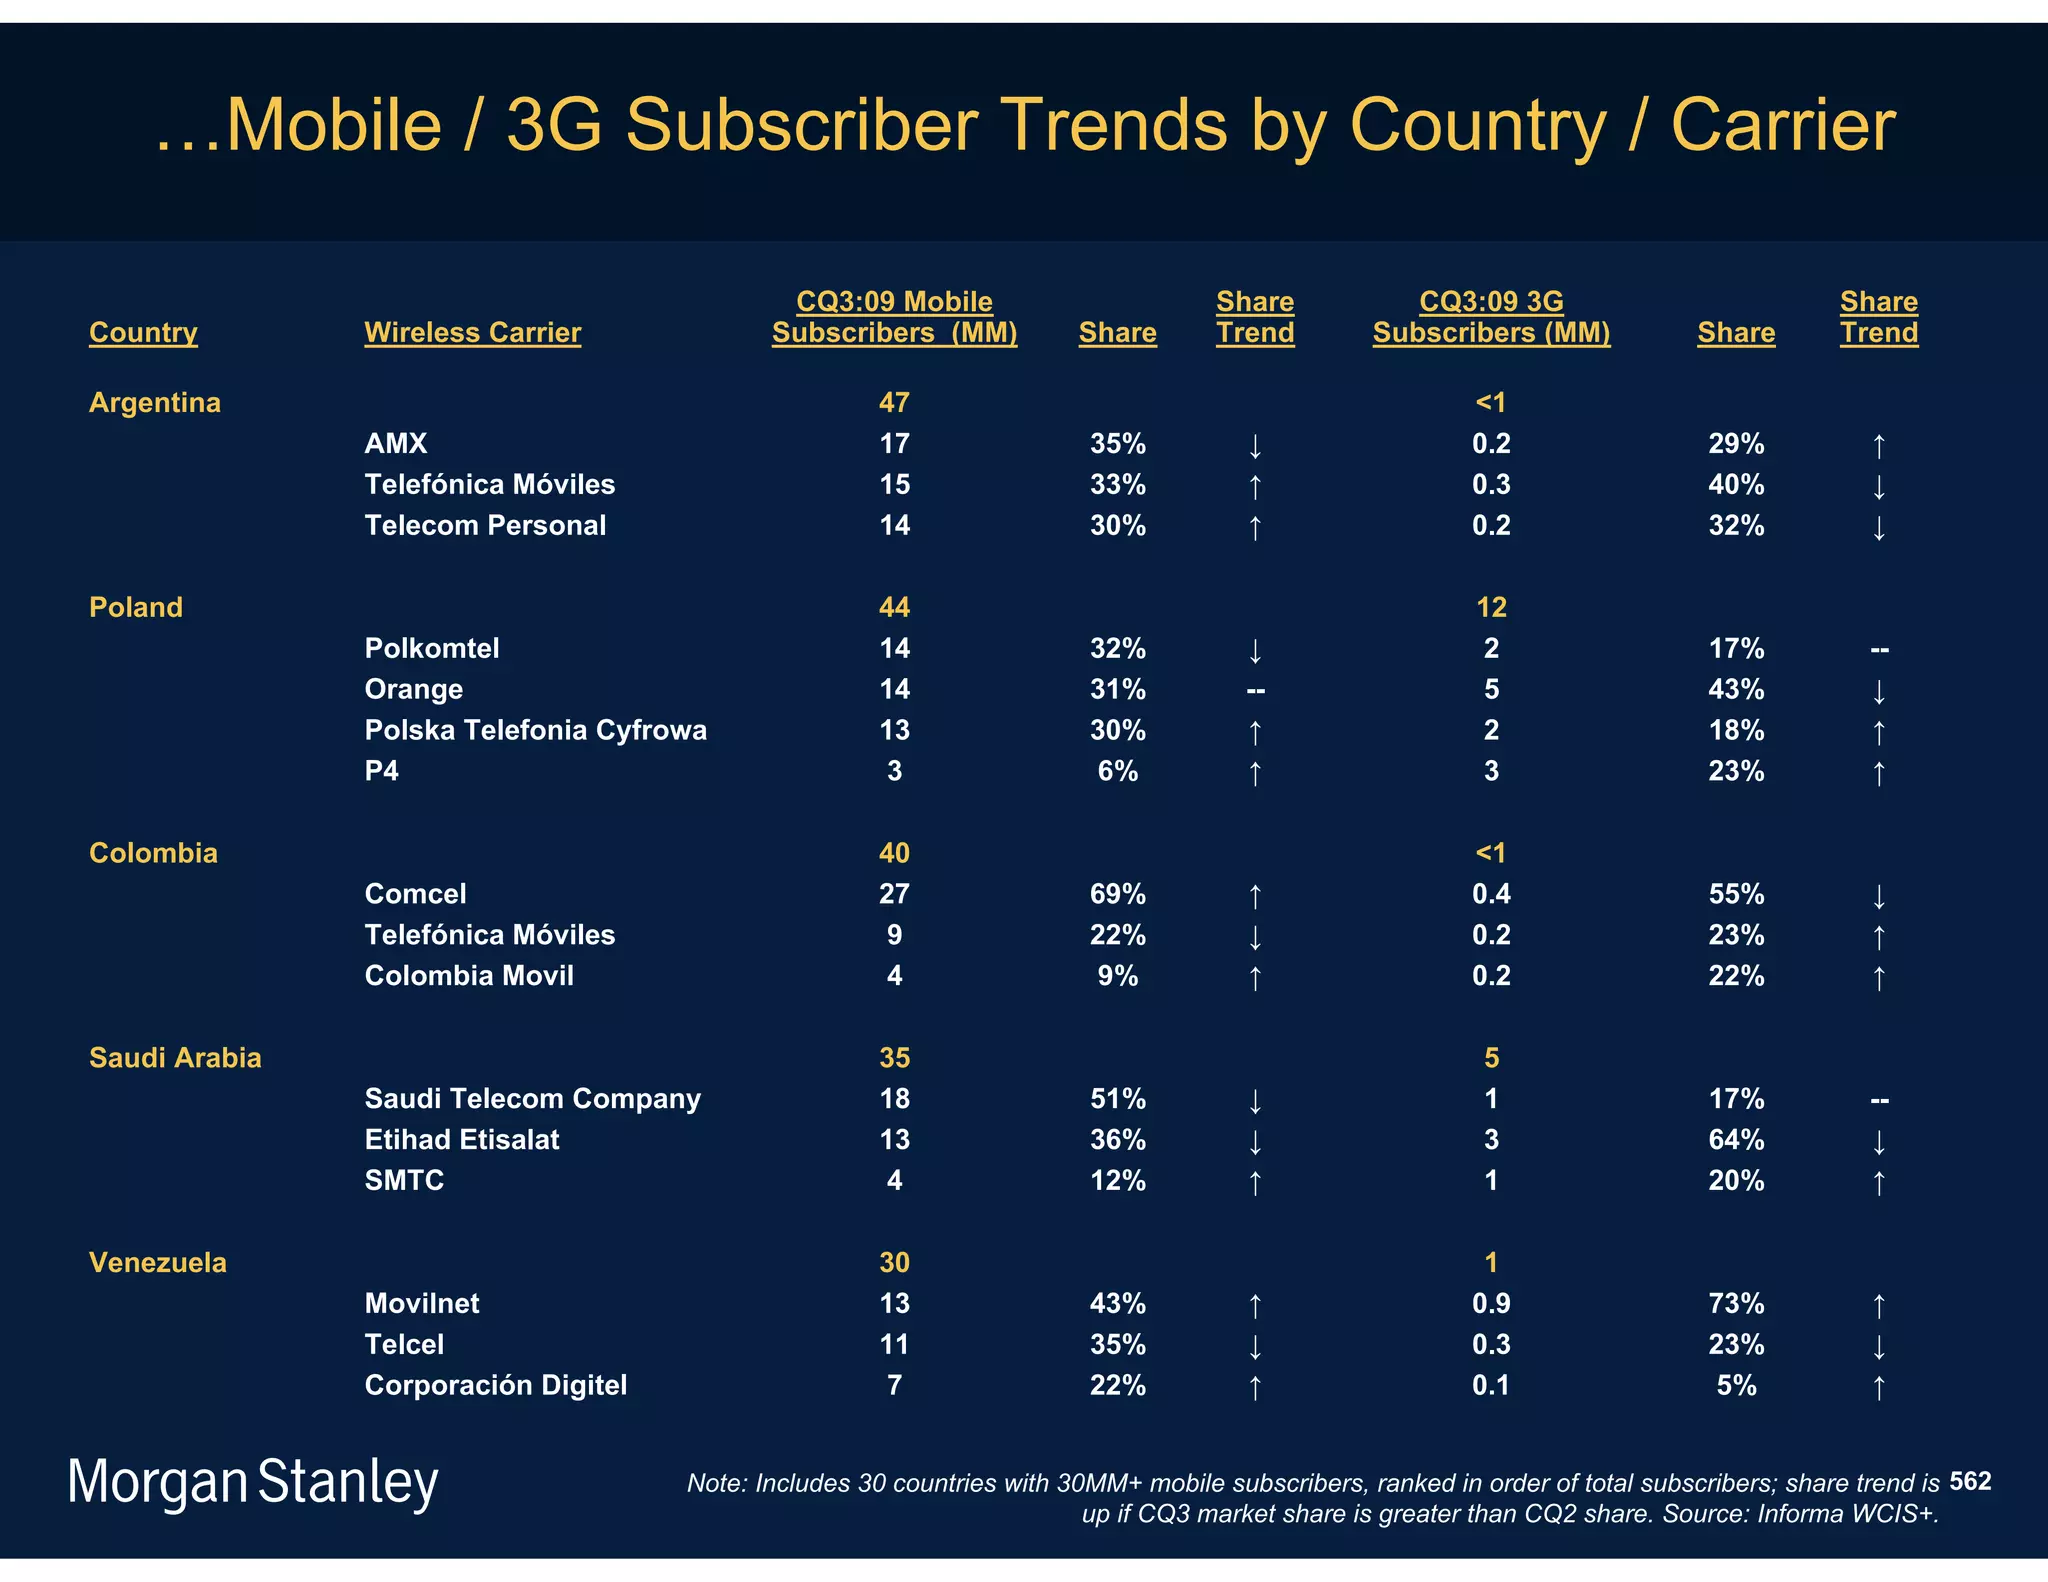
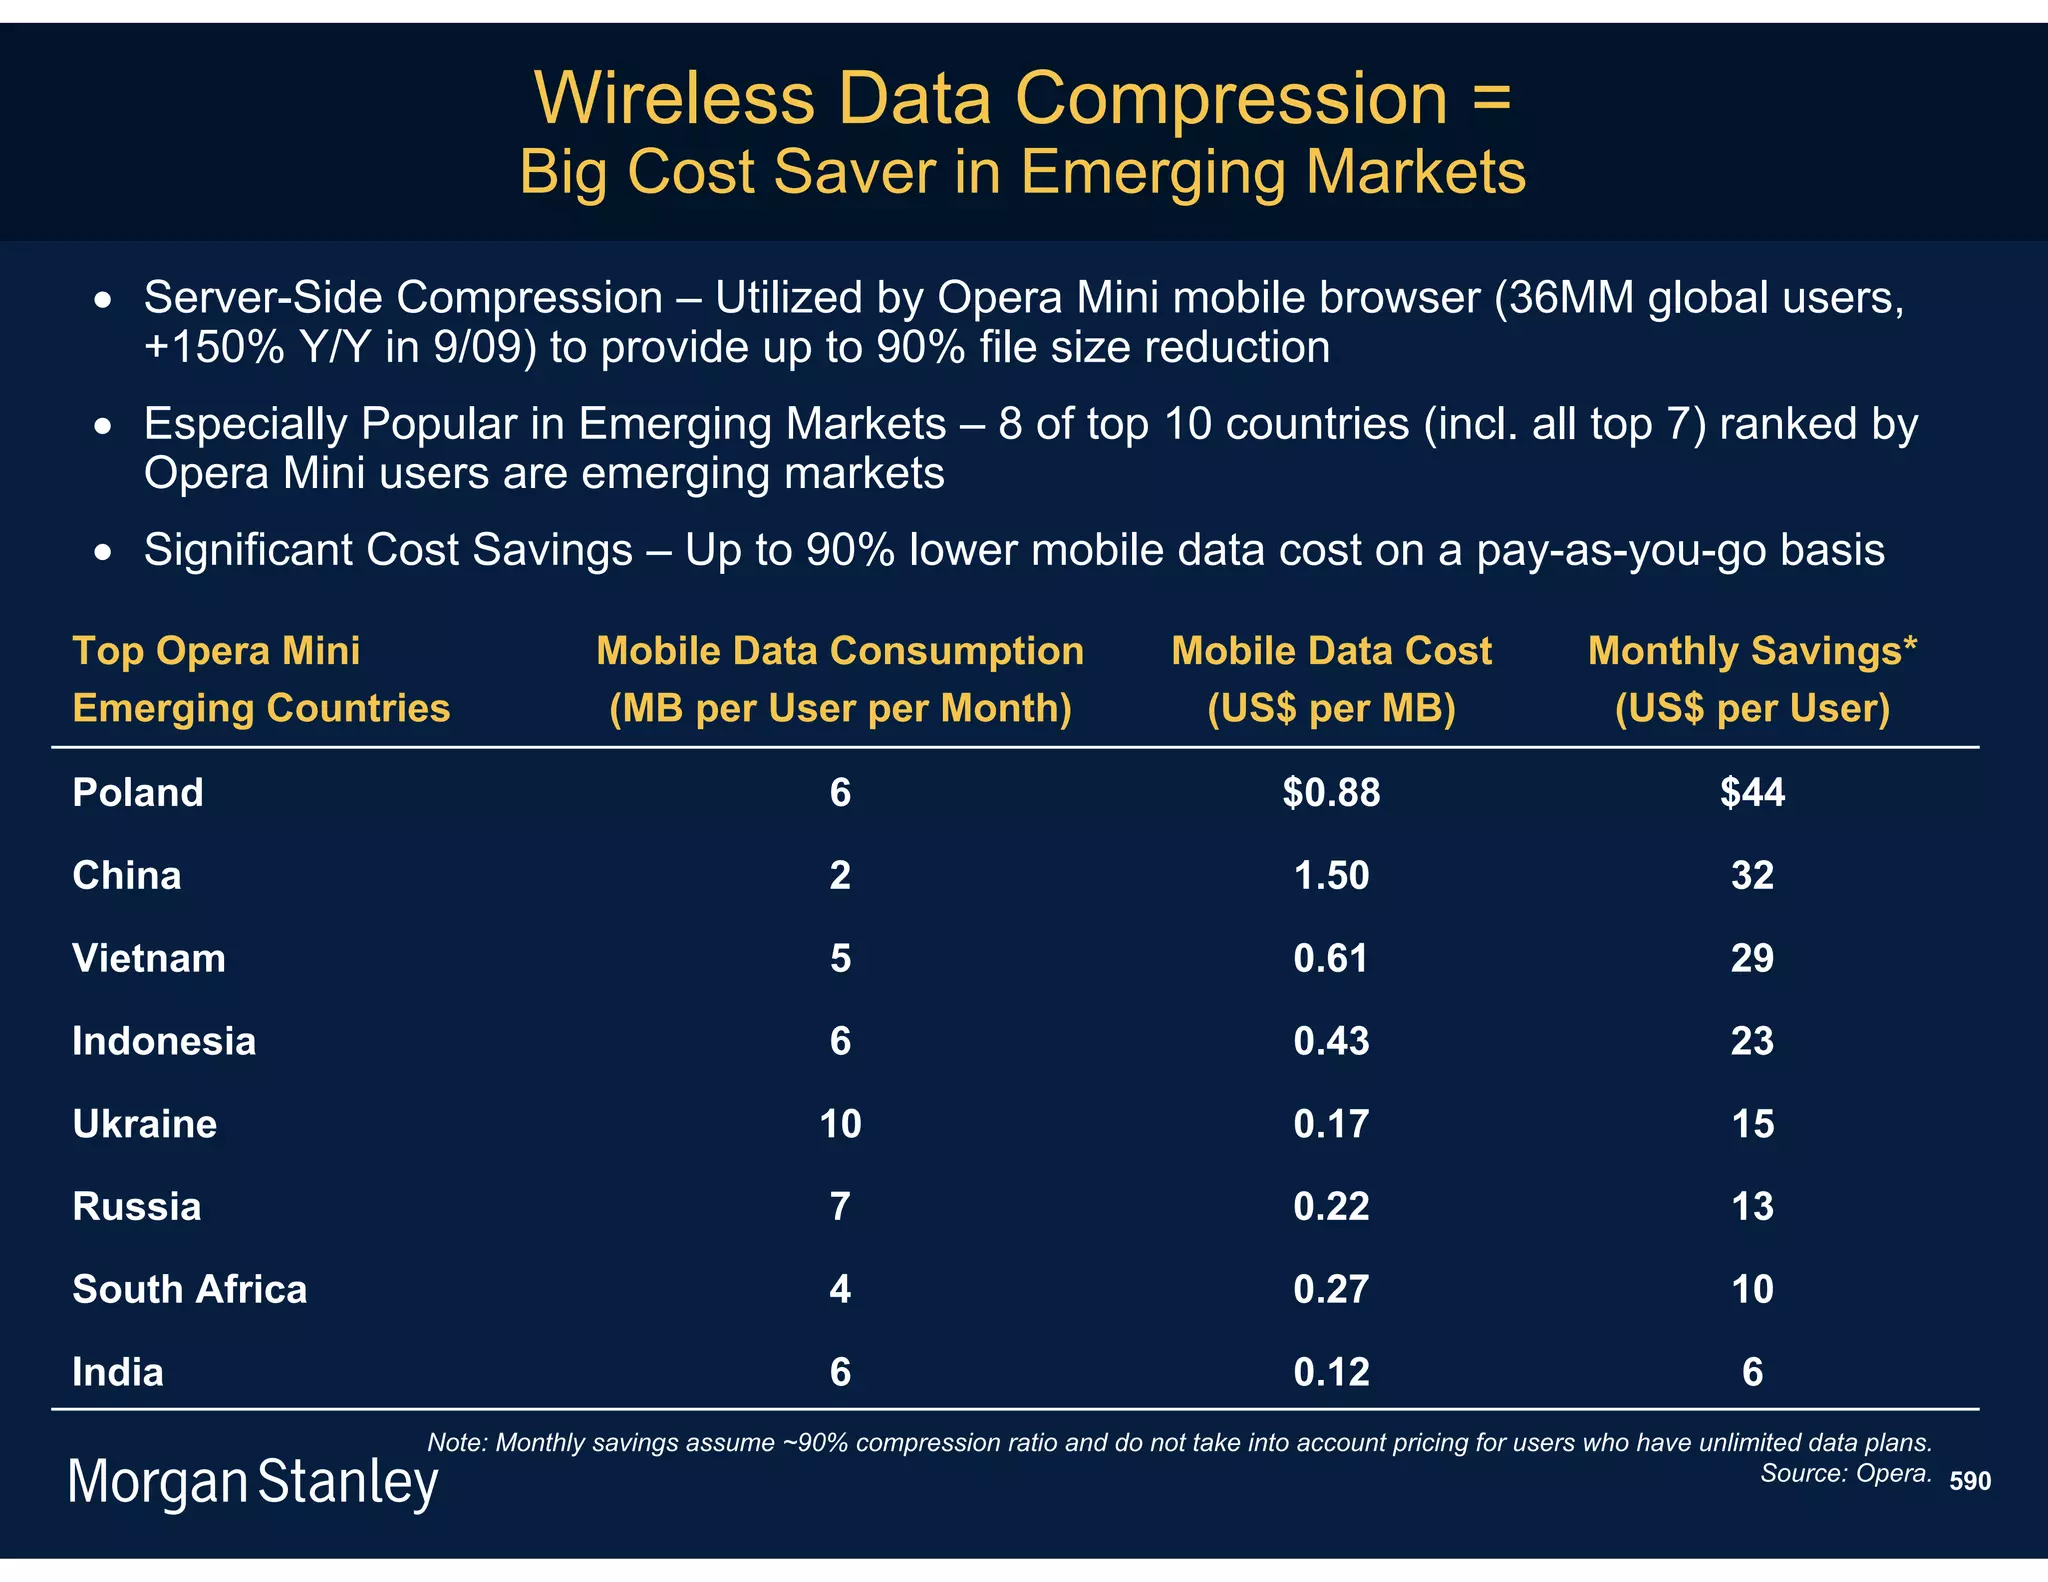
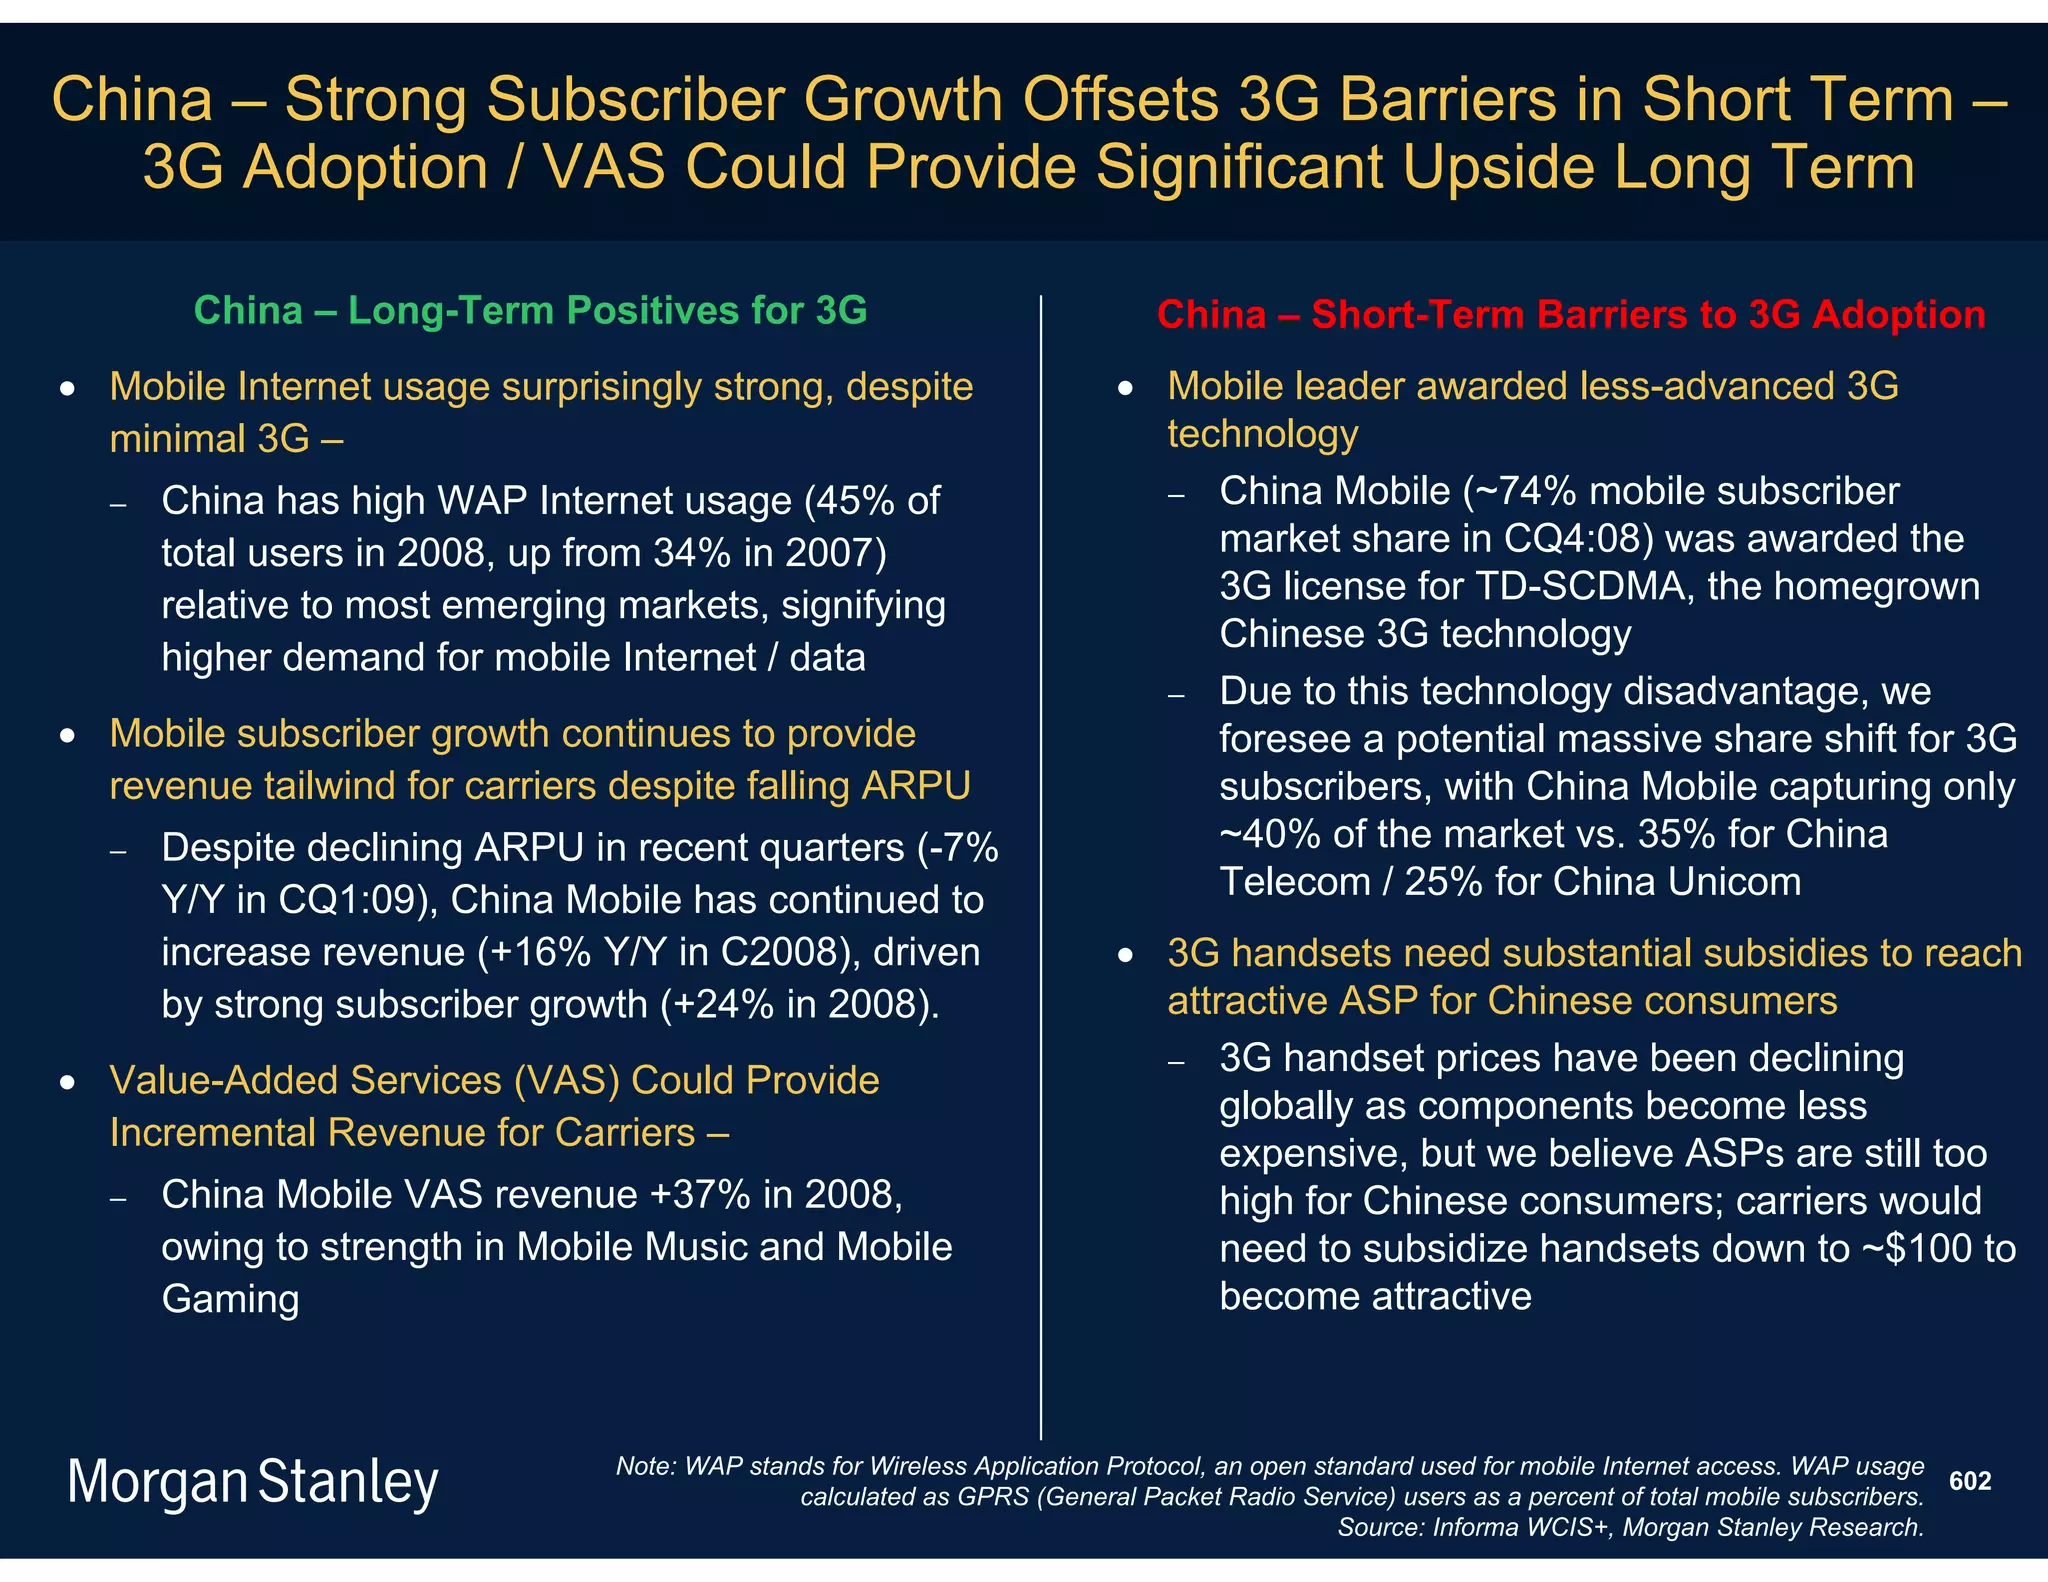
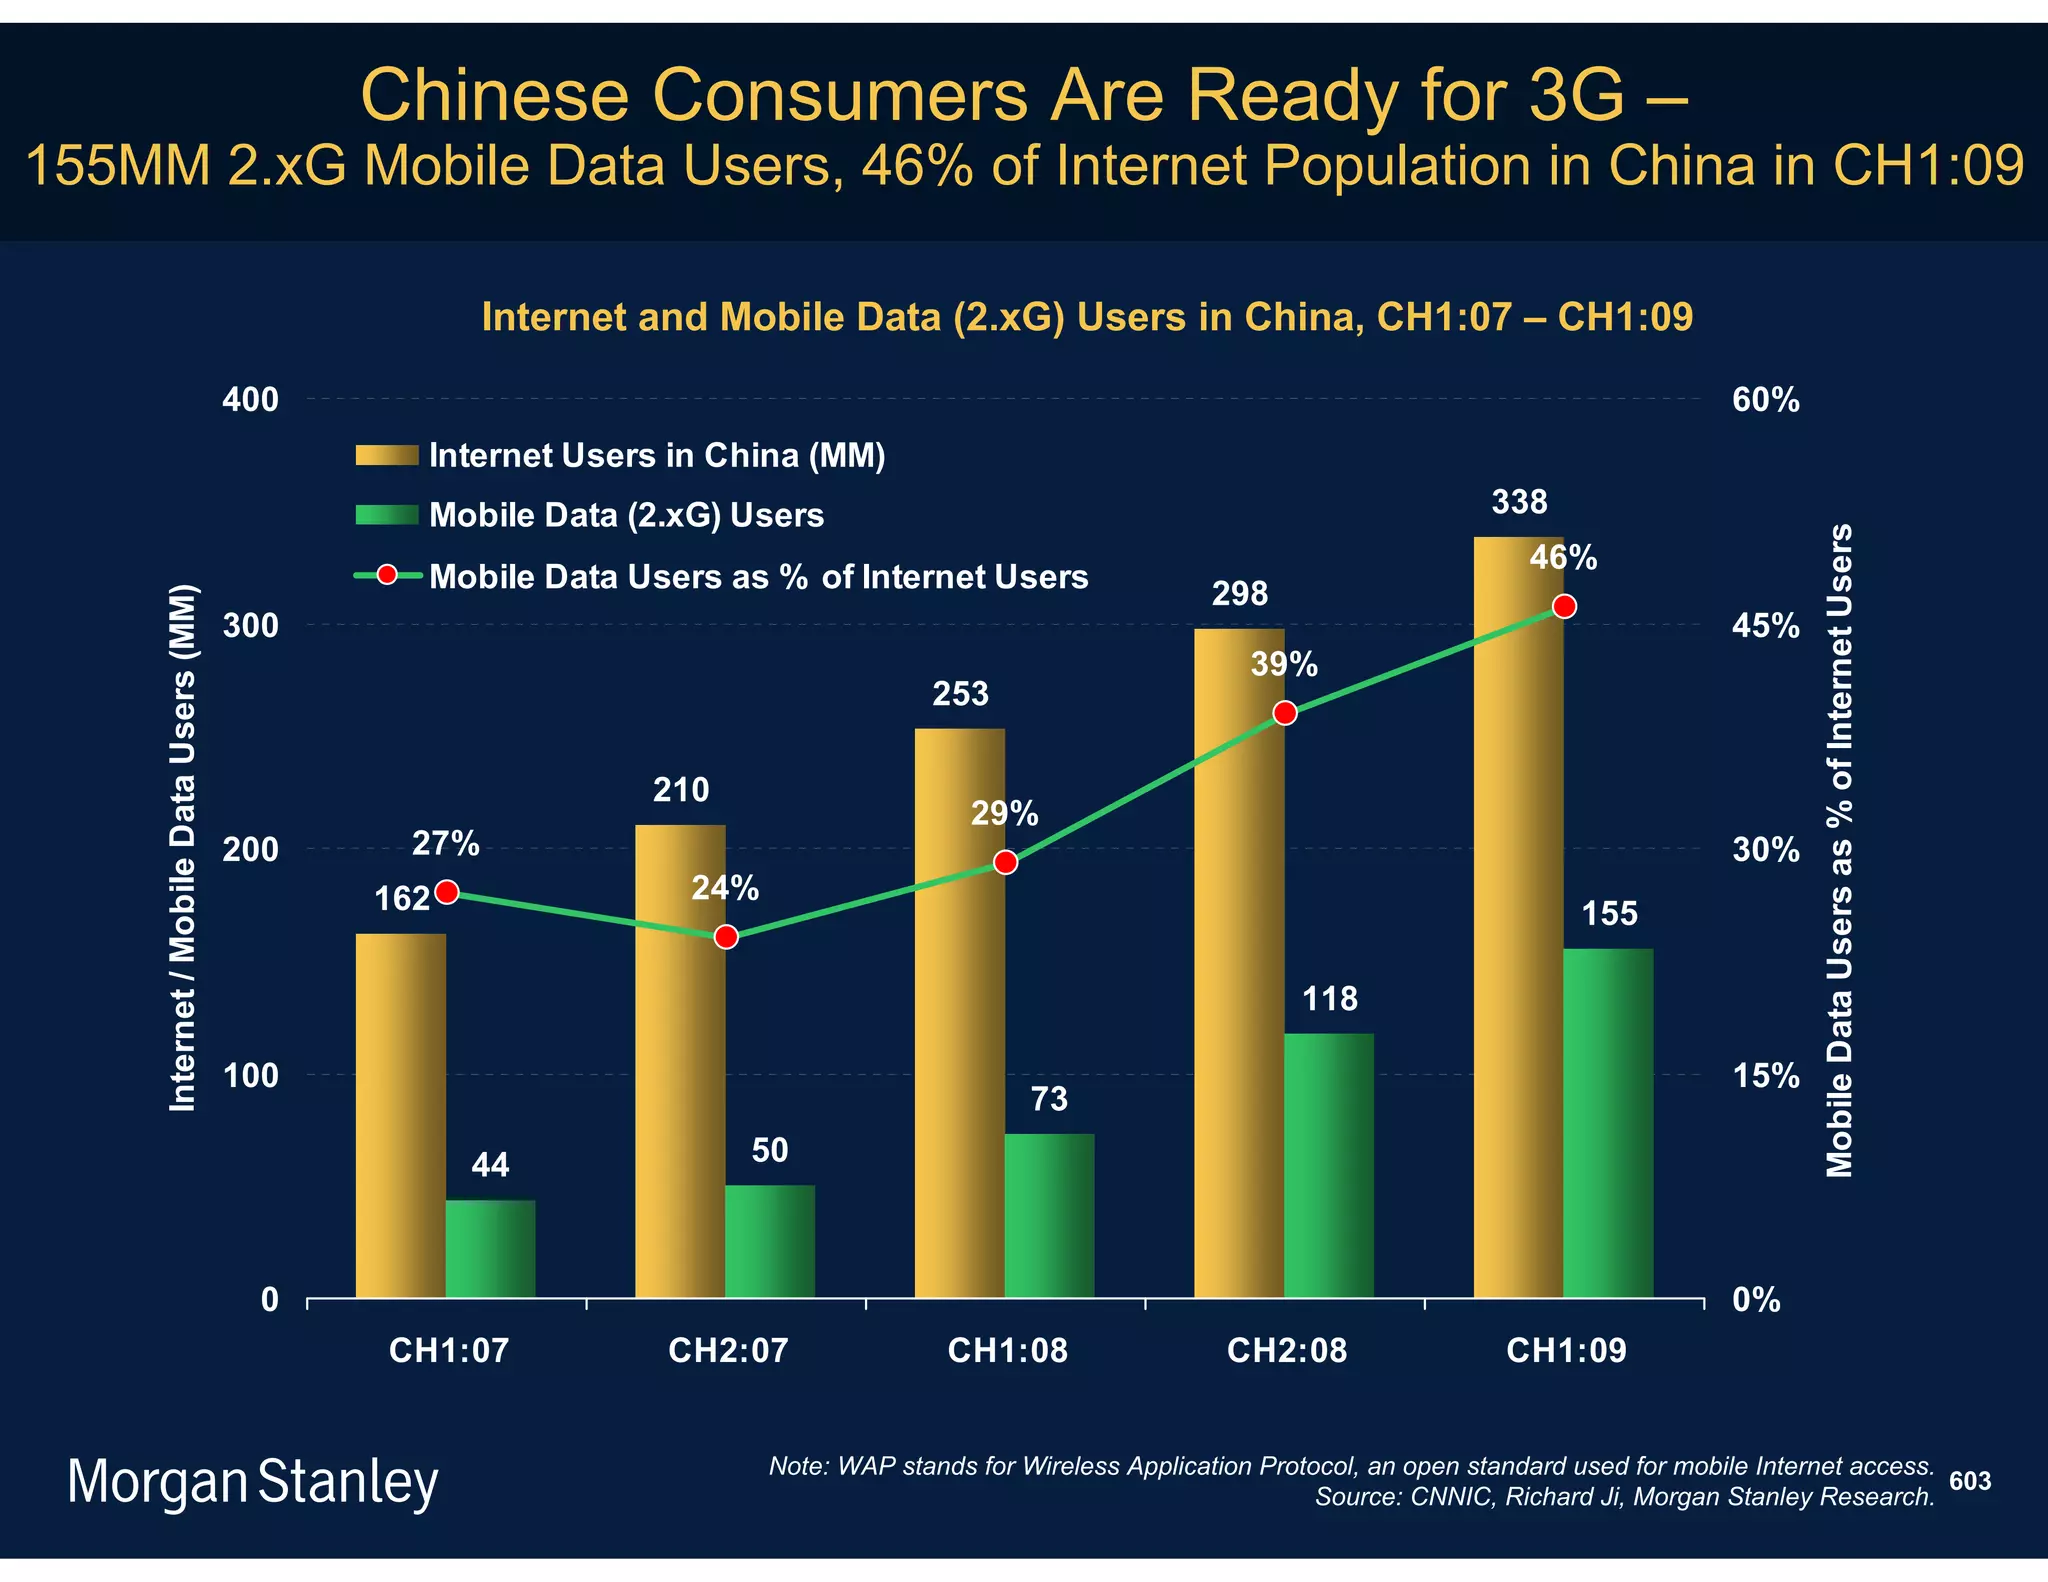
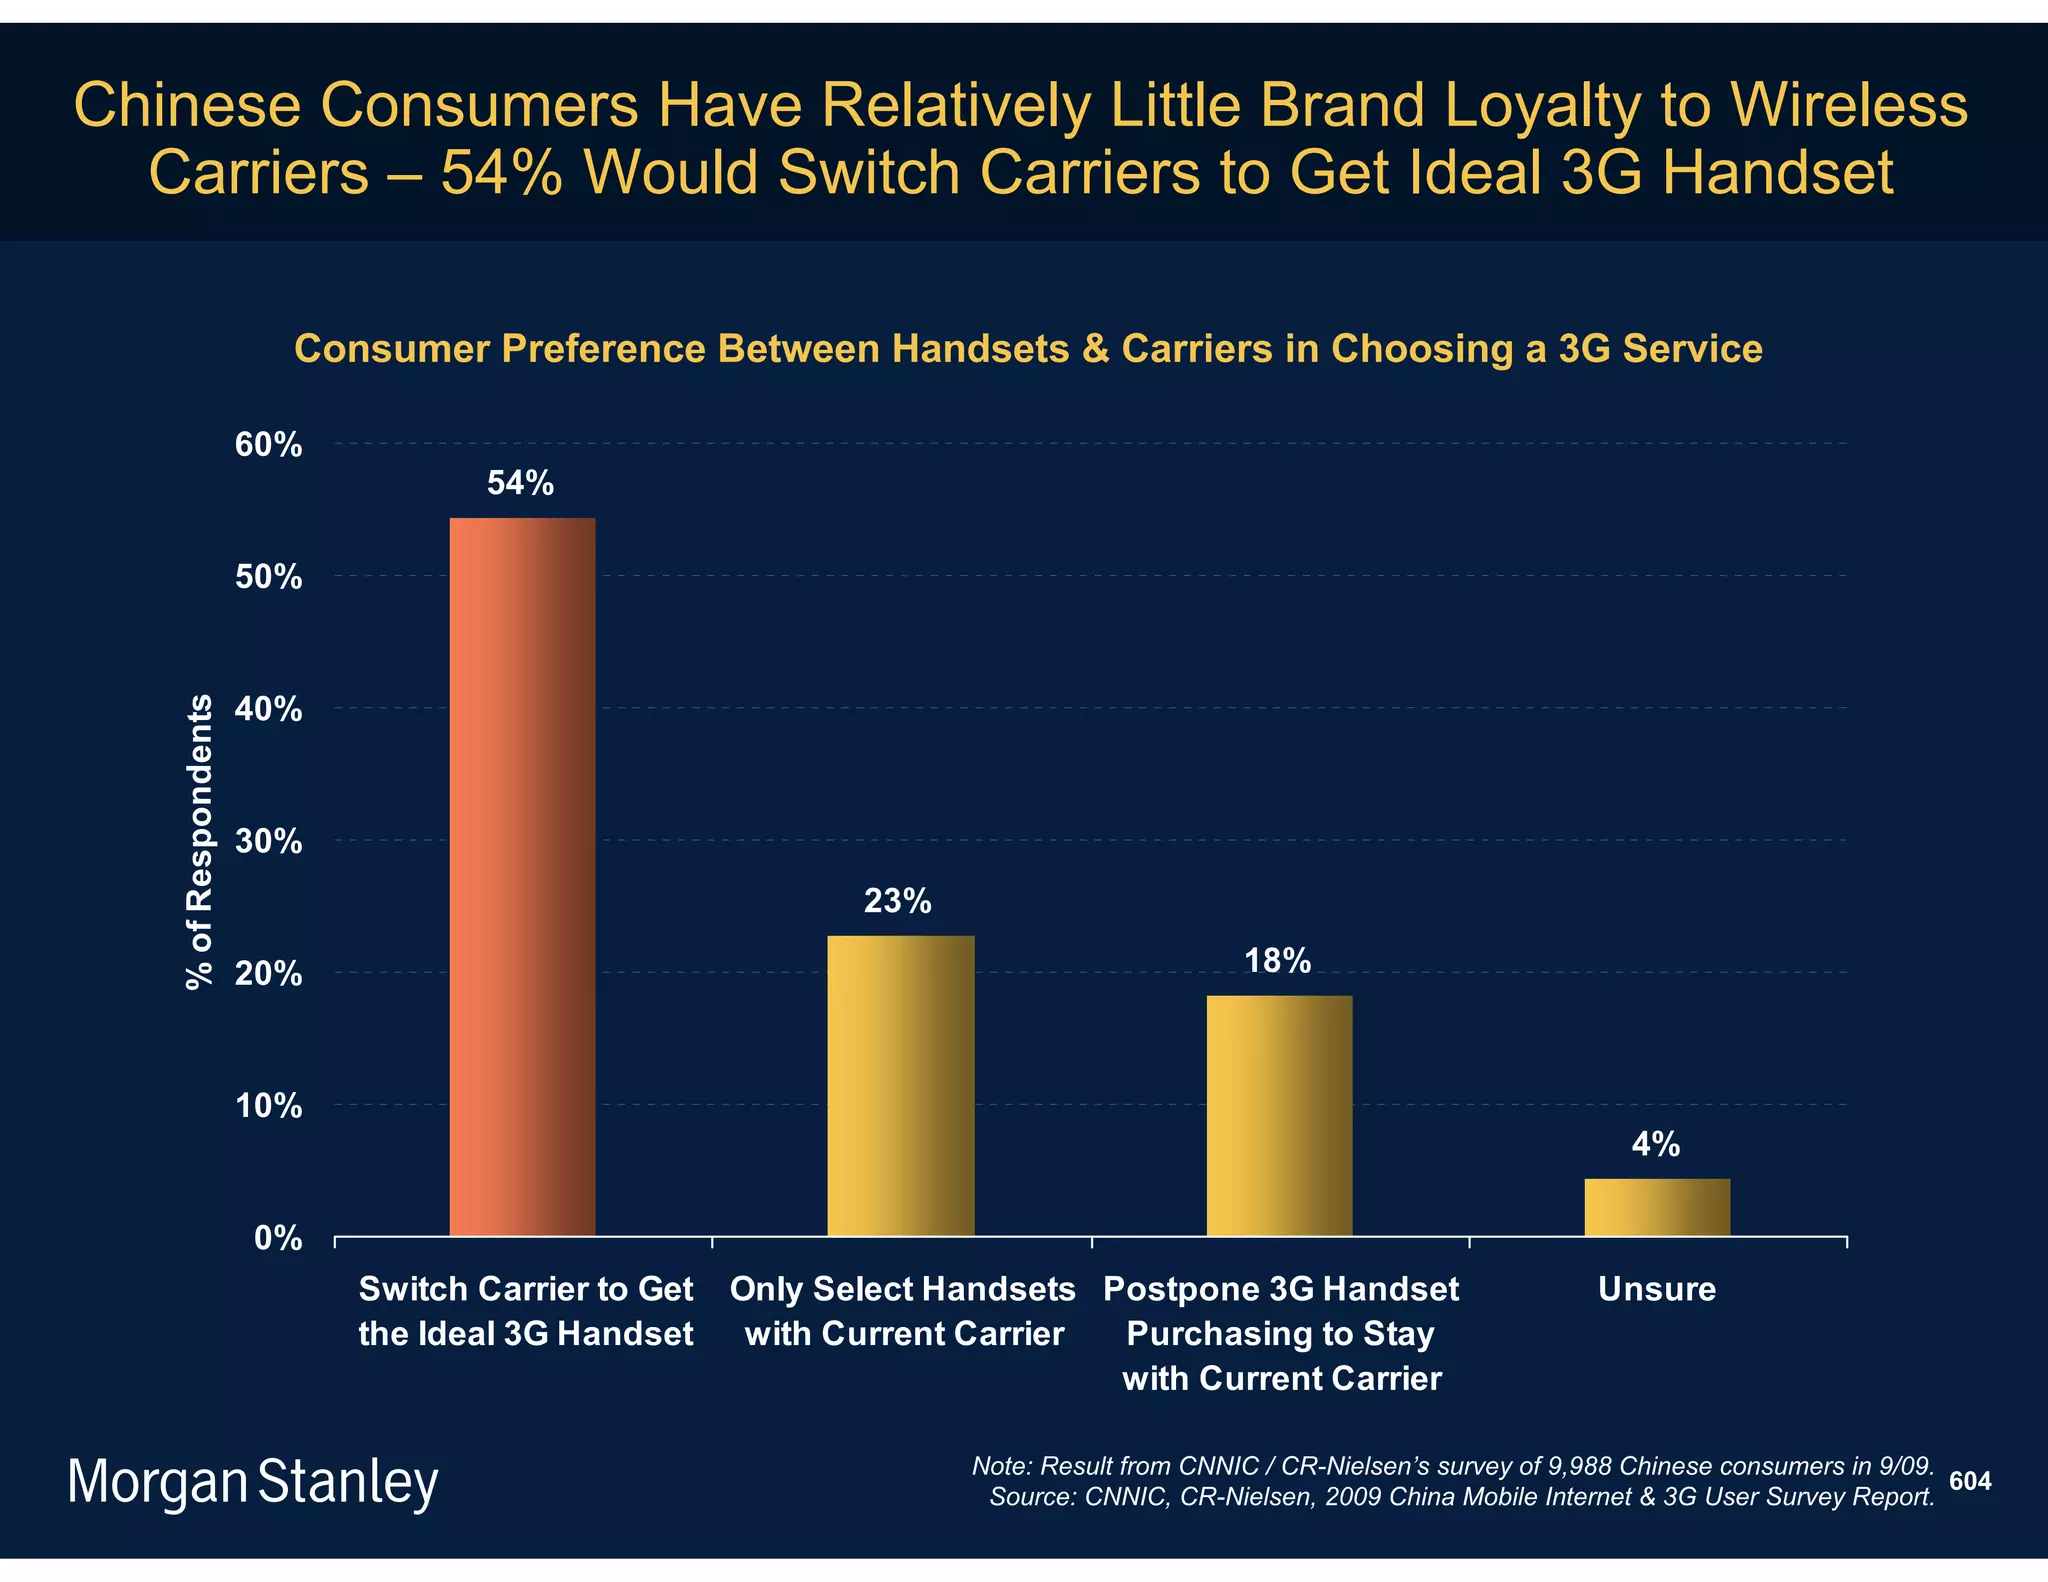
Download as PDF, PPTX

![Paul Saffo Opined About the Internet in 1995 -
Here We Are 14 Years Later
It's a very consistent pattern in this business that collectively as
a society and as individuals we all suffer from what I call macro-
myopia. A pattern where our hopes and our expectations or our
fears about the threatened impact of some new technology
causes us to overestimate its short-term impacts and reality
always fails to meet those inflated expectations. And as a result
our disappointment then leads us to turn around and
underestimate the long-term implications and I can guarantee
you this time will be no different. The short-term impact of this
stuff [the Internet] will be less than the hype would suggest but
the long-term implications will be vastly larger than we can
possibly imagine today.
- Paul Saffo, 6/12/1995
Note: Paul Saffo was a director of the Institute for the Future, a consulting group that studies technology and future trends. 14
Source: Interview with PBS in Palo Alto, CA. 6/12/1995.](https://image.slidesharecdn.com/mobileinternetreportkeythemesfinal-100425034727-phpapp02/75/Mobile-internet-report_key_themes_final-14-2048.jpg)


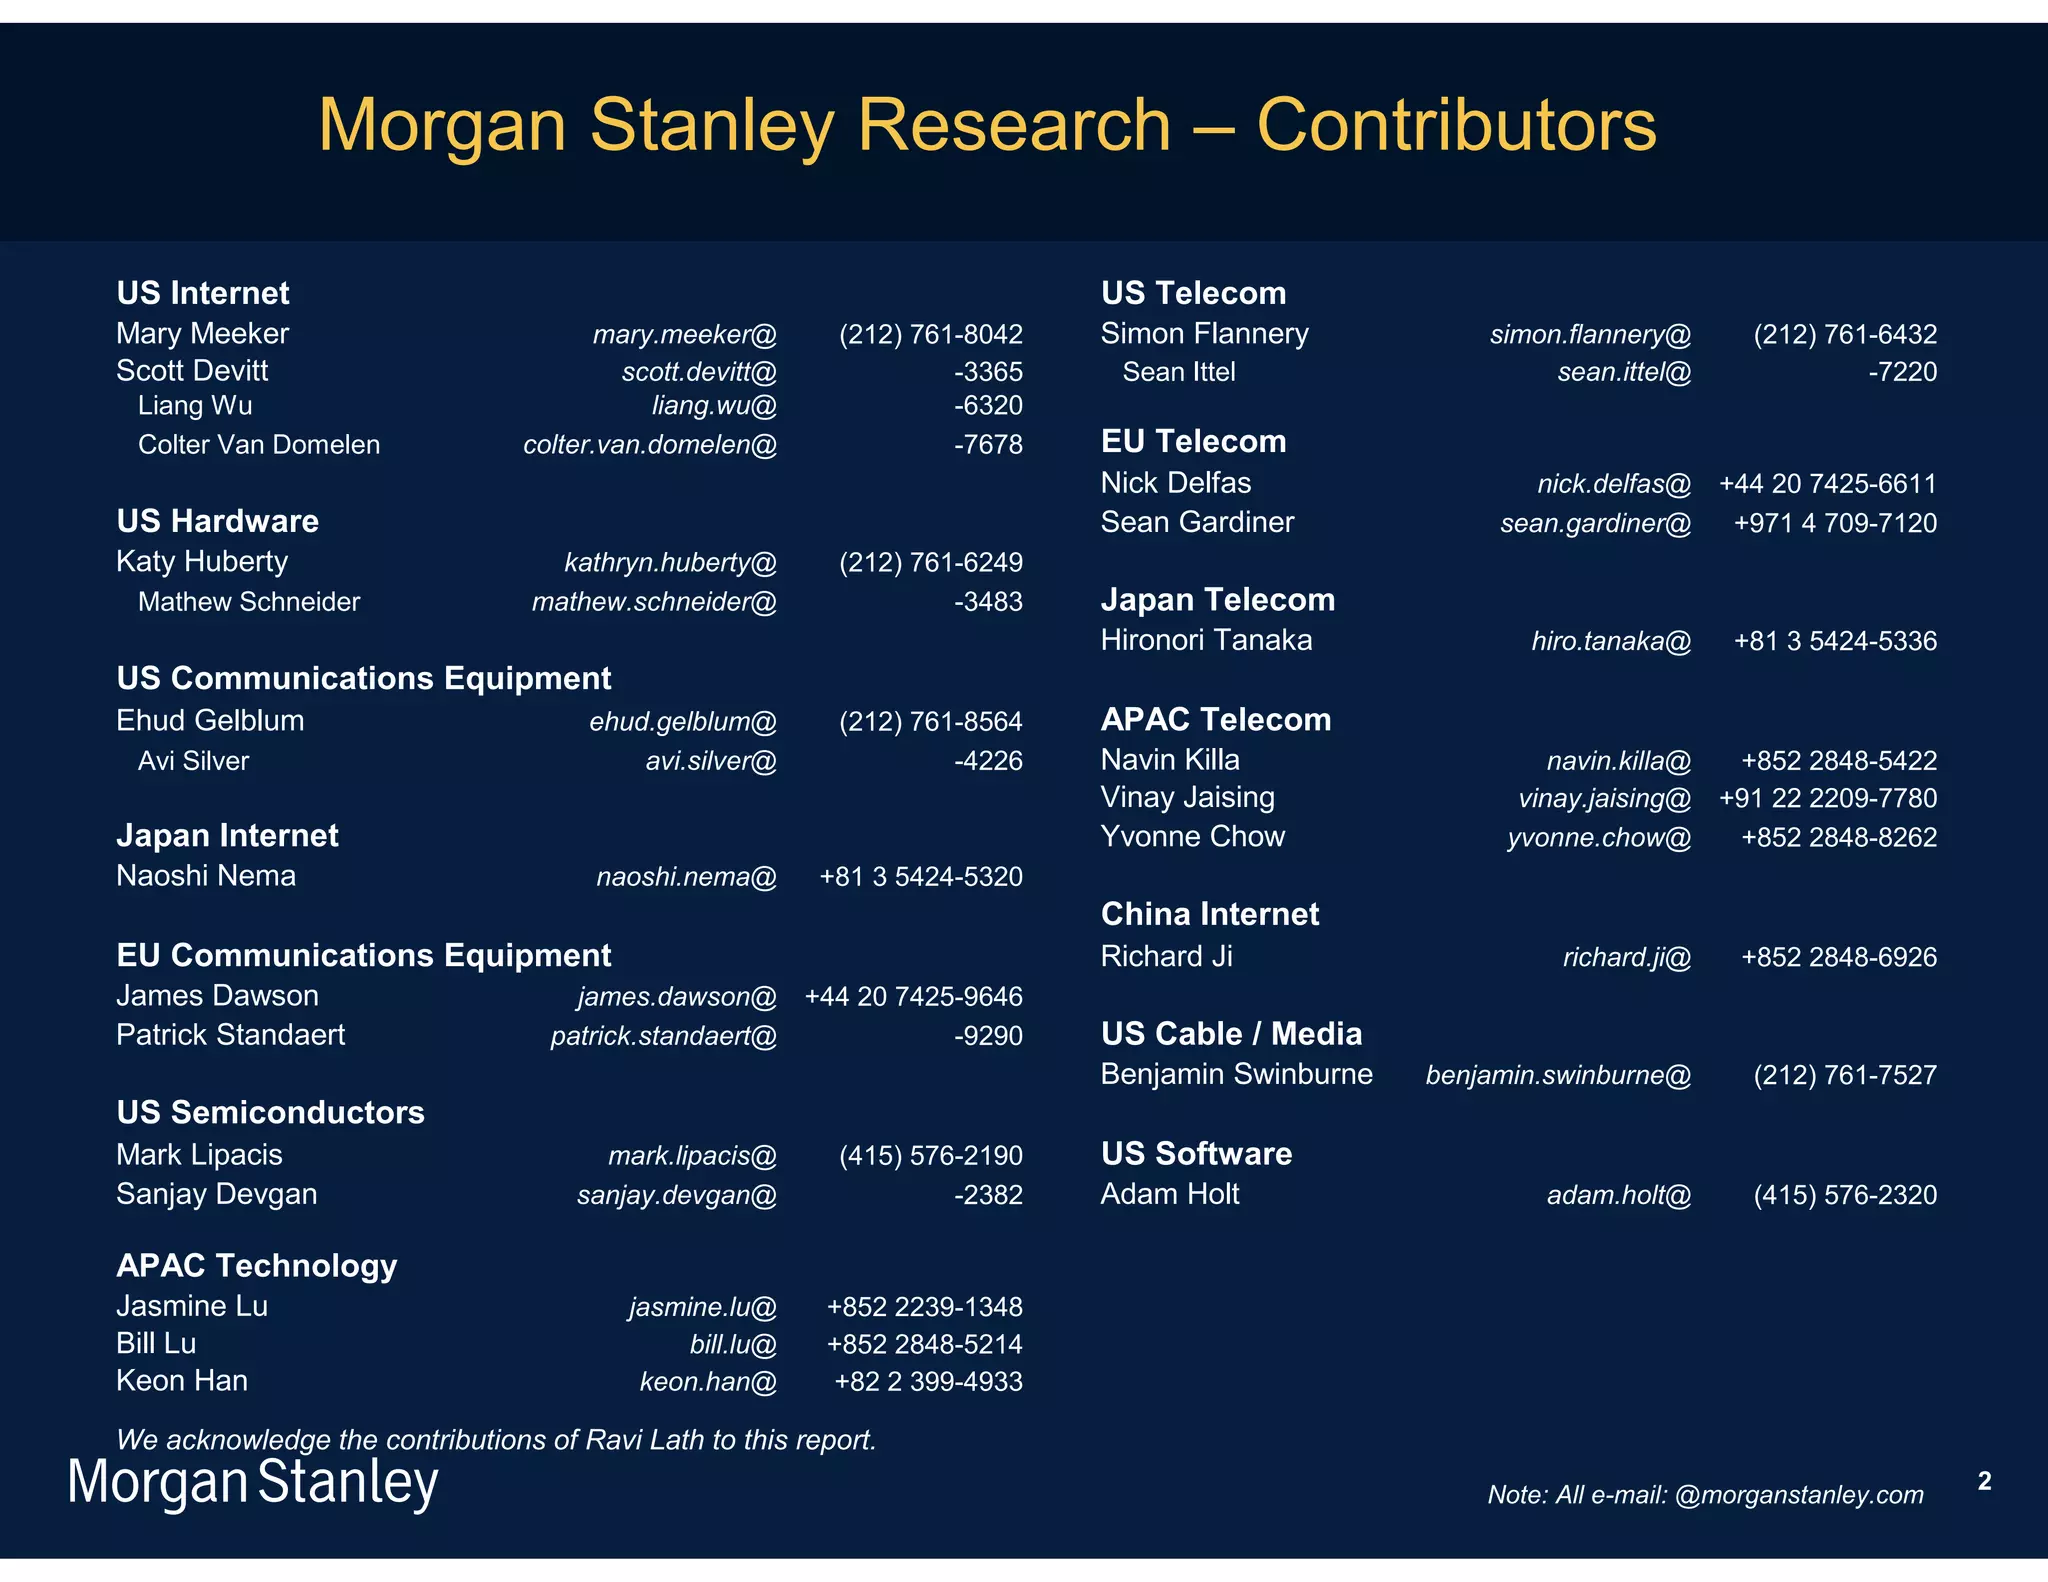
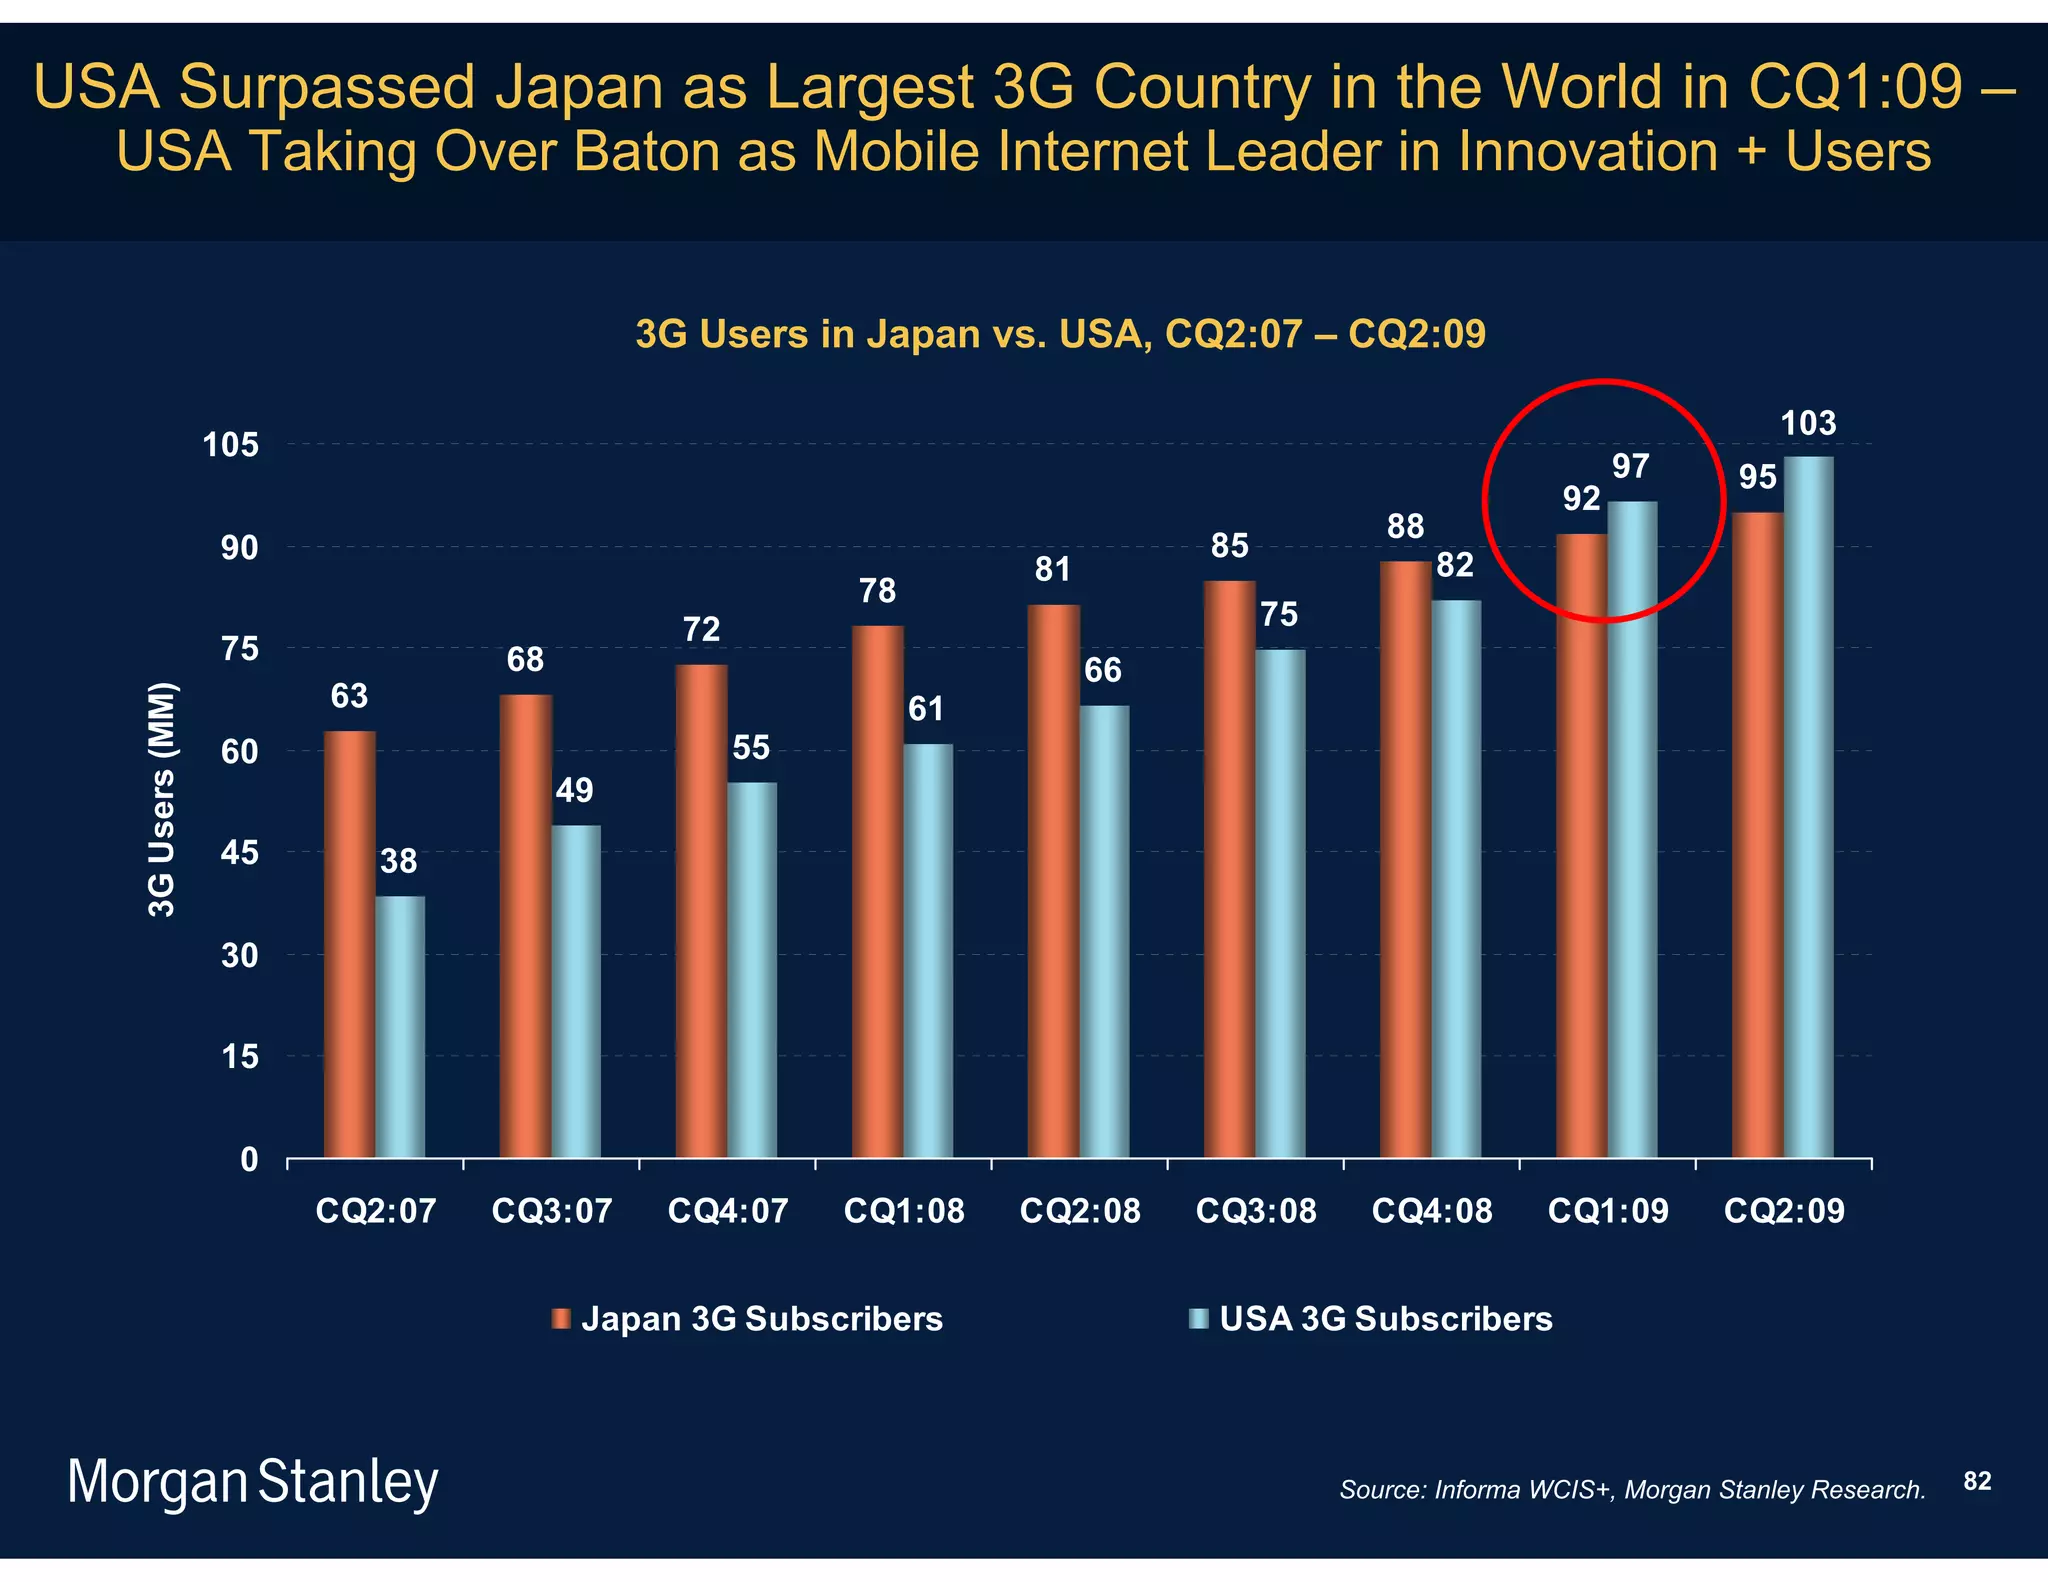
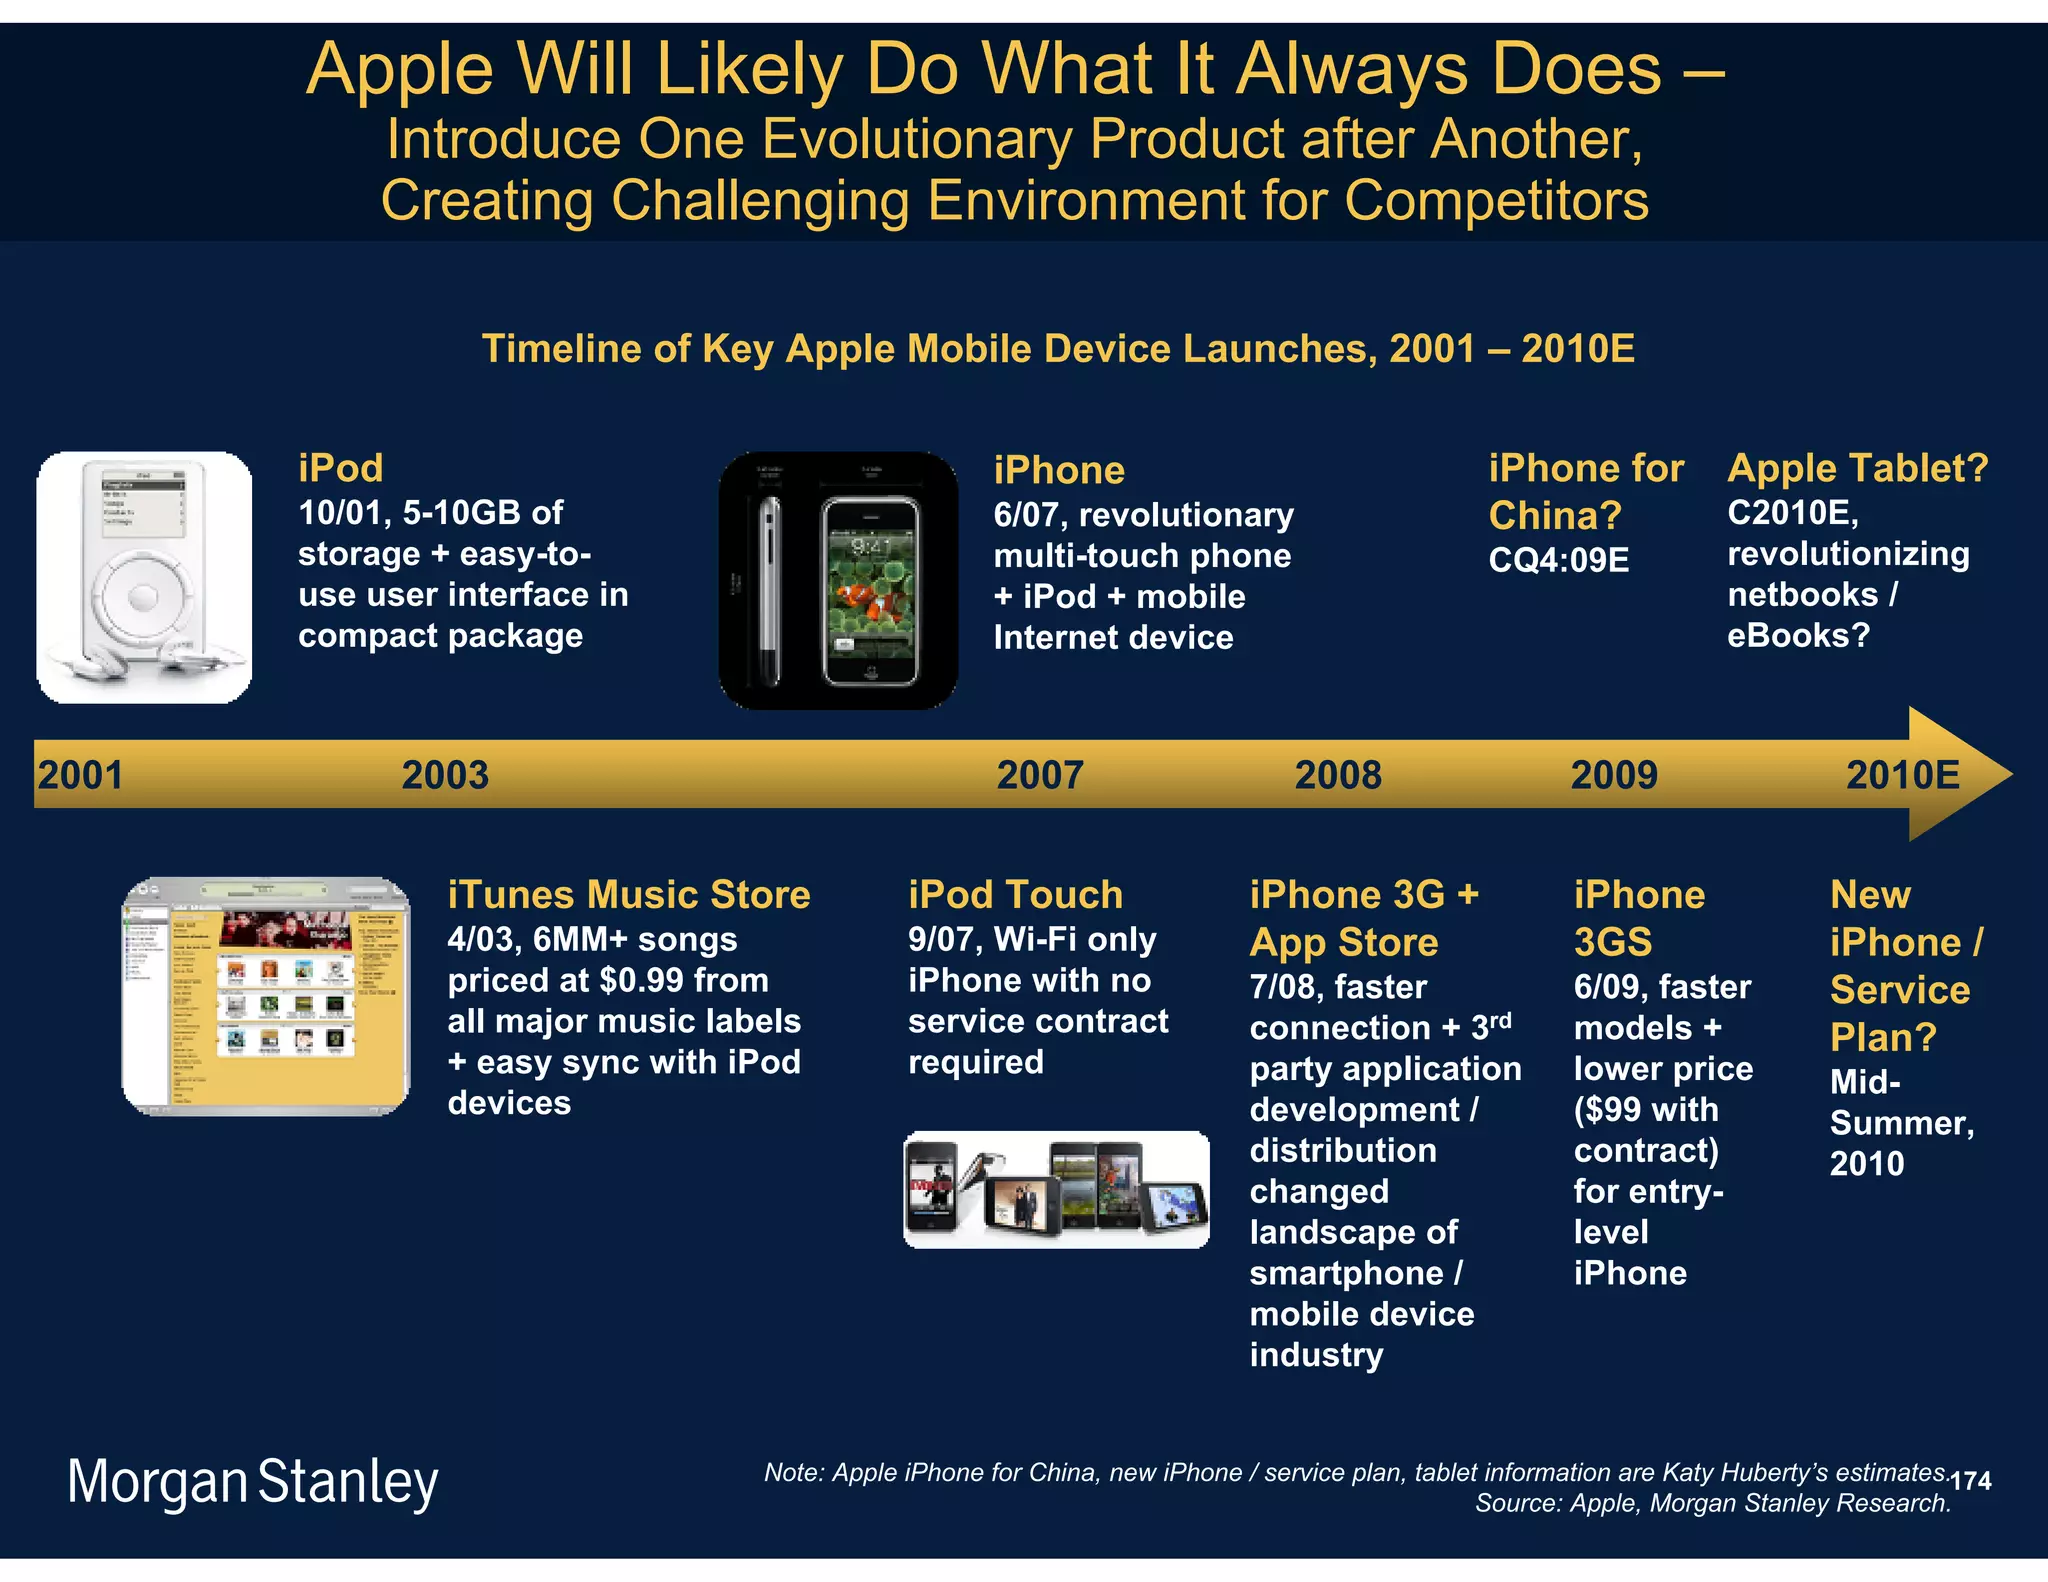
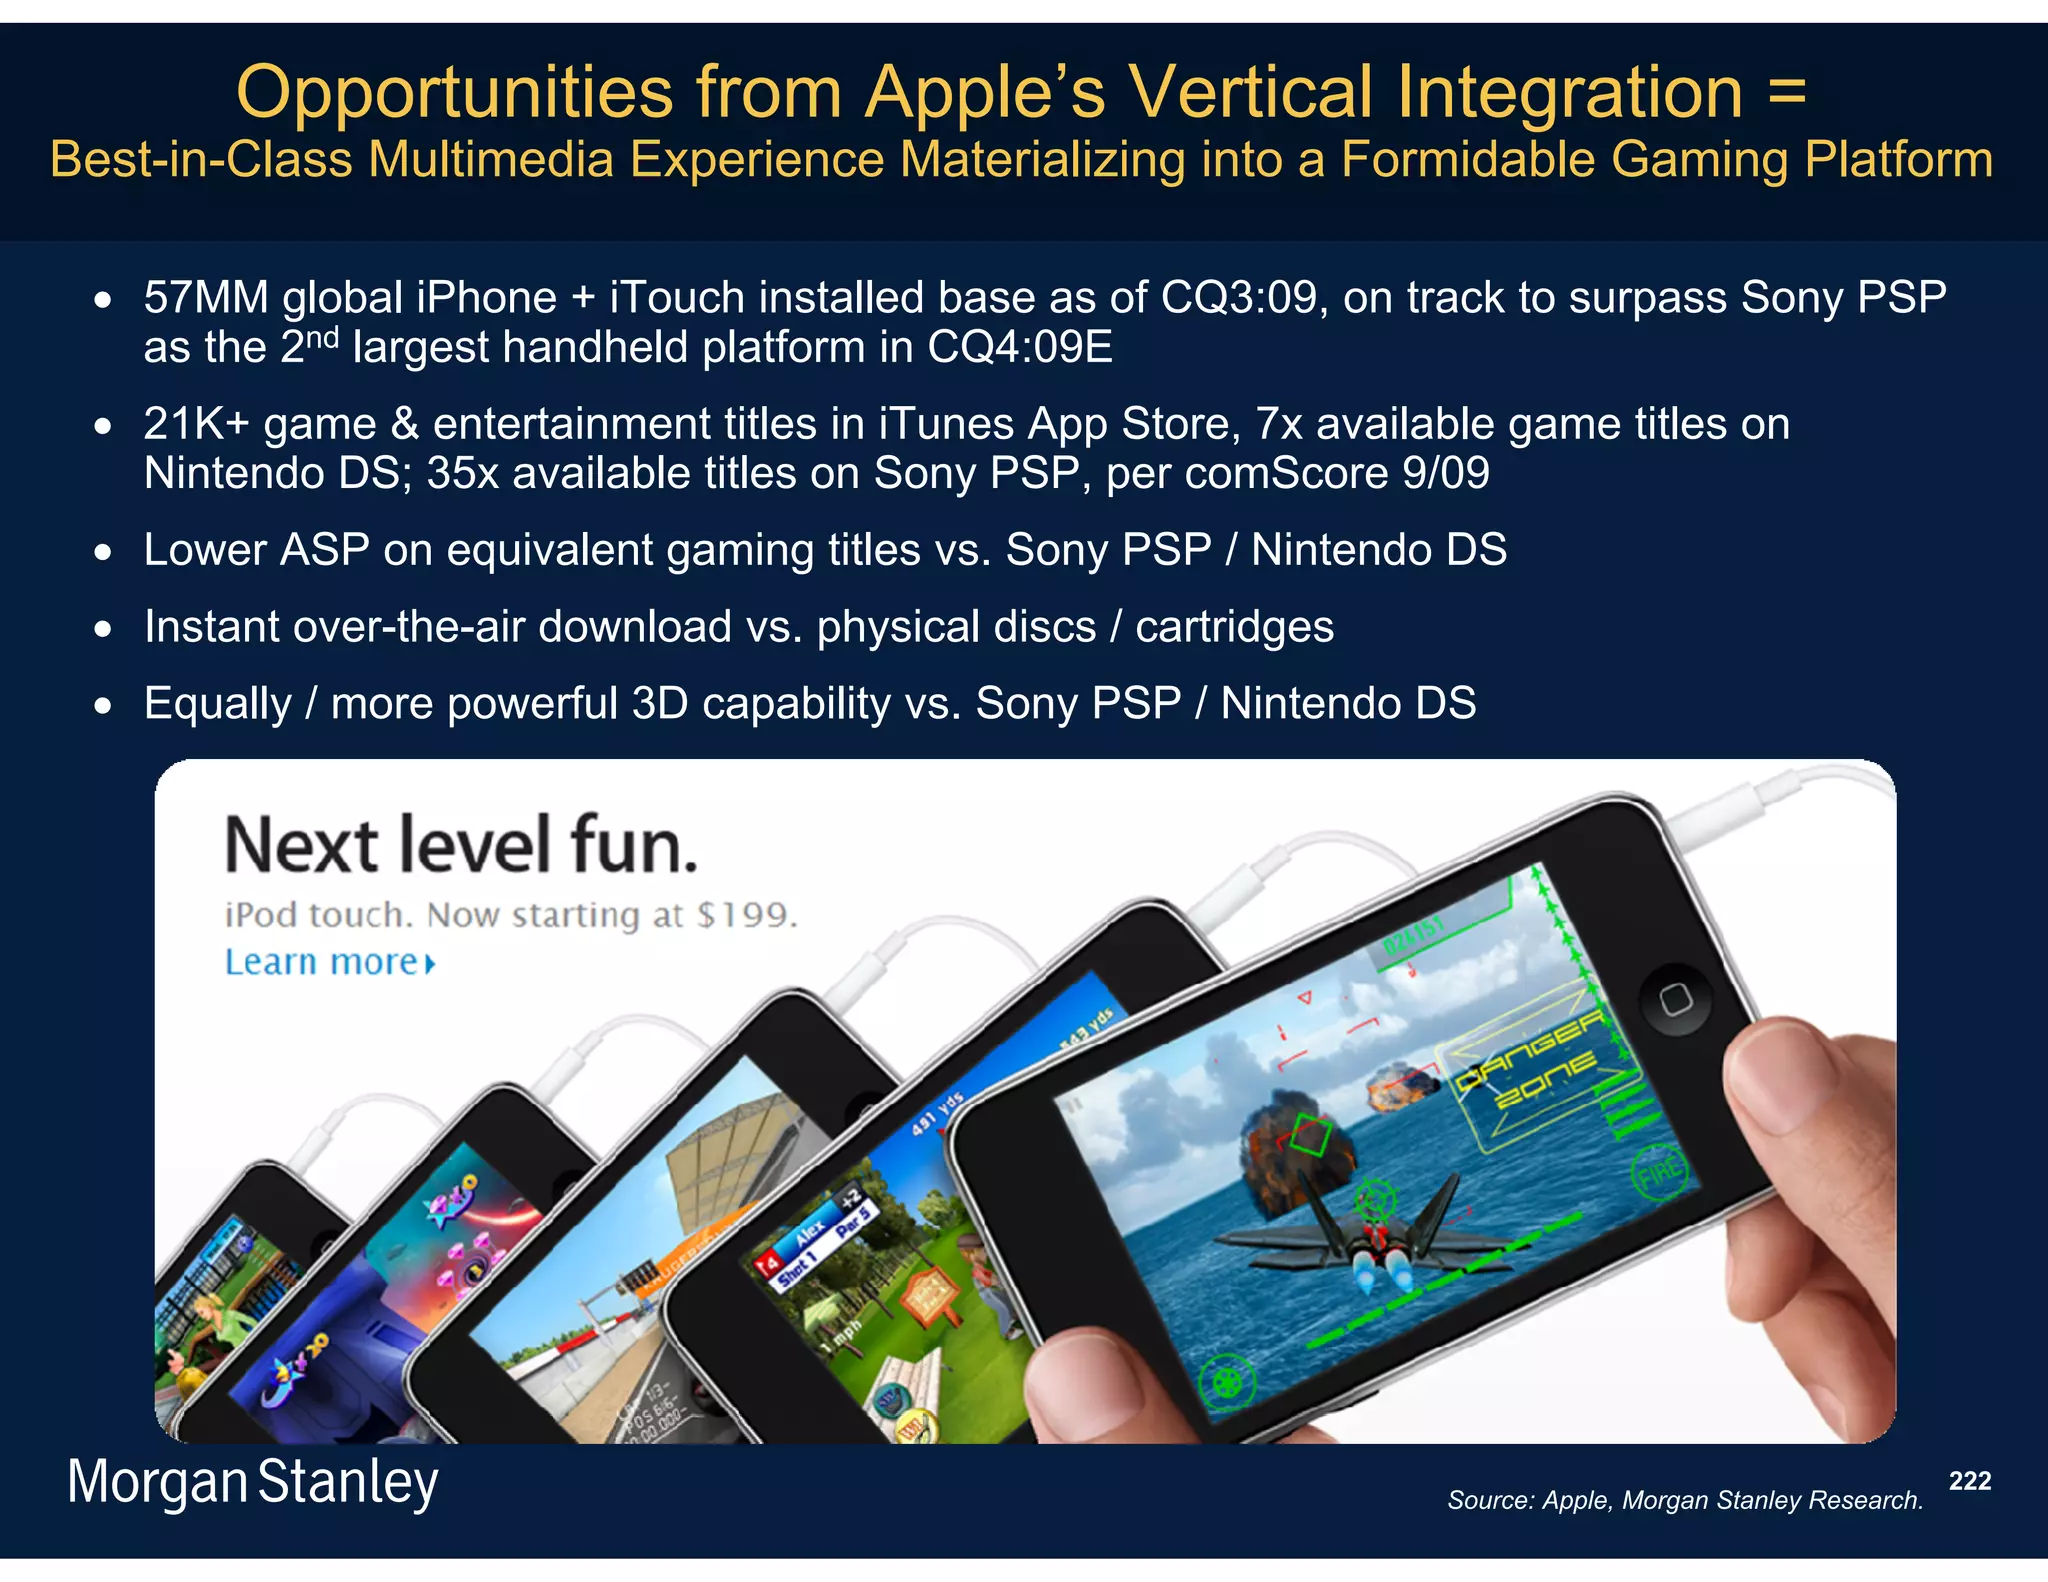
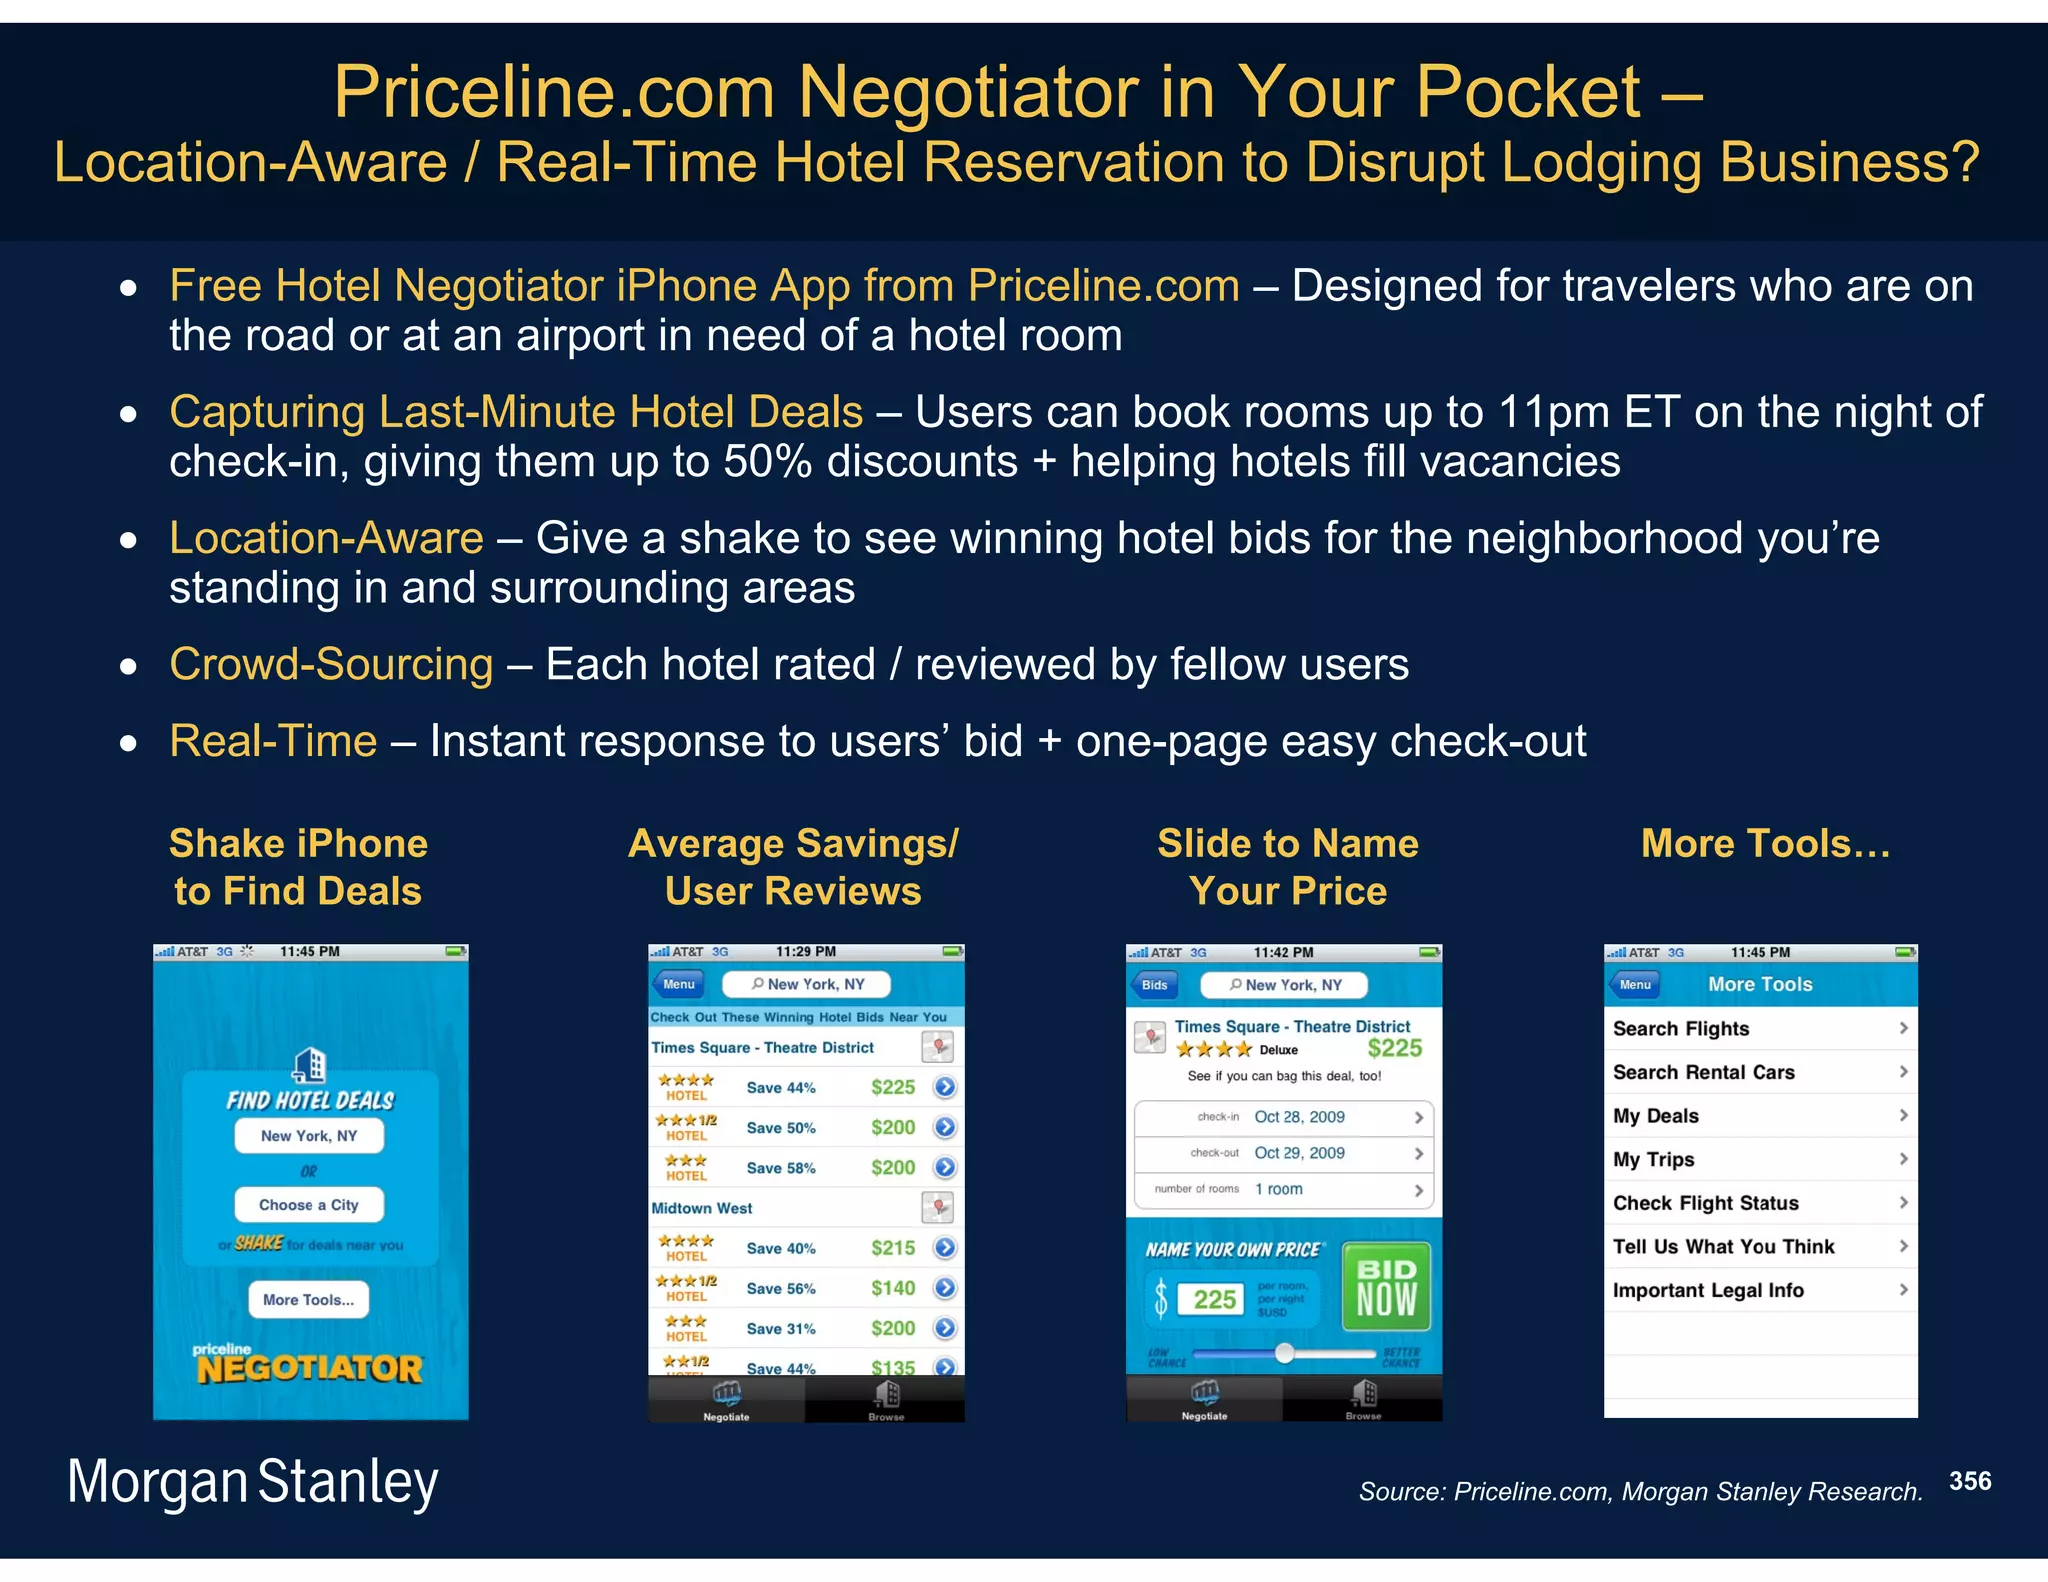
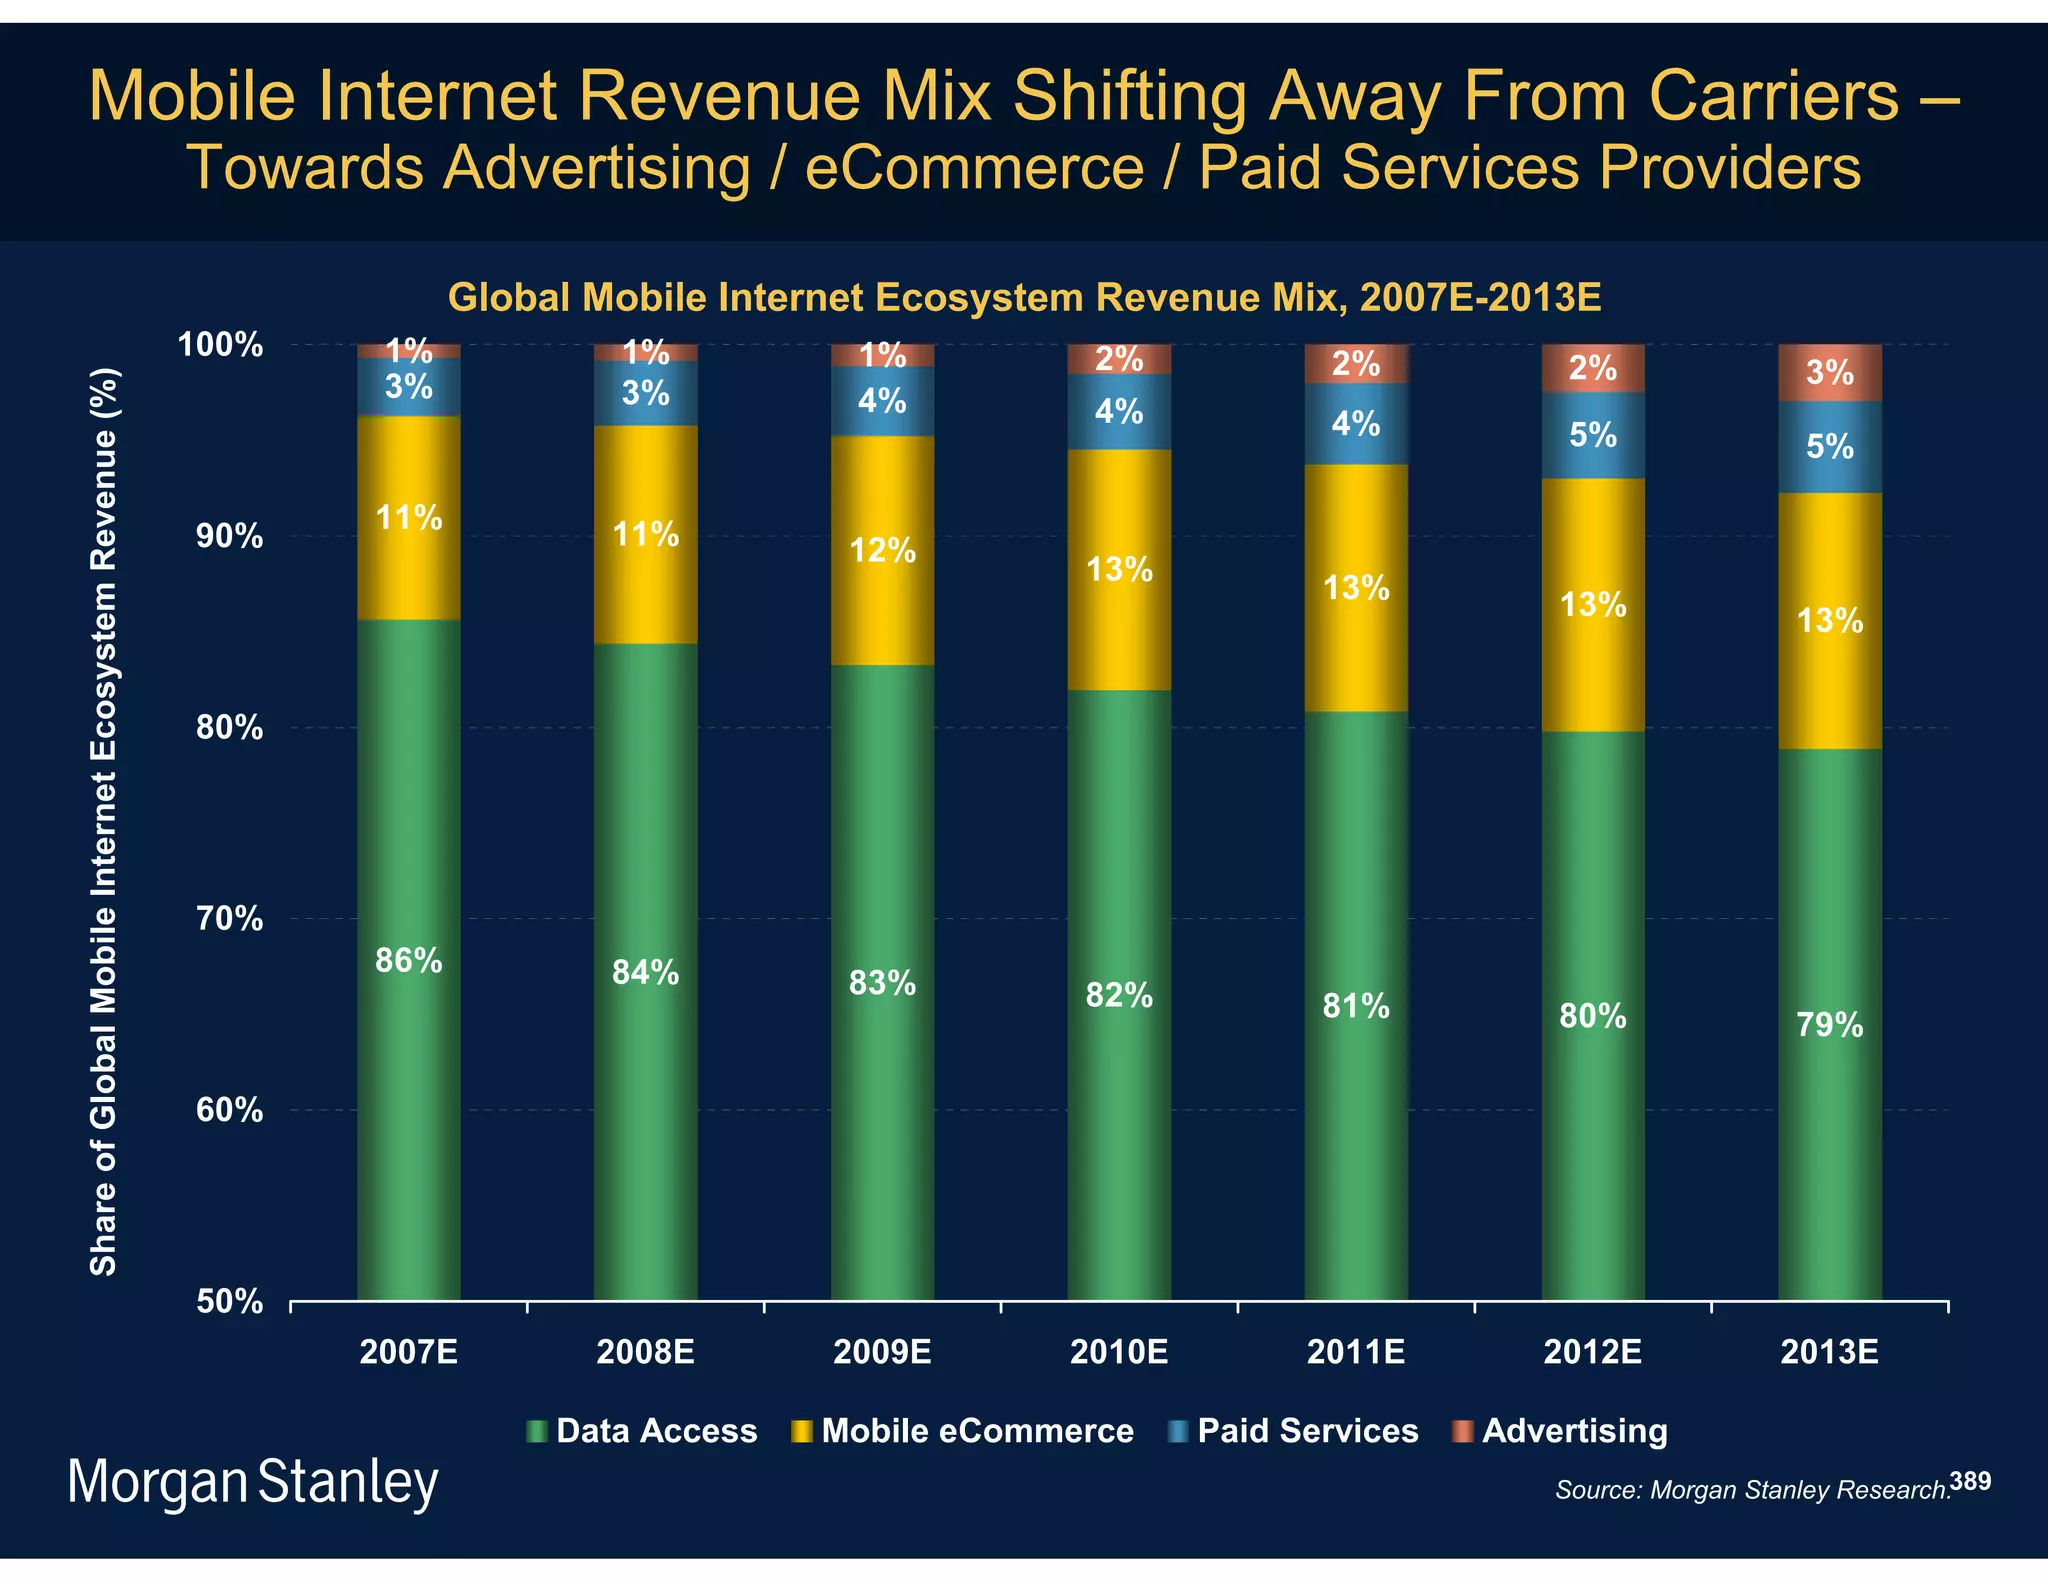
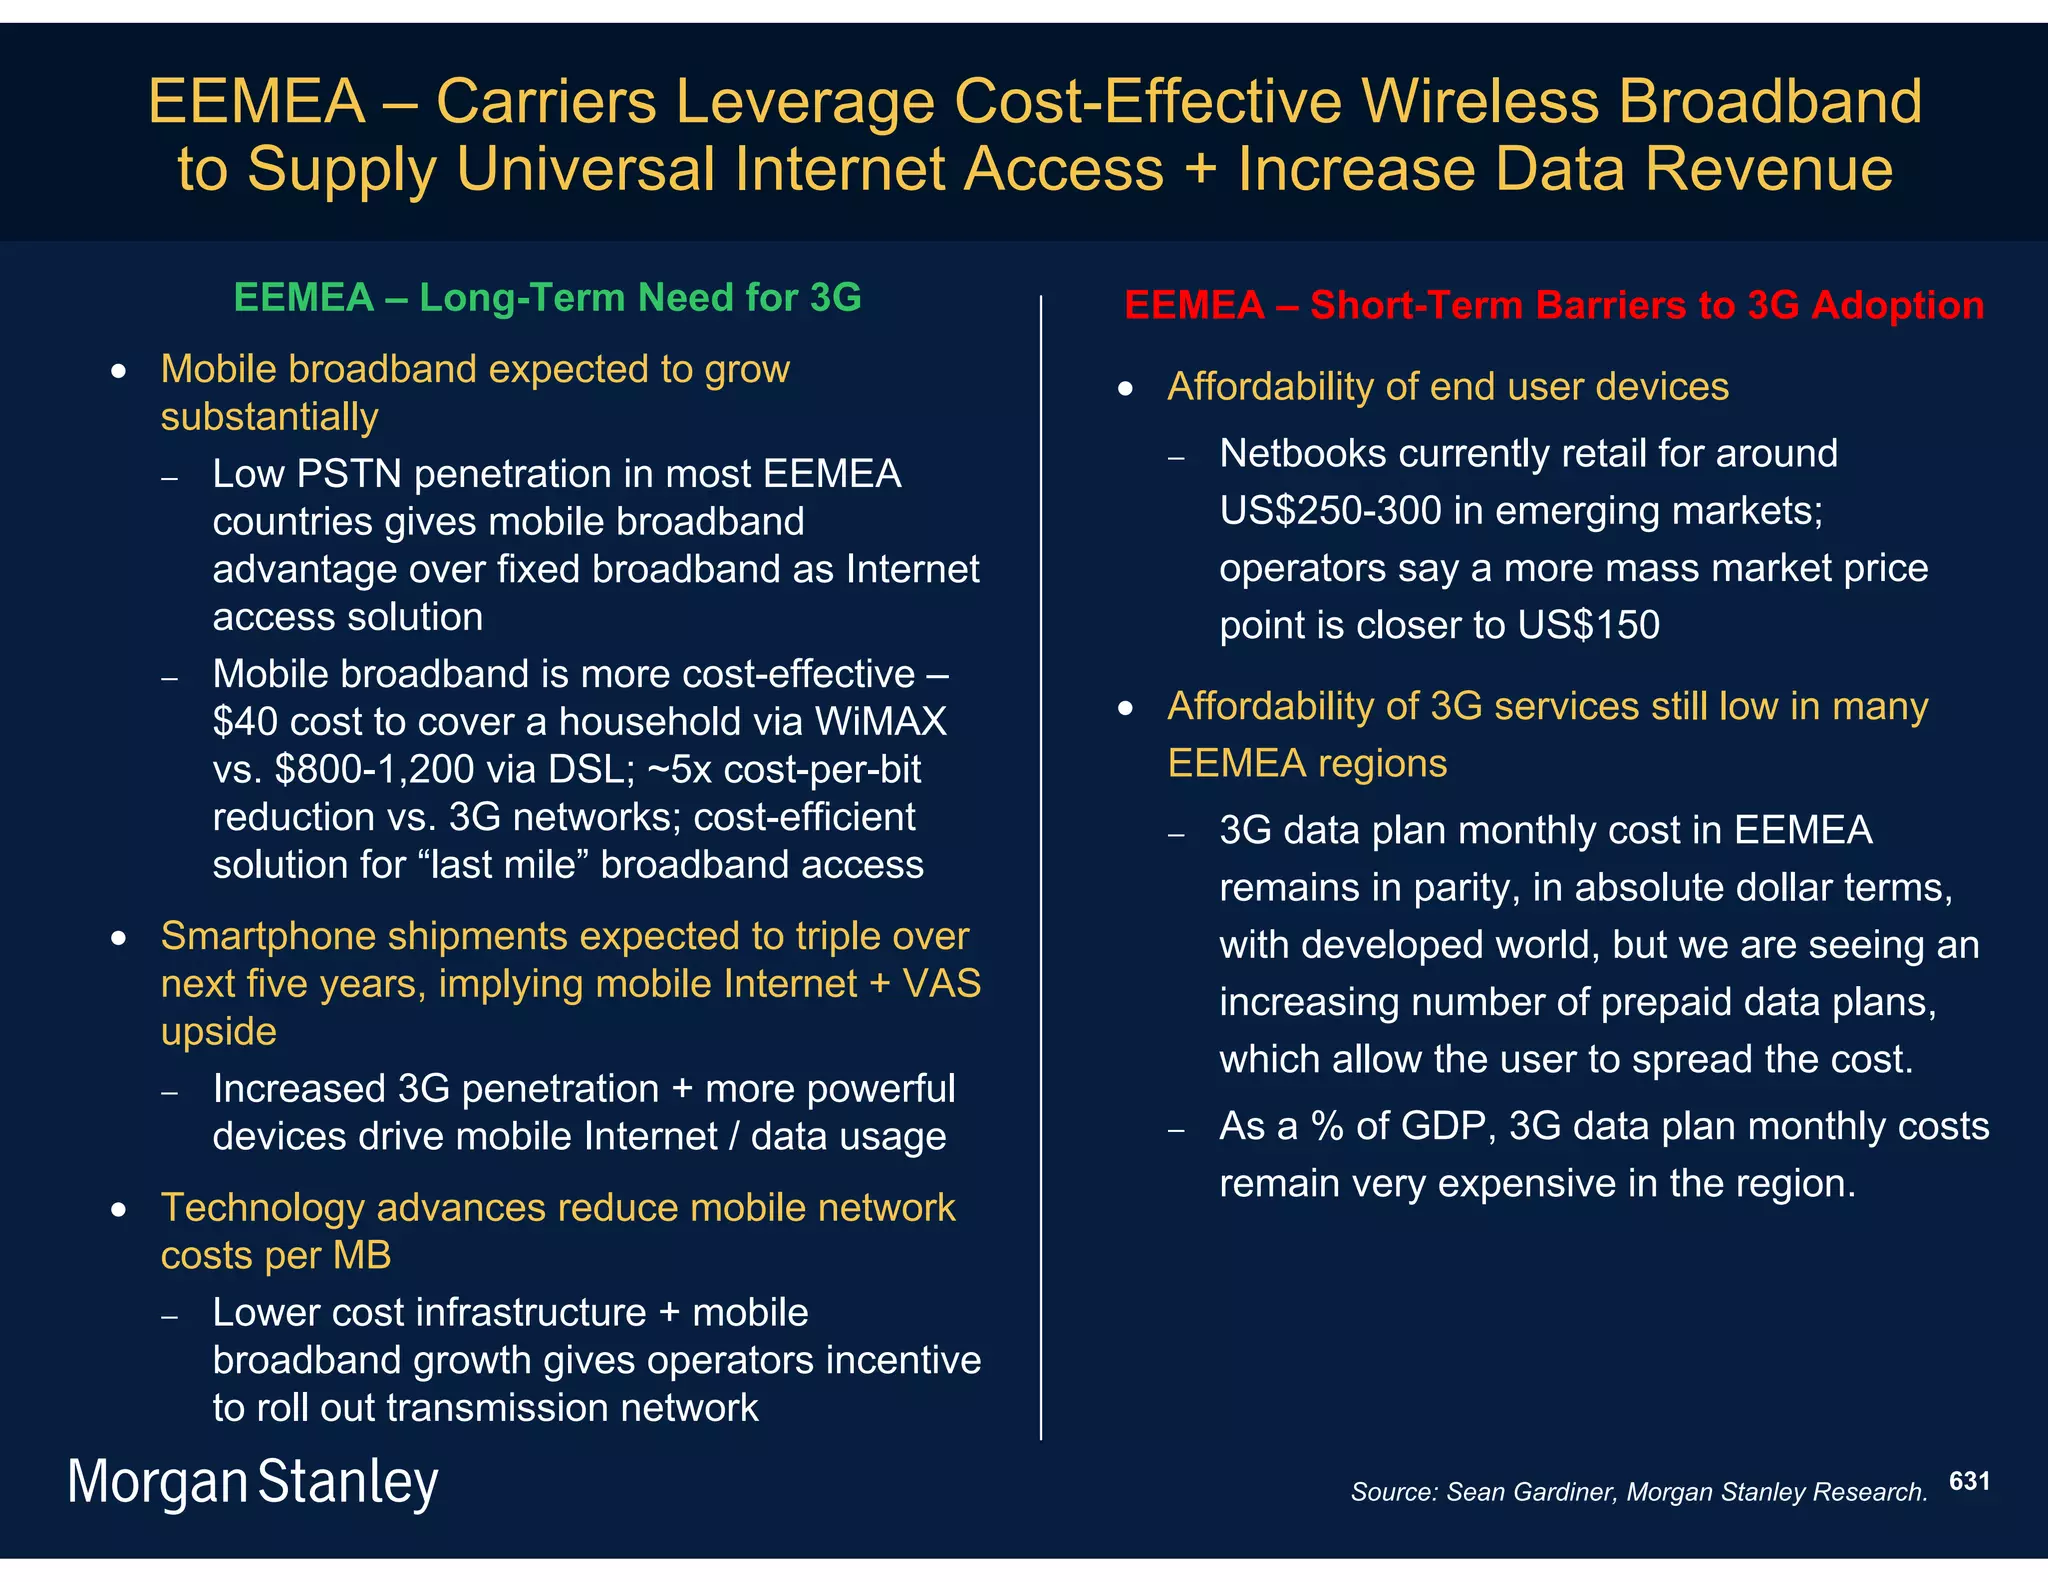
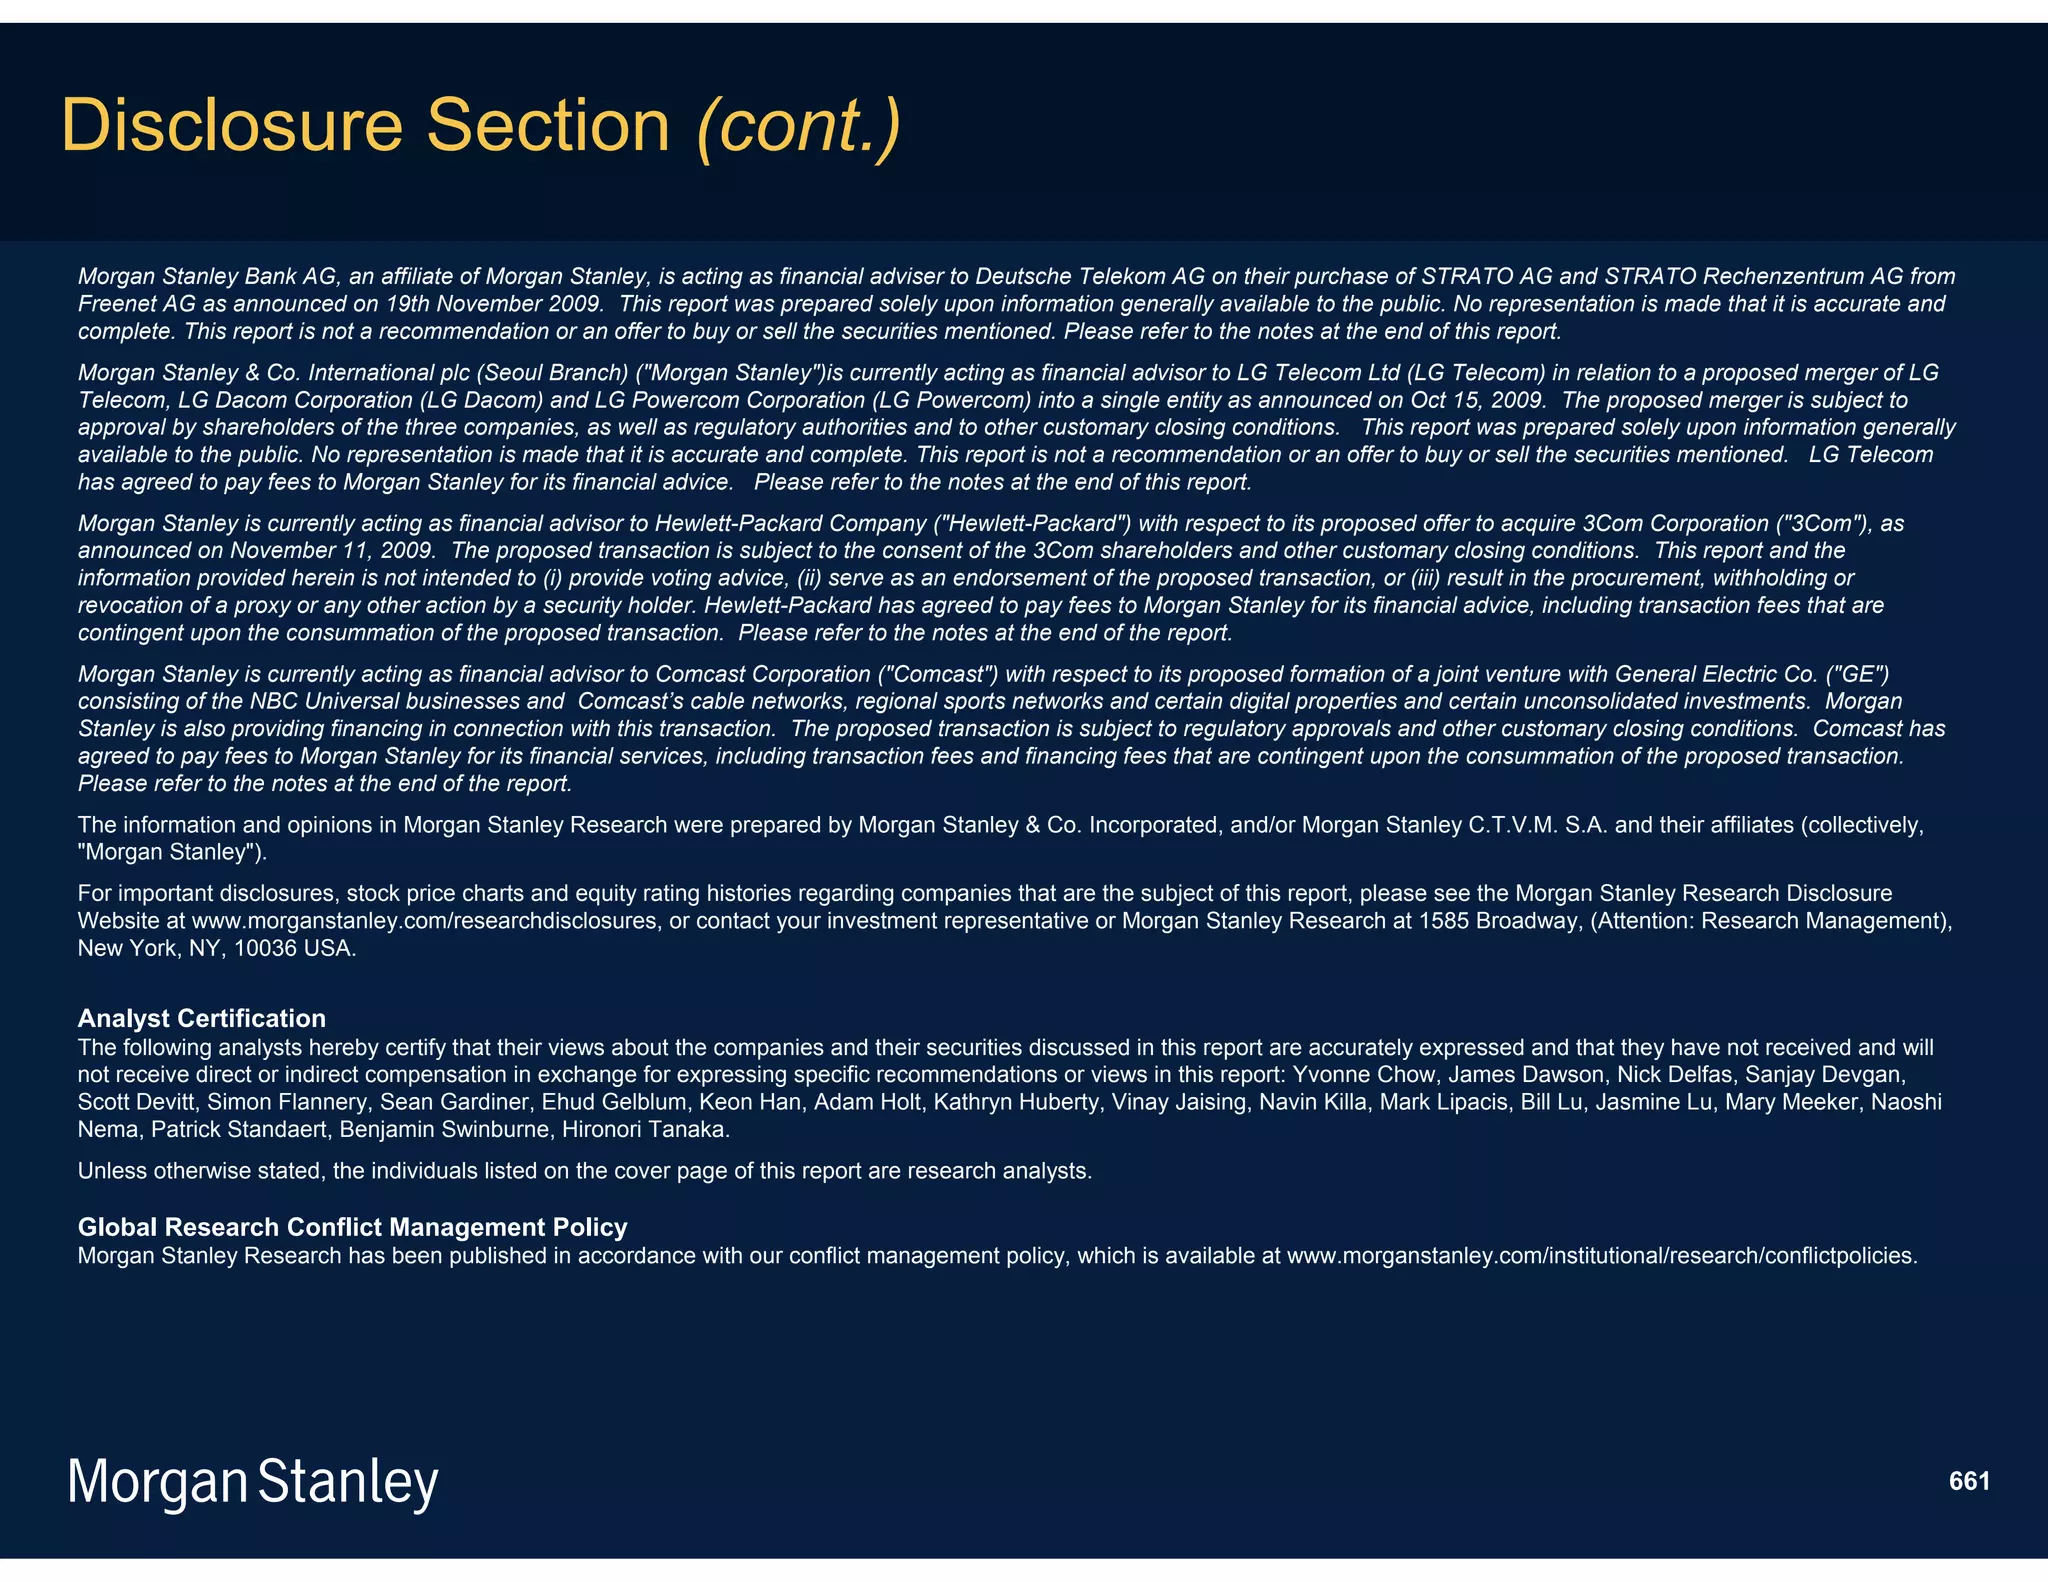
![Mobile Internet Likely to Follow Timing & Development
Patterns of Desktop Internet Market
Timing & Development of Internet Market Segment – From Our 1996 Internet Retailing Report
nt]
s / C ns /
onte
s]
io
tform
Ser pplicat
[Pla
vice
[A
Mobile Internet
2005 … … … 2011E Timeline (ex. Japan)
39
Note: Original chart (black text) from Morgan Stanley’s Internet Retailing Report, published in 1996. Red text augmented in 11/09.
Source: Morgan Stanley Research.](https://image.slidesharecdn.com/mobileinternetreportkeythemesfinal-100425034727-phpapp02/75/Mobile-internet-report_key_themes_final-39-2048.jpg)


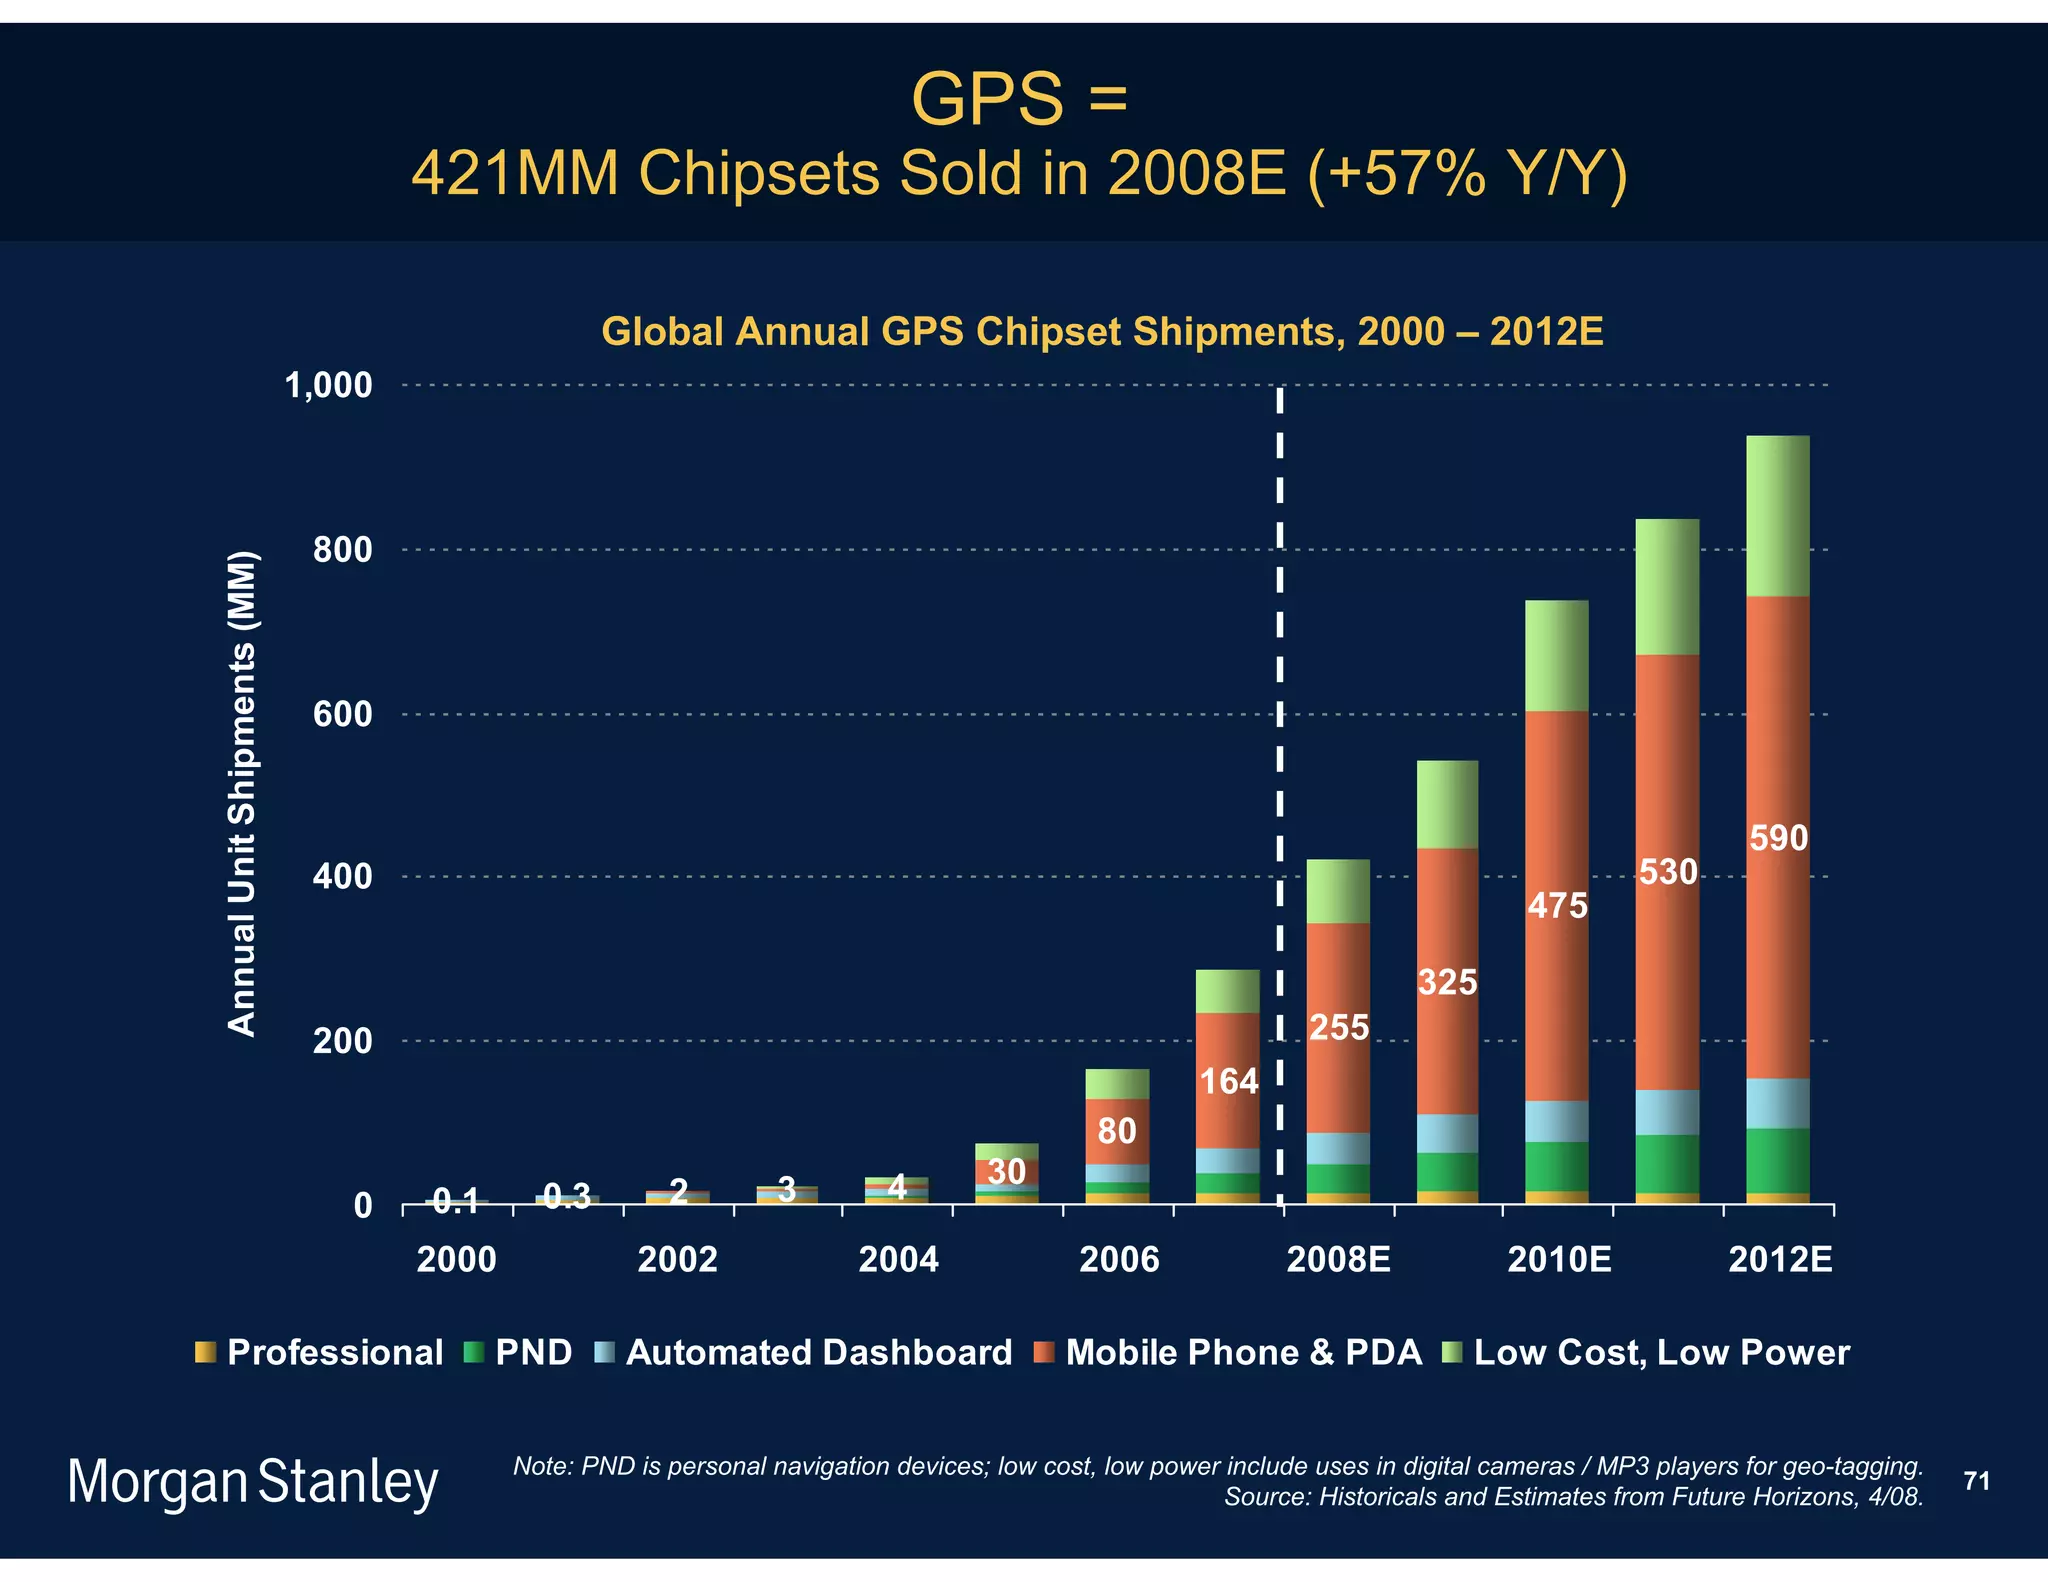
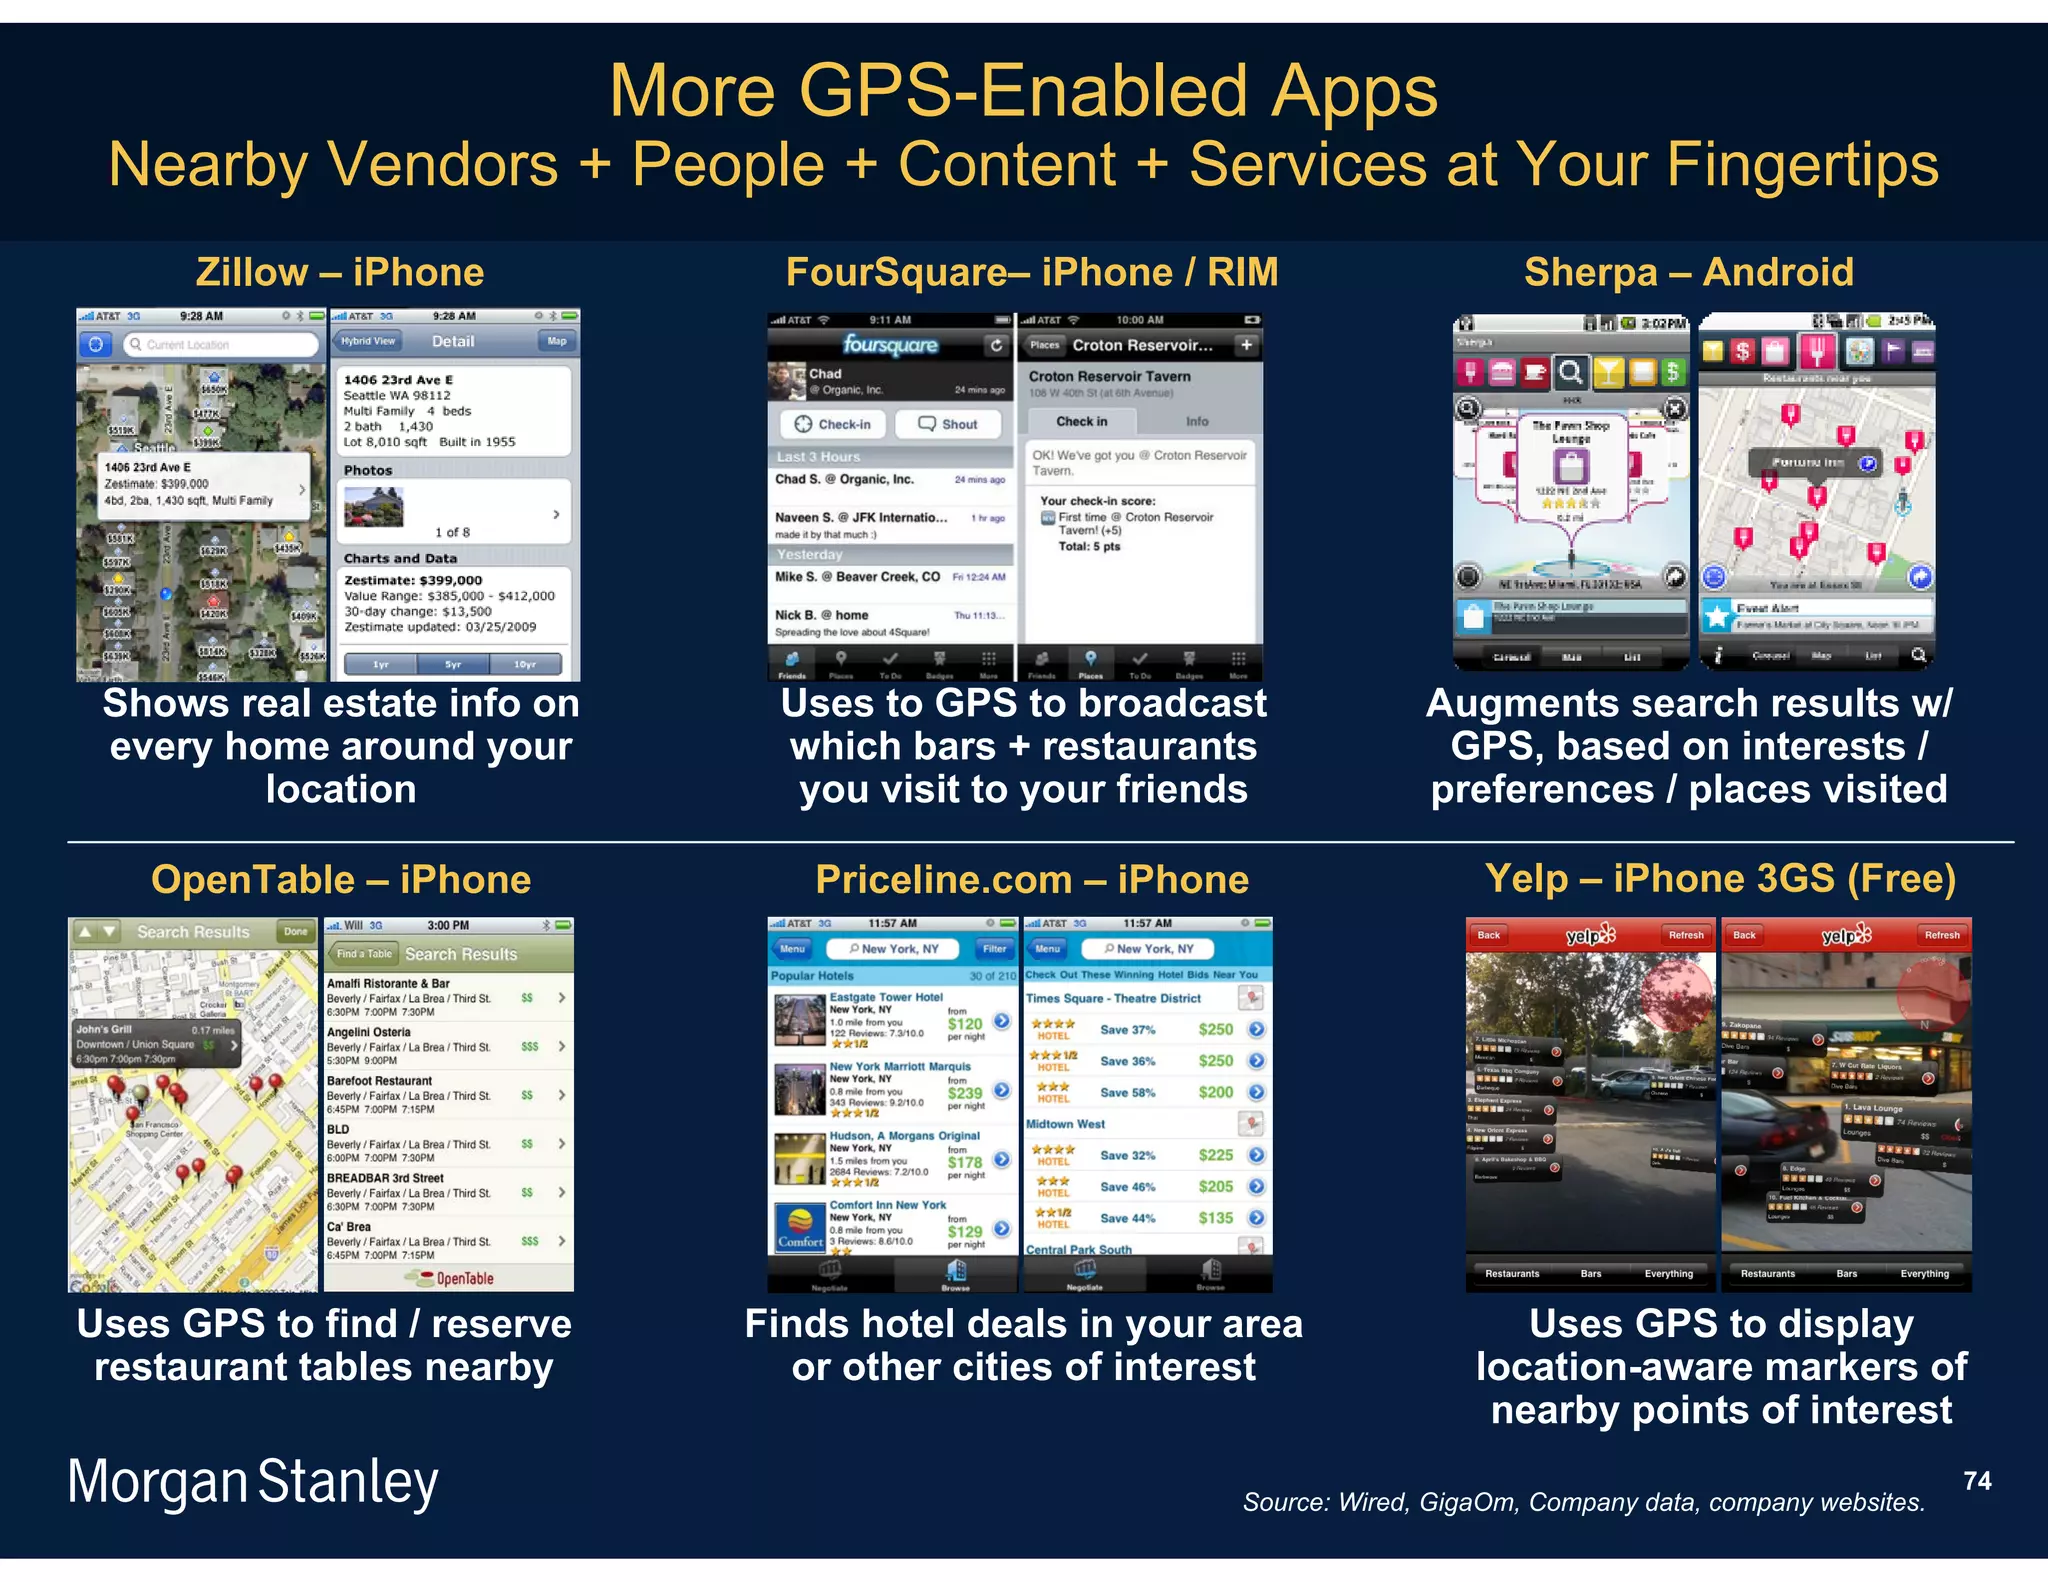


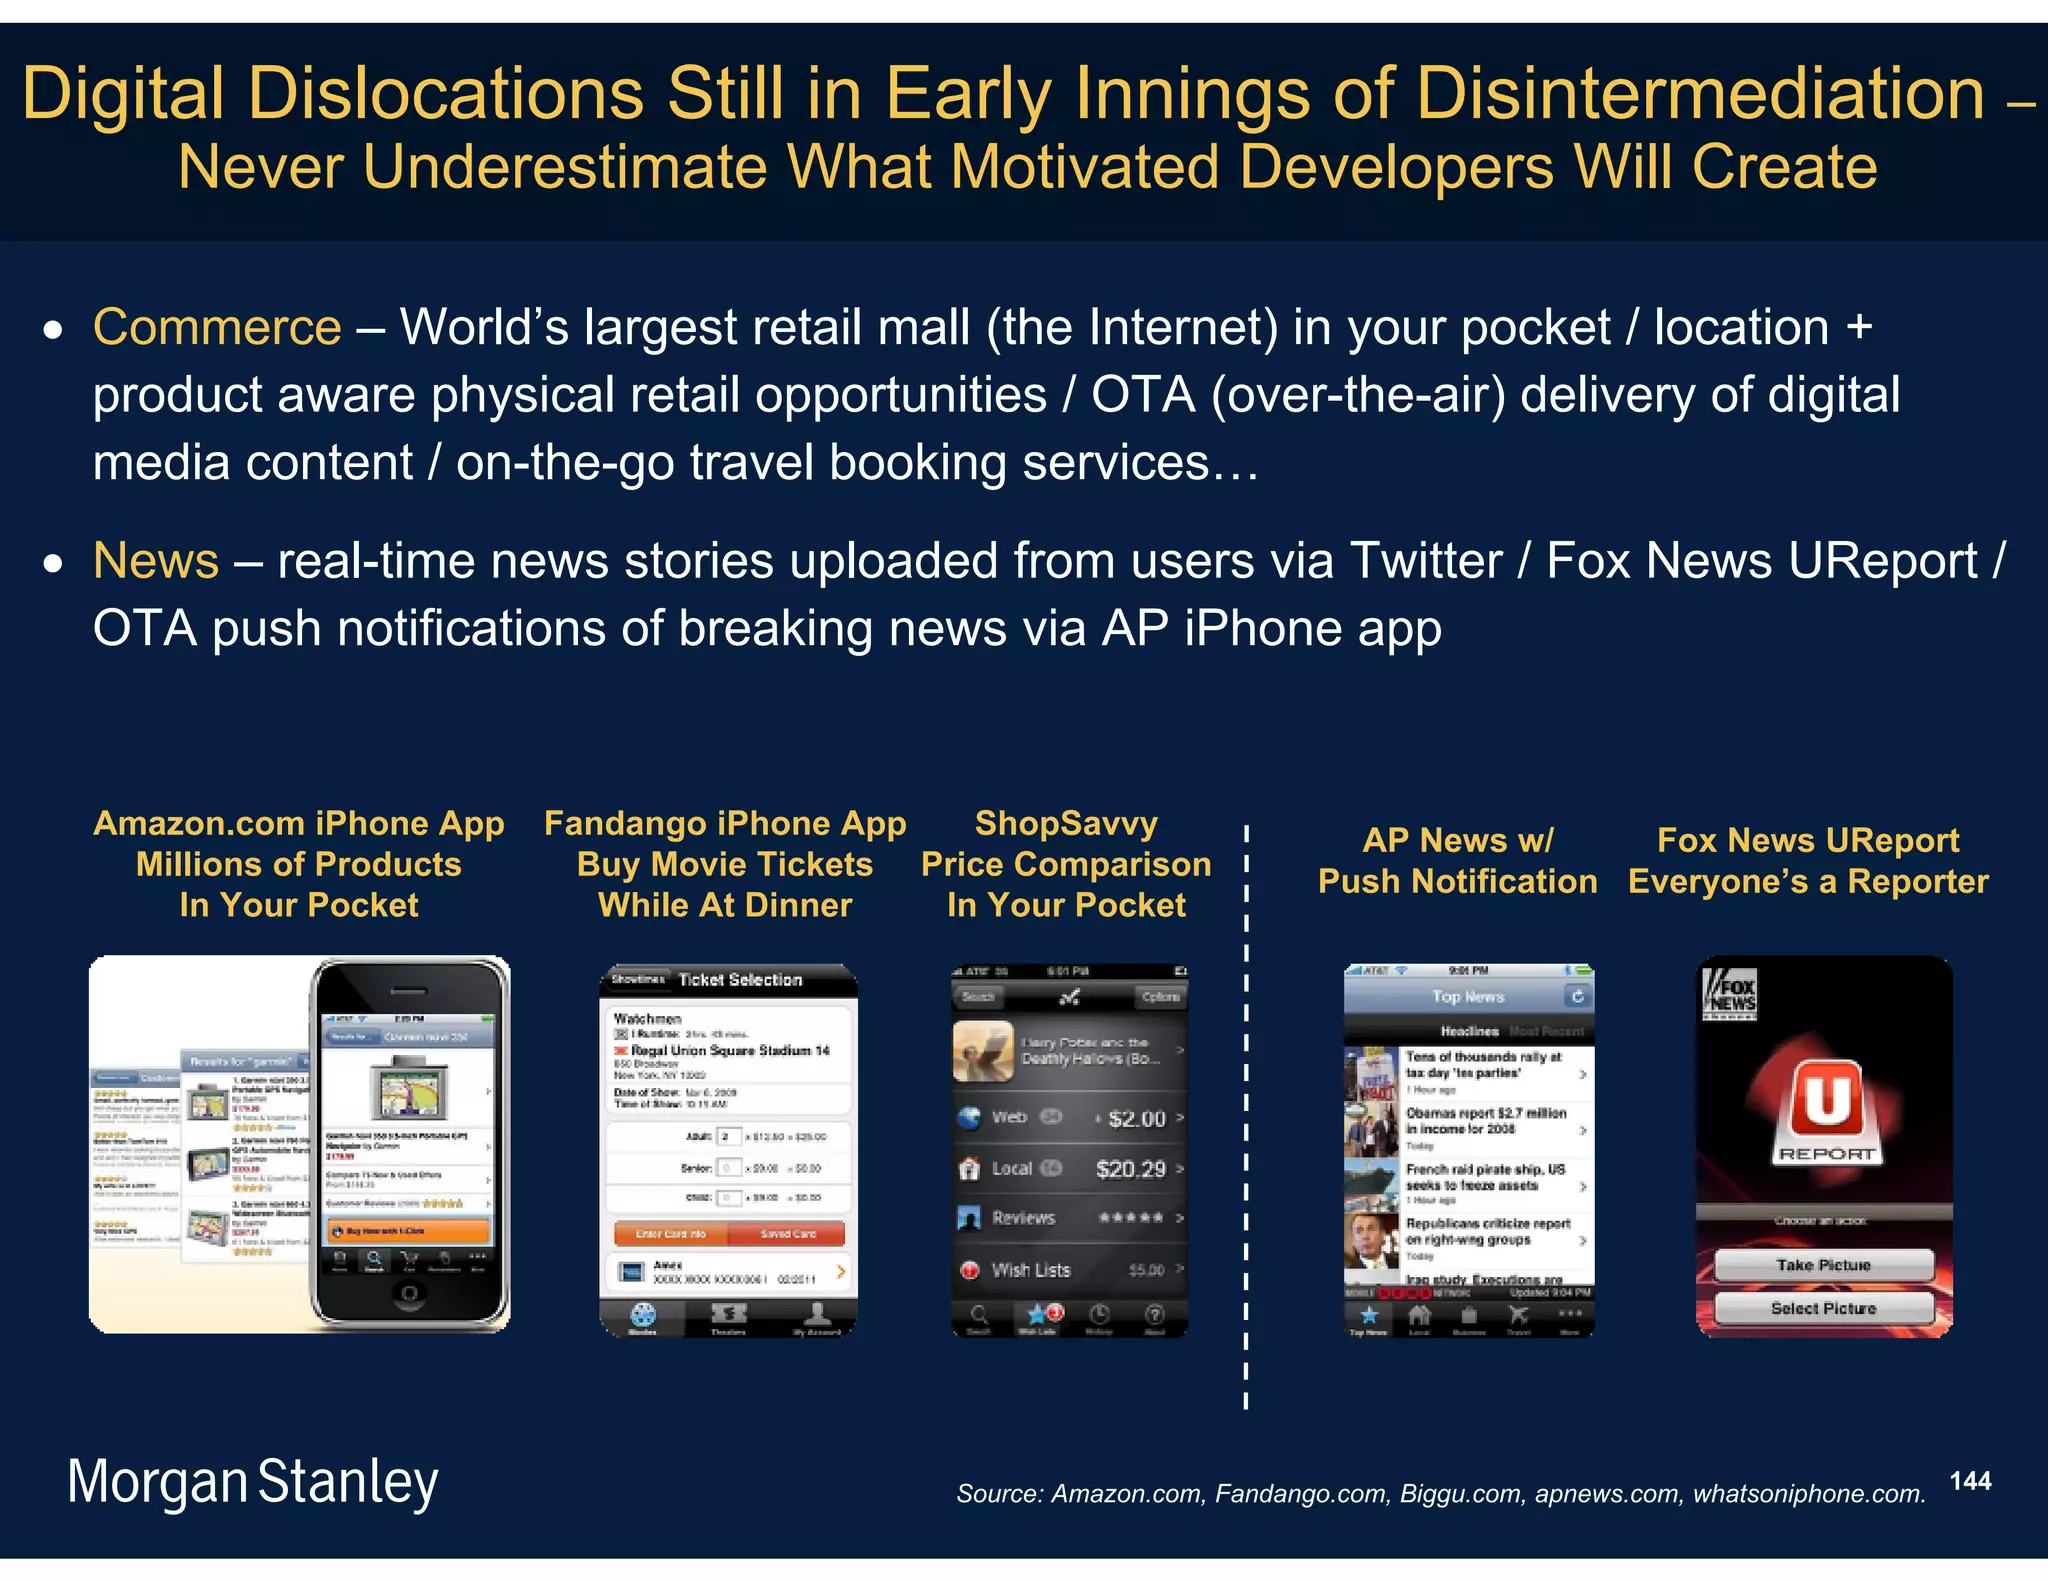
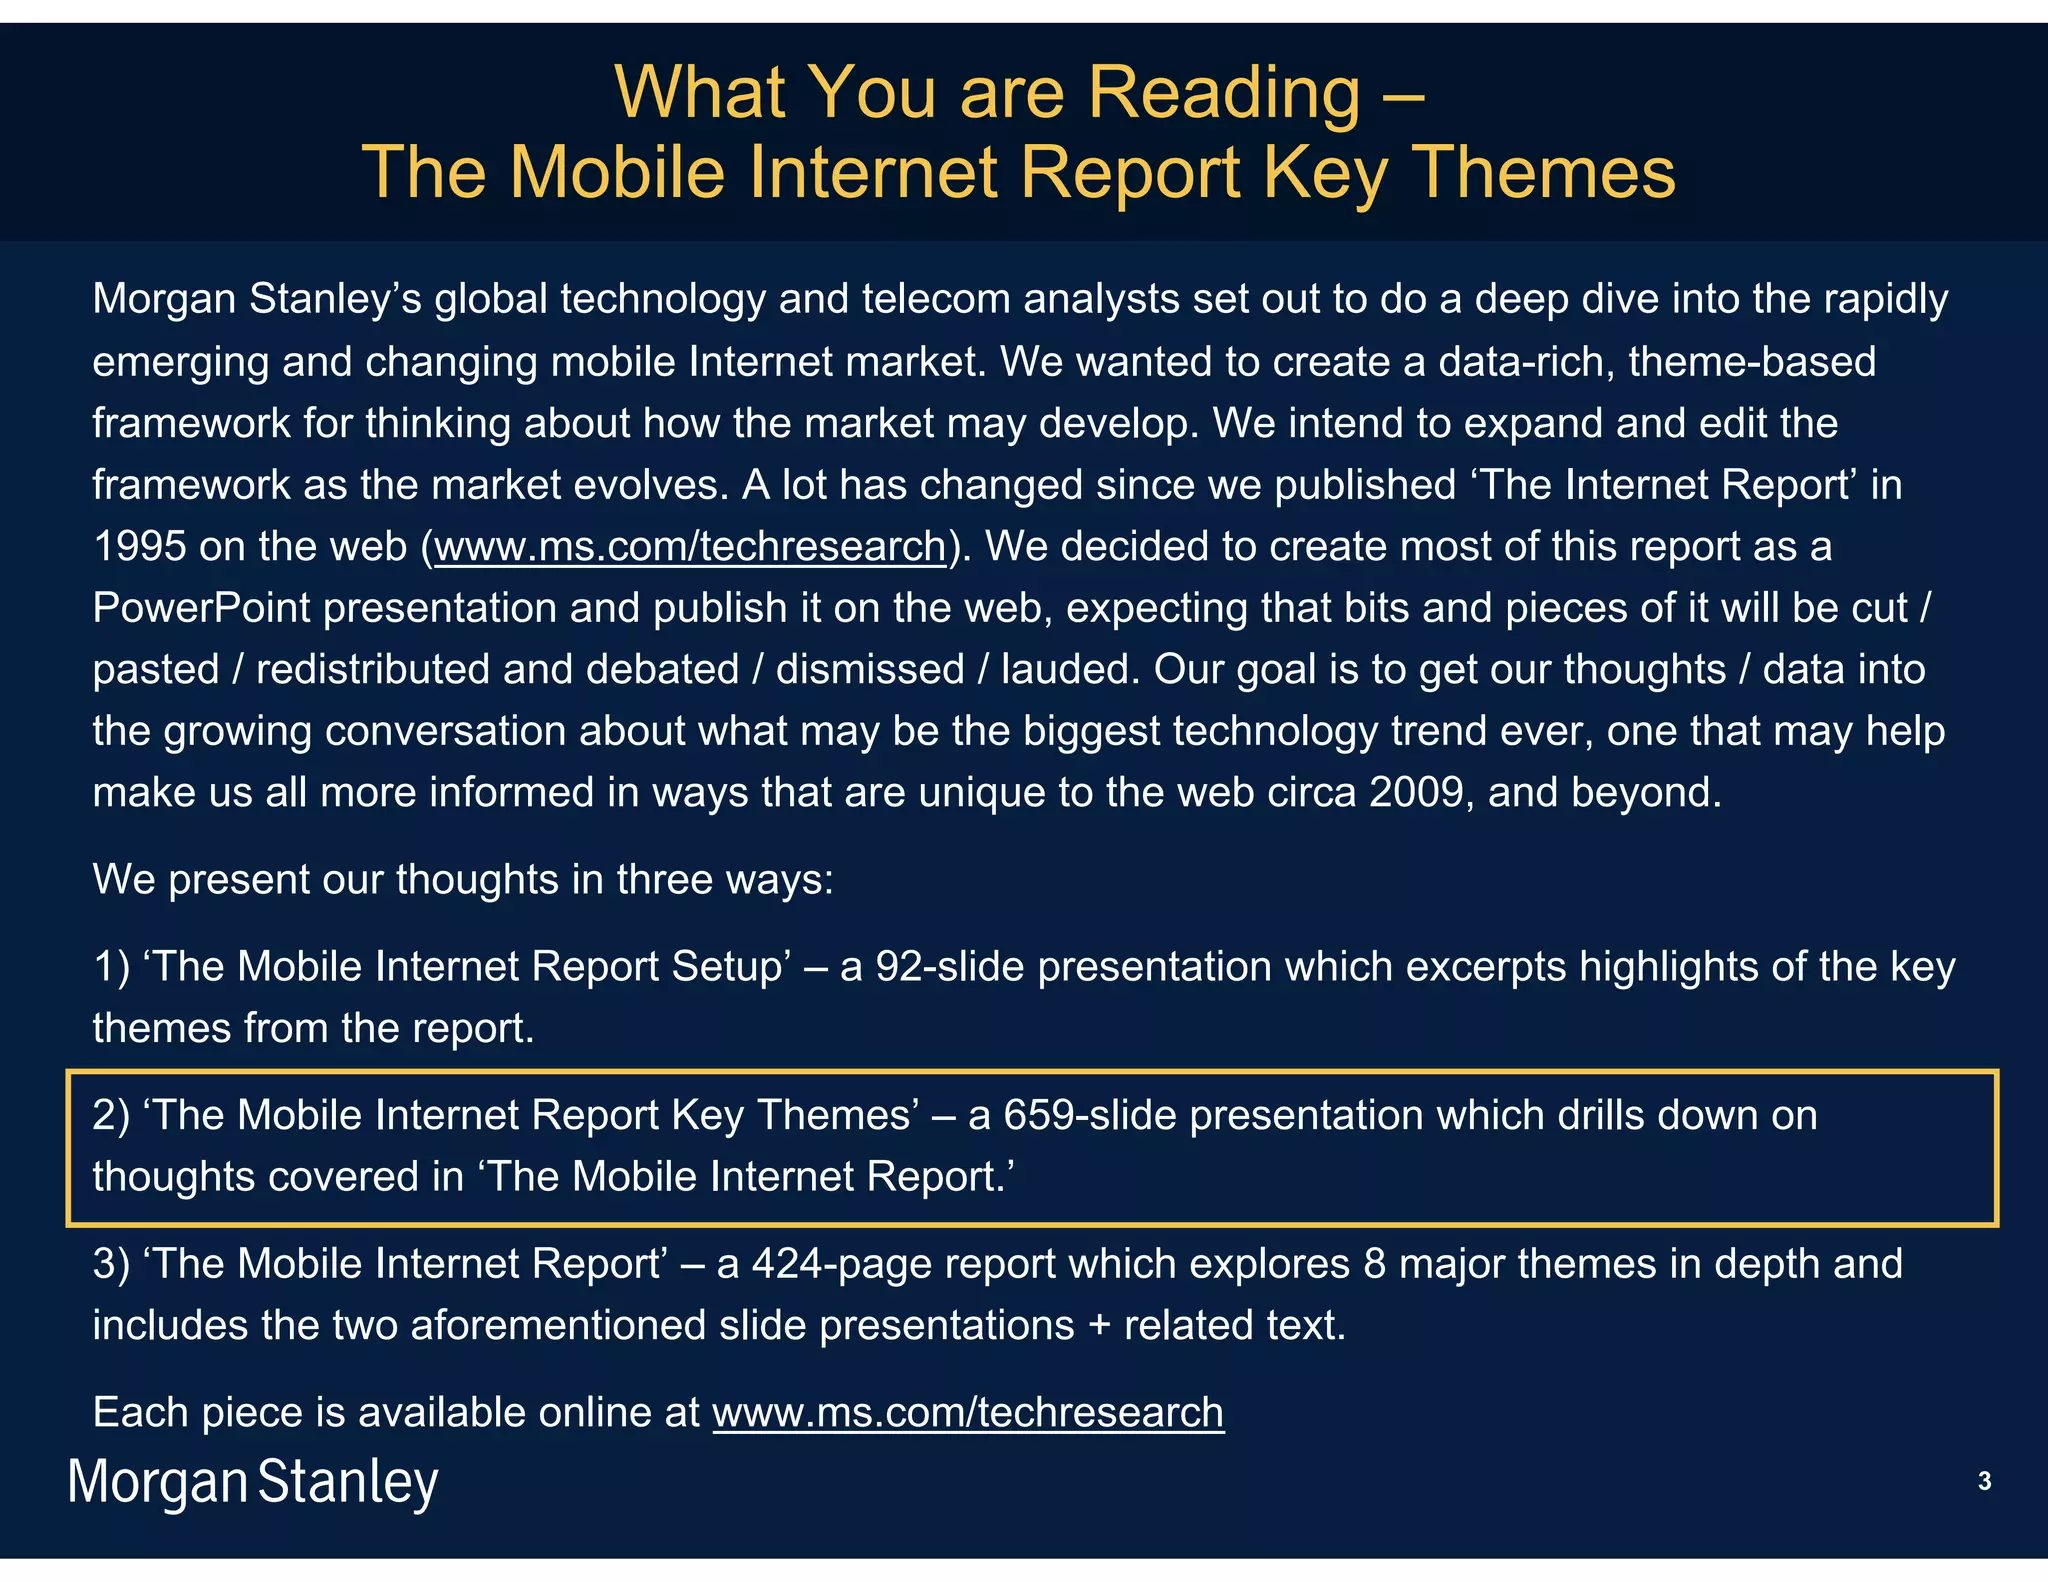
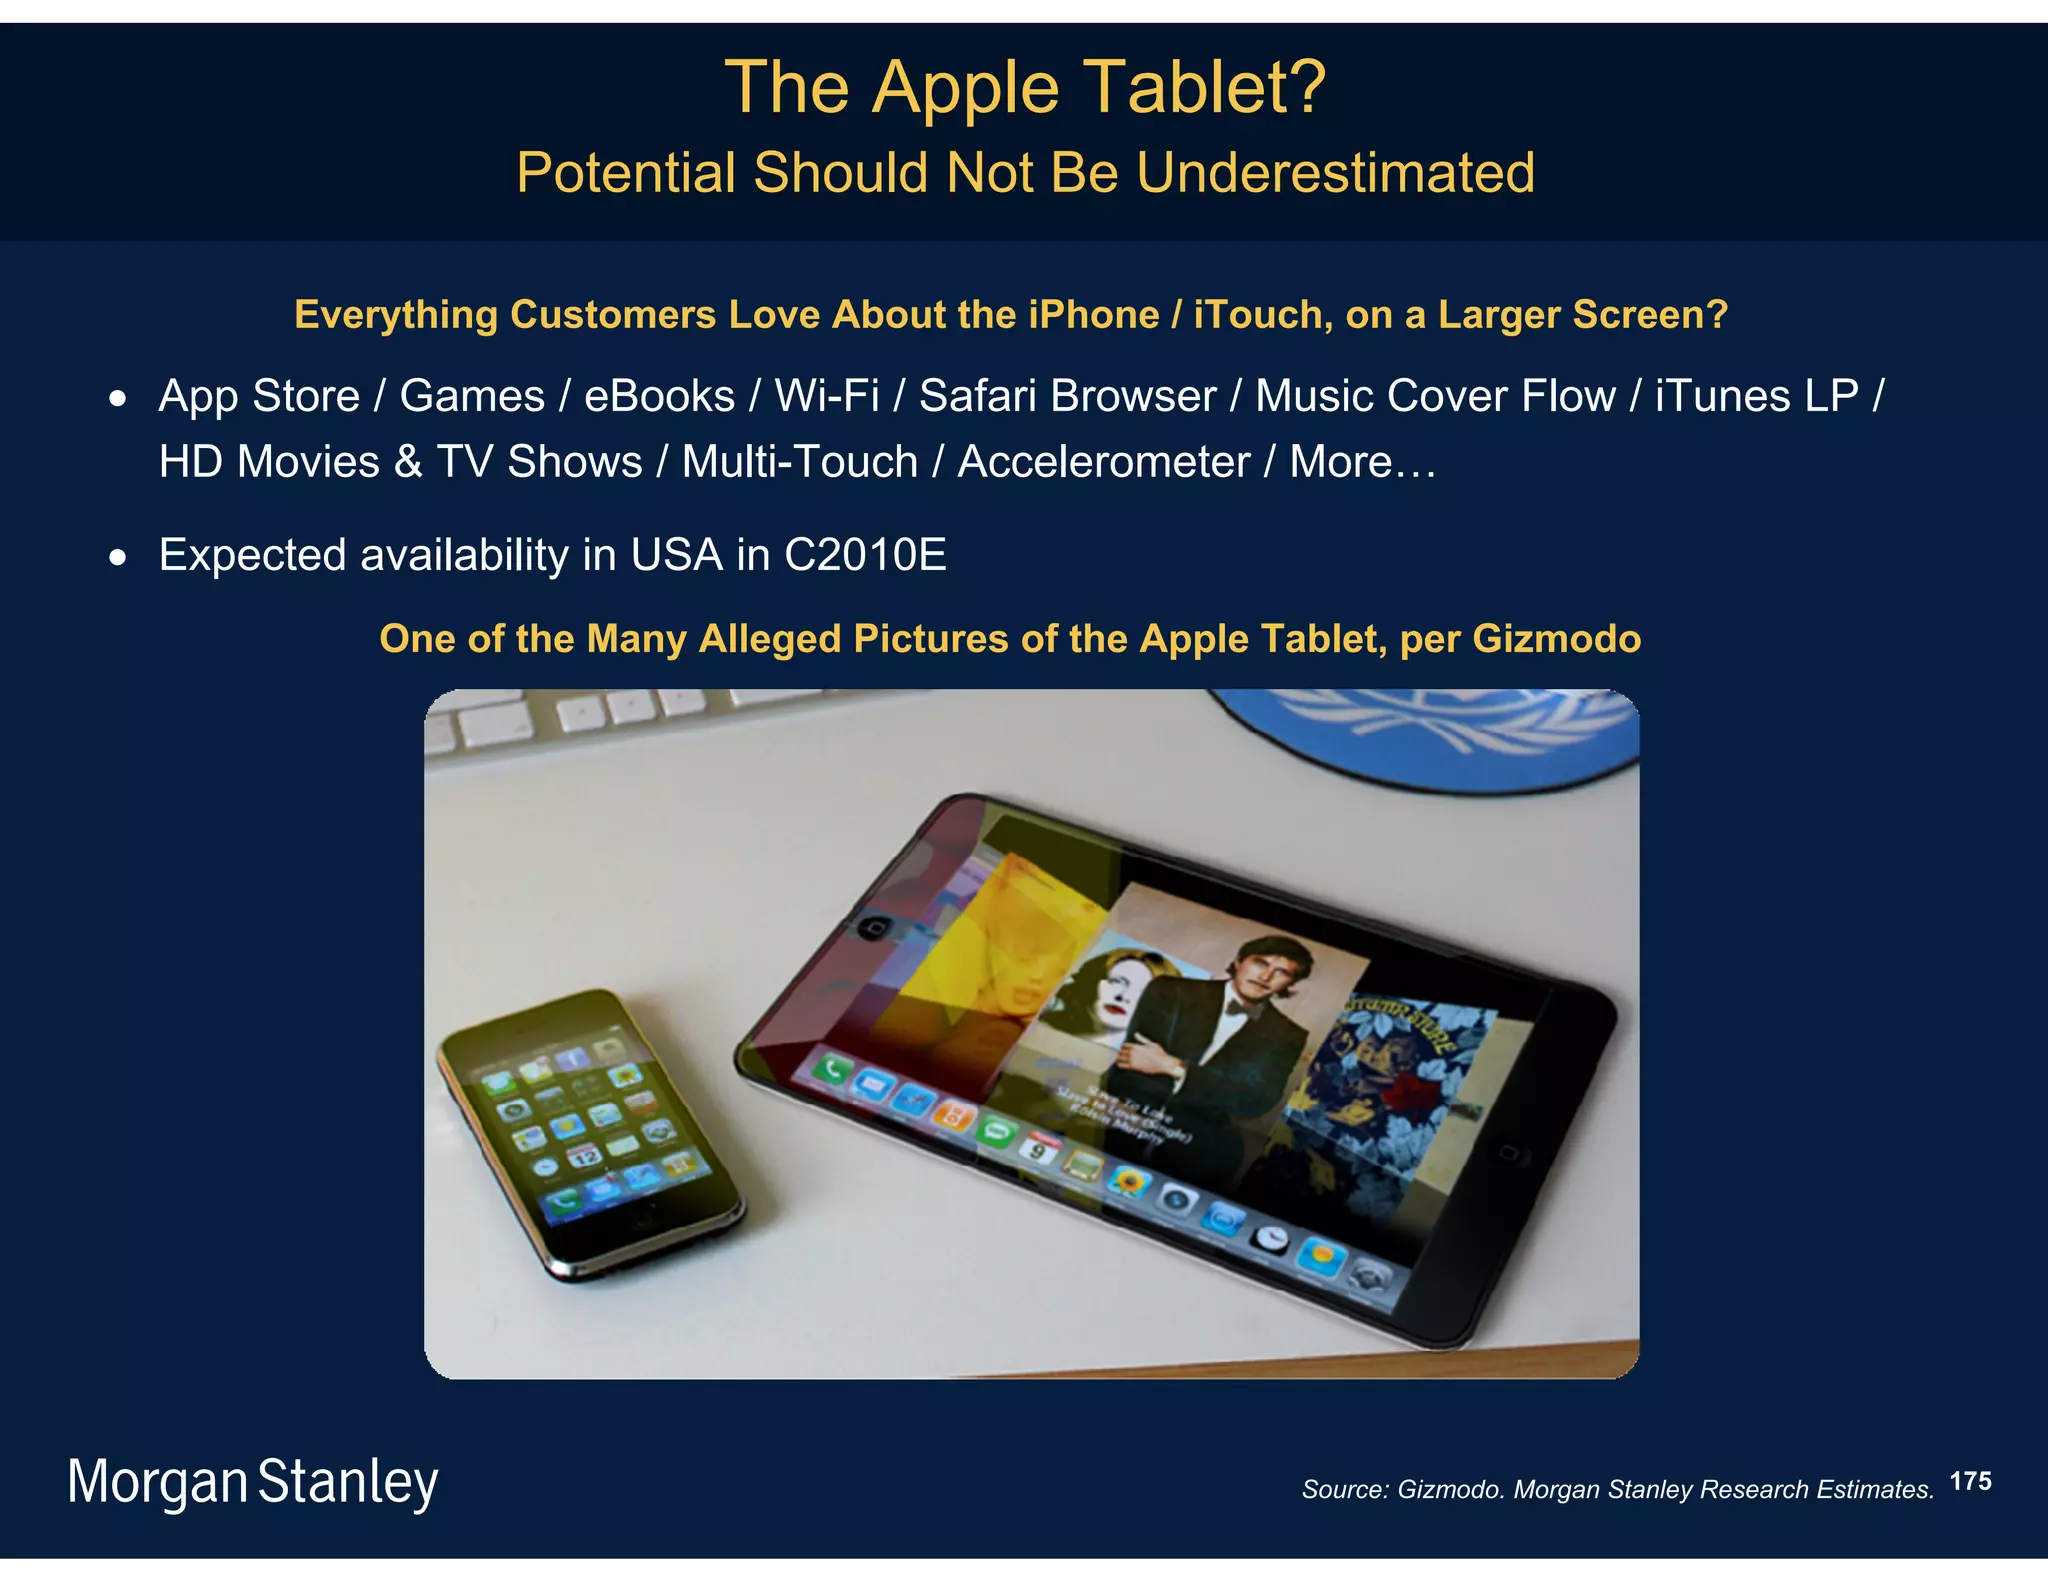
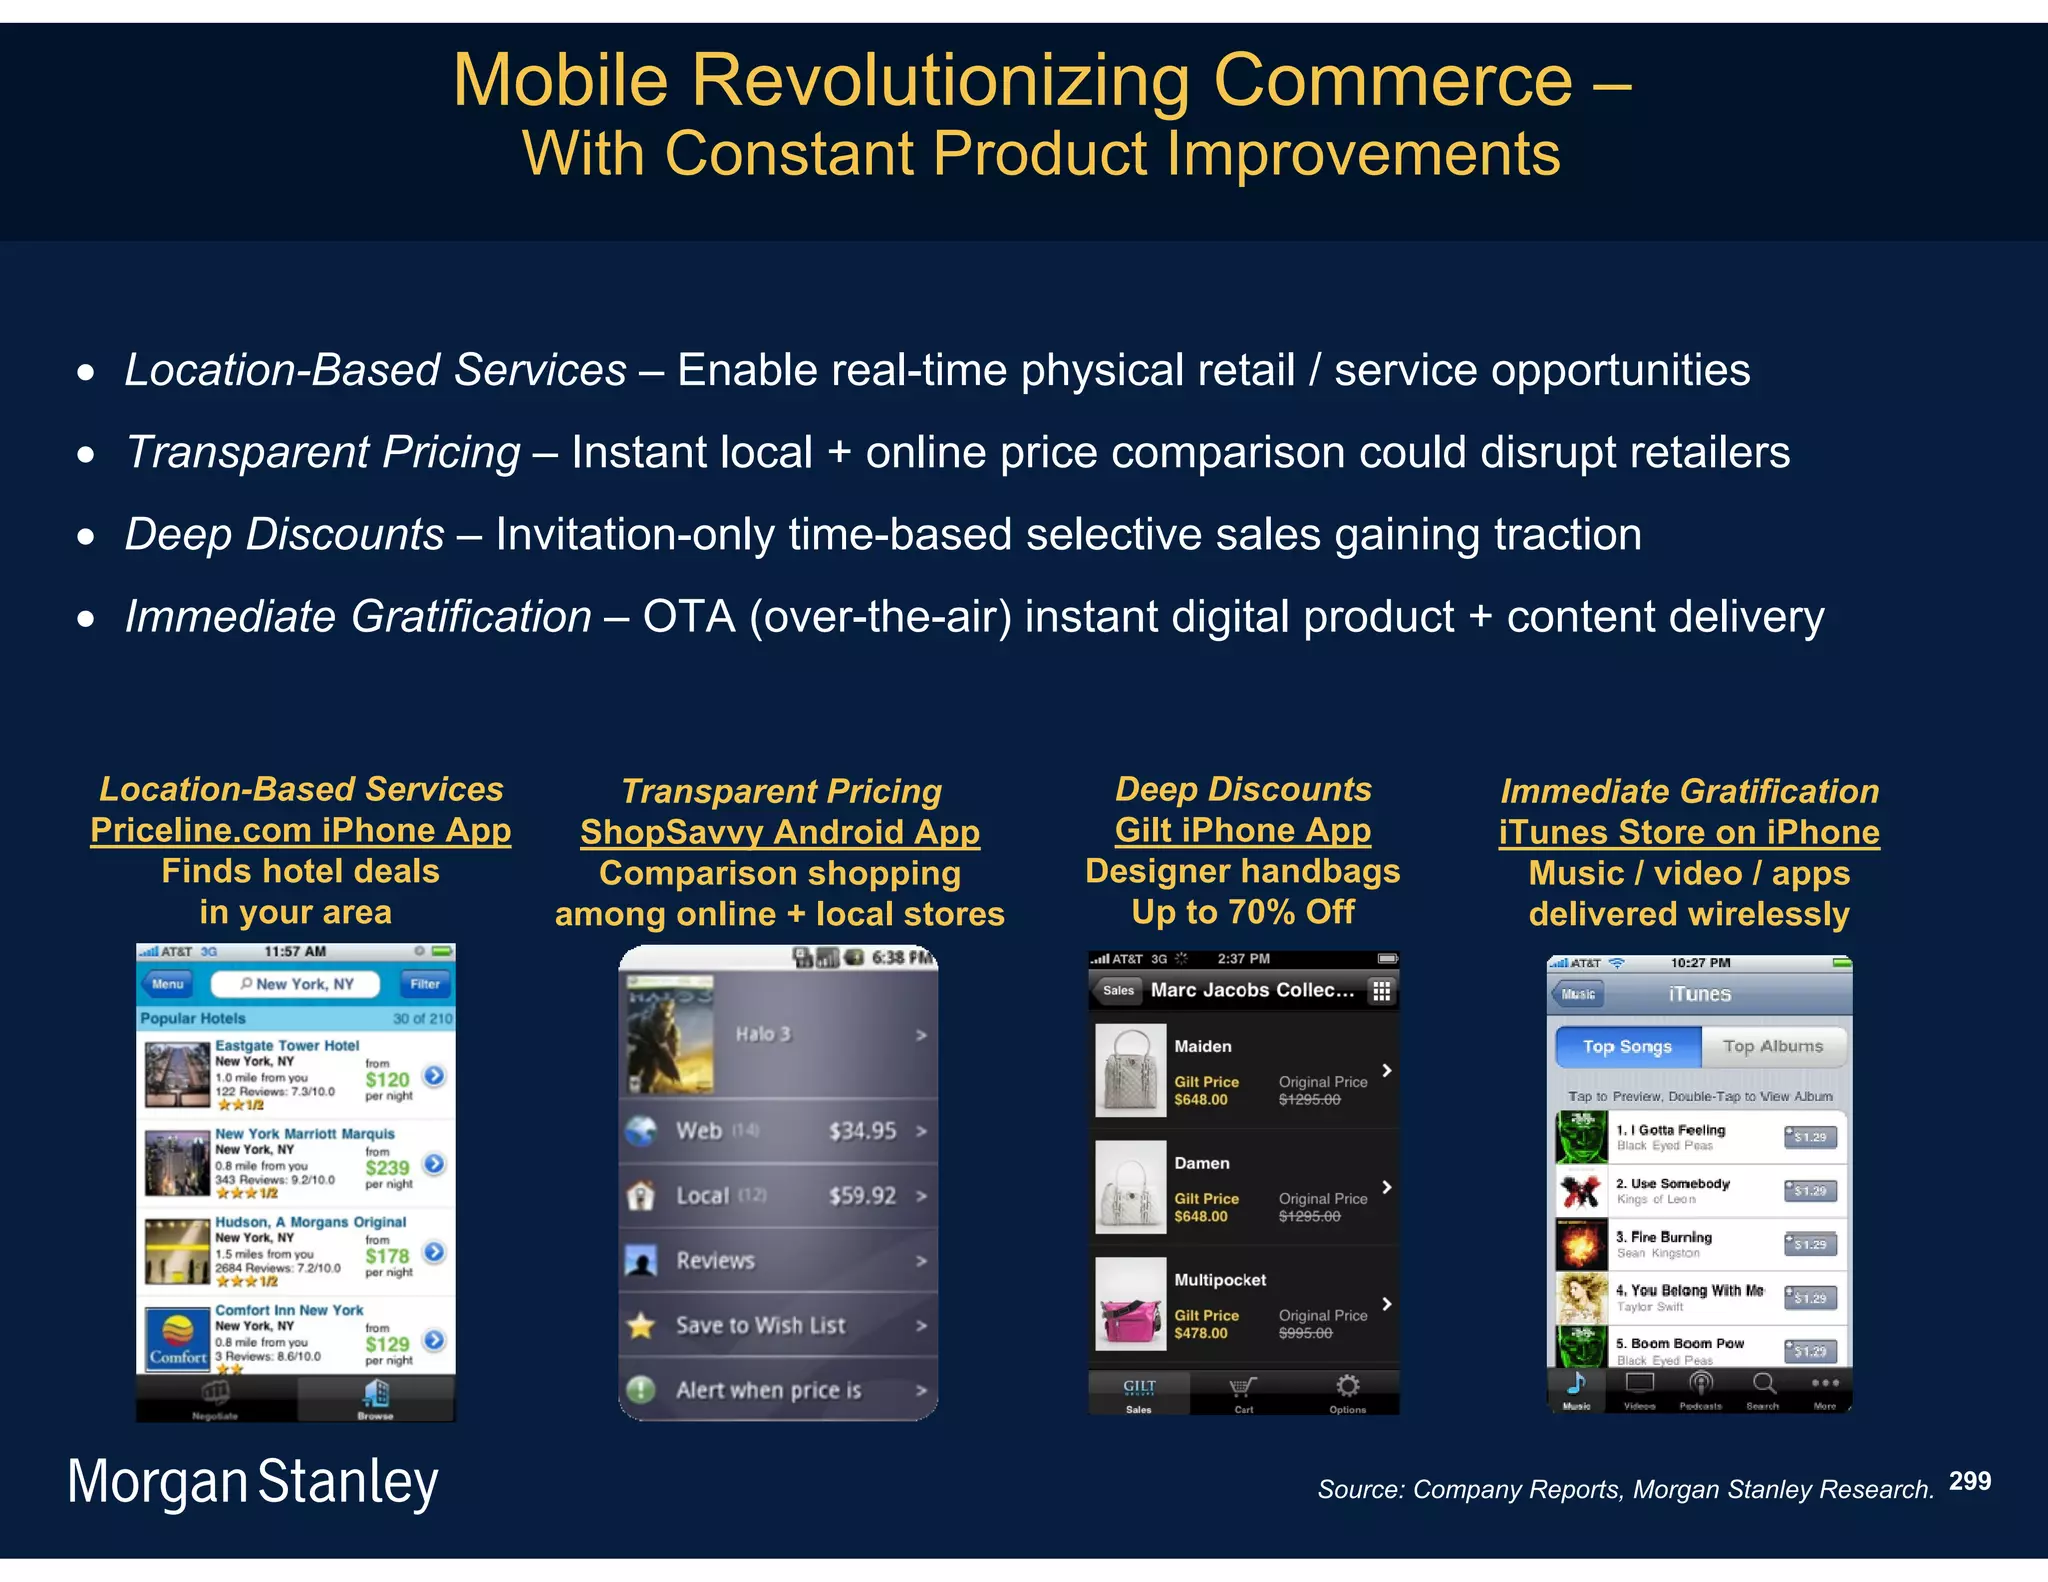
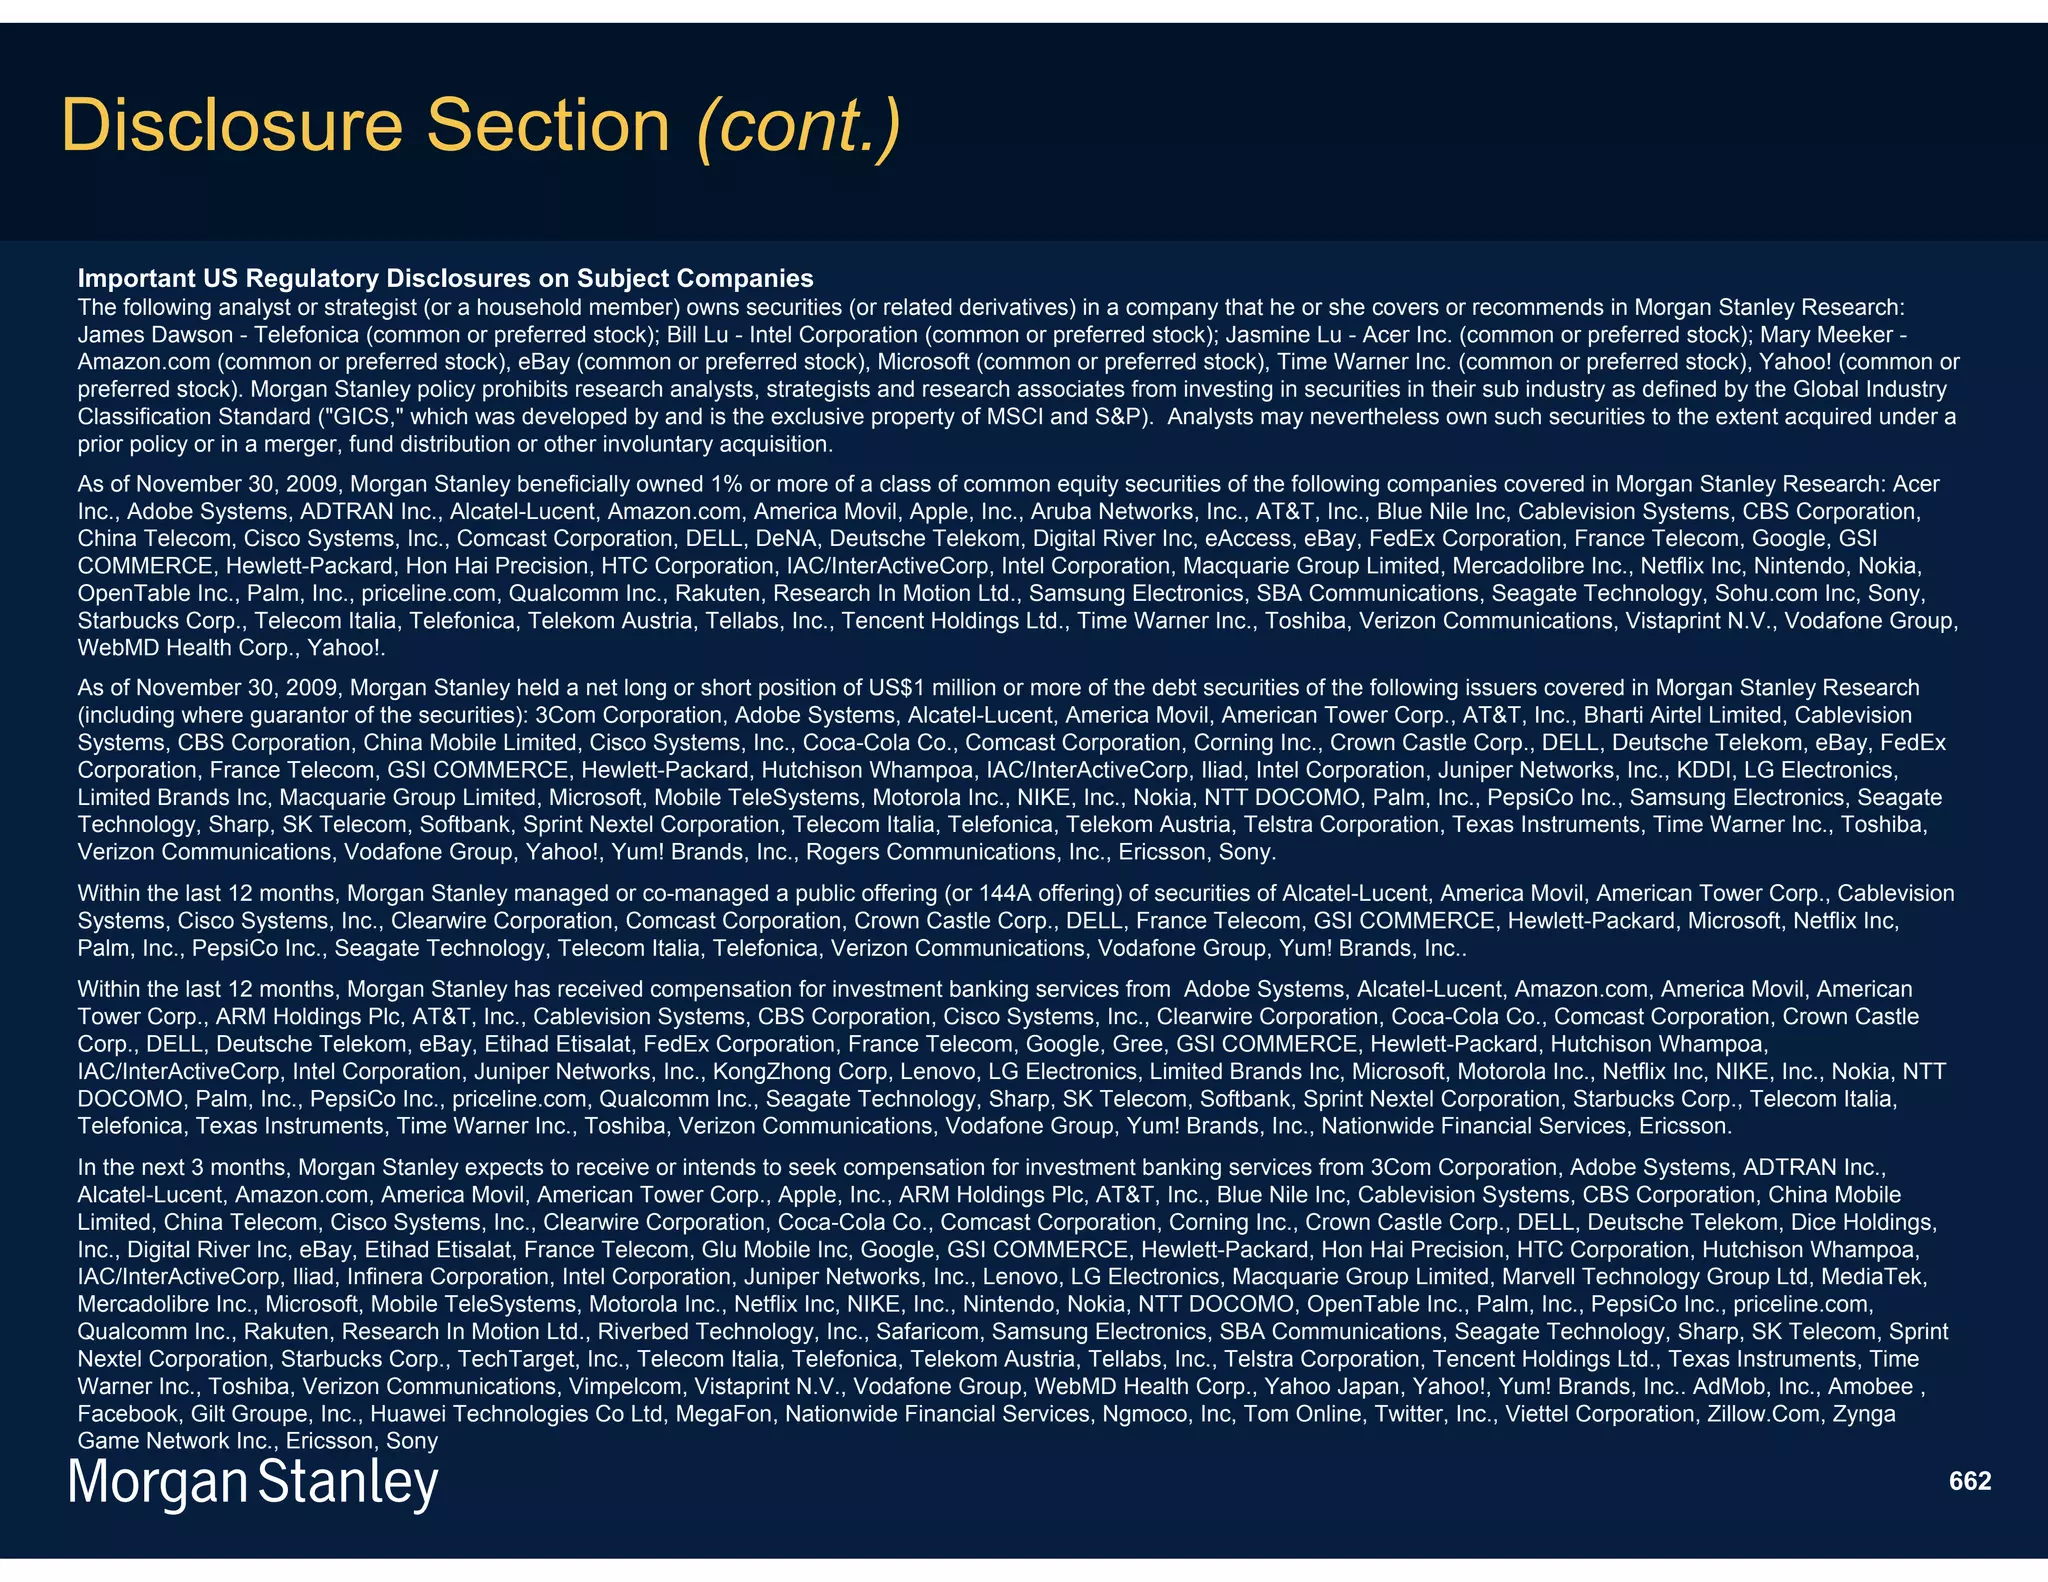
![iPhone Apps for Nearly Everyone –
Lots of Disintermediation Already…More to Come
Existing Potentially Displaced by… …iPhone Solutions Existing Product
Products Shipments / Users
Wi-Fi enabled VoIP Apps (Skype / Free calling + online status + IM / SMS 1B
Landline Phone Fring / Truphone…) integration 2008 global phone lines
Pandora / Spotify / iMeem / Last.fm / Personalized radio station based on genre 233MM*
Standalone Radio Public Radio (app)… / artist 2008E USA listeners
Portable DVD / Integrated iPod Function / YouTube / Better UI / local storage not a limit (for 130MM
Multimedia Players tv.com / [Hulu] / [Netflix] streaming apps) 2009E global shipments
Low-end Digital Built-in Camera / Nationwide 3.0 Megapixels / tap to select focus / anti- 103MM
Camera Insurance app… shake shutter / OTA sharing on Facebook
/ Flickr / email / Nationwide Insurance app 2009E global shipments
Better UI / local storage not a limit (for 62MM
MP3 Players Integrated iPod Function / Spotify streaming apps) 2009E global shipments
Built-in Google Maps / App Store Same basic function + always-on Internet 48MM
GPS Devices (ATT Navigator…) connection 2009E global shipments
Portable Gaming Tap Tap Revenge / Bejeweled / Flight Lower ASP / instant OTA download / multi- 48MM
Devices Control… touch control 2009E global shipments
Low-end Built-in Video Capture Function / Built-in video editing / OTA upload to 14MM
Camcorders FOX News UReport… YouTube / OTA upload to FOX News 2009E global shipments
Standalone Voice Built-in Voice Recorder Digitized / easy to manage / sync with PC --
Recorder
Compass Built-in Electronic Compass Synergy with built-in maps feature --
Audible Dictionary Lonely Planet Mobile Phrasebook Available in 10 languages, 600+ spoken --
phrases in each language
Note: *OTA = Over the Air; 233MM radio listeners in USA, per SNL Kagan / Arbitron. Source: Future Horizons, iSuppli, IDC, 145
Morgan Stanley Research.](https://image.slidesharecdn.com/mobileinternetreportkeythemesfinal-100425034727-phpapp02/75/Mobile-internet-report_key_themes_final-145-2048.jpg)

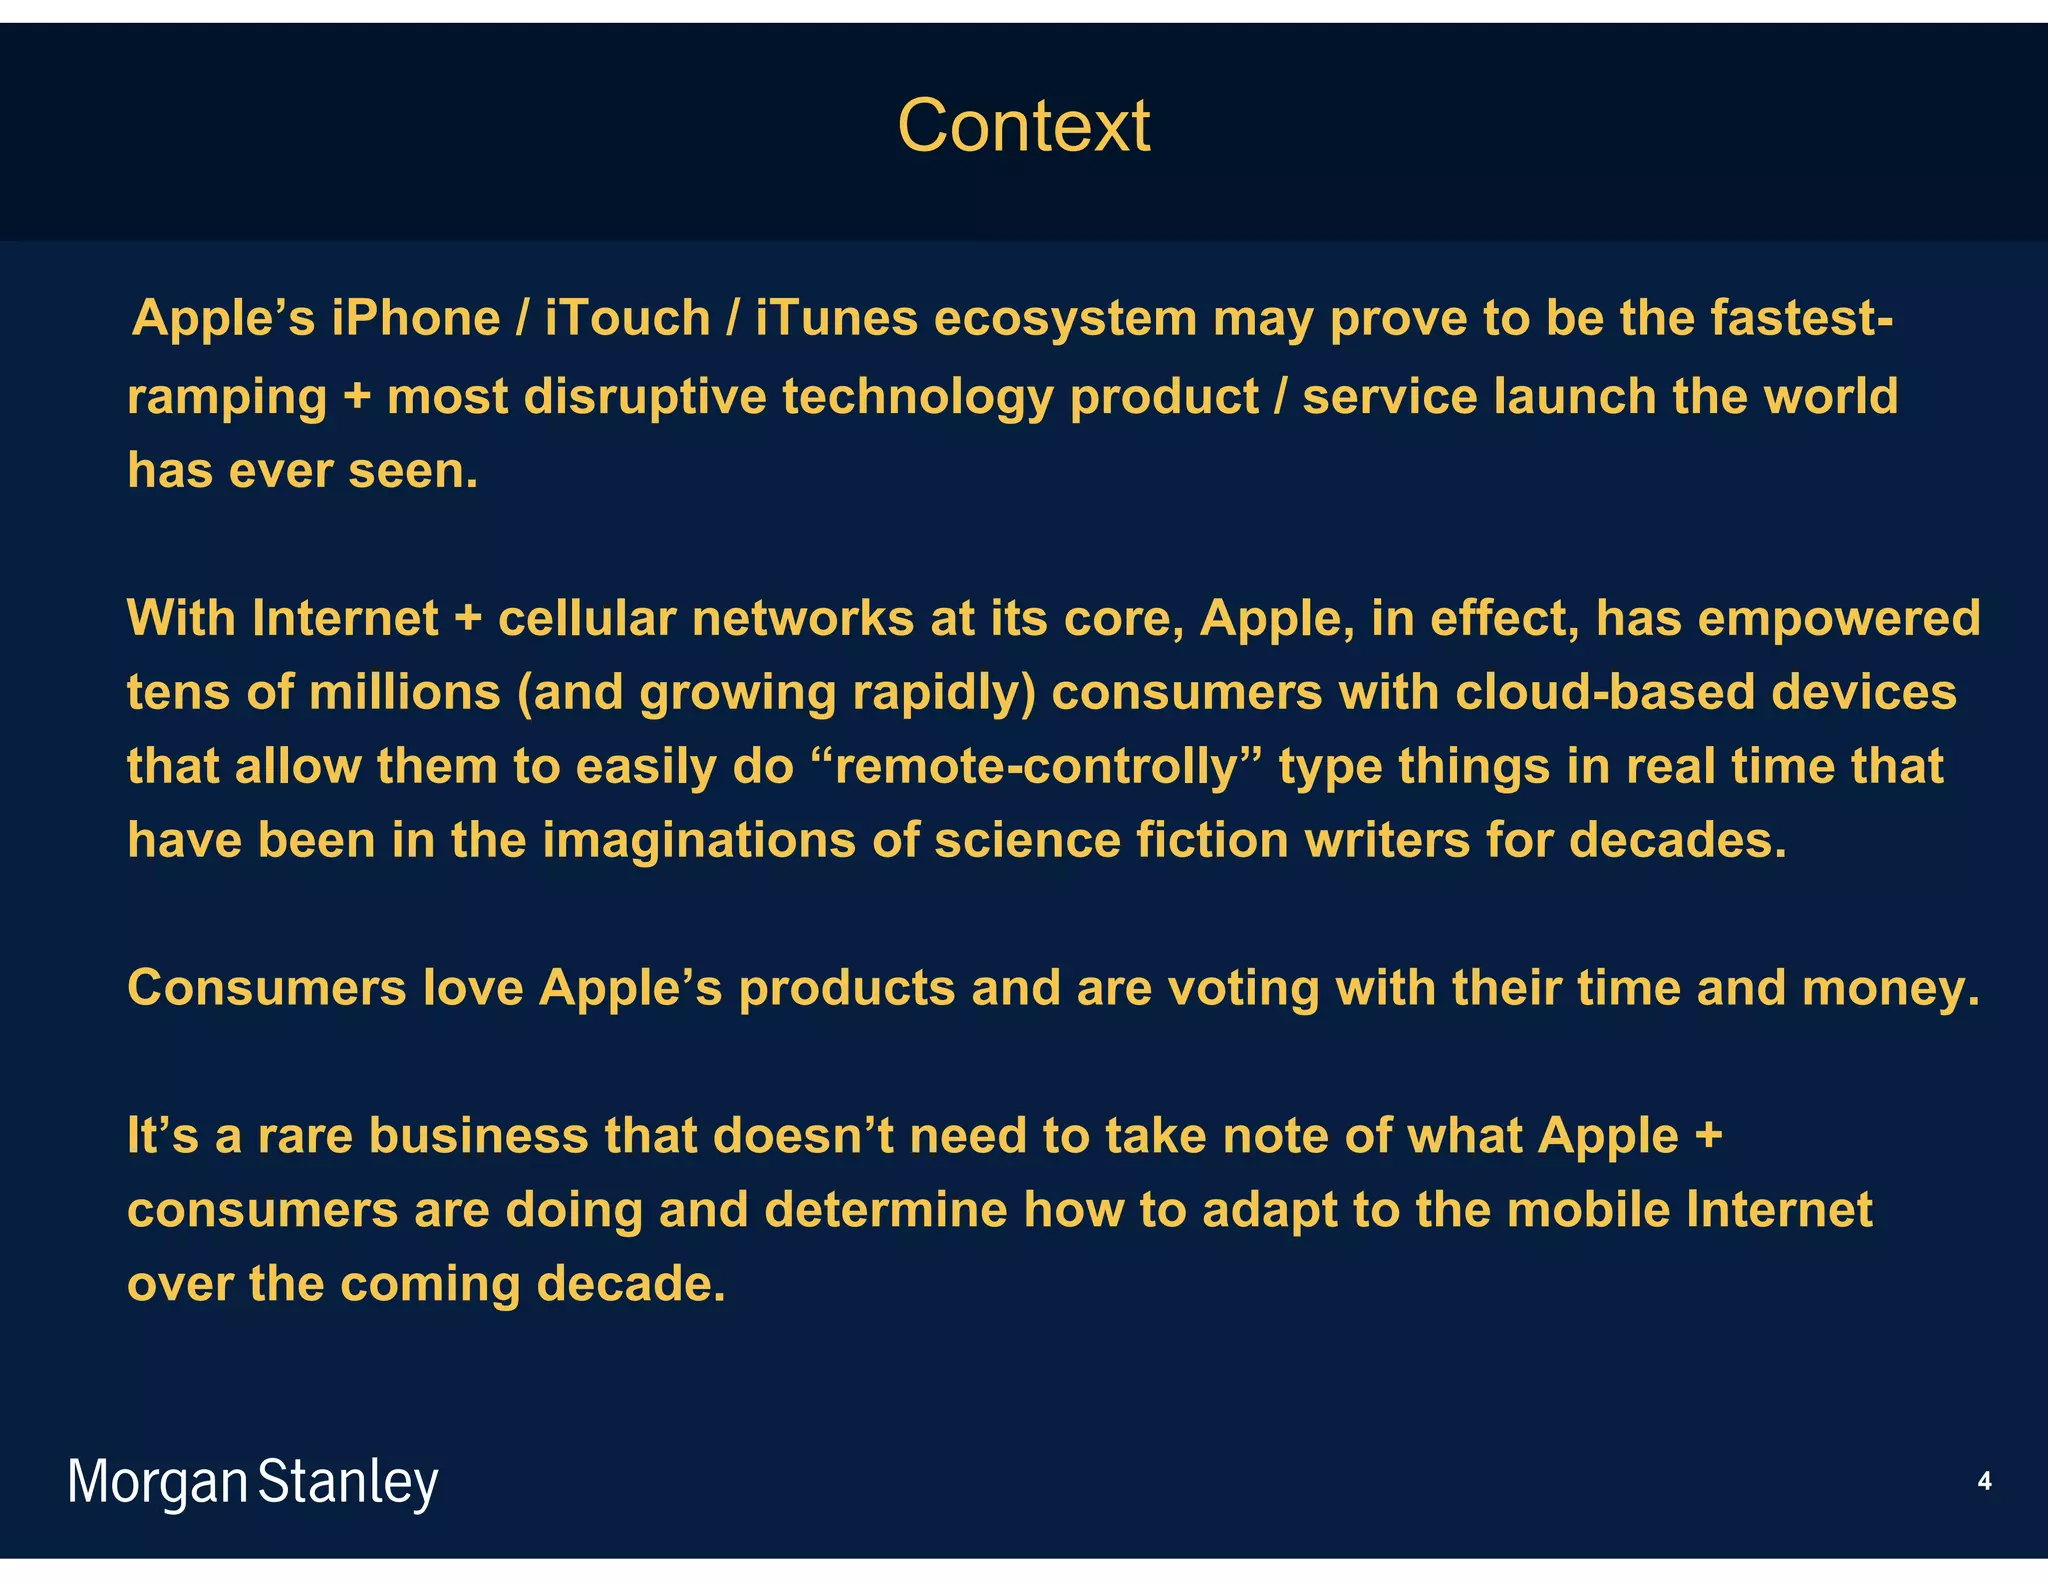
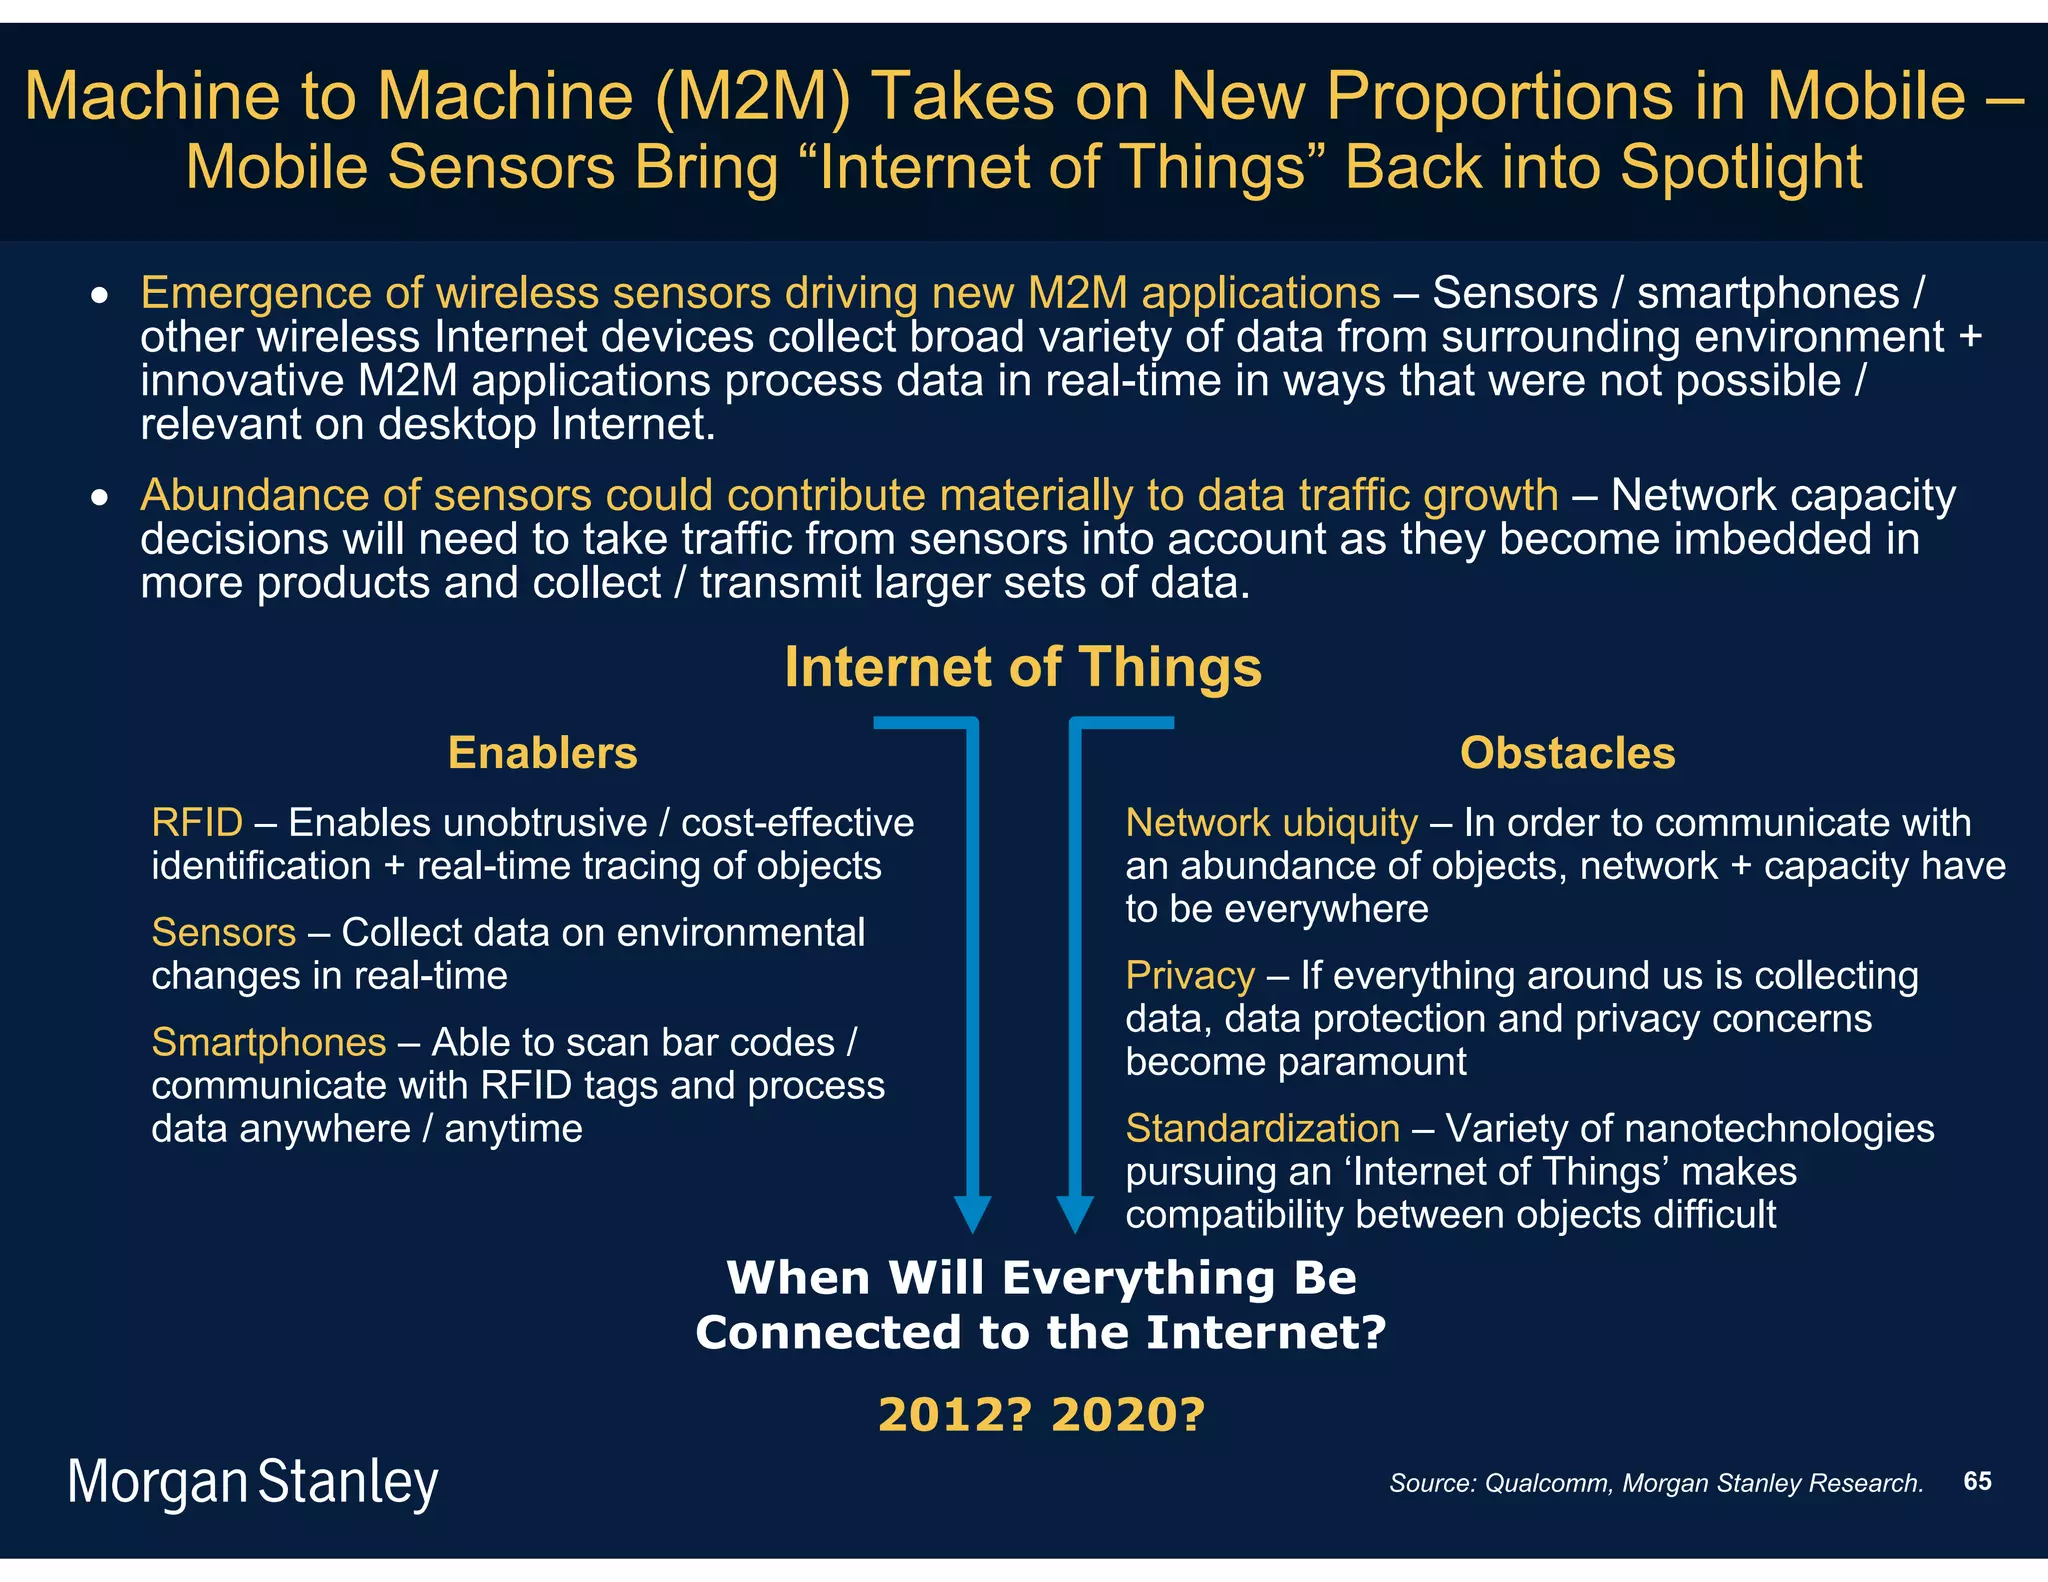
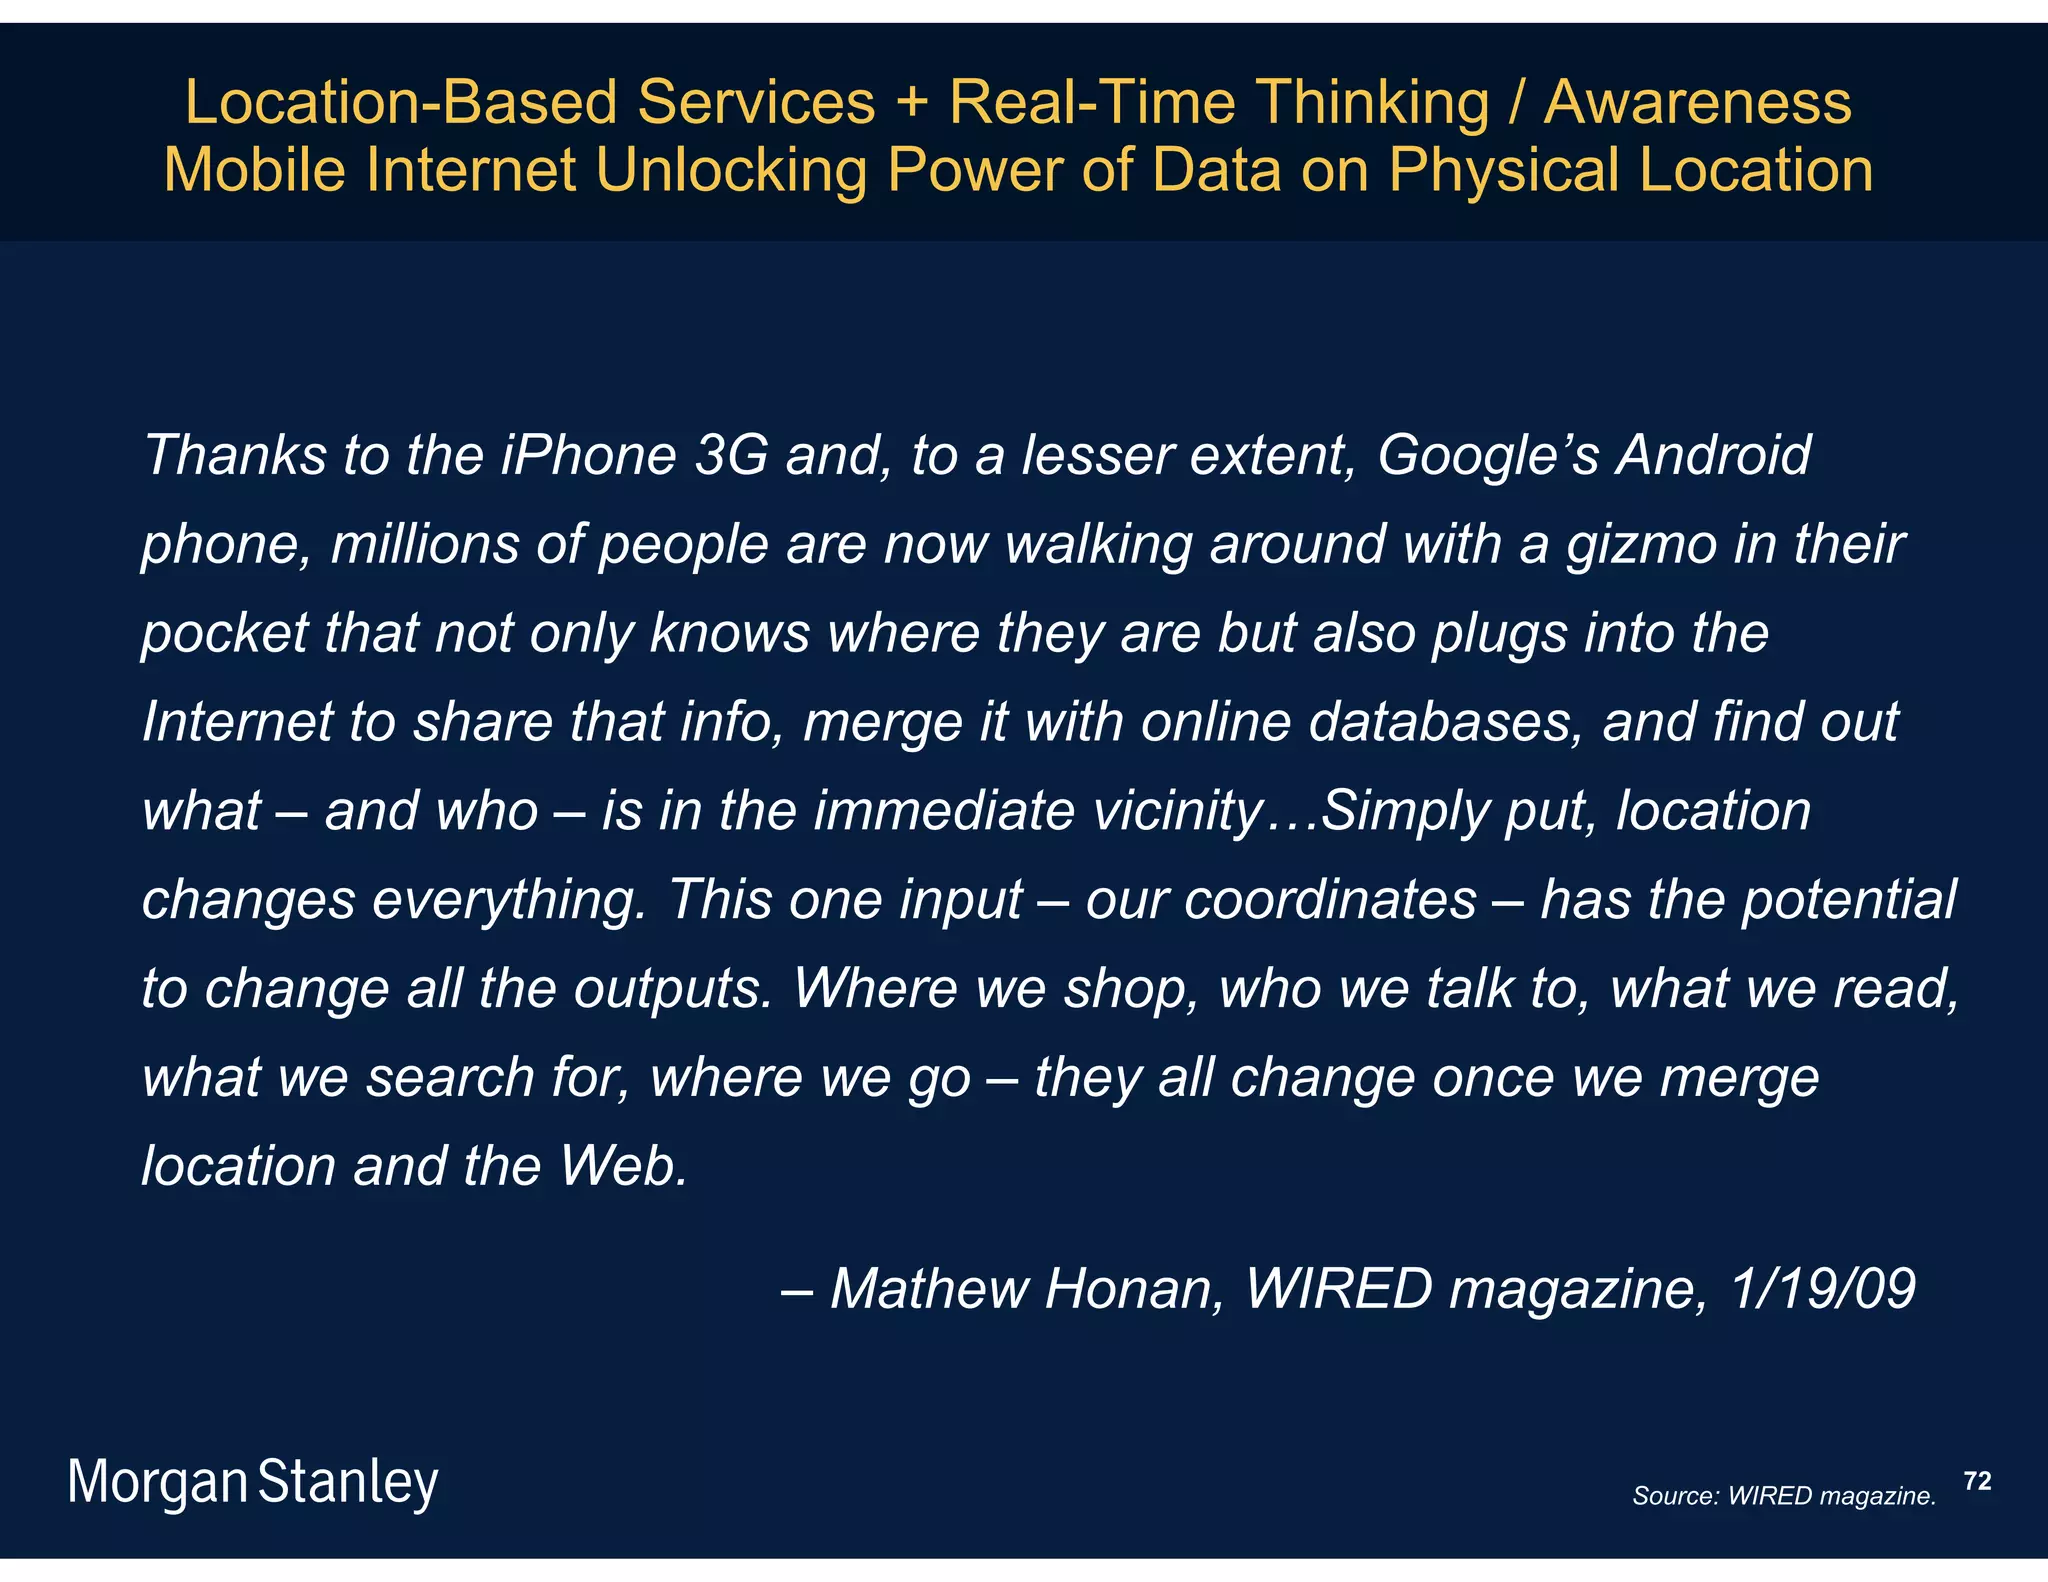
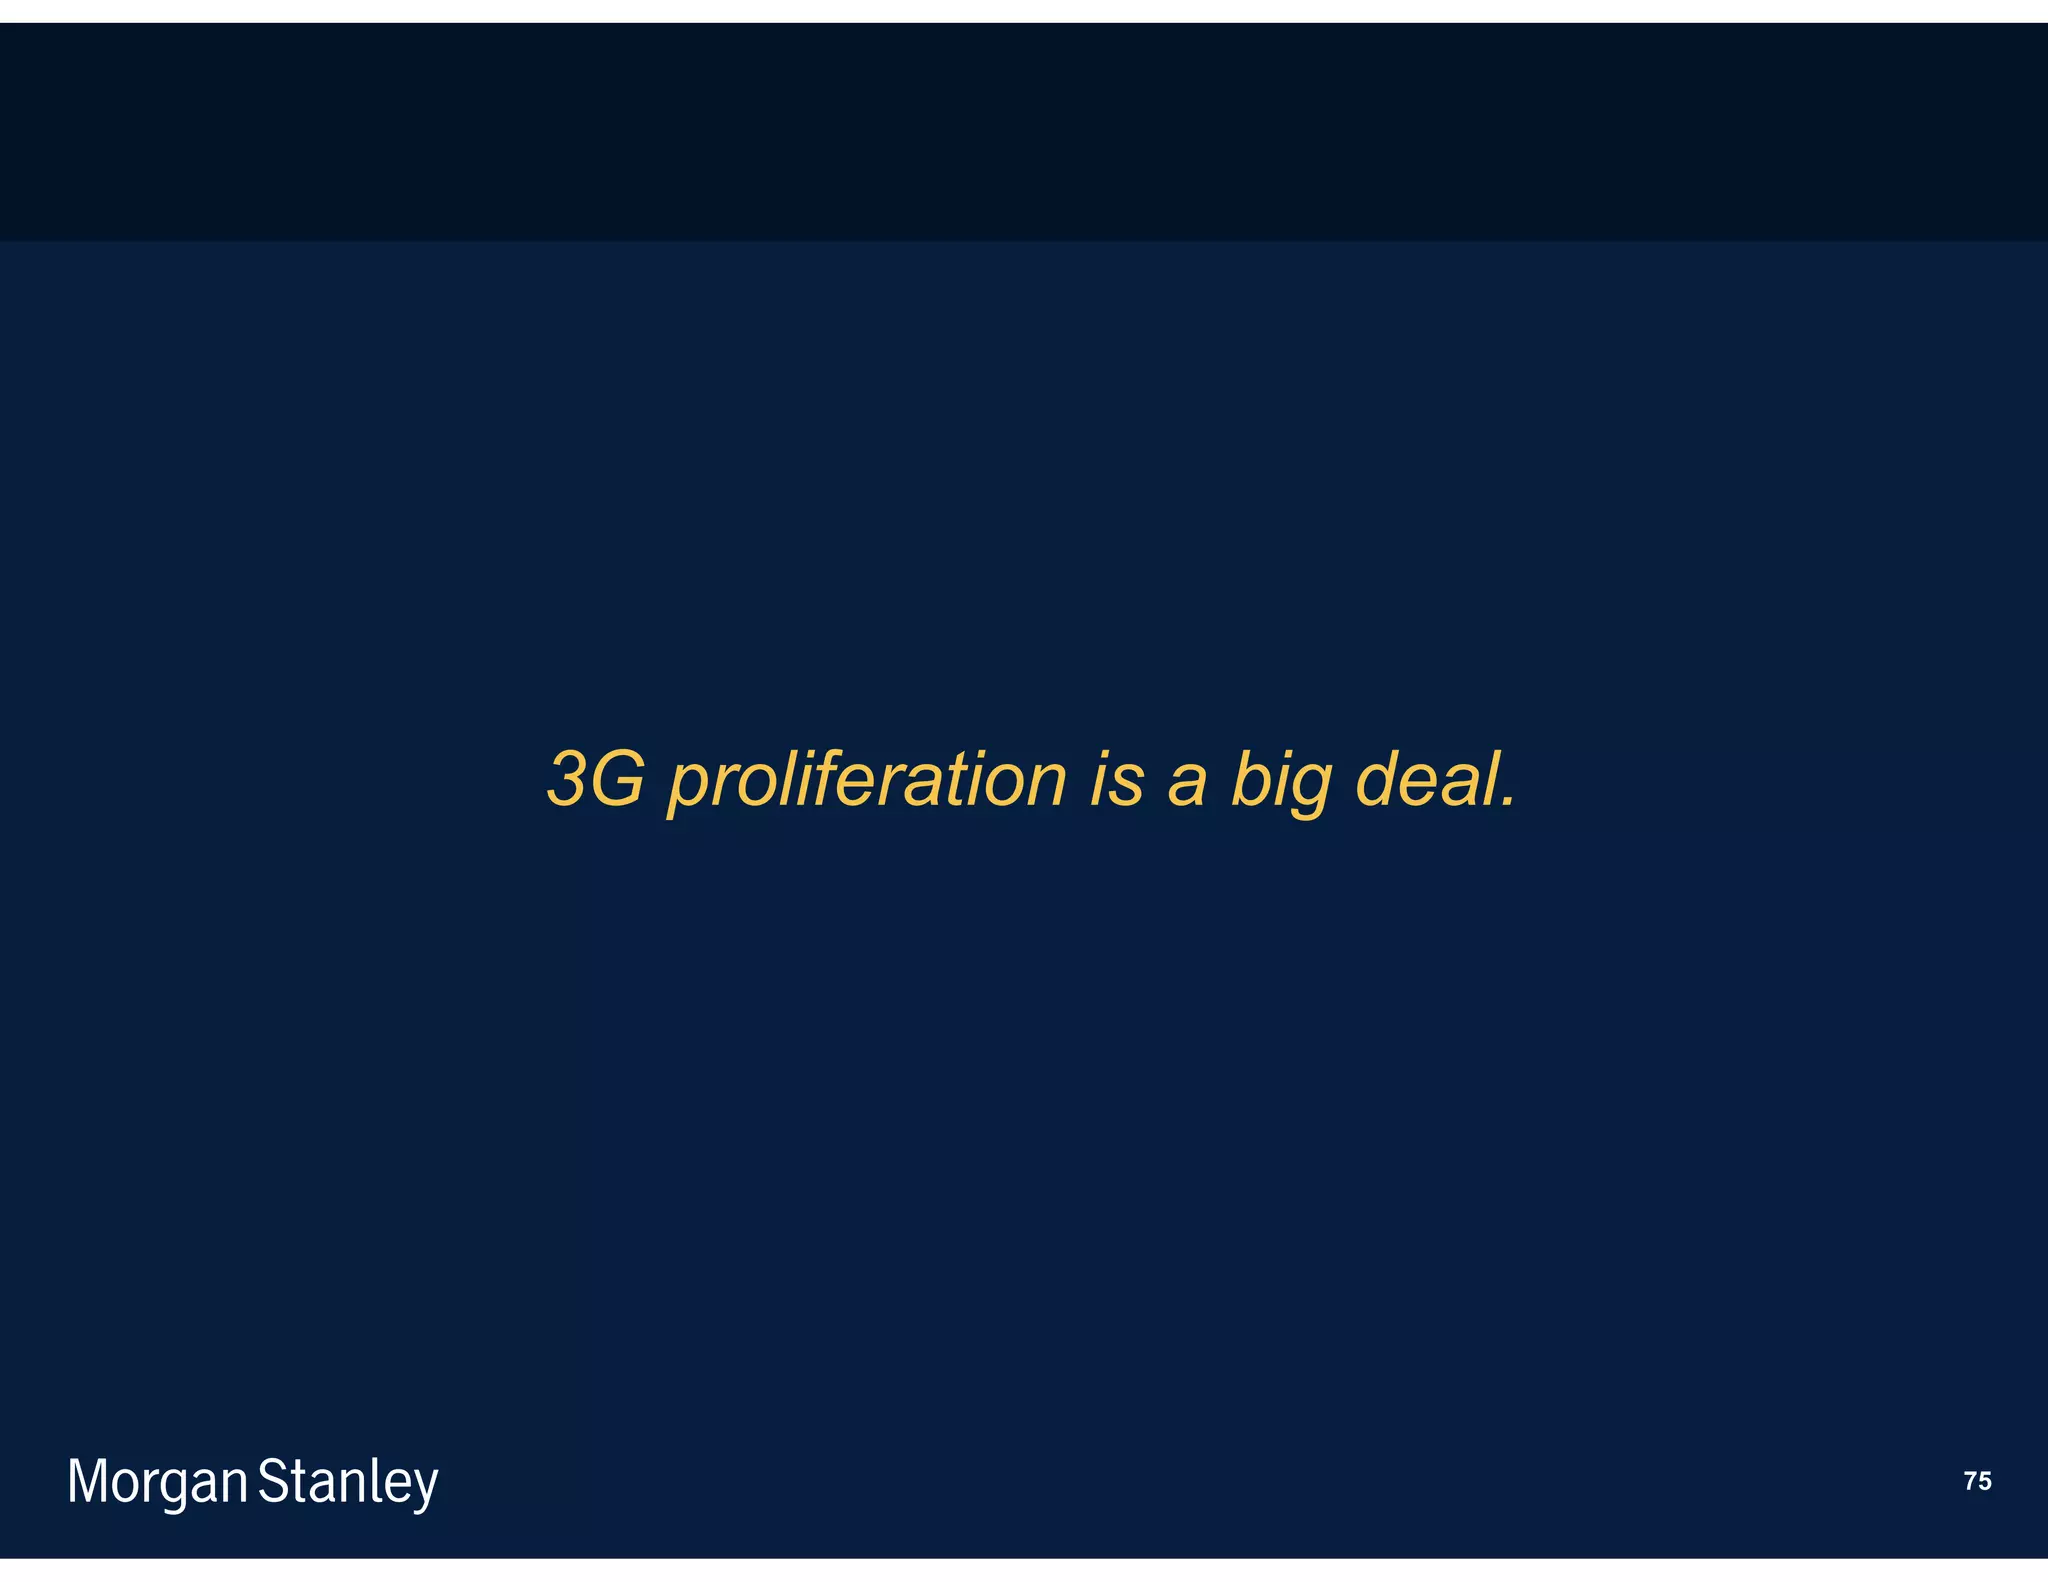
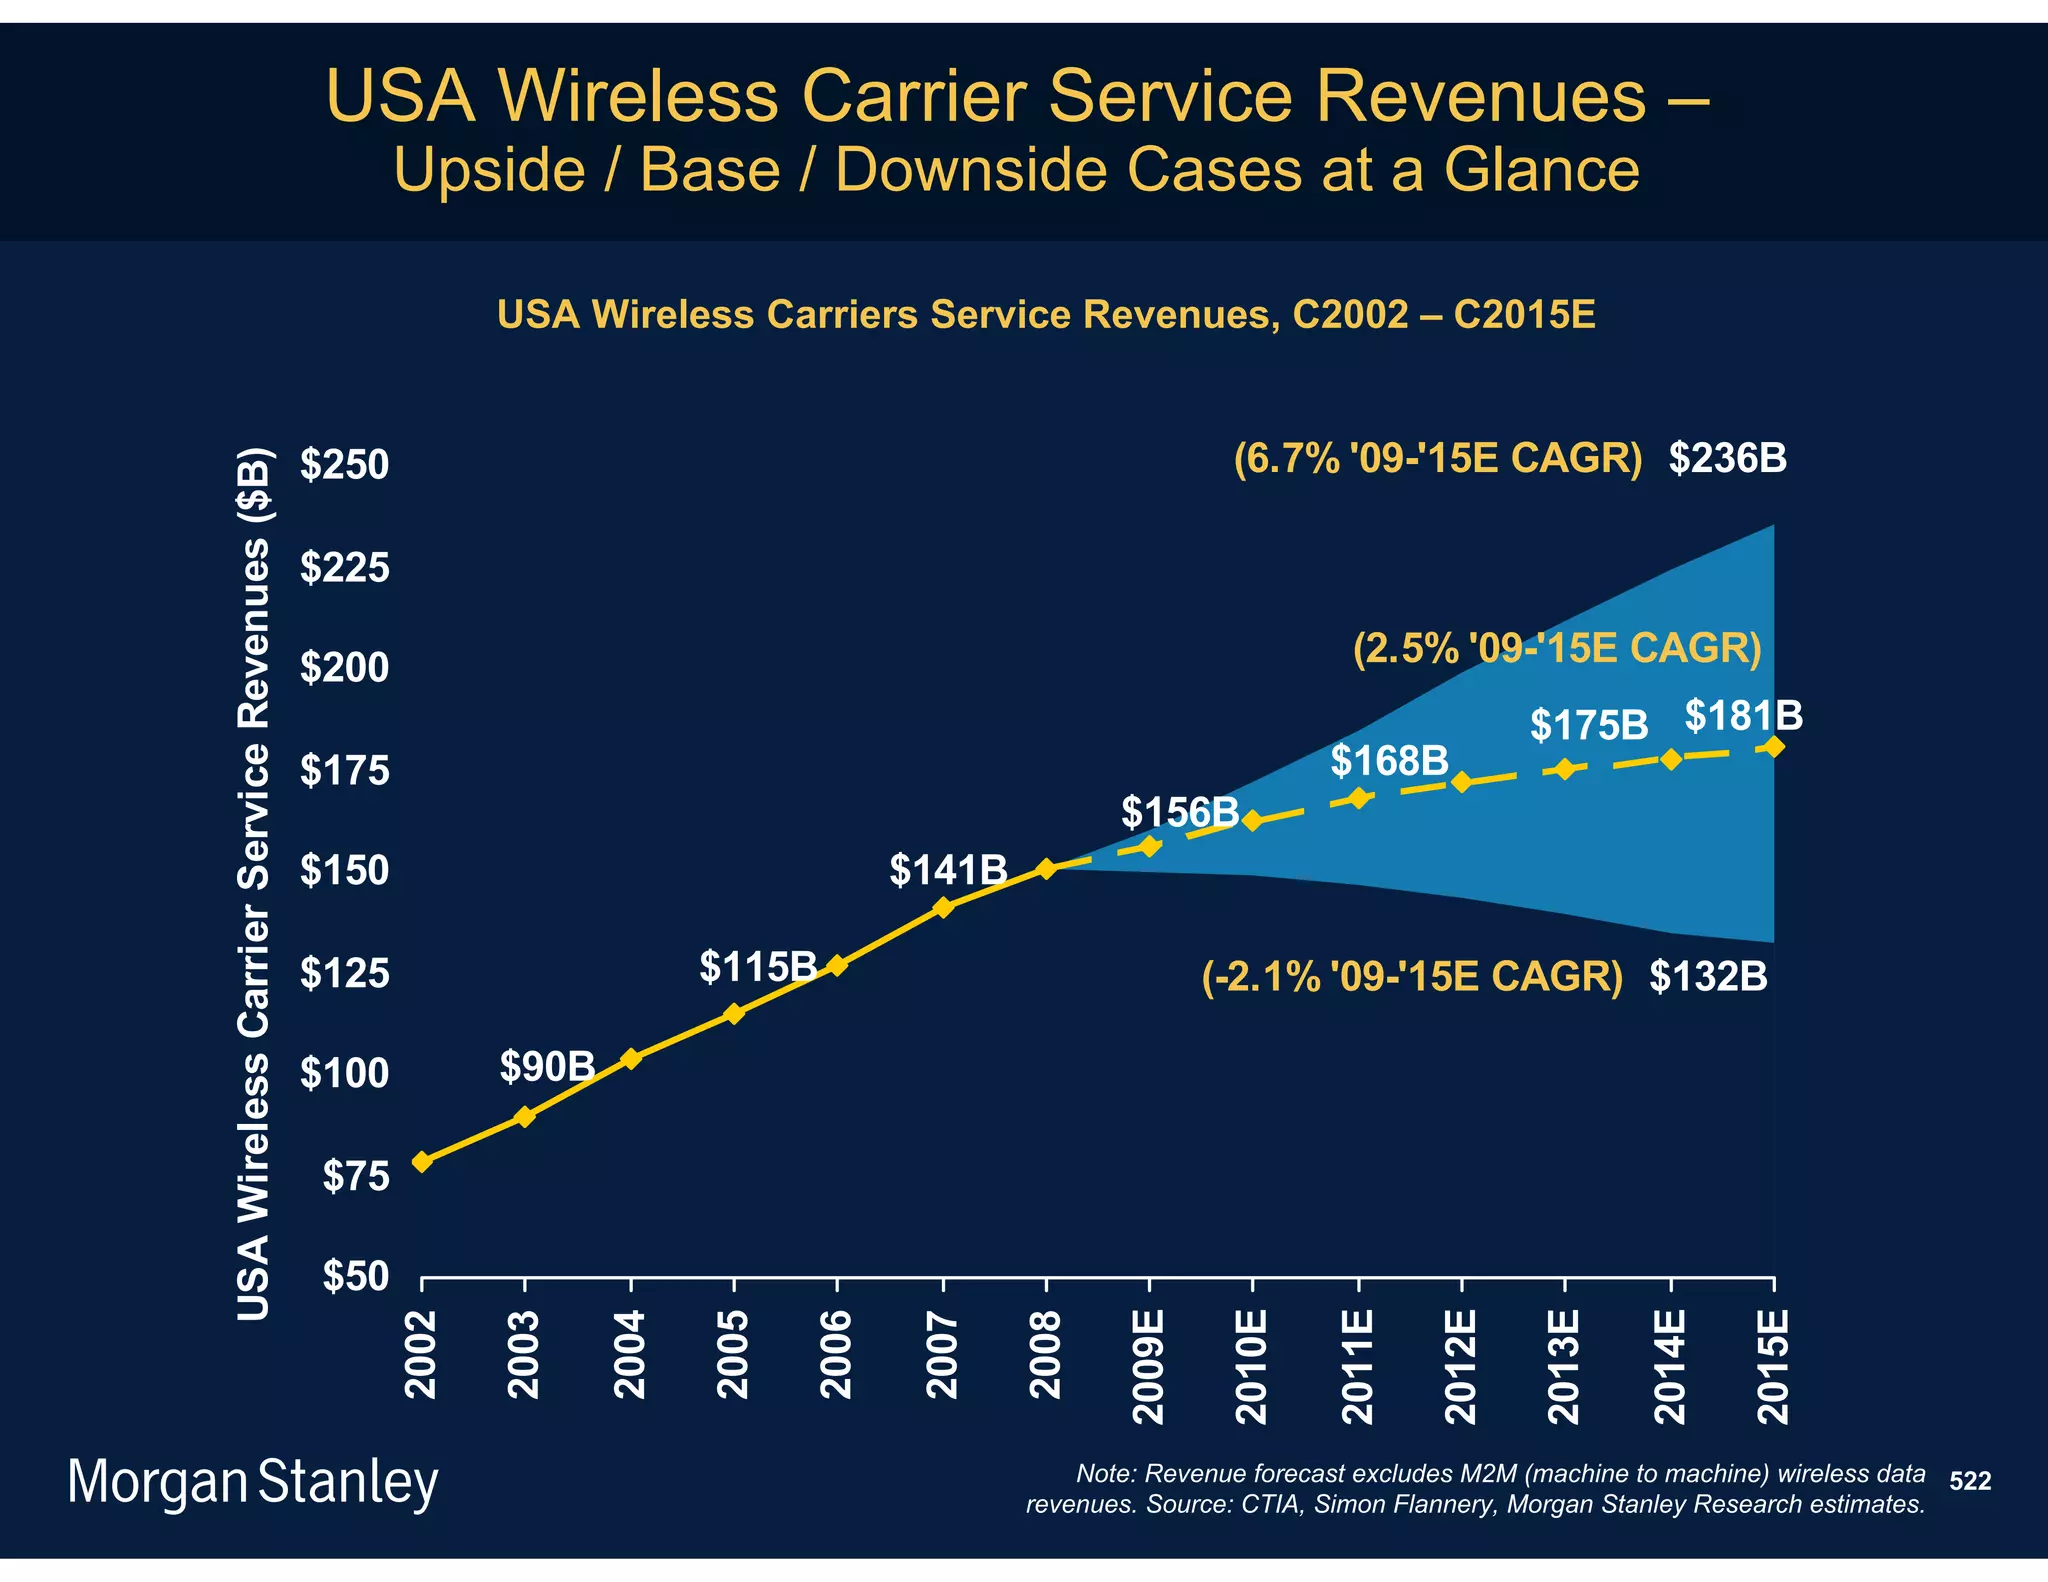
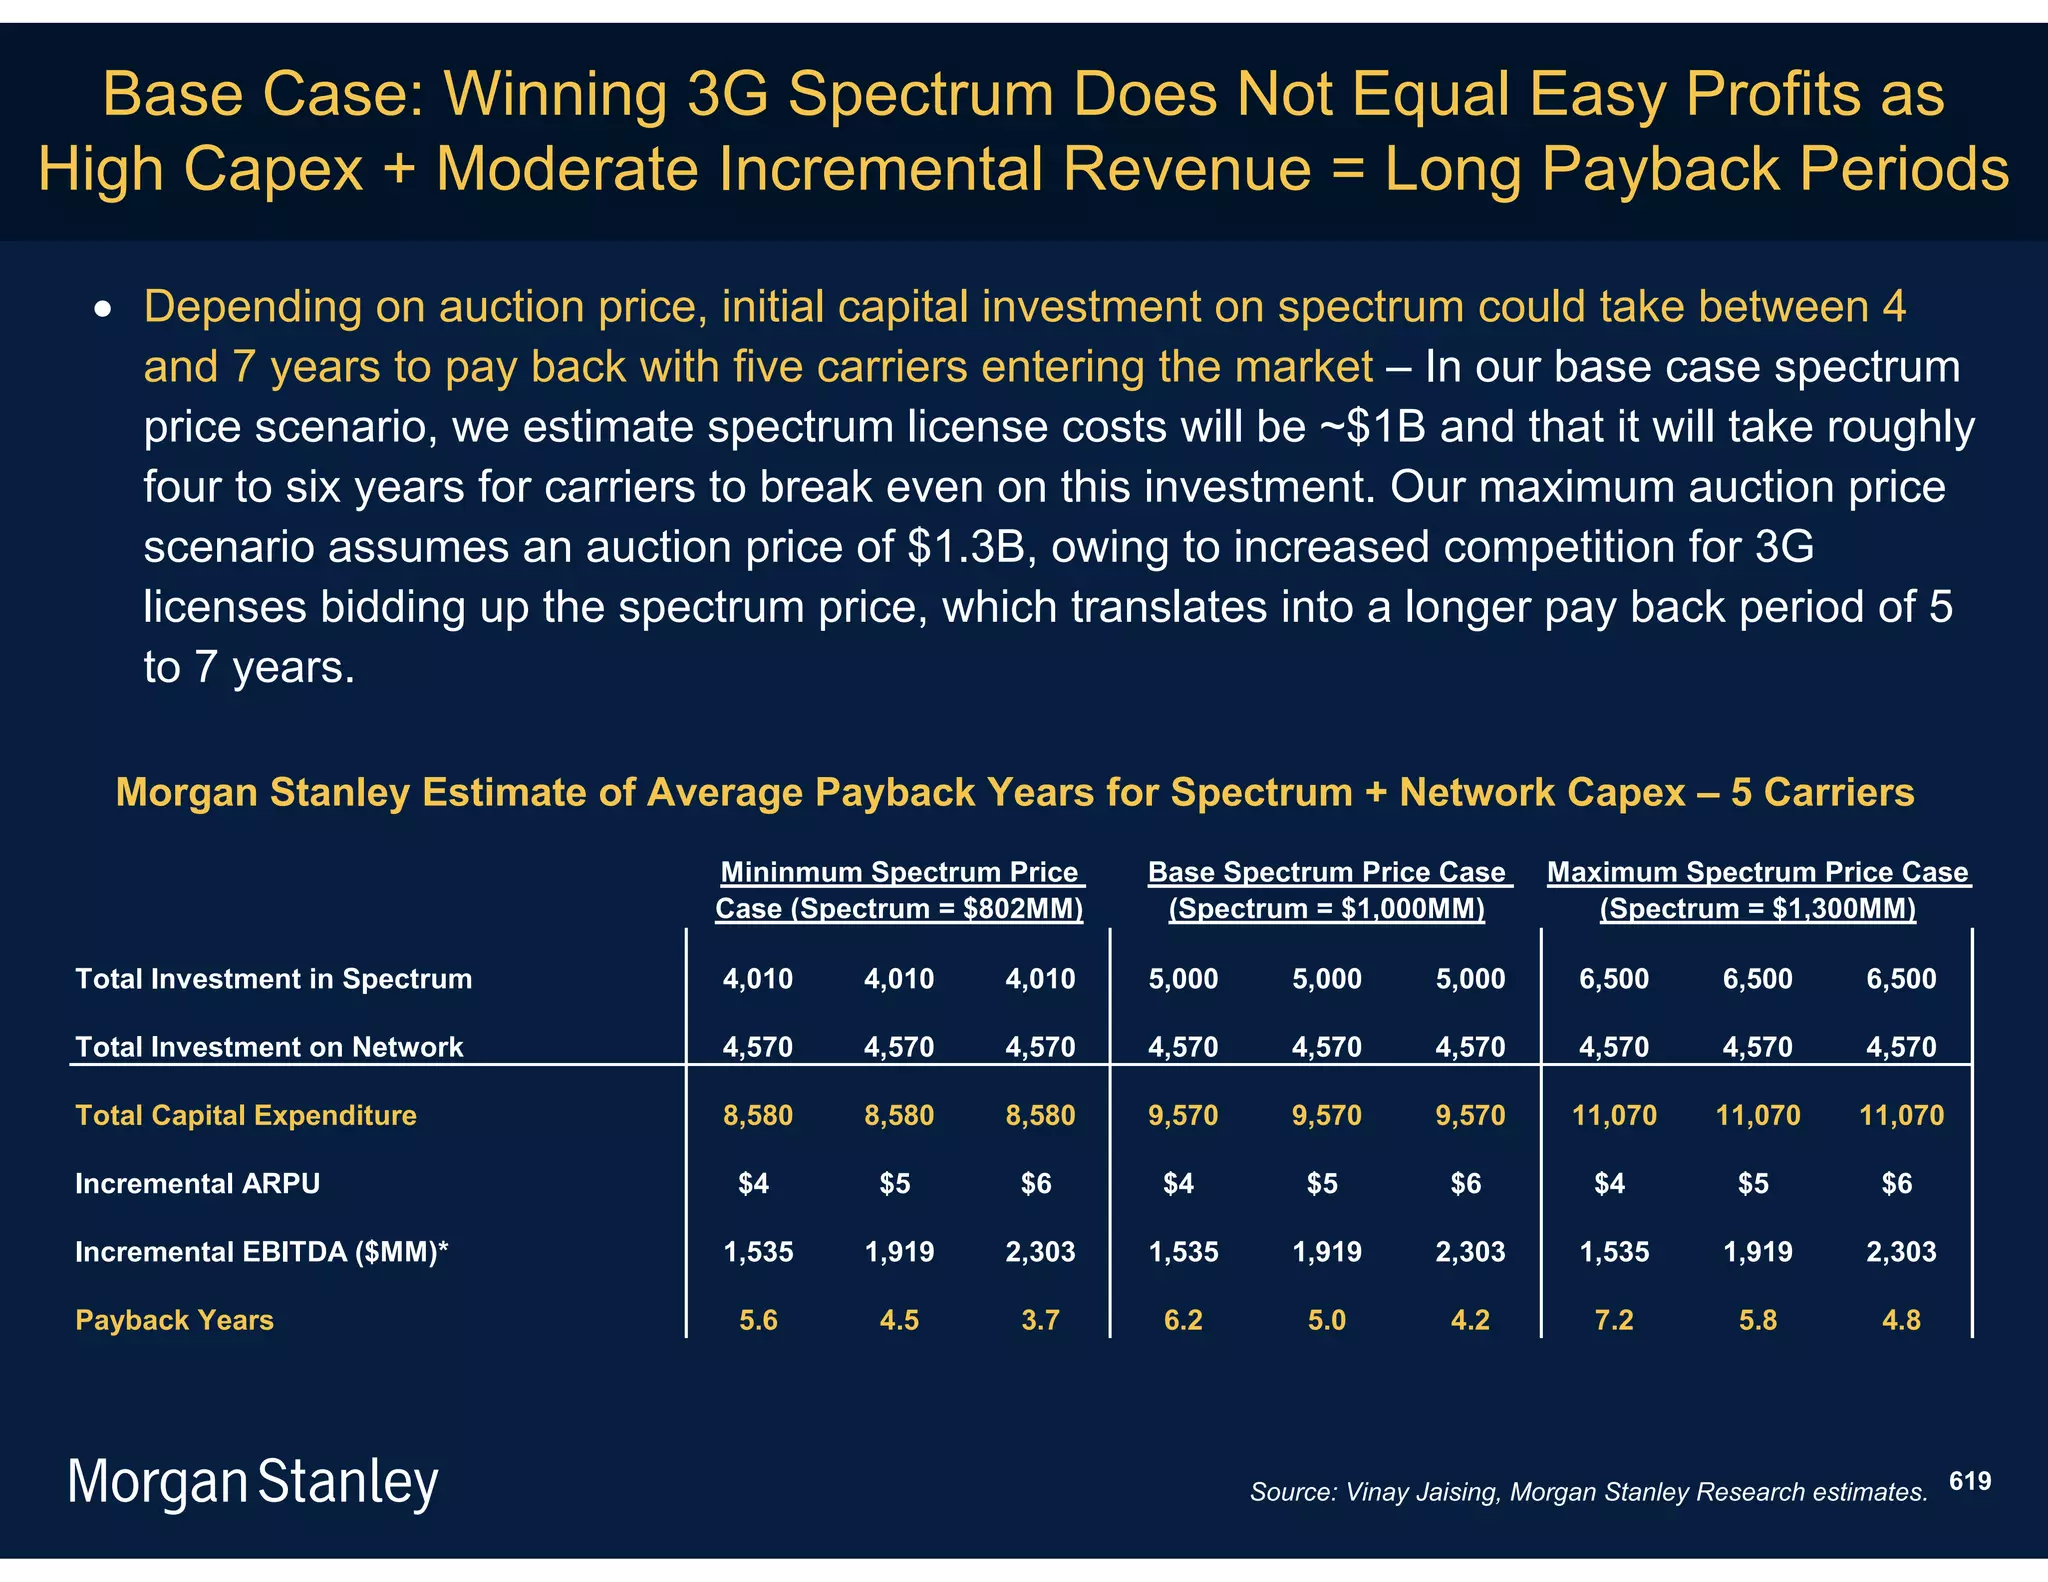
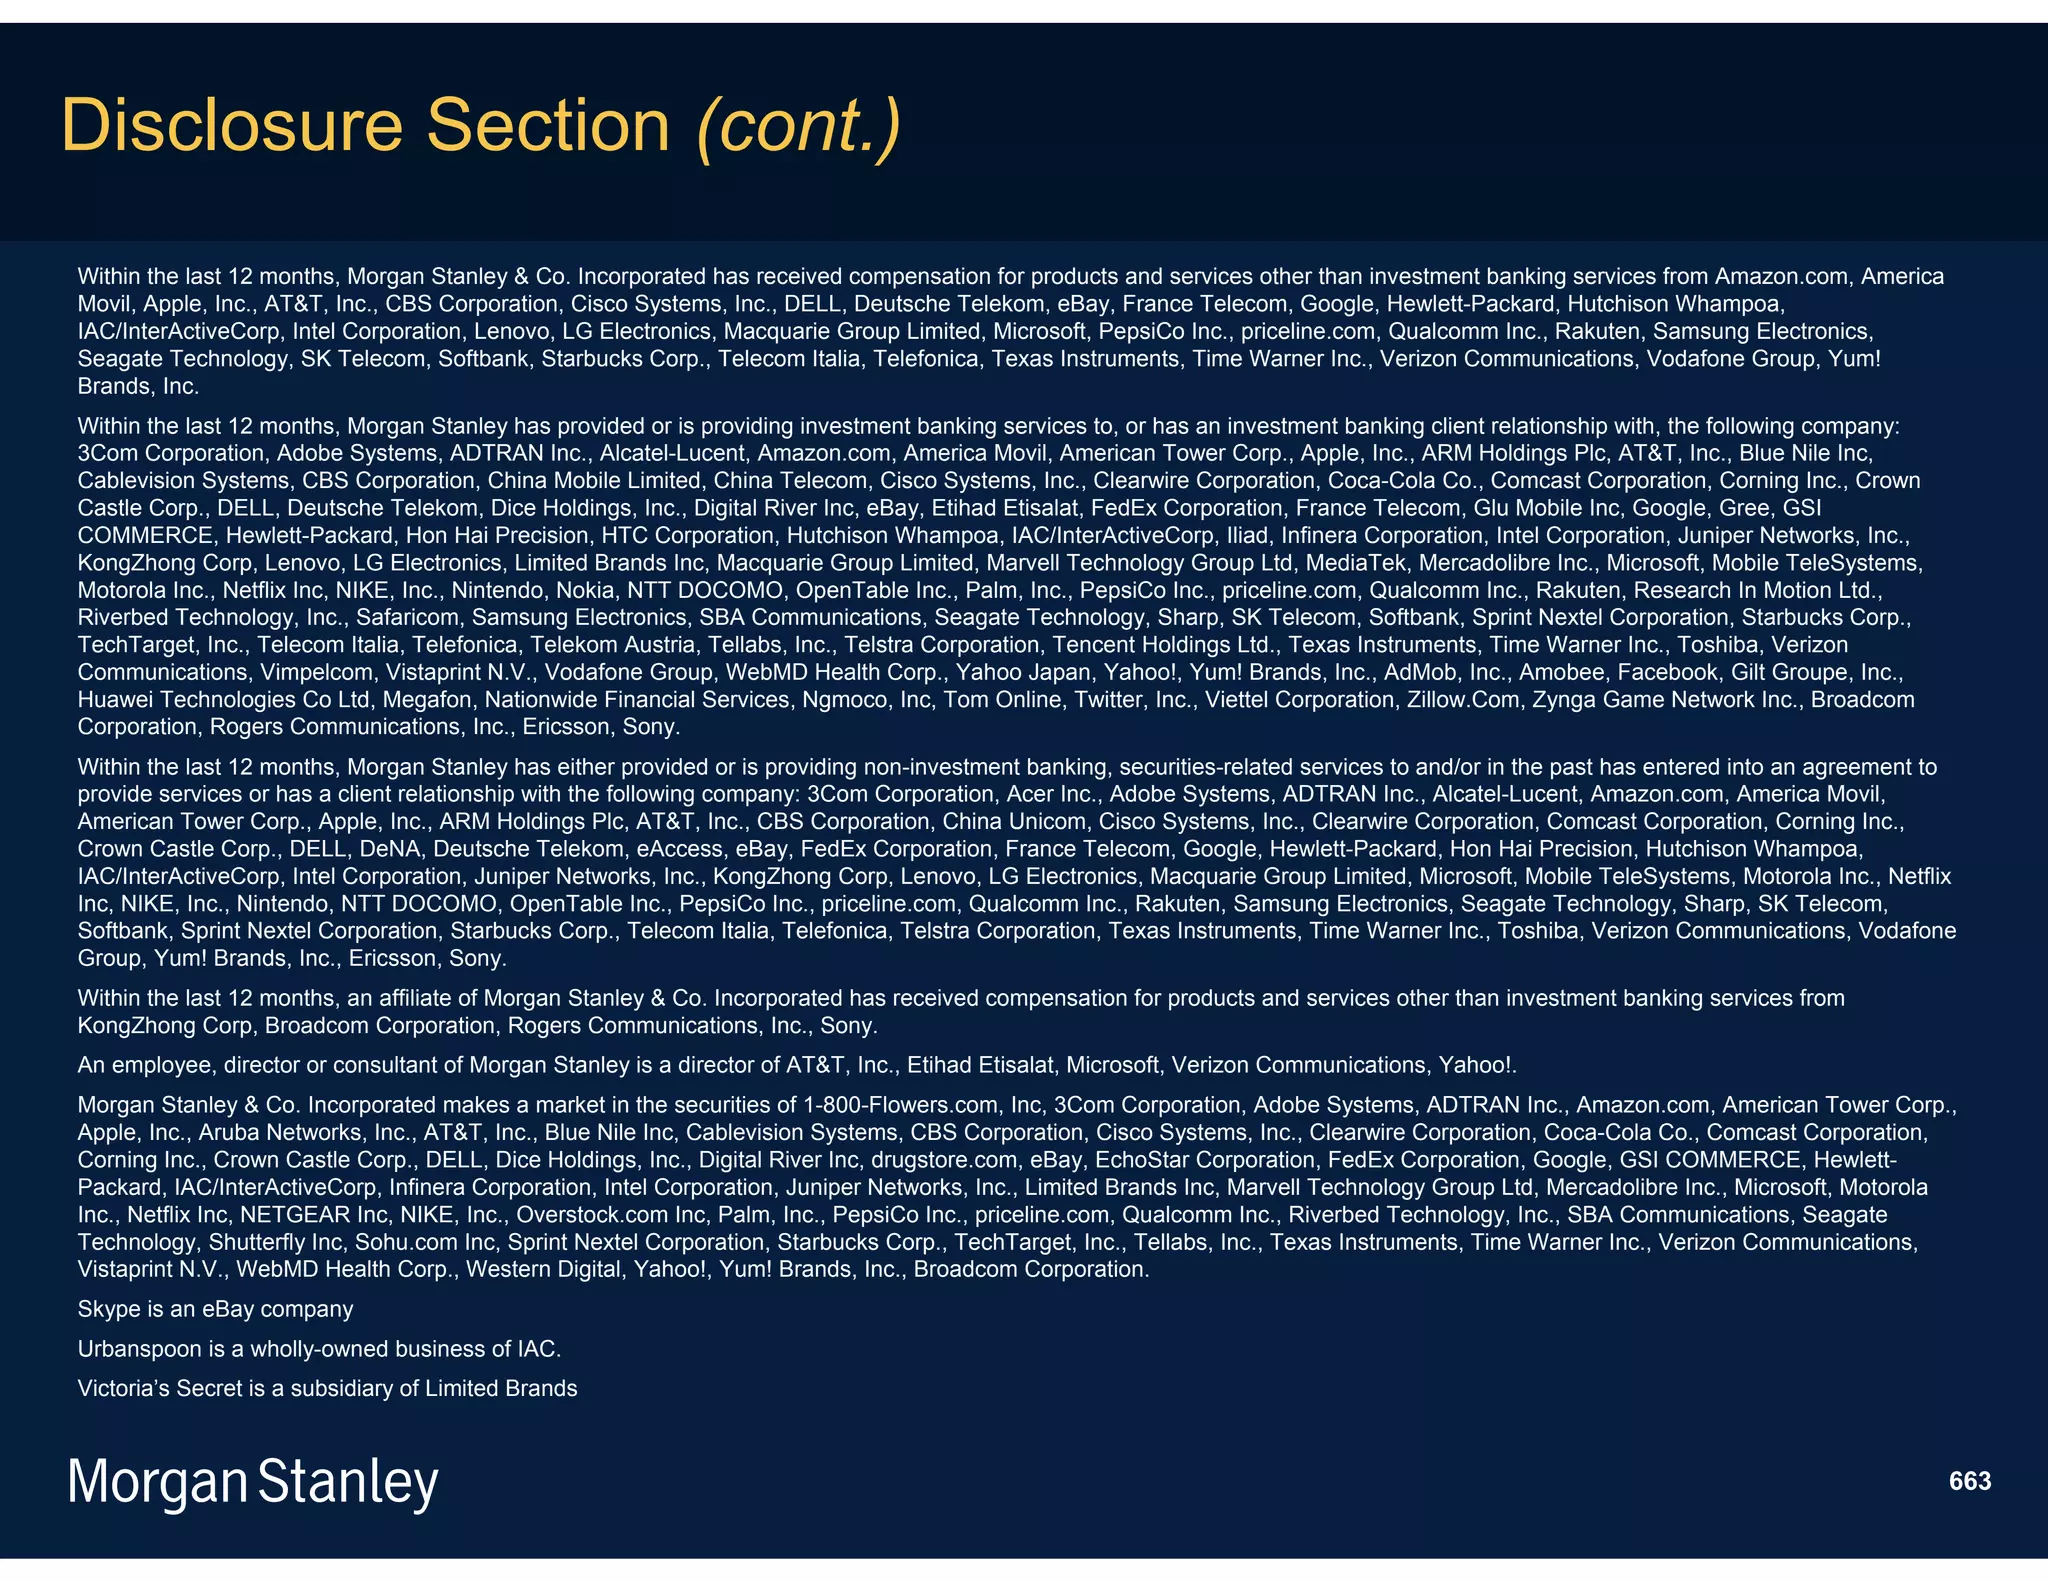
F2009 F2012
Bull Case - Broaden Bull Case - Broaden Bull Case - Market
distribution: Stable to low-end: Half Leadership: No
Subsidy / Modest BOM Subsidy / Average Subsidy / Aggressive
Current Model Base Case Decline BOM Decline BOM Decline
iPhone price to consumer $200 $99 $99 $99 $99
Average subsidy 400 387 400 200 -
Assumed annual BOM decrease 1% -10% -15% -33%
iPhone costs 240 248 206 152 75
iPhone gross Margin 60% 49% 59% 49% 24%
iPhone gross Profit 7,463 14,885 43,985 33,026 11,524
iPhone device revenue $12,439 $30,664 $74,850 $67,275 $47,916
iPhone shipments 21 63 150 225 484
iPhone installed base 32 116 255 360 726
Global handset share 2% 4% 10% 15% 33%
Other iPhone revenue $976 $3,570 $7,457 $9,892 $38,265
Other revenue per iPhone $30 $31 $29 $27 $53
Total iPhone revenue $13,415 $34,234 $82,307 $77,167 $86,181
Gross profit margin 61% 51% 60% 53% 44%
Operating margin 46% 39% 52% 45% 36%
Total iPhone EPS $4.90 $10.04 $32.04 $25.63 $22.90
iPhone business valuation (12x F2012 EPS) $98 $120 $385 $308 $275
iPhone revenue % of total apple 31% 45% 67% 65% 68%
iPhone business valuation as % of
current Apple share price ($195) 50% 62% 198% 158% 141%
Note: (1) based on valuation of $120-385 per share and 899.8 shares. Valuation is per share, based on 2009 P/E of 20x
173
and 2012 P/E of 12x. Apple shares closed at $194.67 on 12/11/09. Source: Apple, Katy Huberty, Morgan Stanley Research.](https://image.slidesharecdn.com/mobileinternetreportkeythemesfinal-100425034727-phpapp02/75/Mobile-internet-report_key_themes_final-173-2048.jpg)


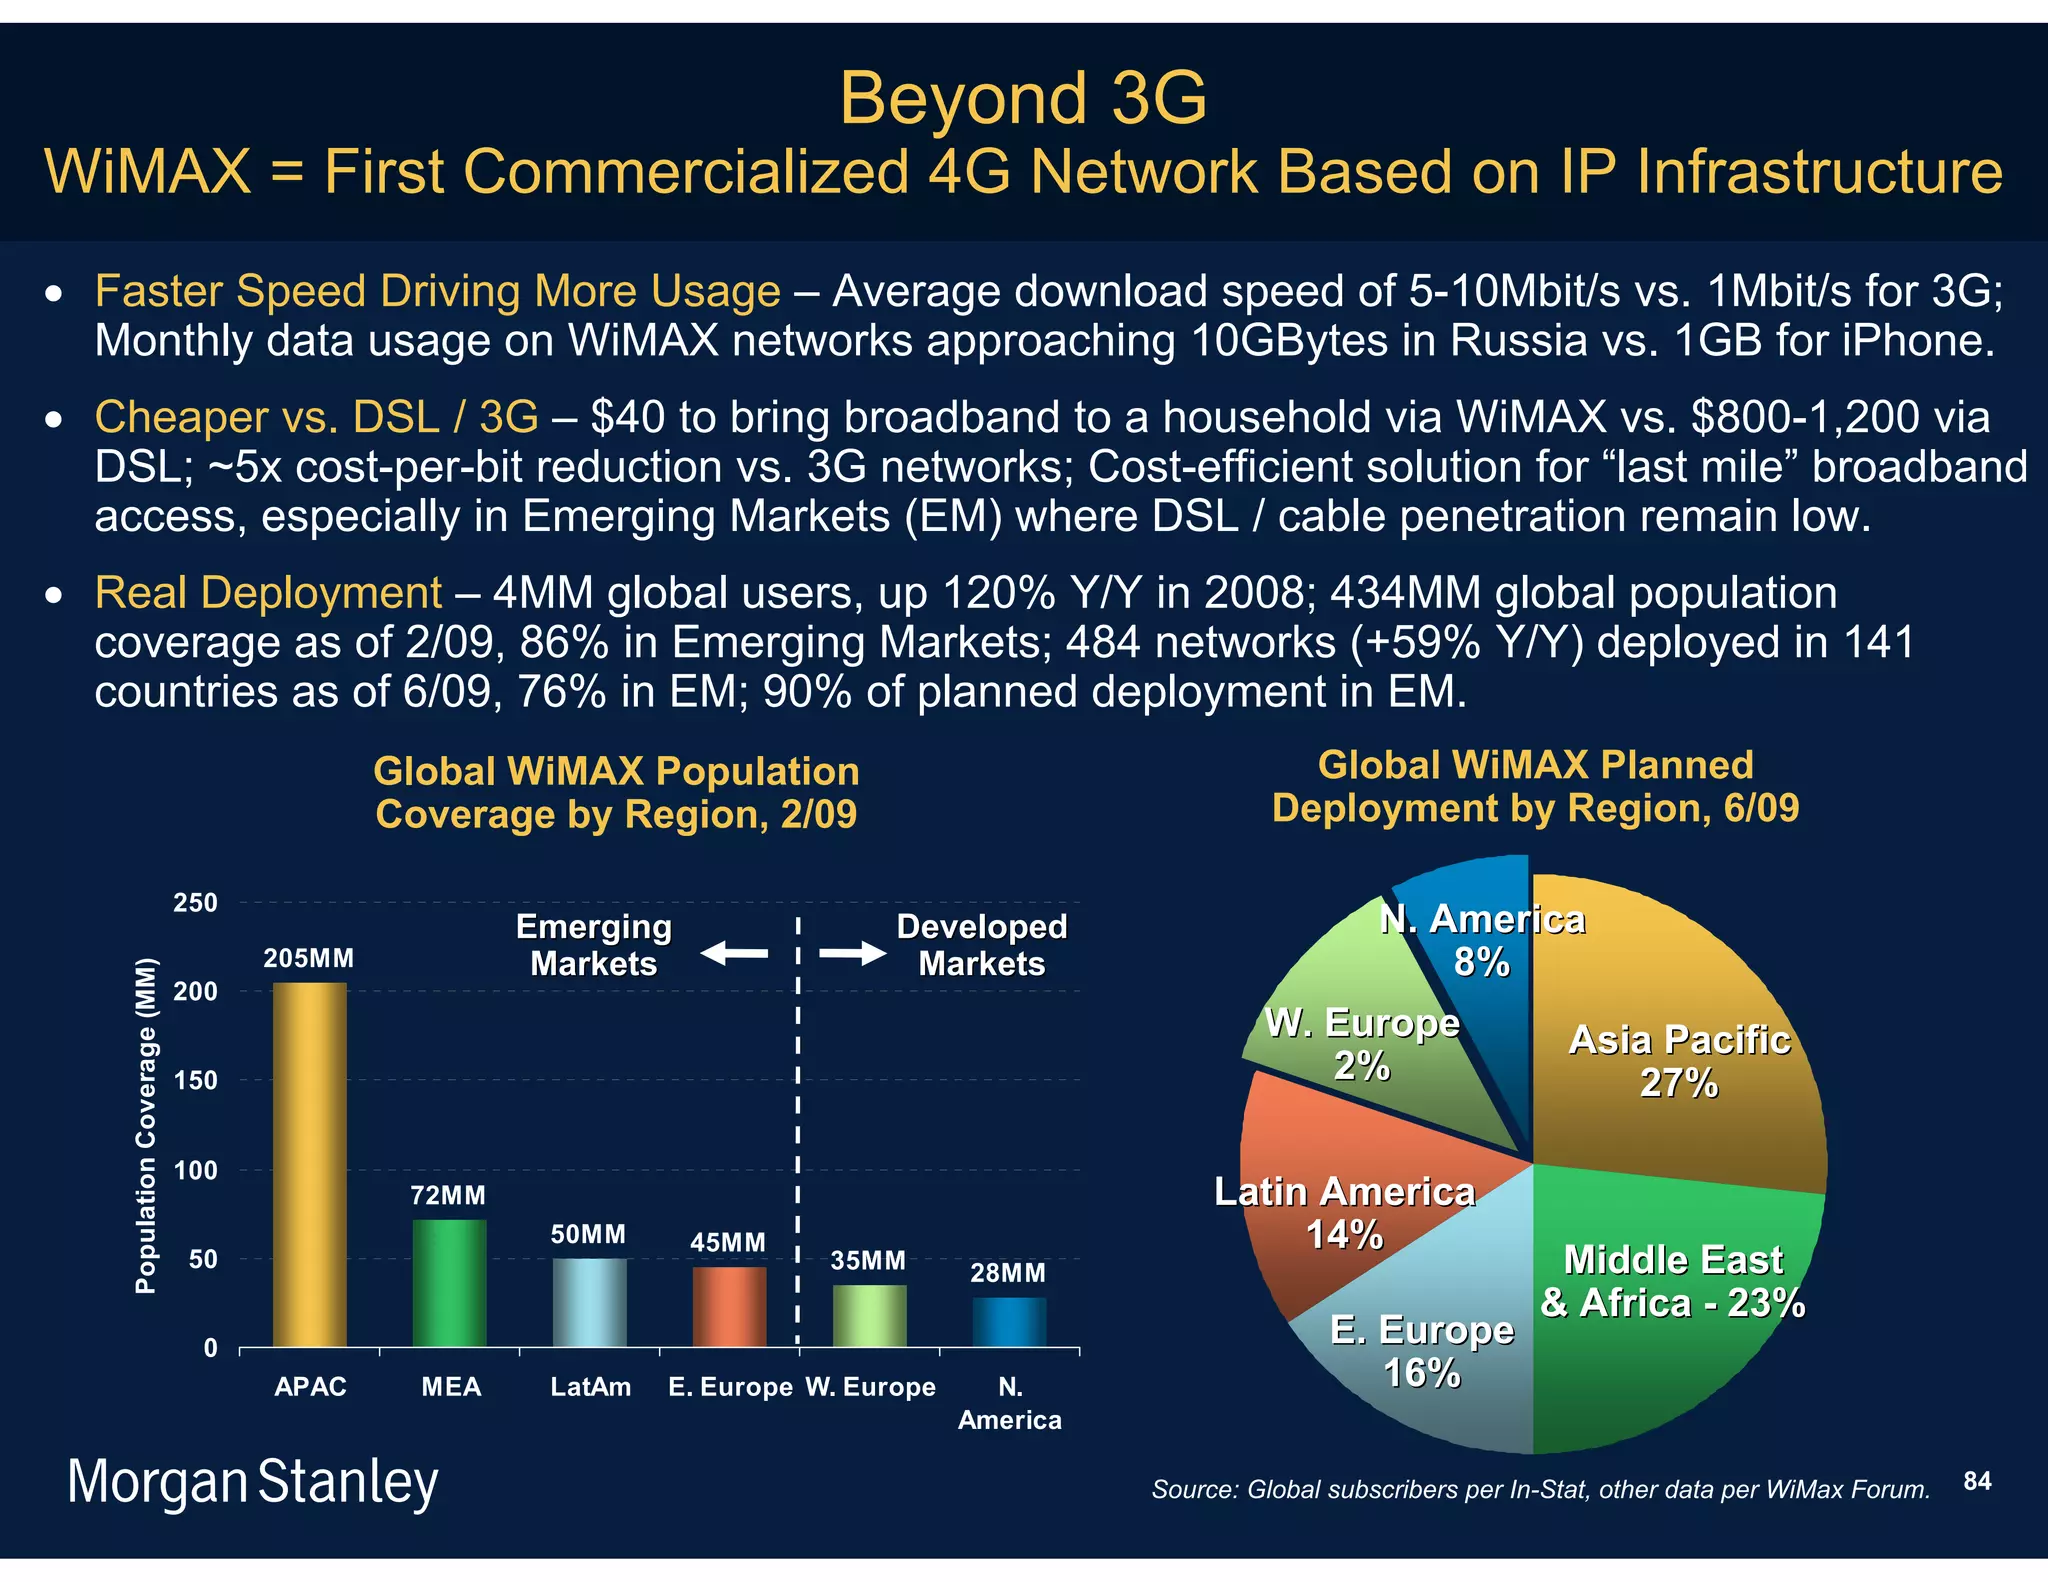
![Mobile Internet Likely to Follow Timing & Development
Patterns of Desktop Internet Market
Timing & Development of Internet Market Segment – From Our 1996 Internet Retailing Report
nt]
s / C ns /
onte
s]
io
tform
Ser pplicat
[Pla
vice
[A
Mobile Internet
2005 … … … 2011E Timeline (ex. Japan)
328
Note: Original chart (black text) from Morgan Stanley’s Internet Retailing Report, published in 1996. Red text augmented in 11/09.
Source: Morgan Stanley Research.](https://image.slidesharecdn.com/mobileinternetreportkeythemesfinal-100425034727-phpapp02/75/Mobile-internet-report_key_themes_final-328-2048.jpg)


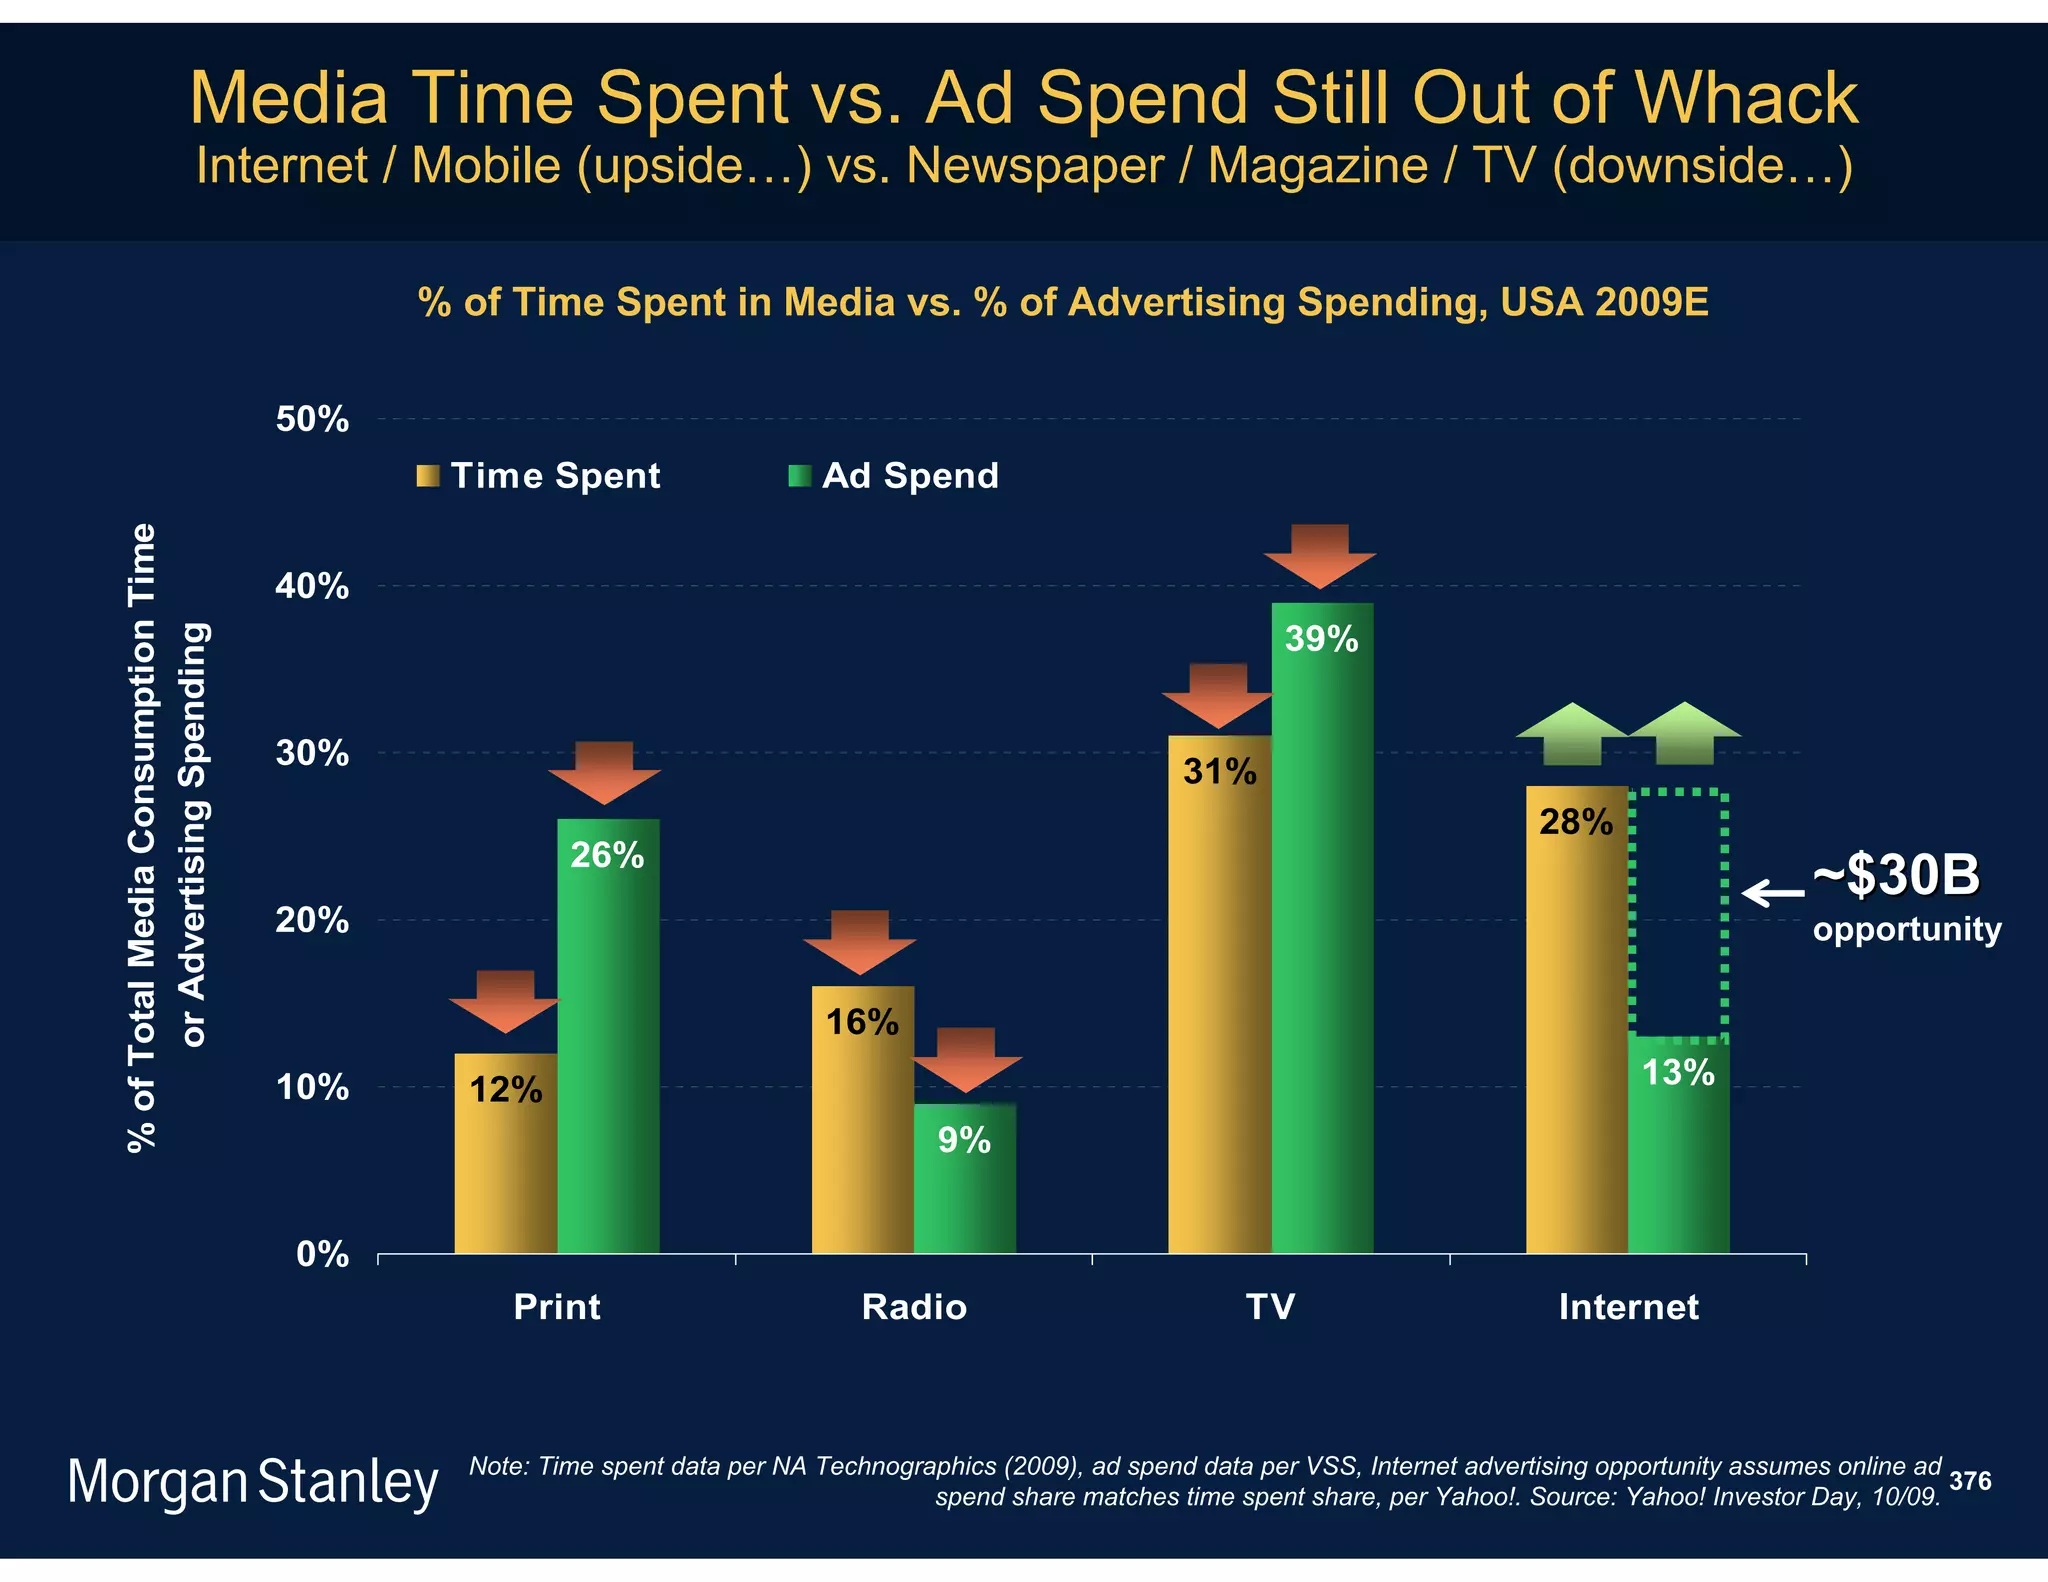
![Media Time Spent vs. Ad Spend Out of Whack
Companies are spending up to 12% to 13% on digital
[advertising]. We know we spend up to 20% of our time
online, so in theory spending should be up at 20%. It's just
natural conservatism, resistance to change and inability to
adapt to change. I believe when digital budgets get to 20%,
which will be in four or five years, we will be spending 30%
of our time online.
- Sir Martin Sorrell, CEO of WPP Group
Source: WSJ.com Interview with Sir Martin Sorrell, 9/22/09. 377](https://image.slidesharecdn.com/mobileinternetreportkeythemesfinal-100425034727-phpapp02/75/Mobile-internet-report_key_themes_final-377-2048.jpg)


![Competitive Share Gain Opportunities Keep Carriers in
Search of Next Hot Handset and Afraid of Network Outages
Global wireless carriers continue to compete to offer iPhone as they see it as a
way to gain share of high-value customers / reduce churn.
Apple is broadening its distribution to multiple carriers in the same country (UK /
Canada…).
In markets that will become competitive as multiple carriers offer iPhones,
carriers that have paying customers who hate their service will find that their
customers simply go to another vendor.
Competition to offer the best 3G+ services will intensify…
Getting iPhone was top of my to-do list.
-- Tom Alexander, CEO of Orange, 10/07
It’s clear that the iPhone has worked pretty well in the UK market and not
having it has penalized us [losing 159K customers].
-- Vittorio Colao, CEO of Vodafone, CQ1:09 Earnings Call
547
Source: The Telegraph, 10/02/09. Vodafone CQ1:09 Earnings Call.](https://image.slidesharecdn.com/mobileinternetreportkeythemesfinal-100425034727-phpapp02/75/Mobile-internet-report_key_themes_final-547-2048.jpg)

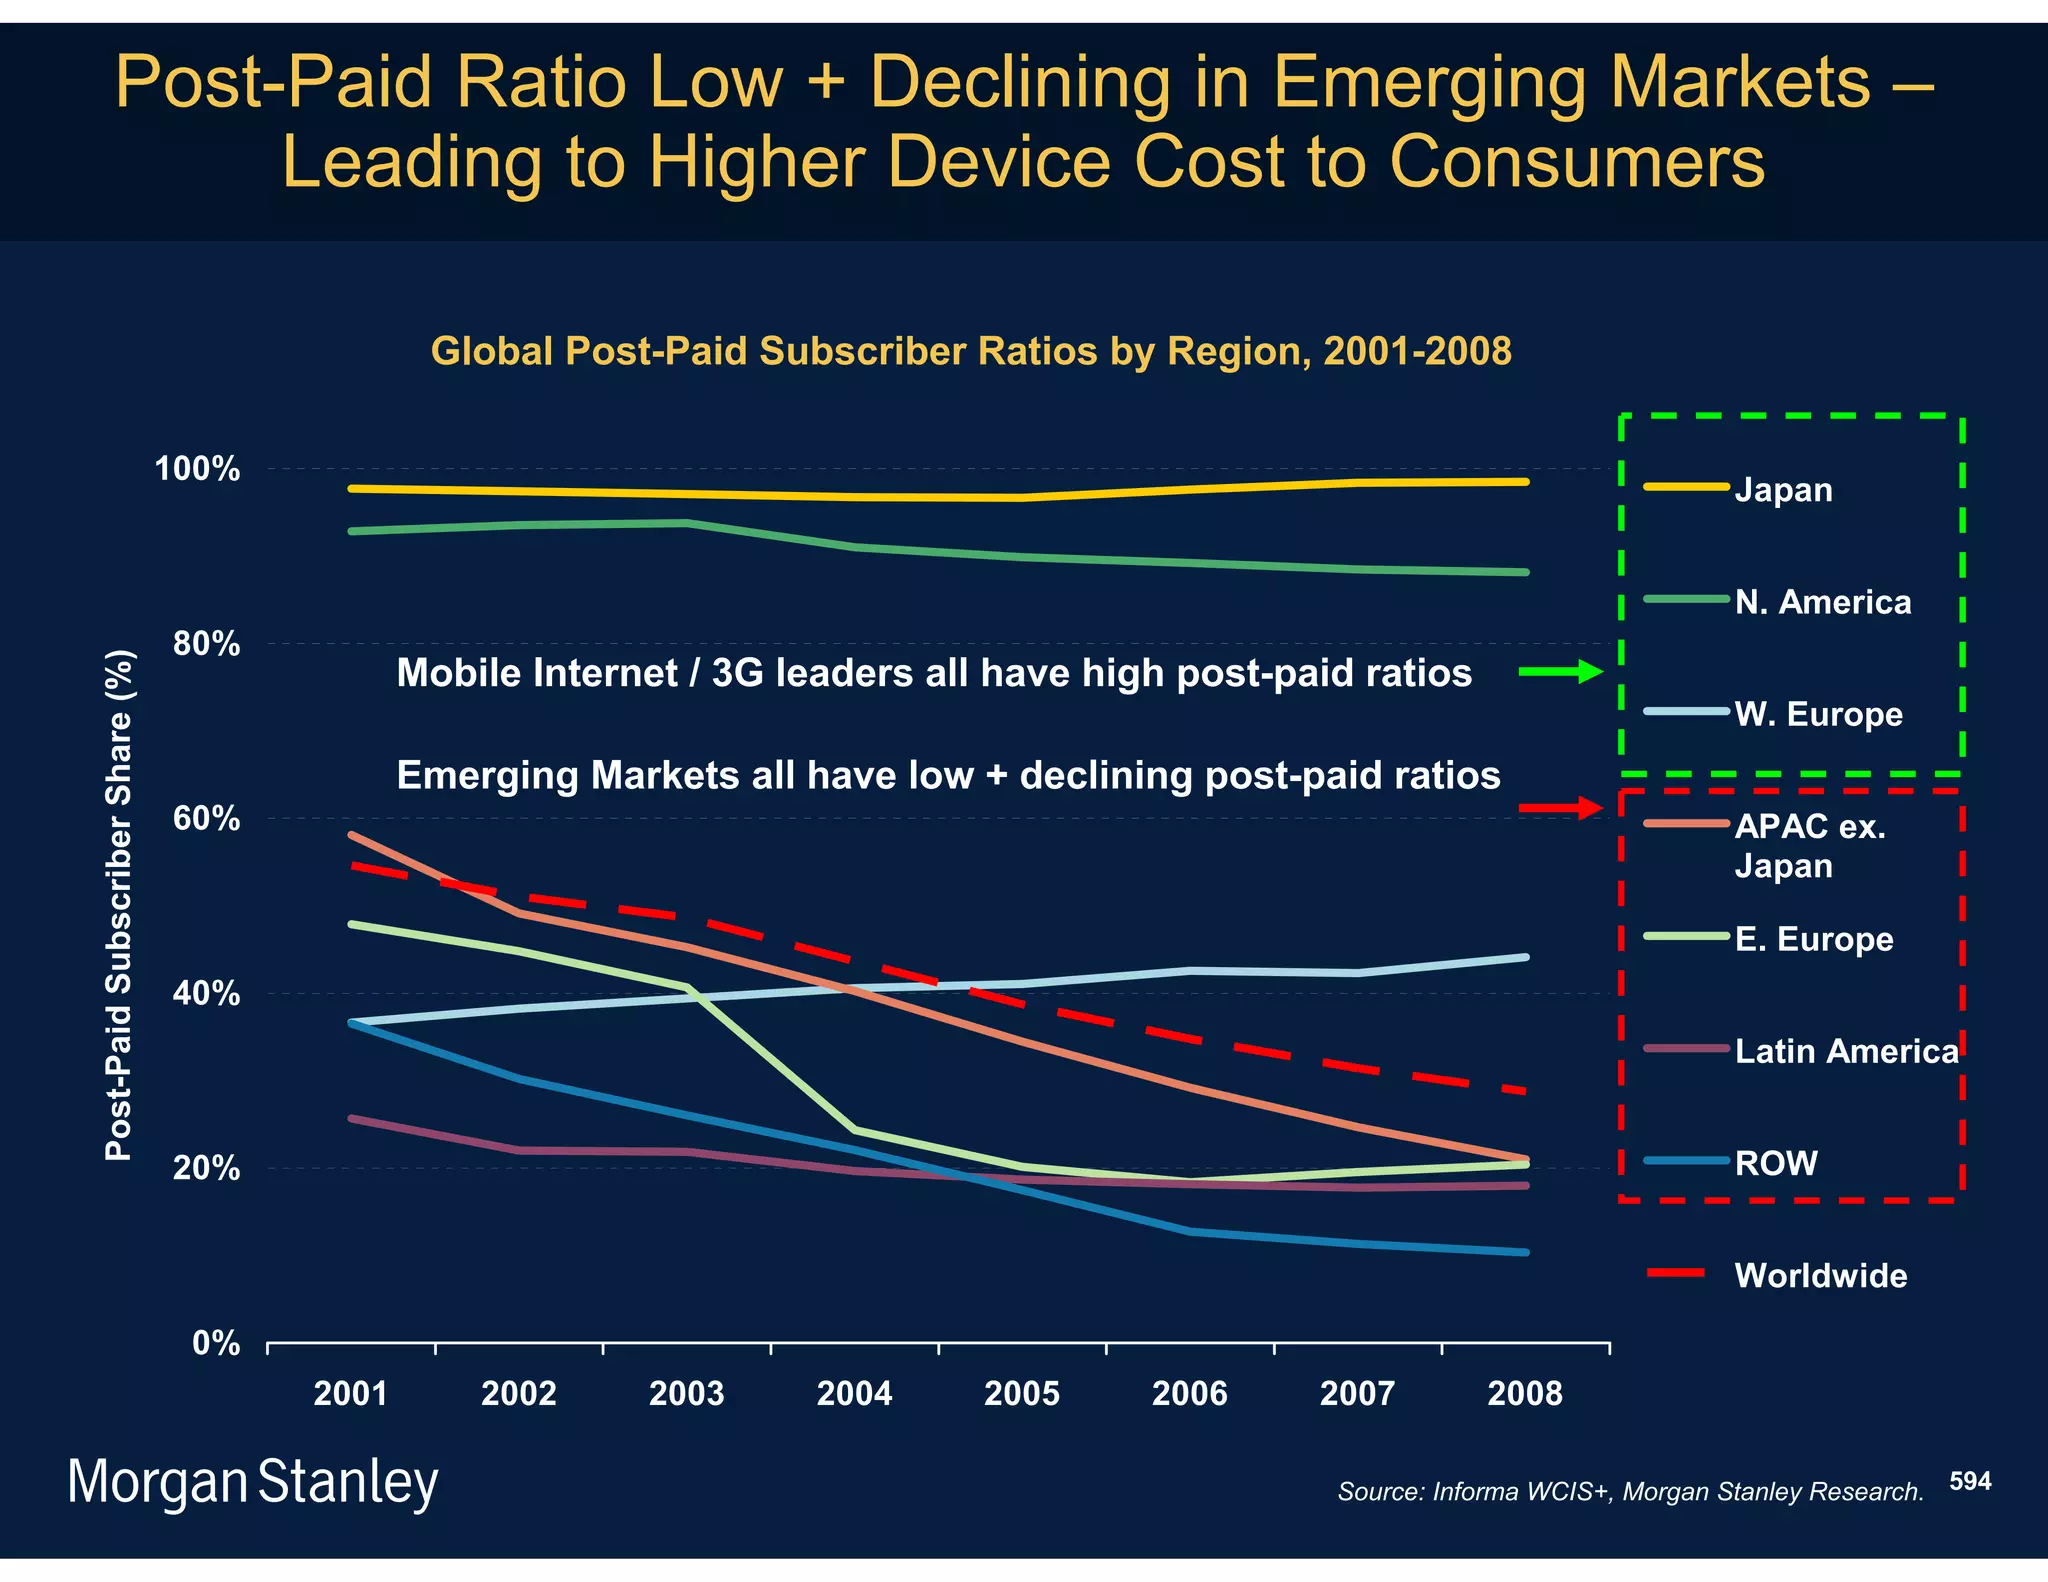
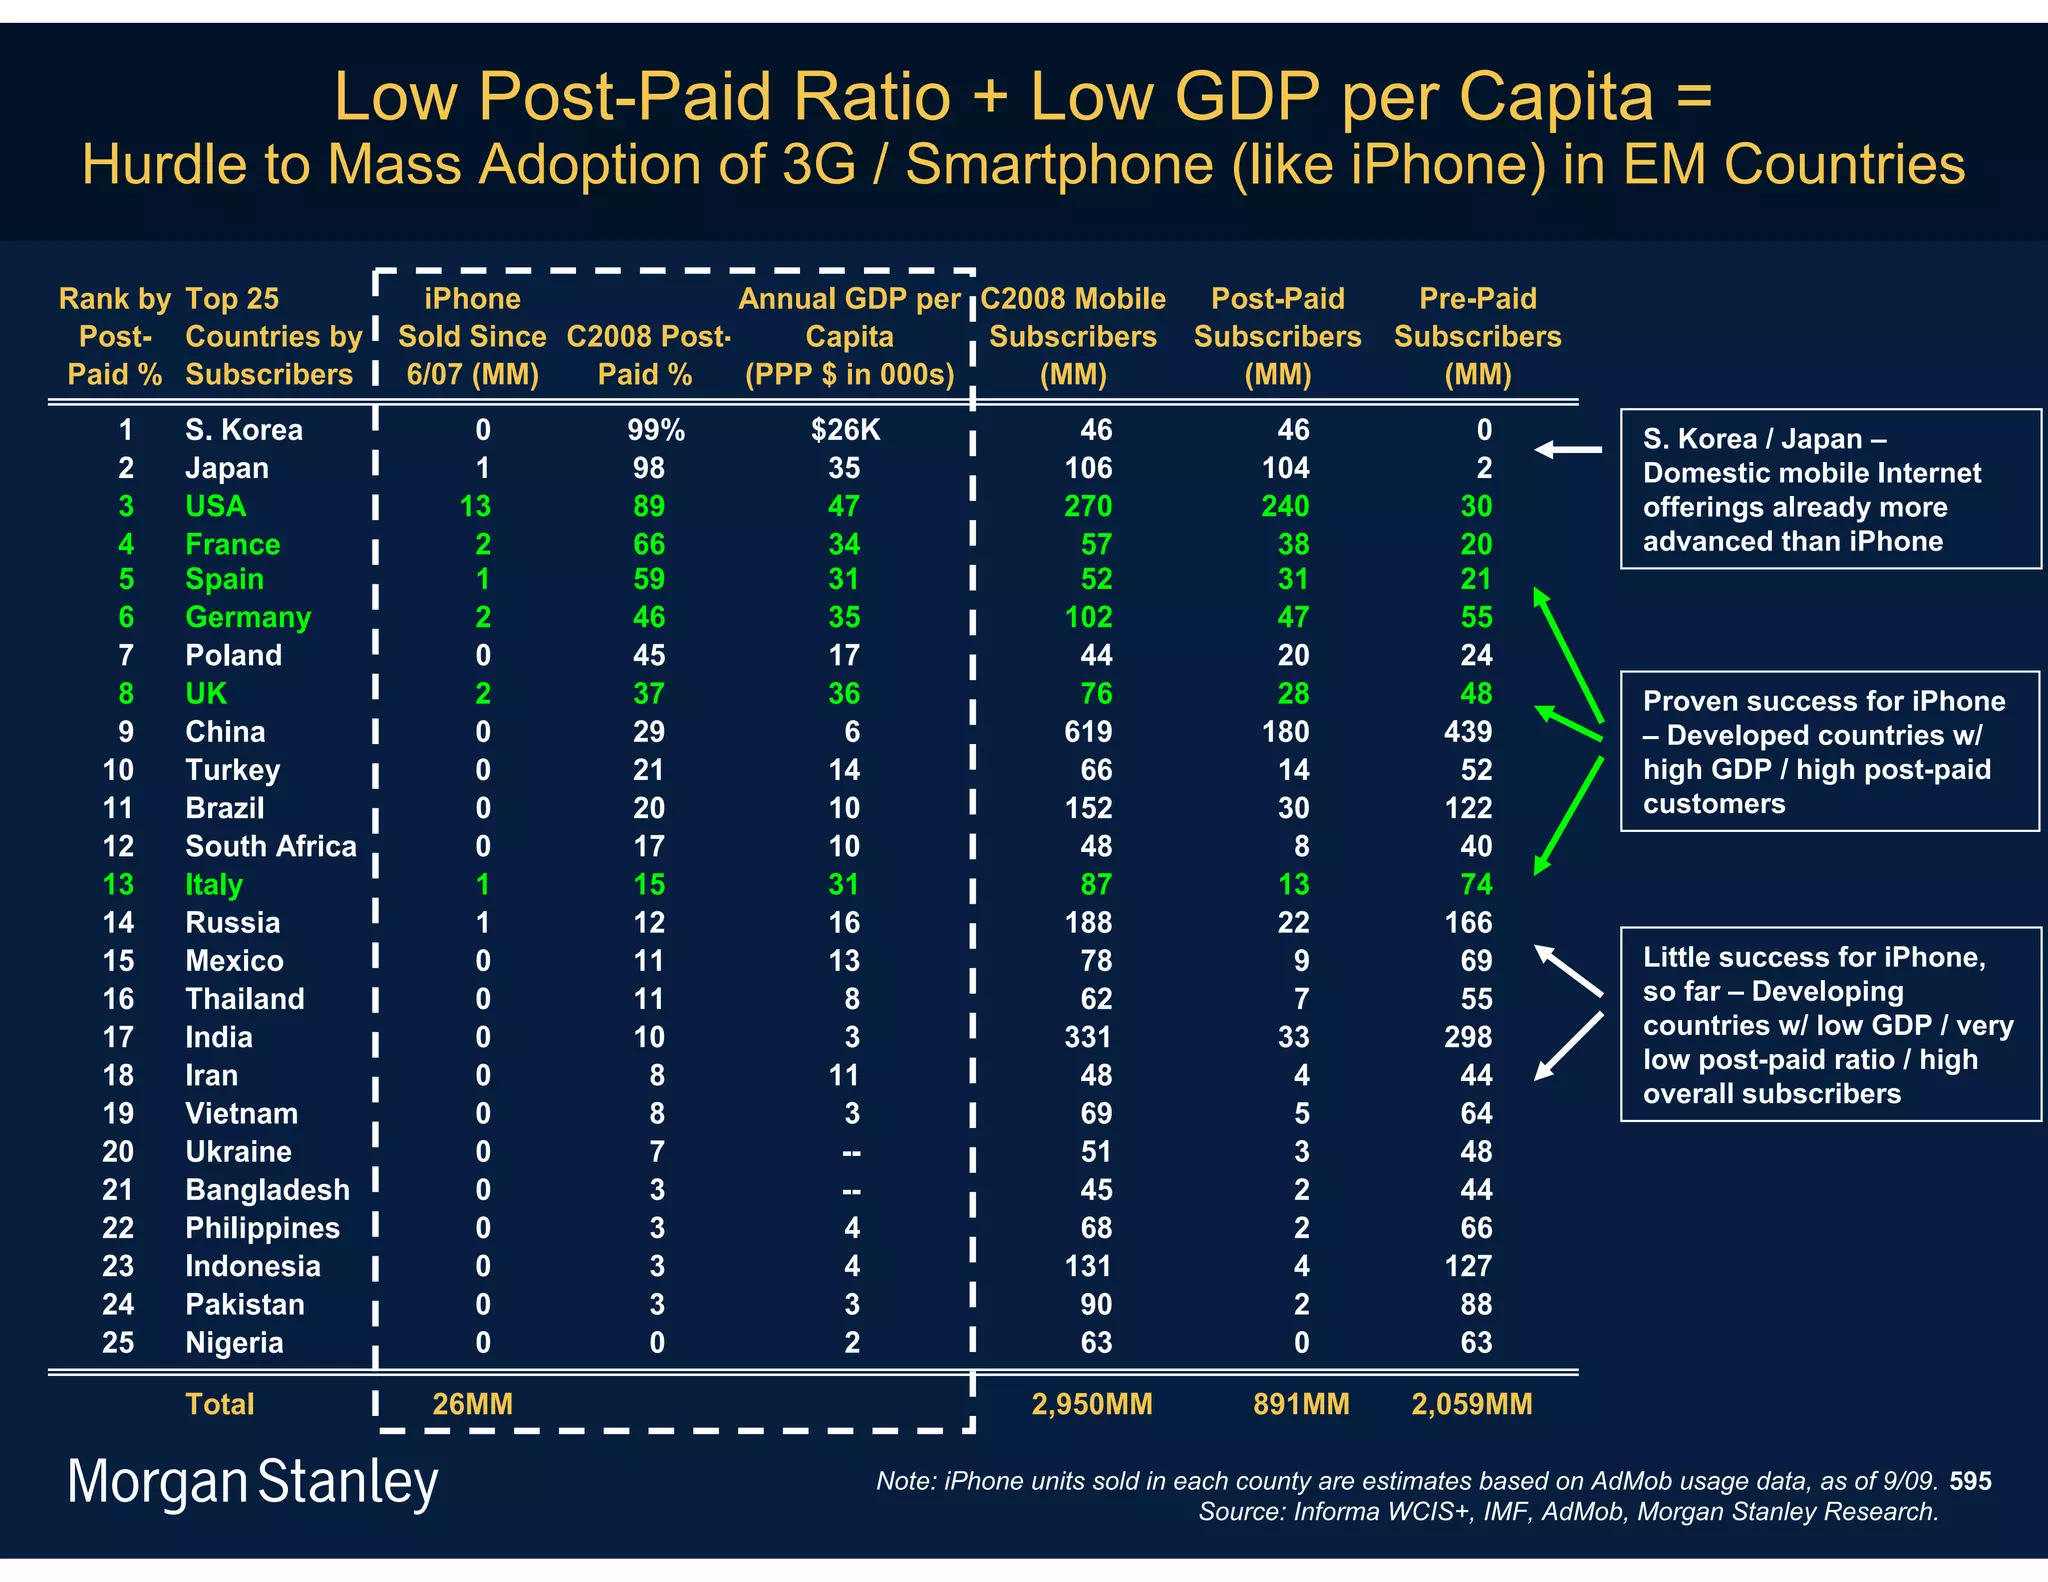
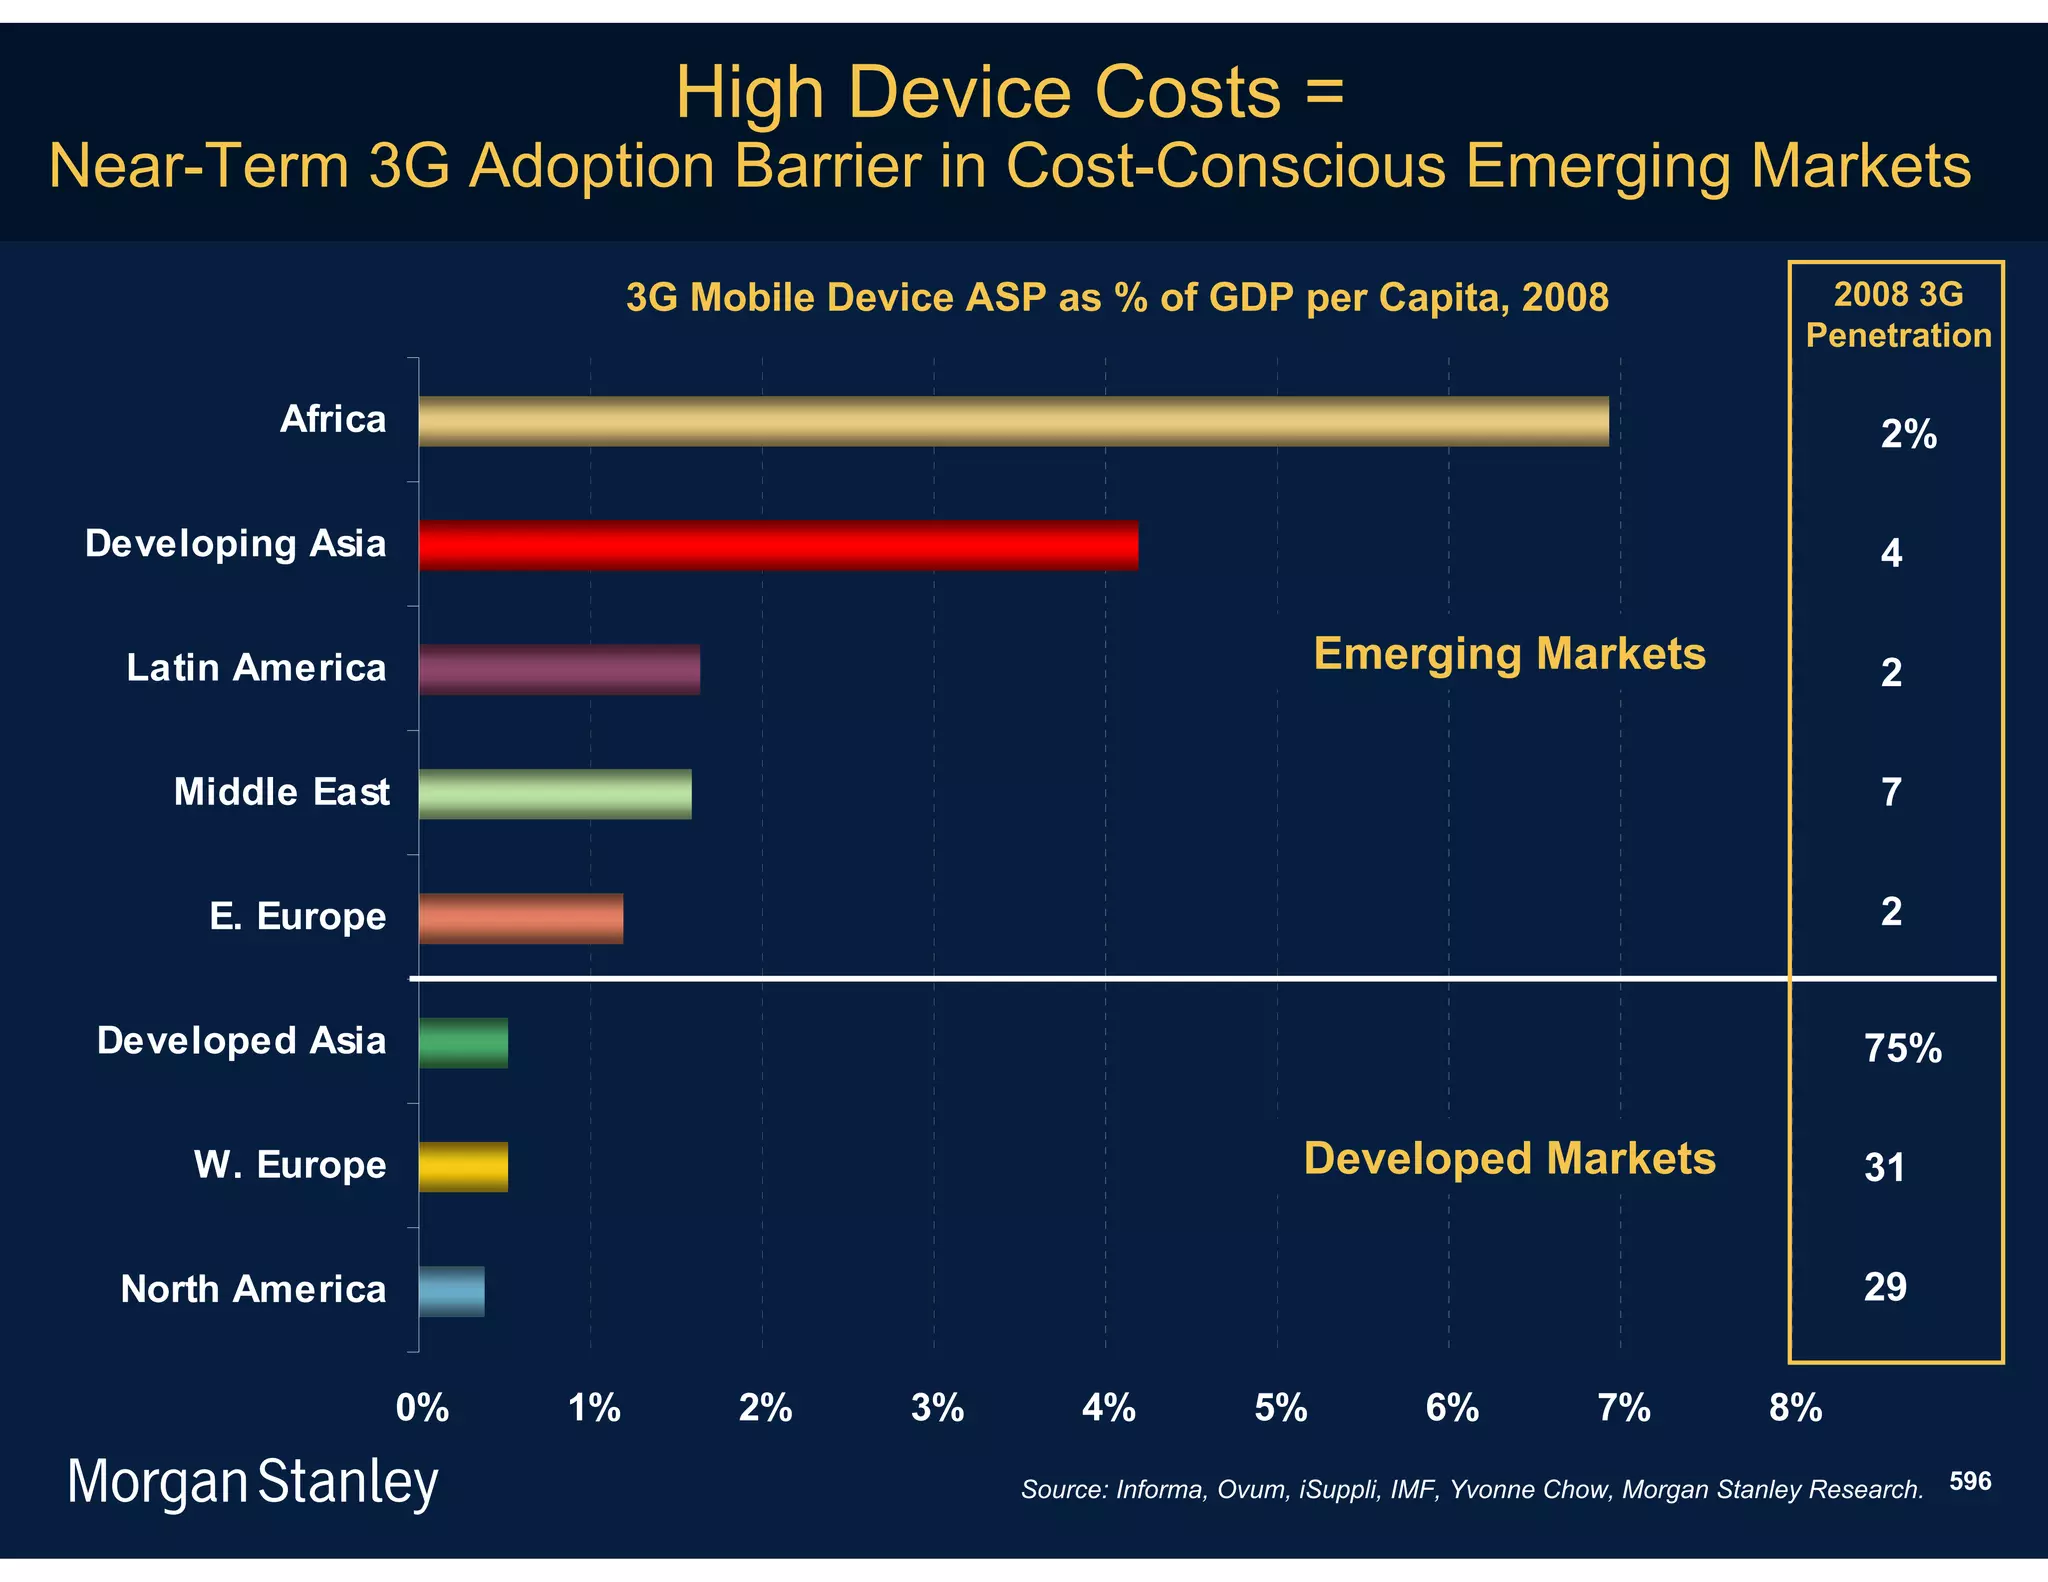
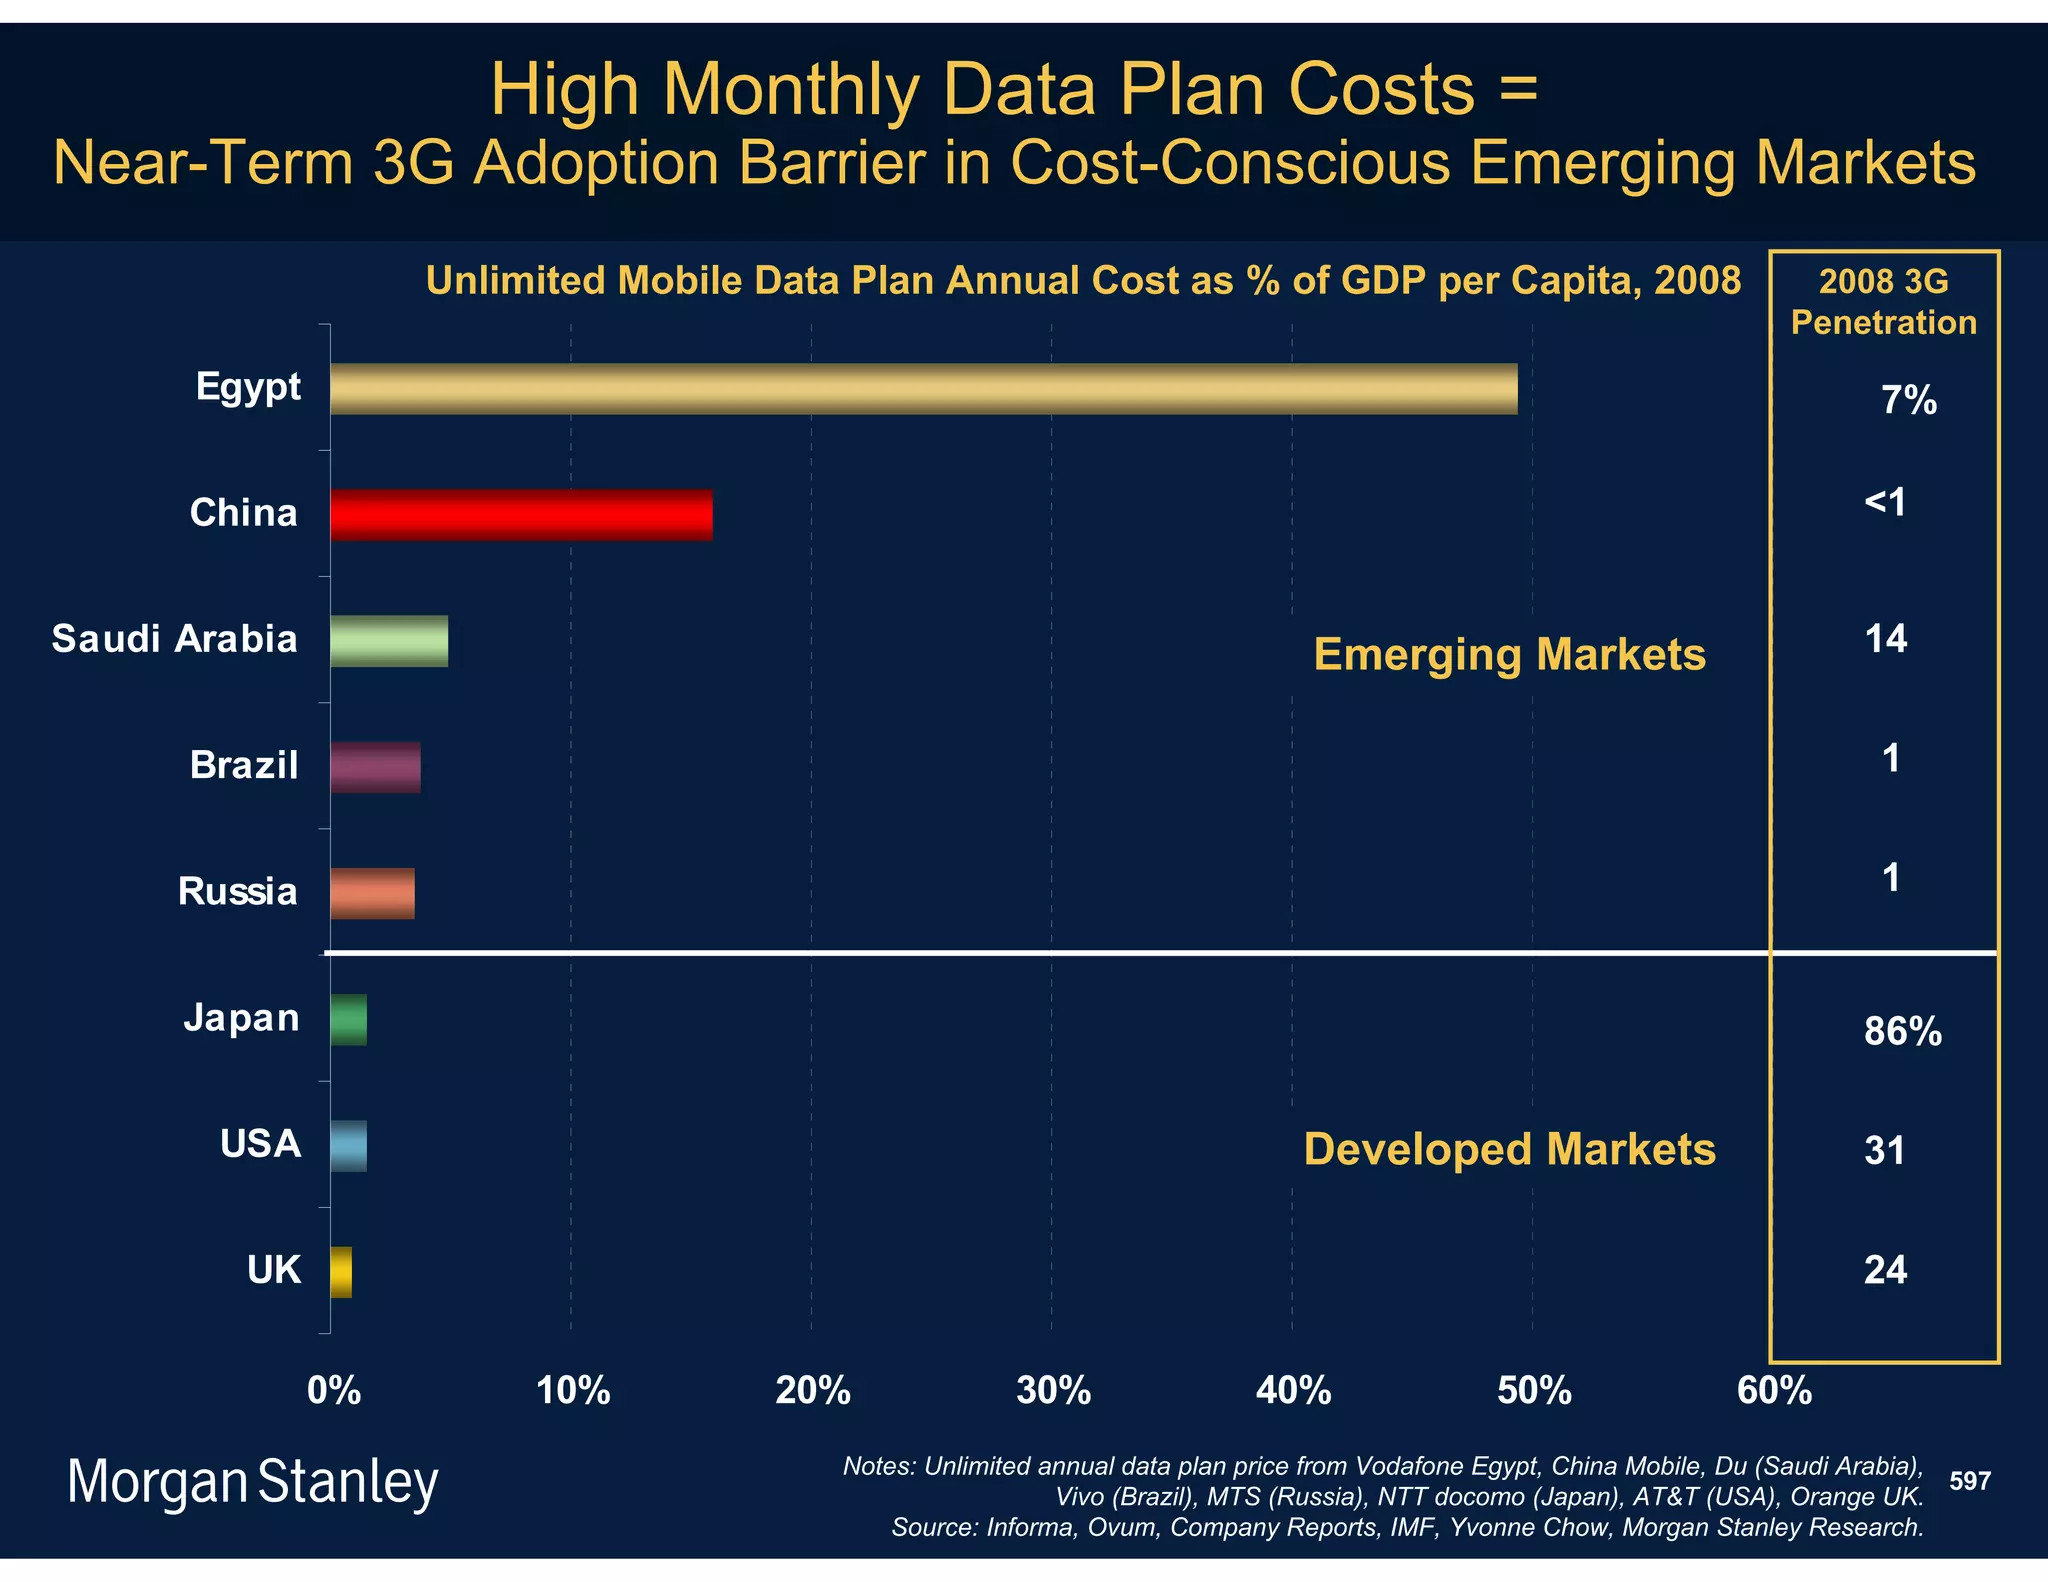


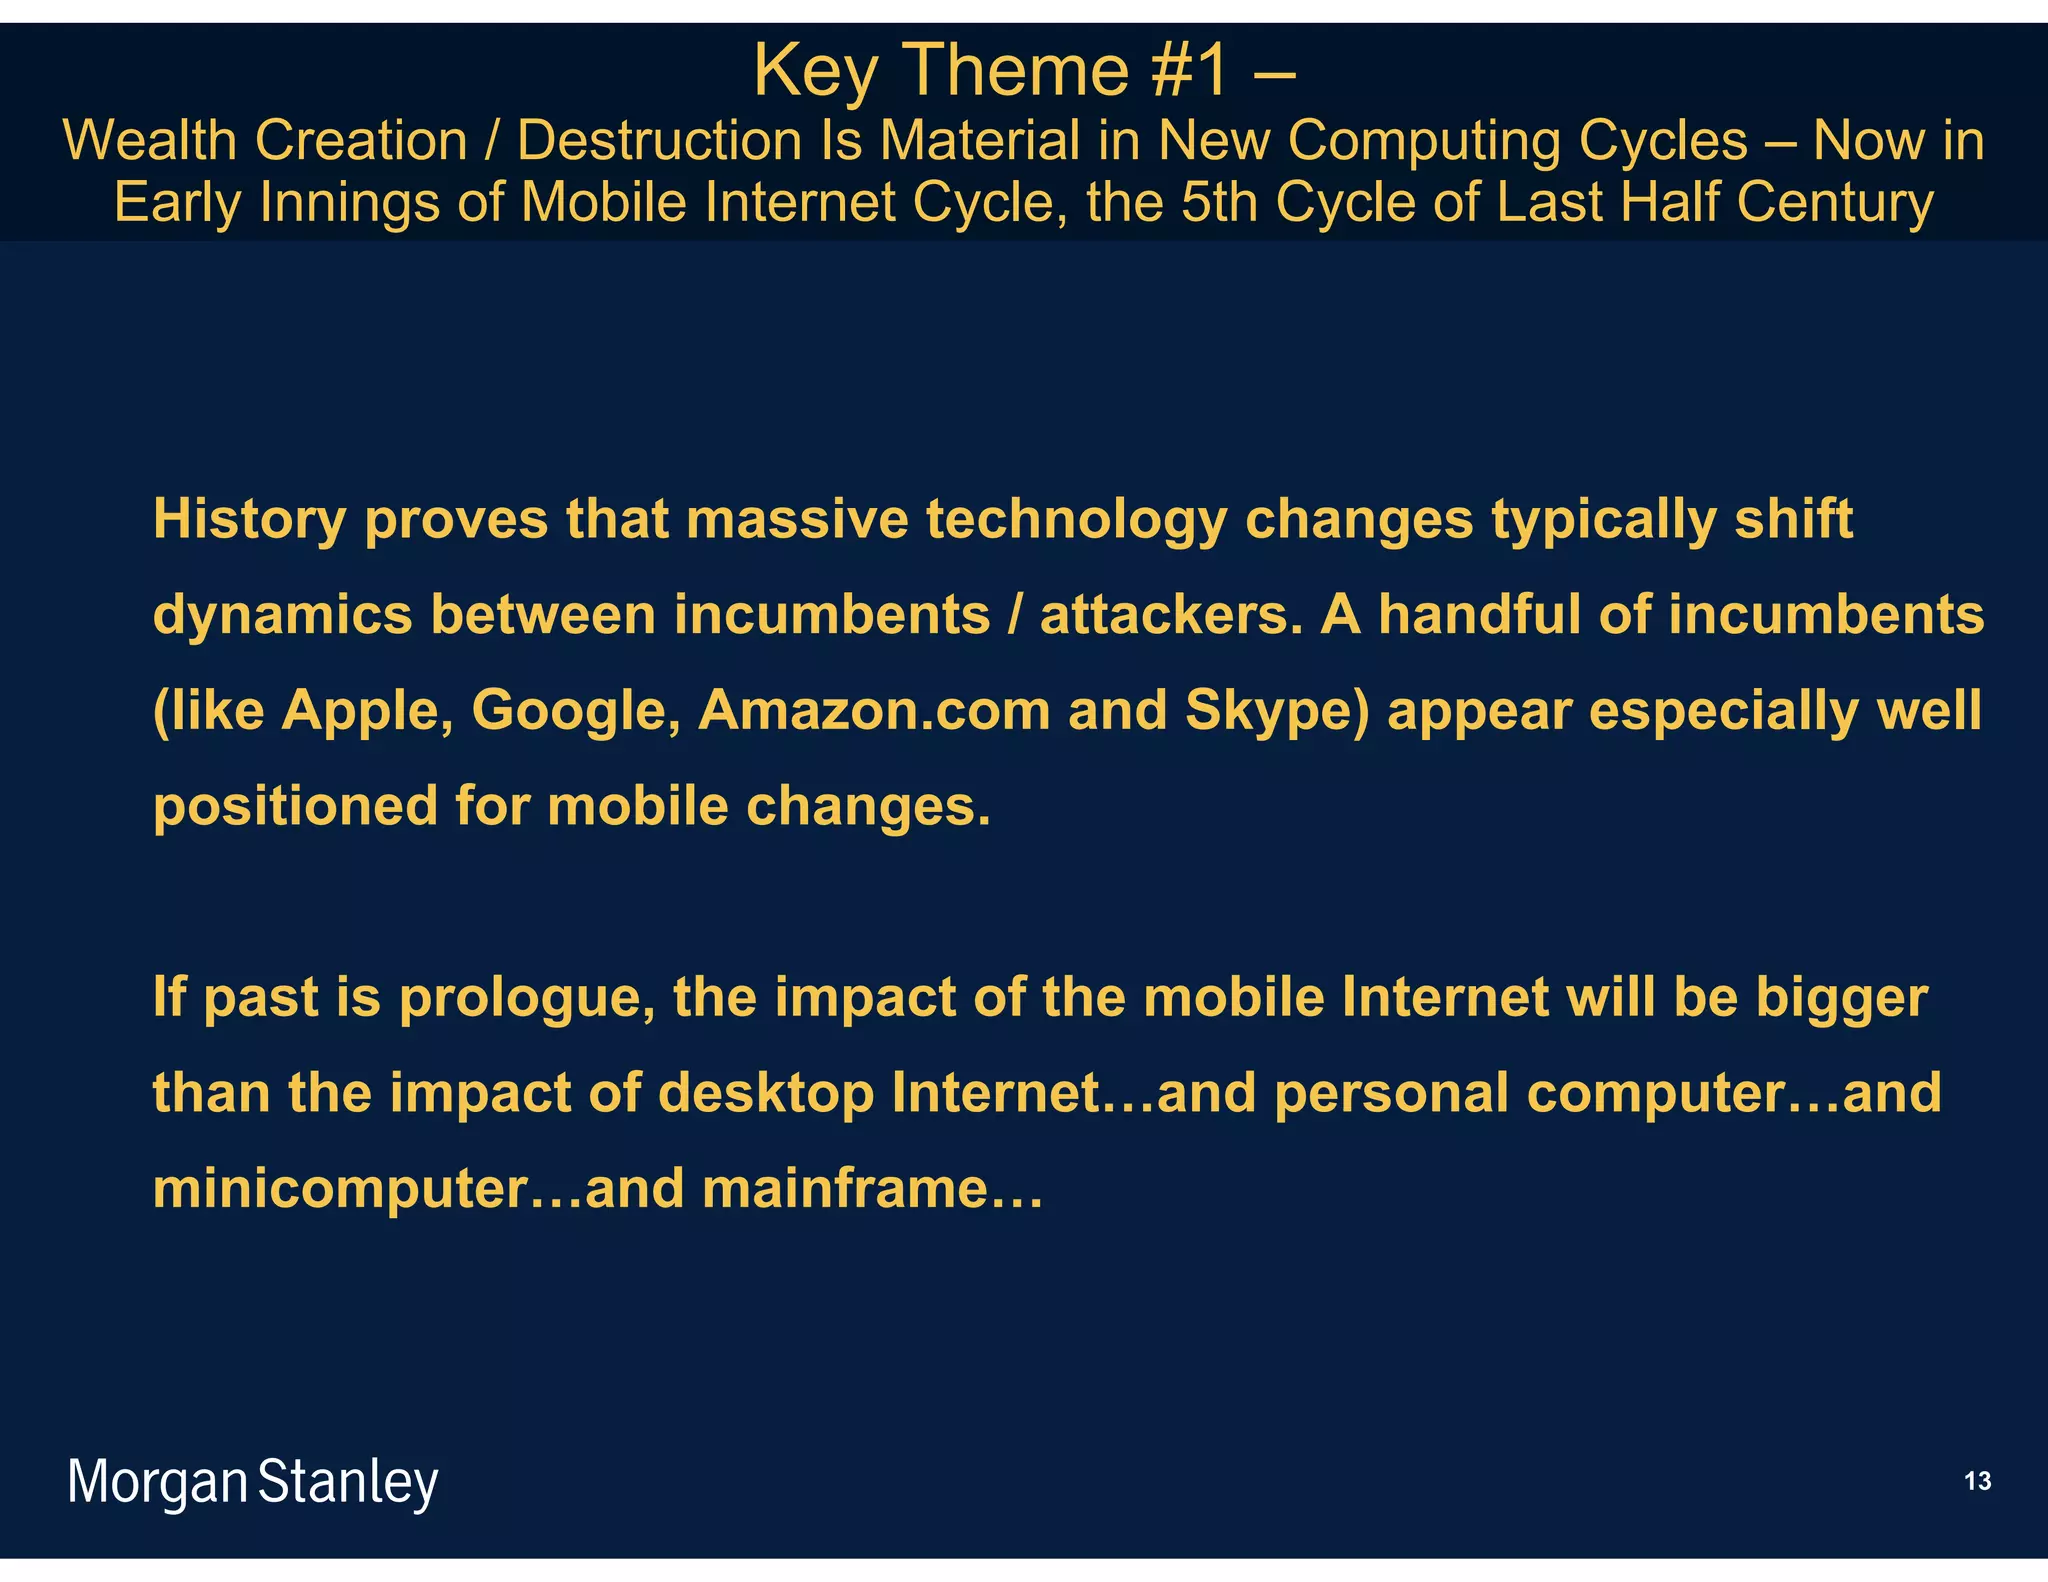
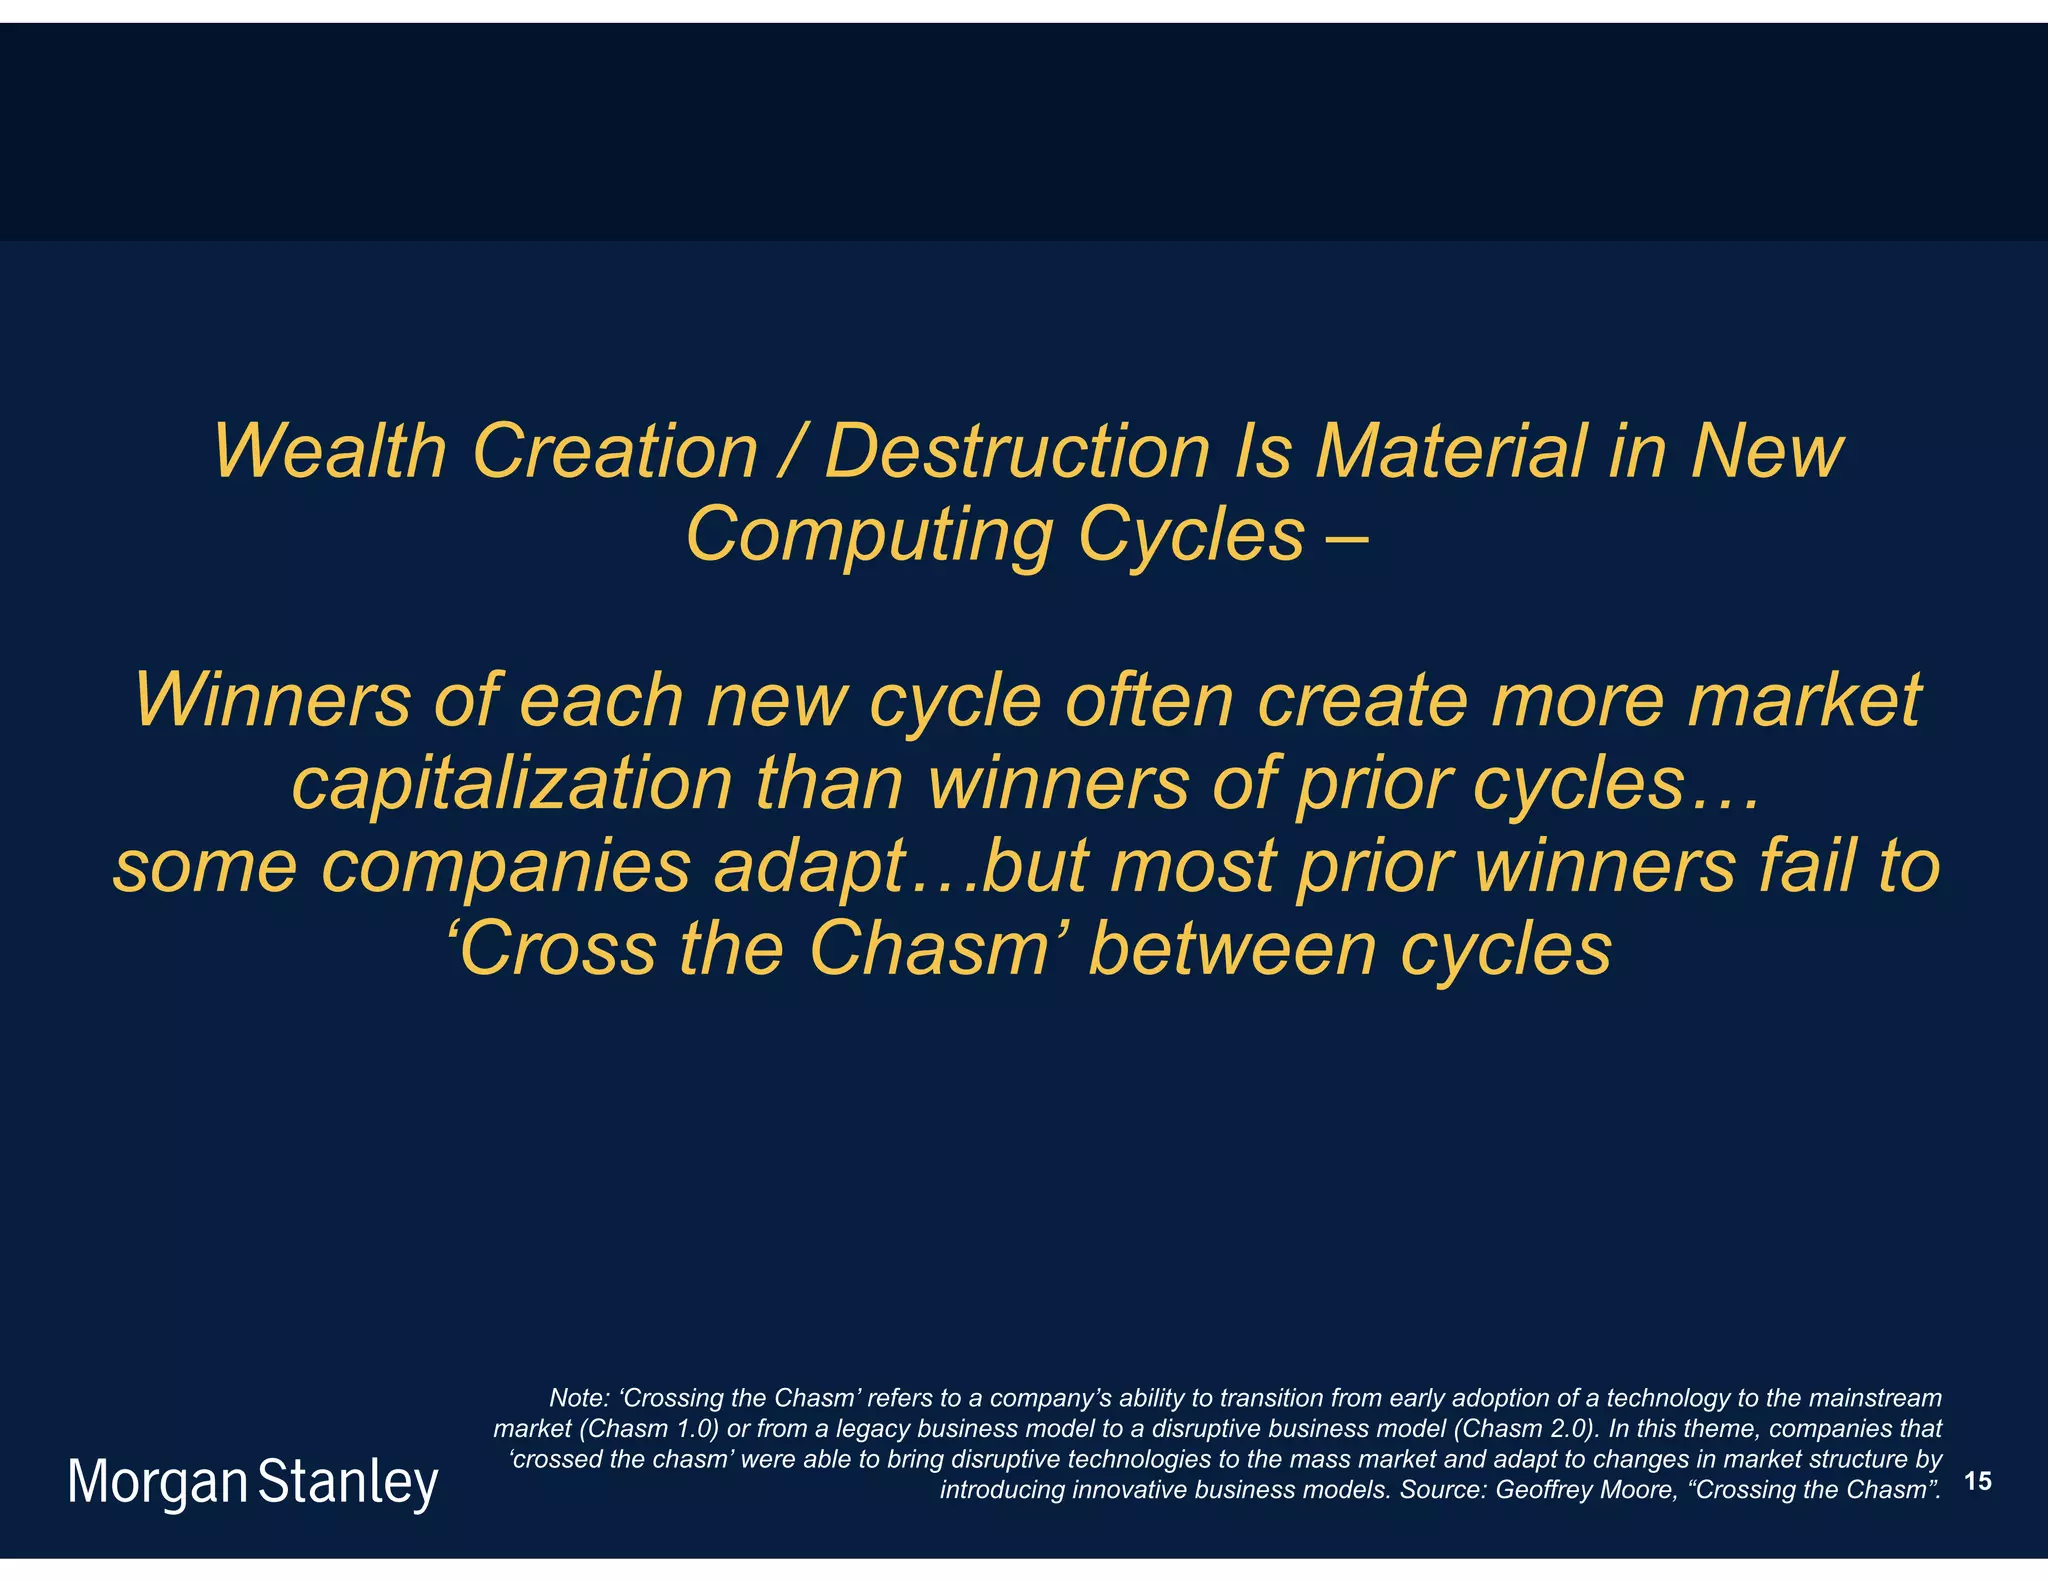
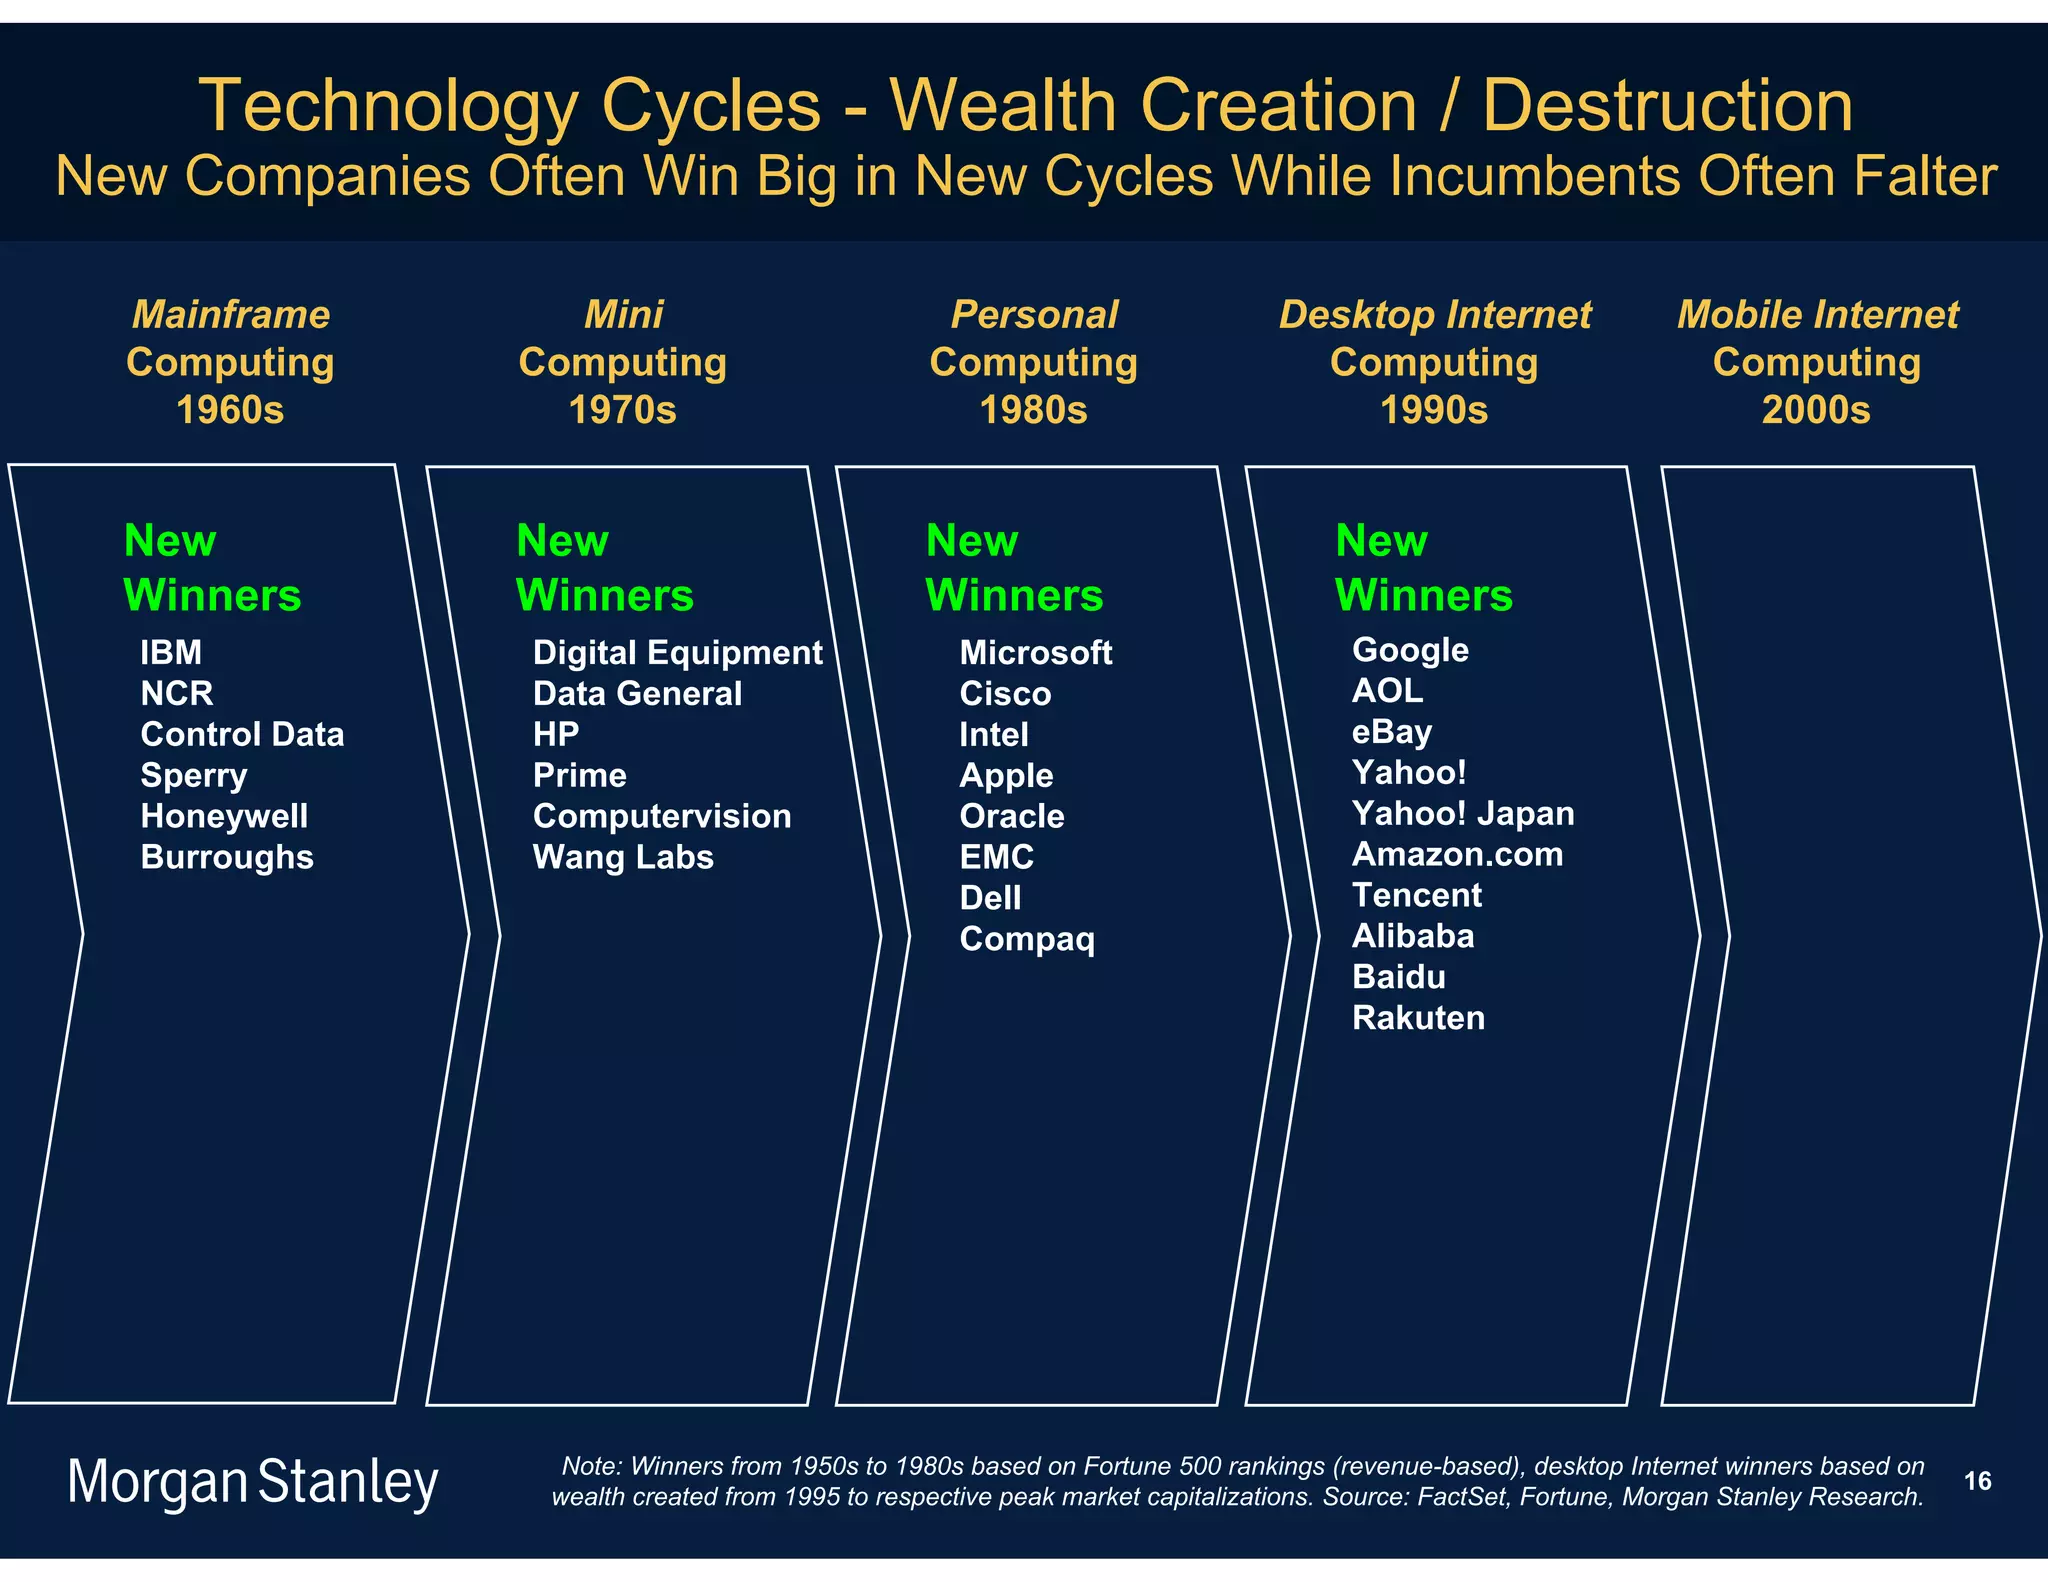
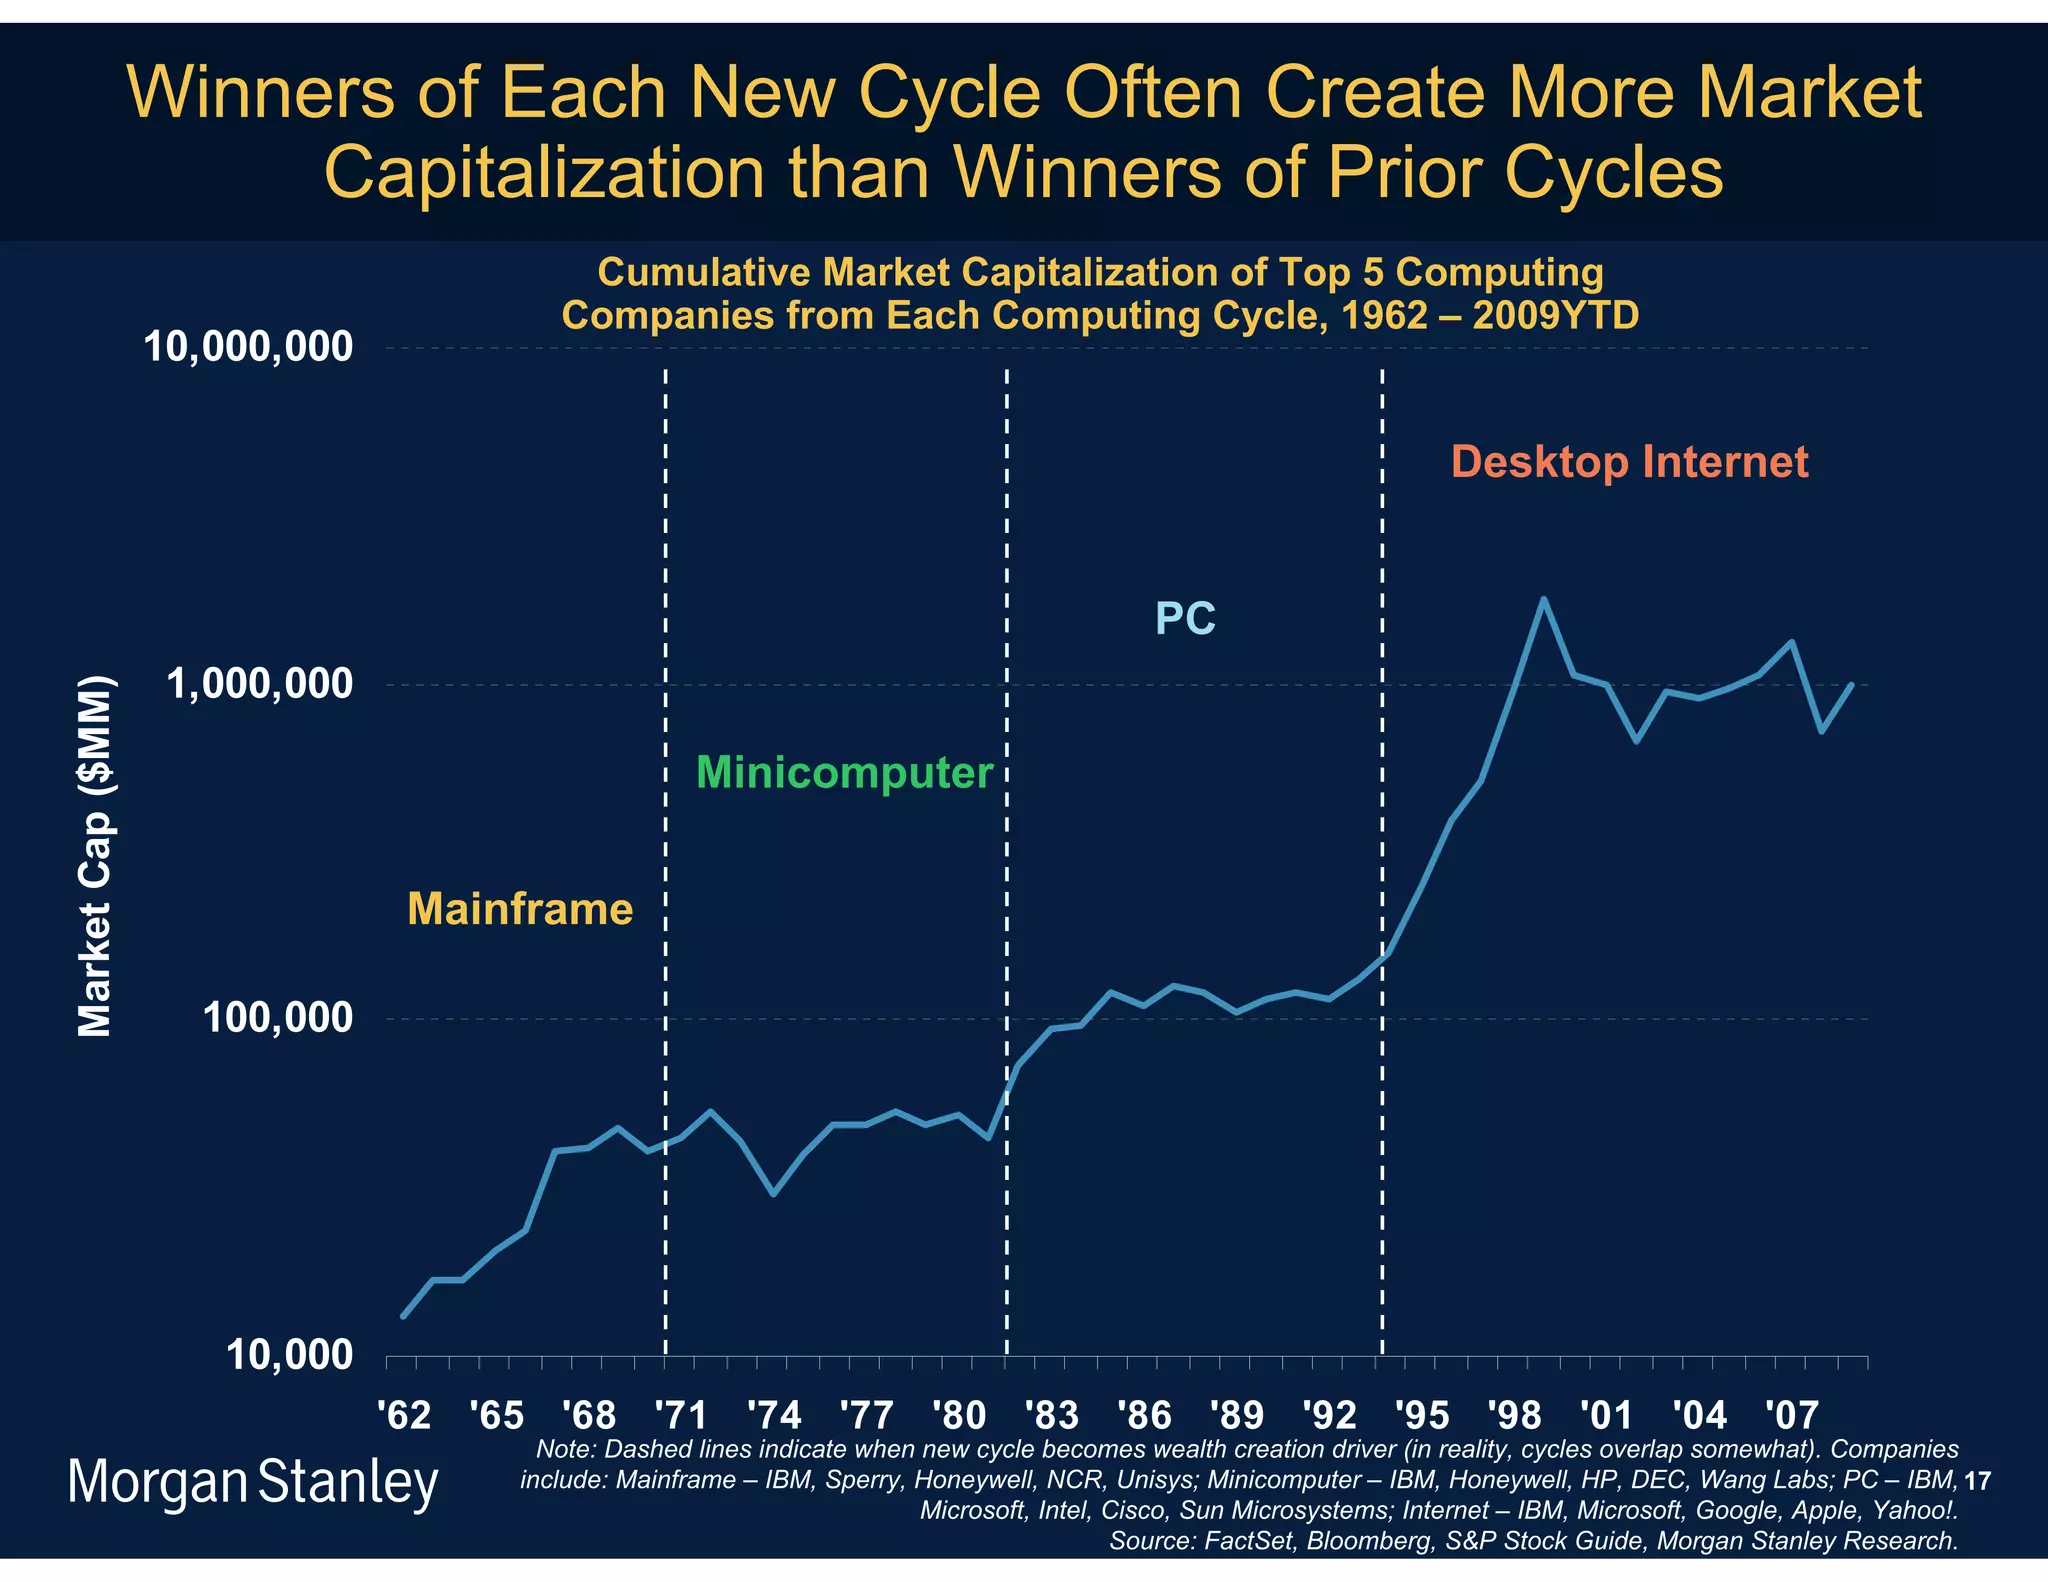
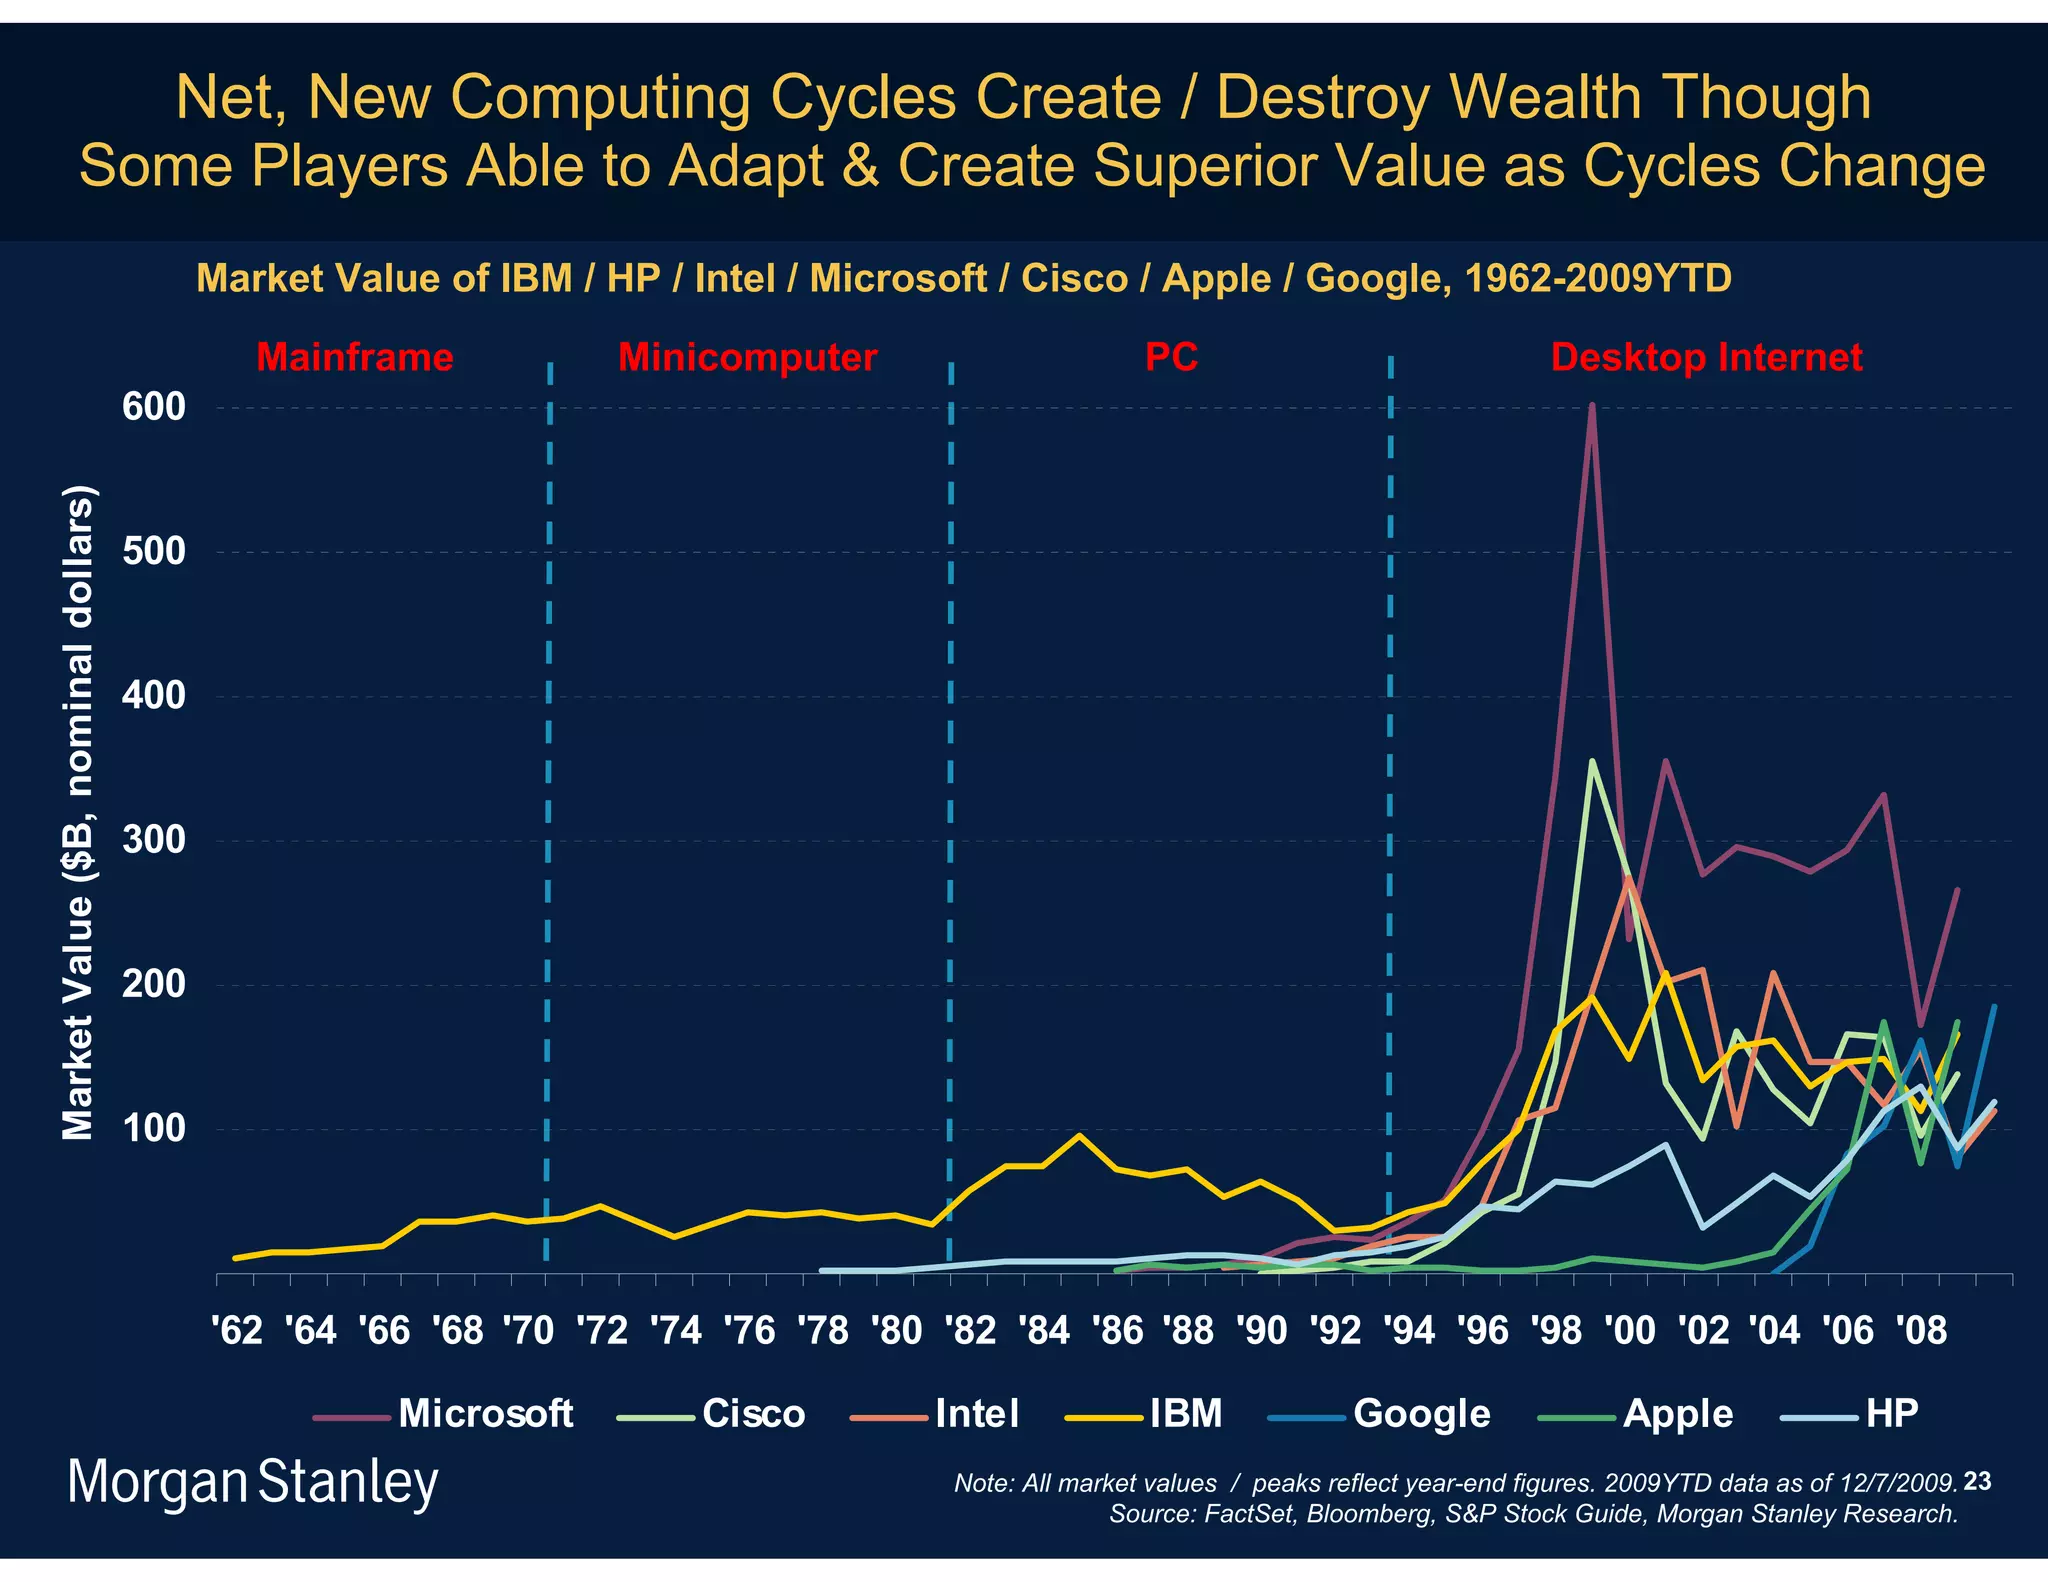
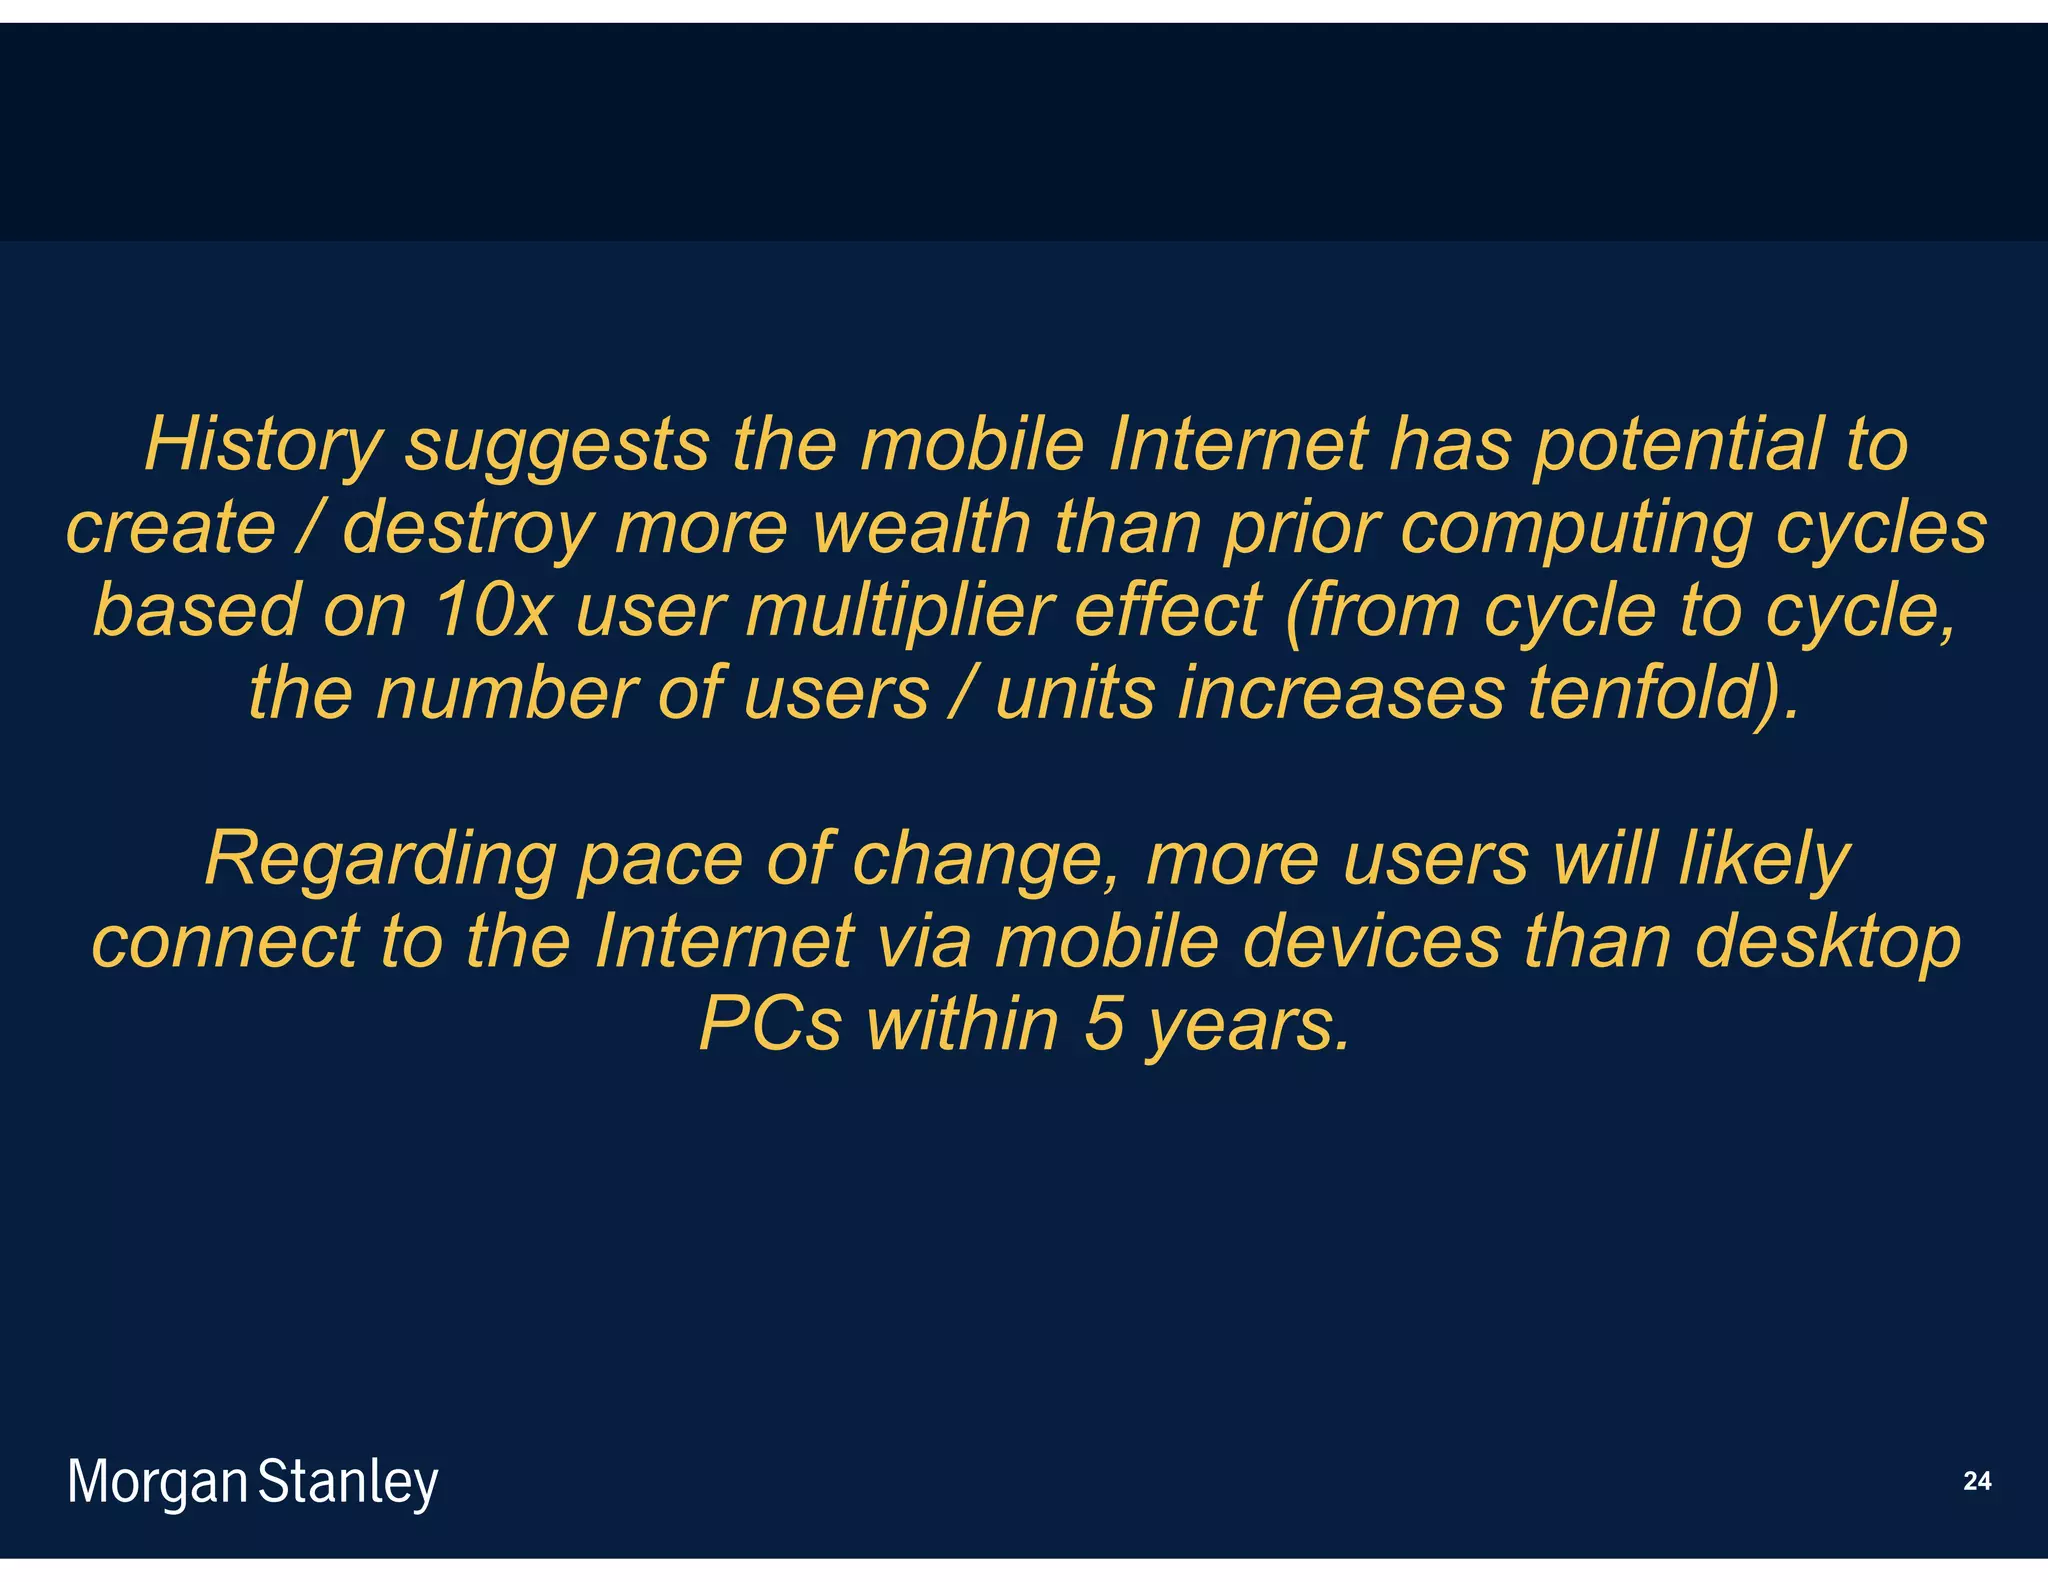
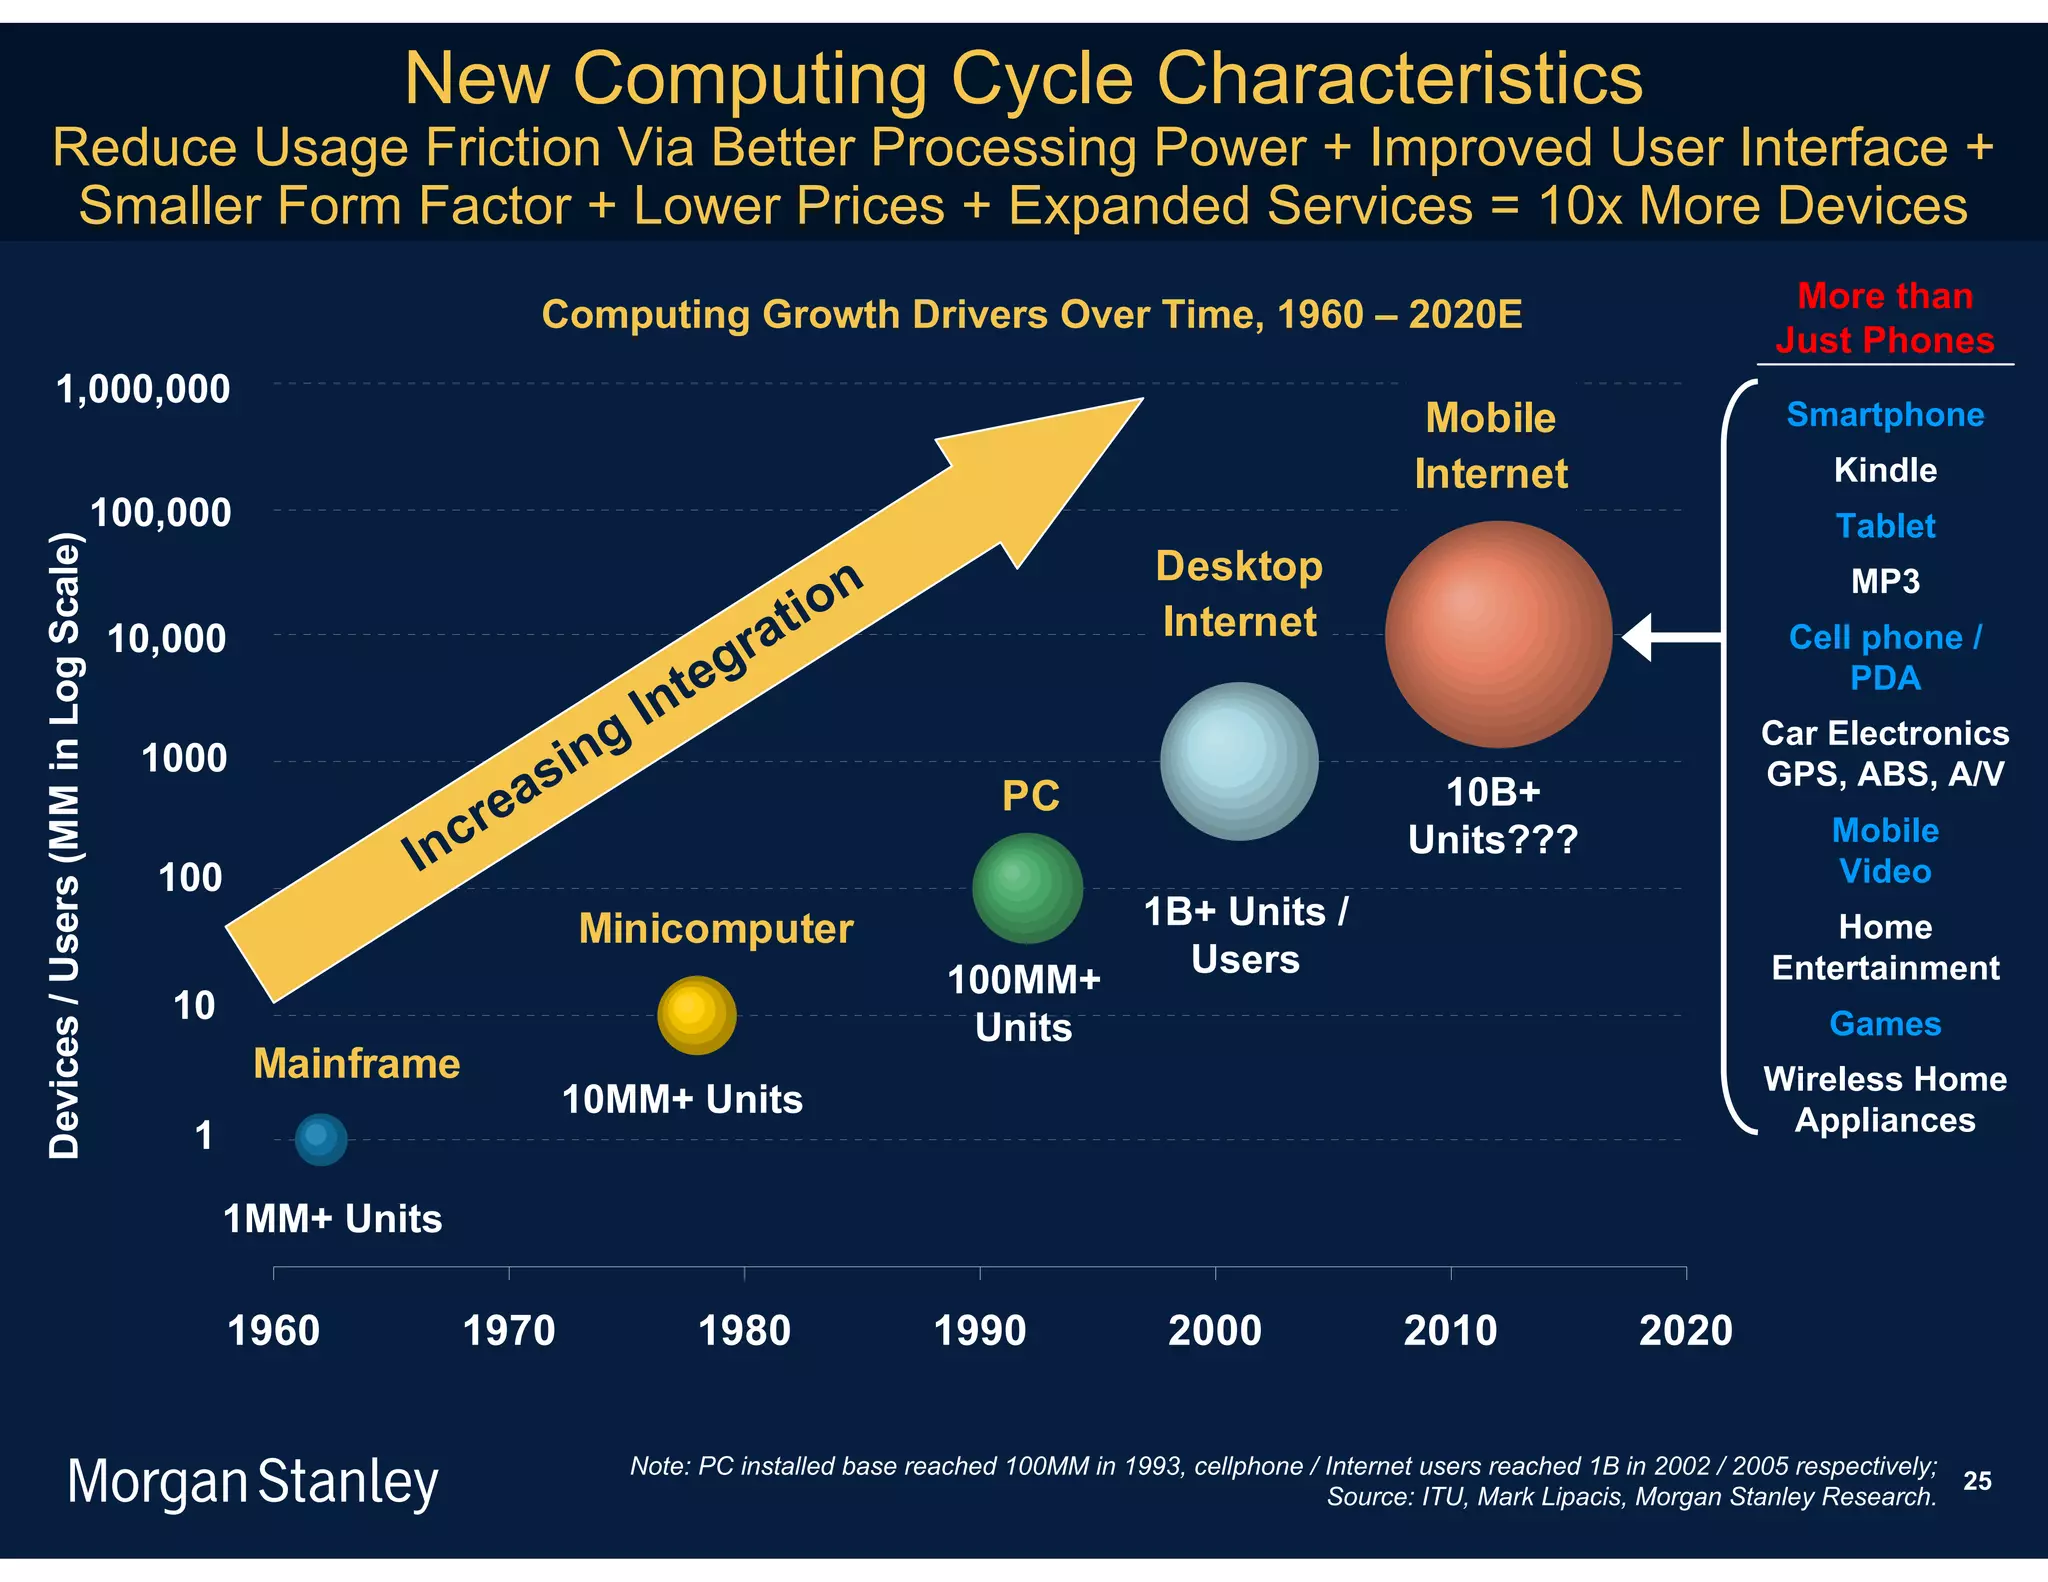
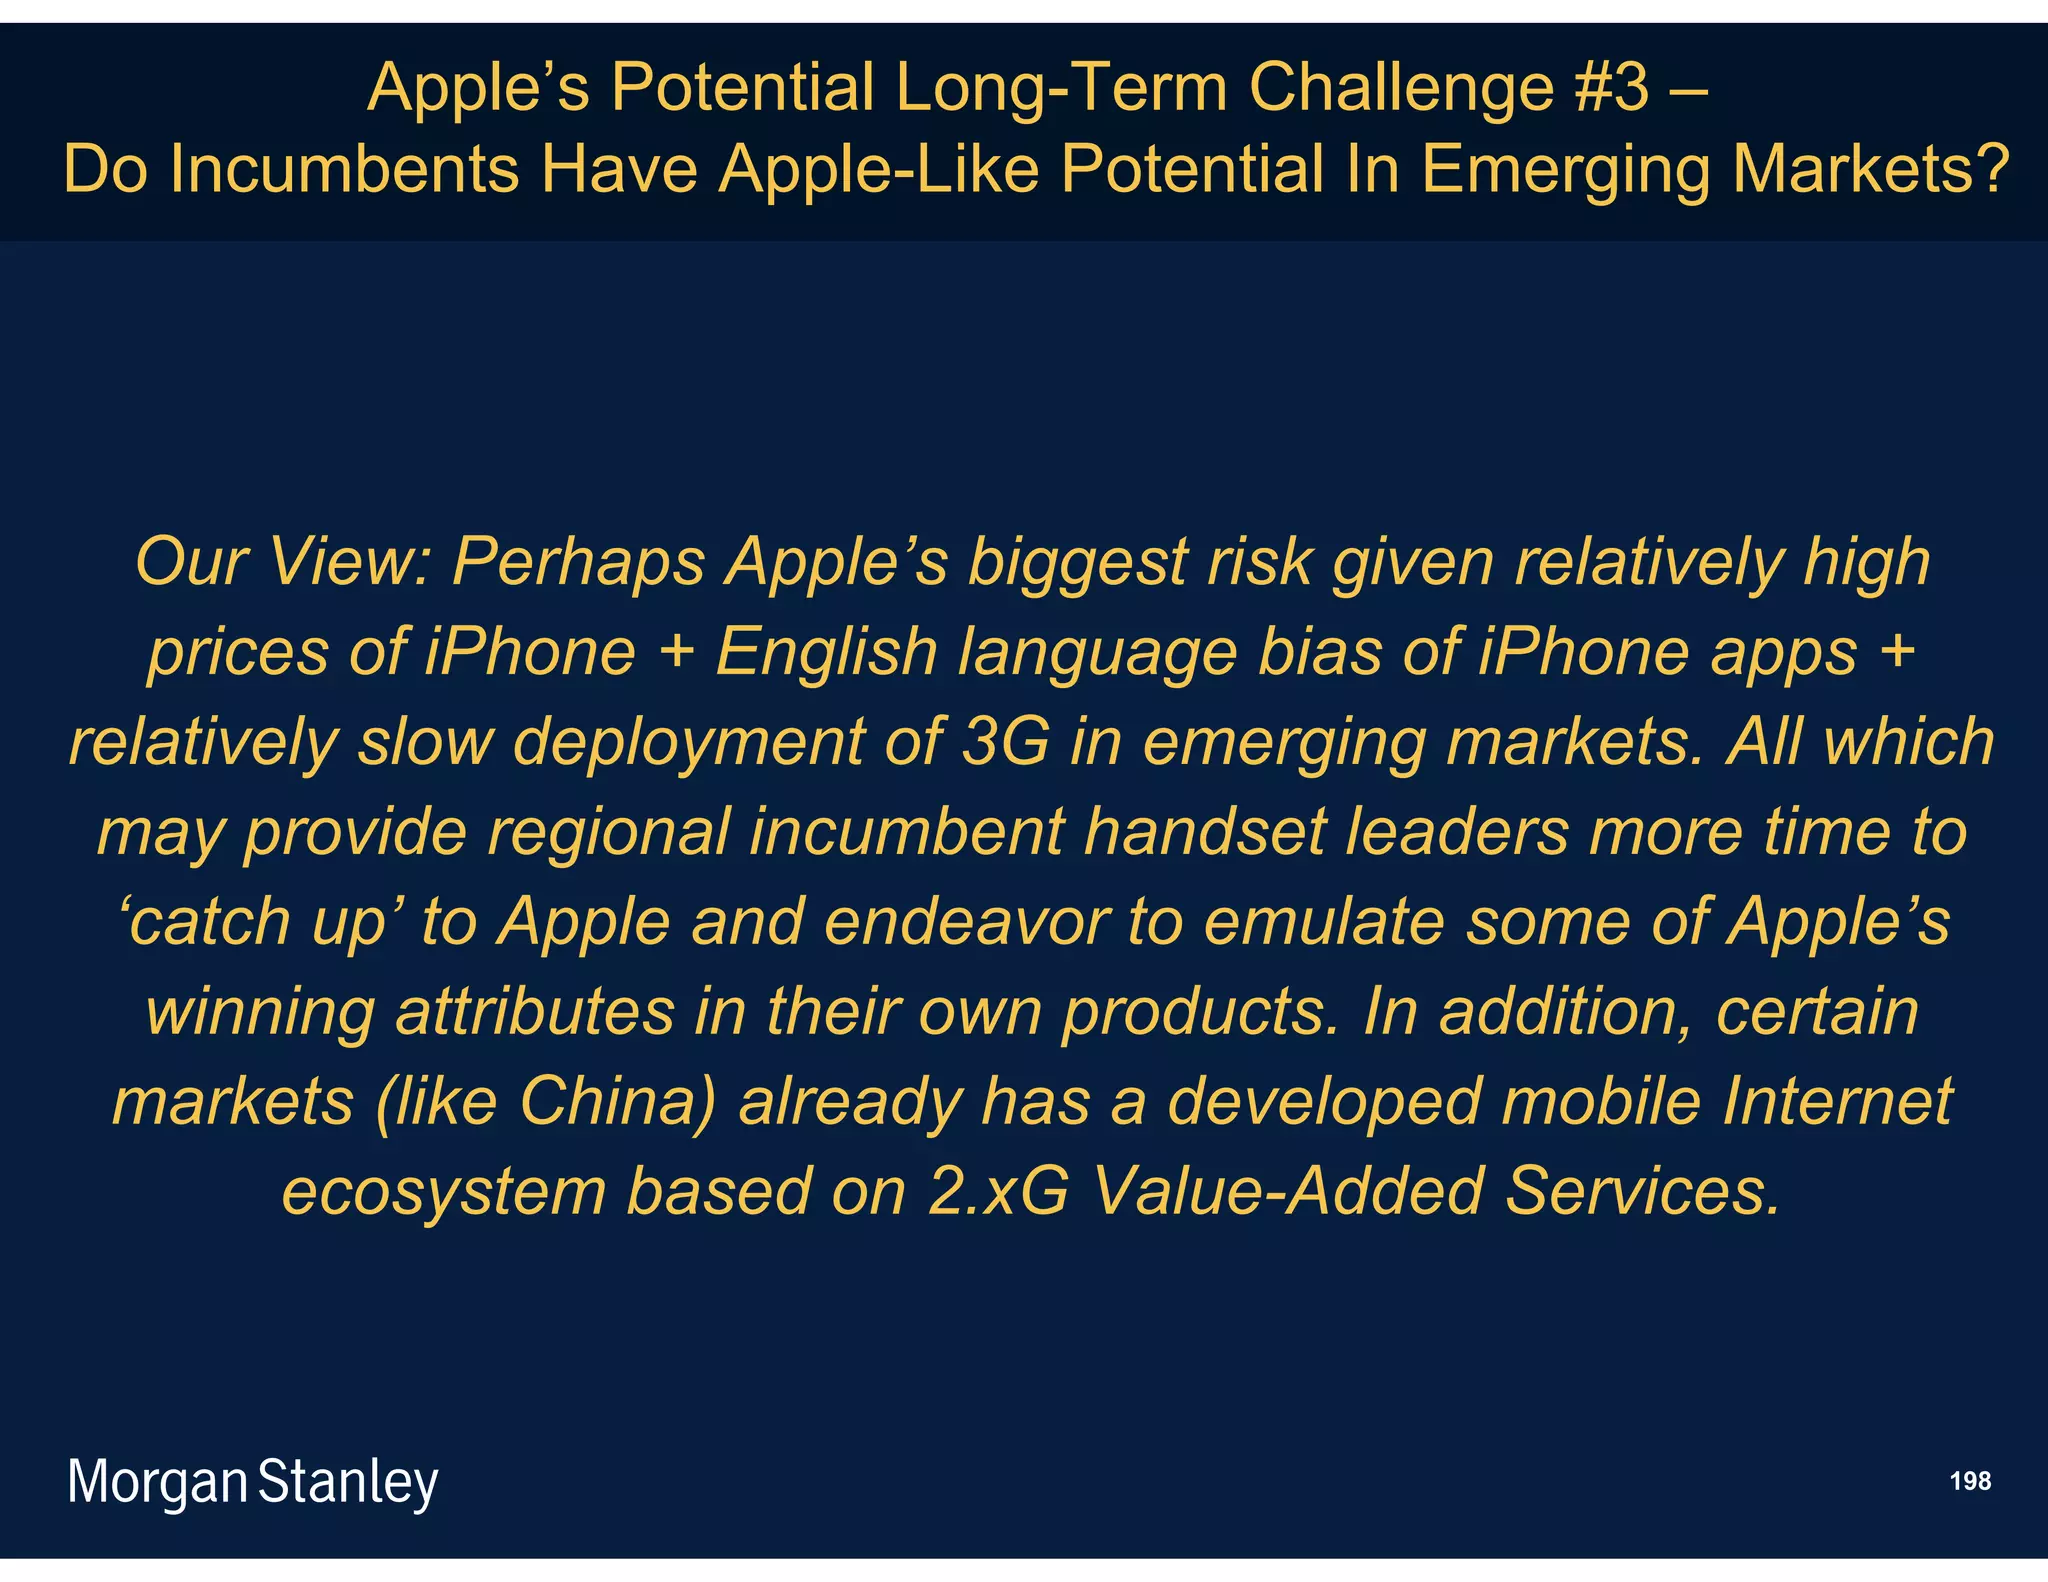
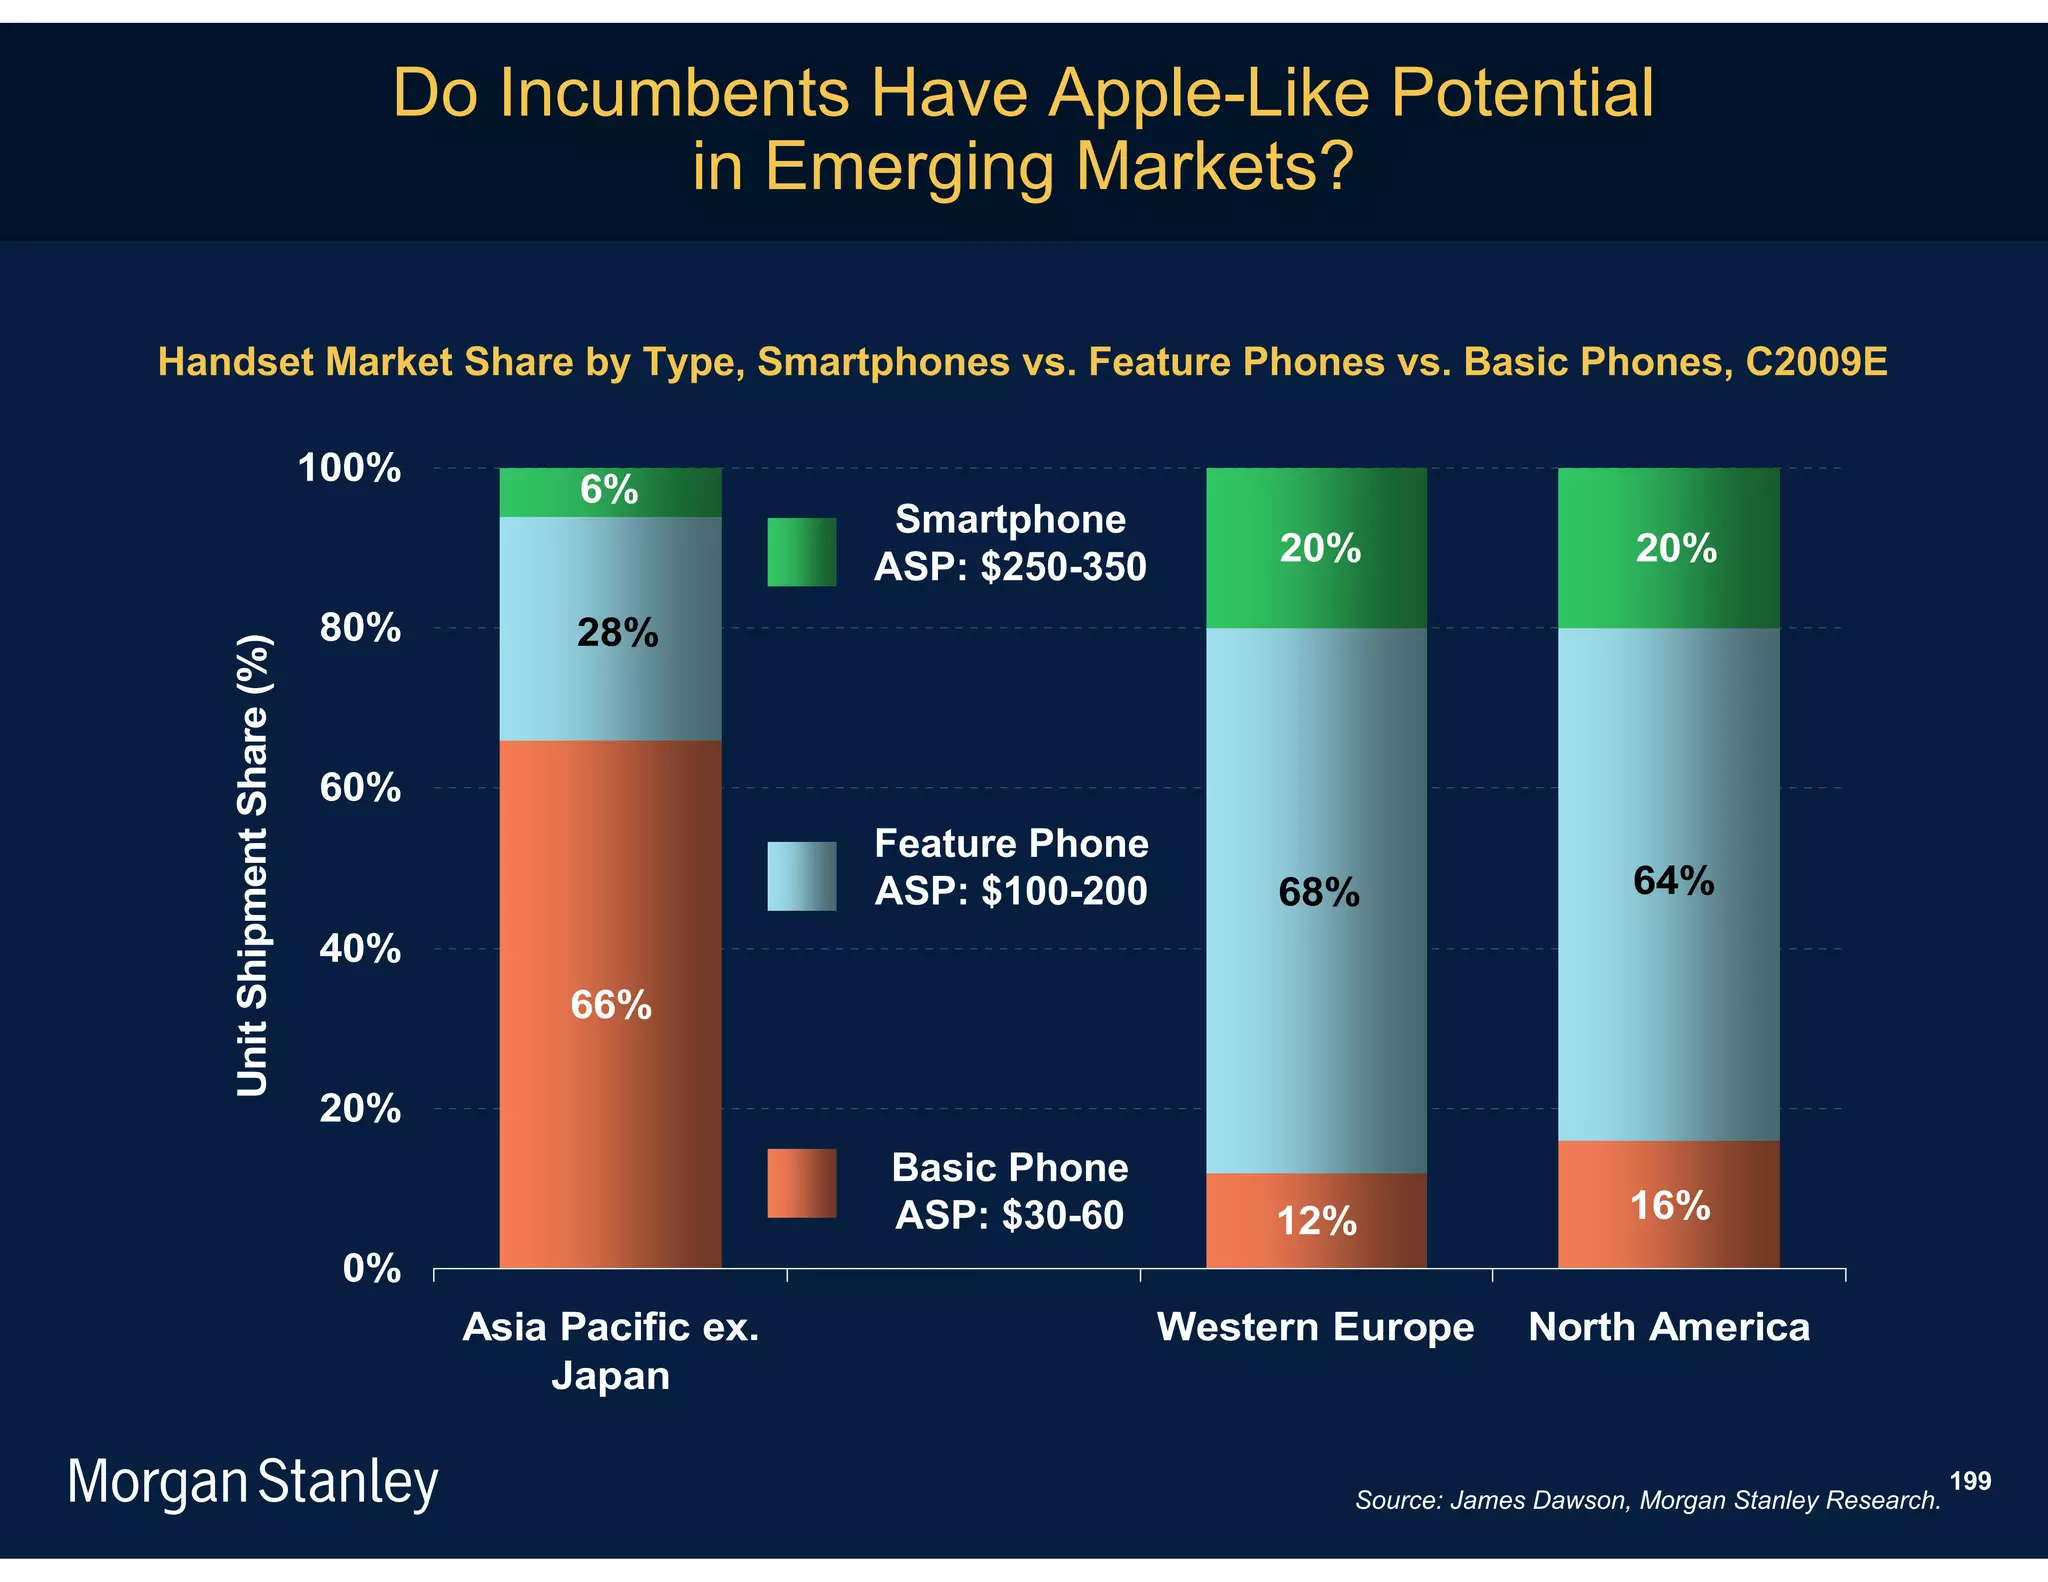
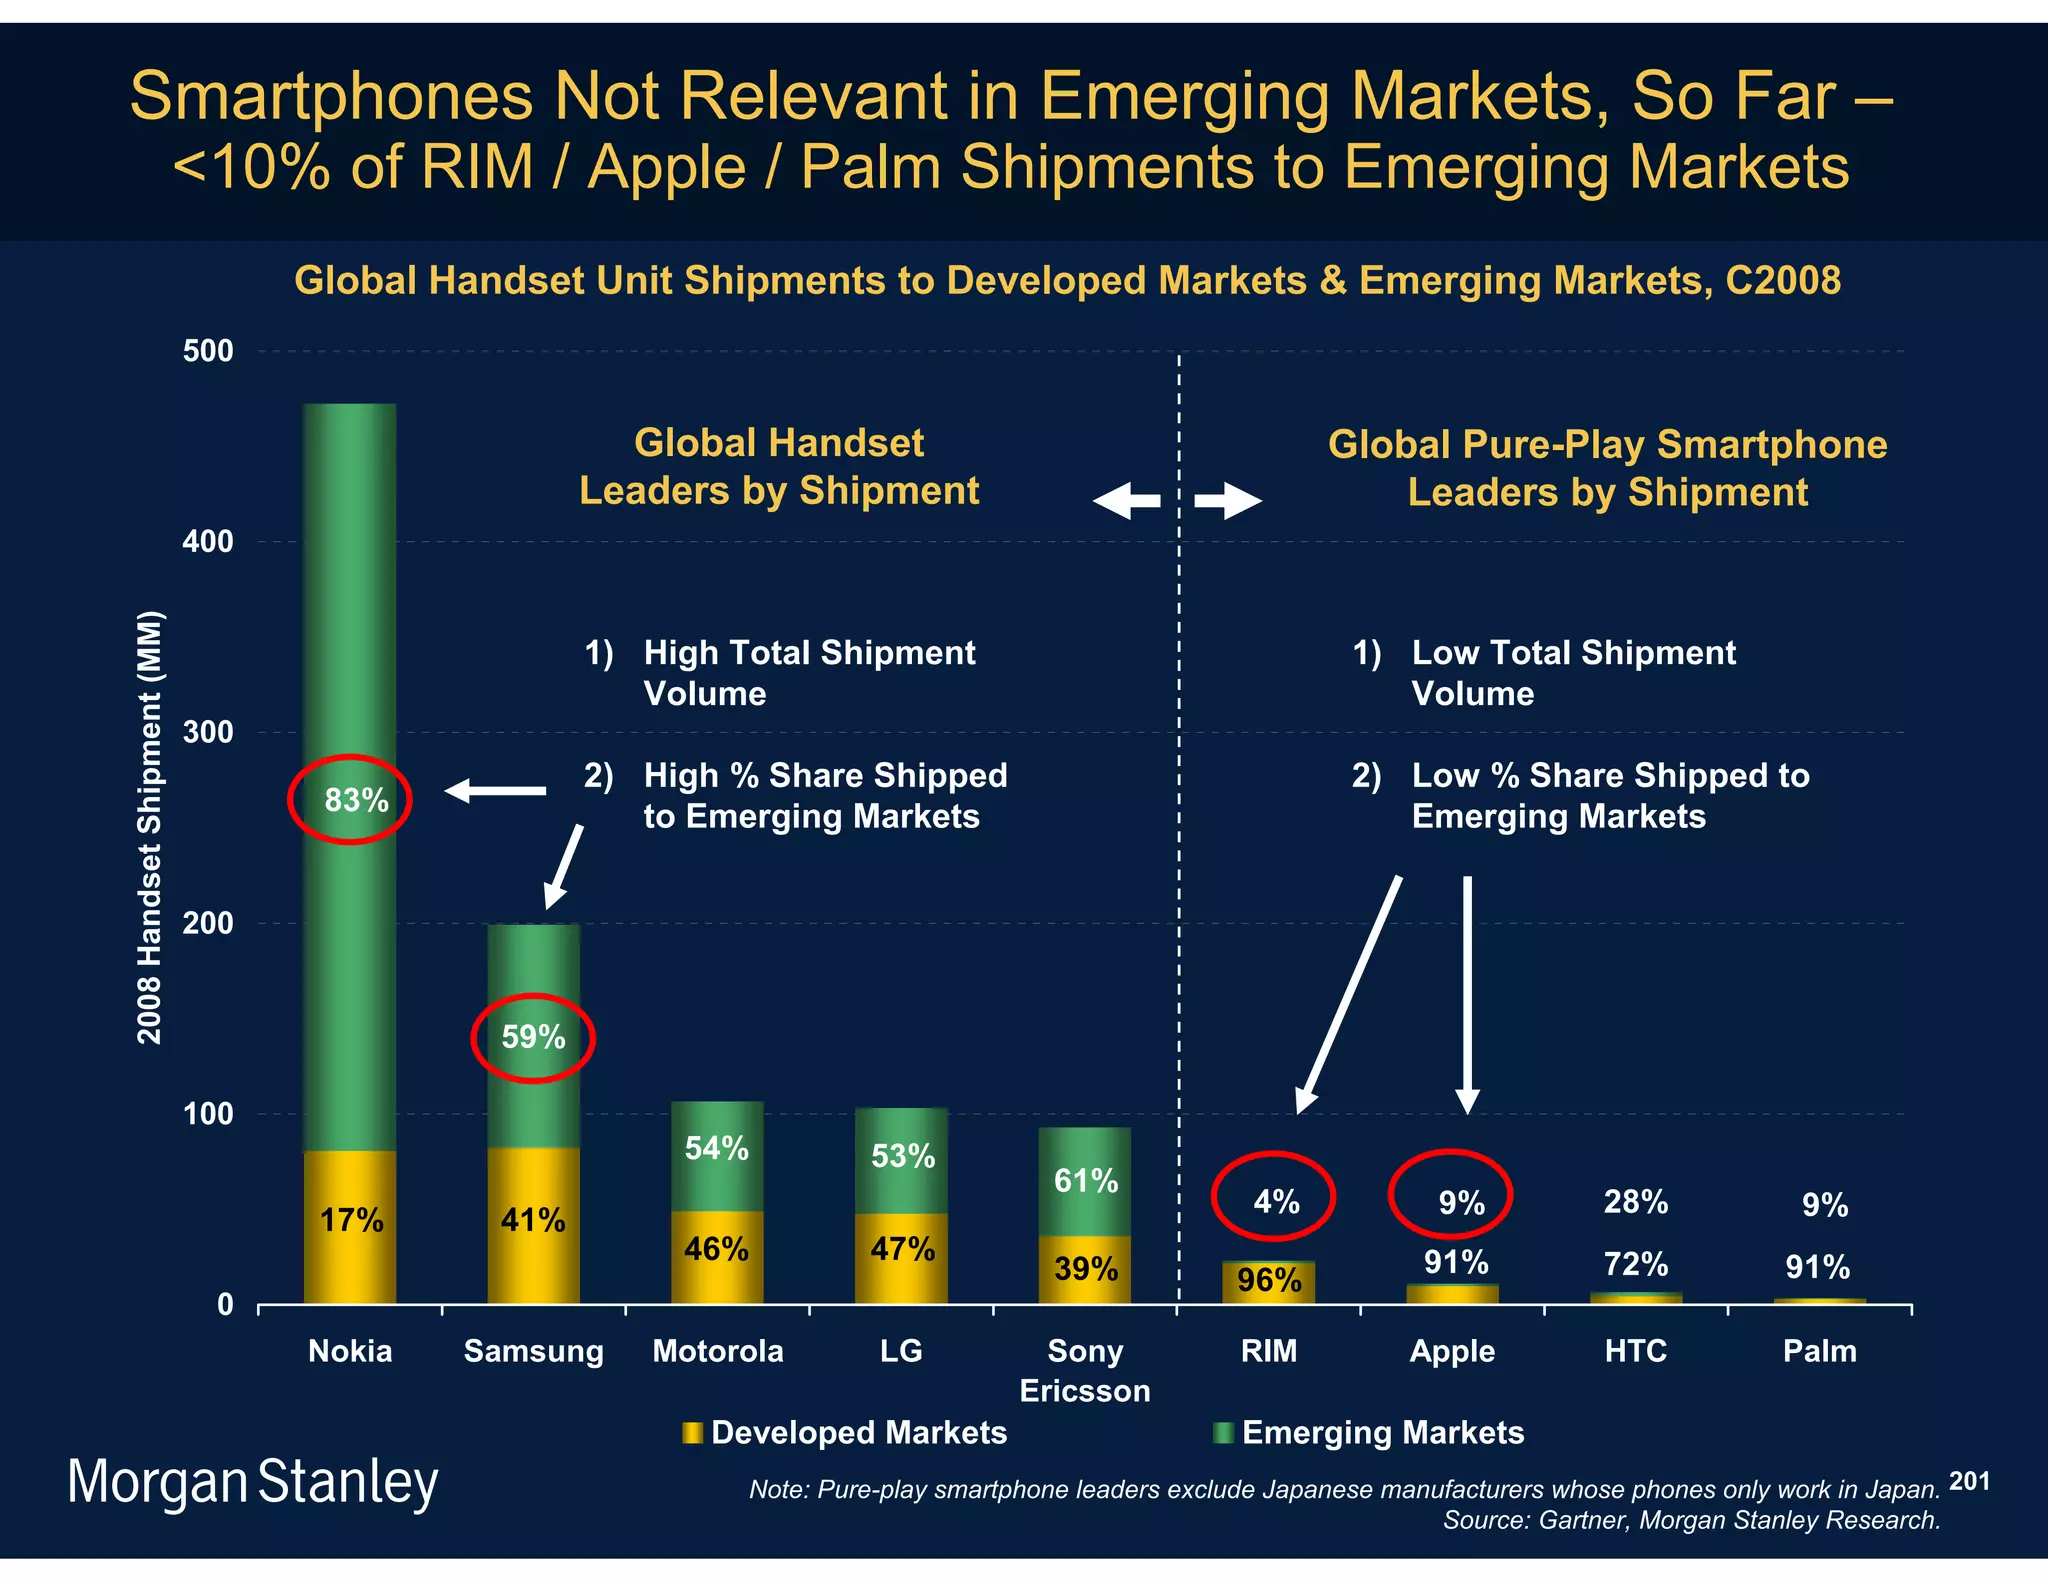
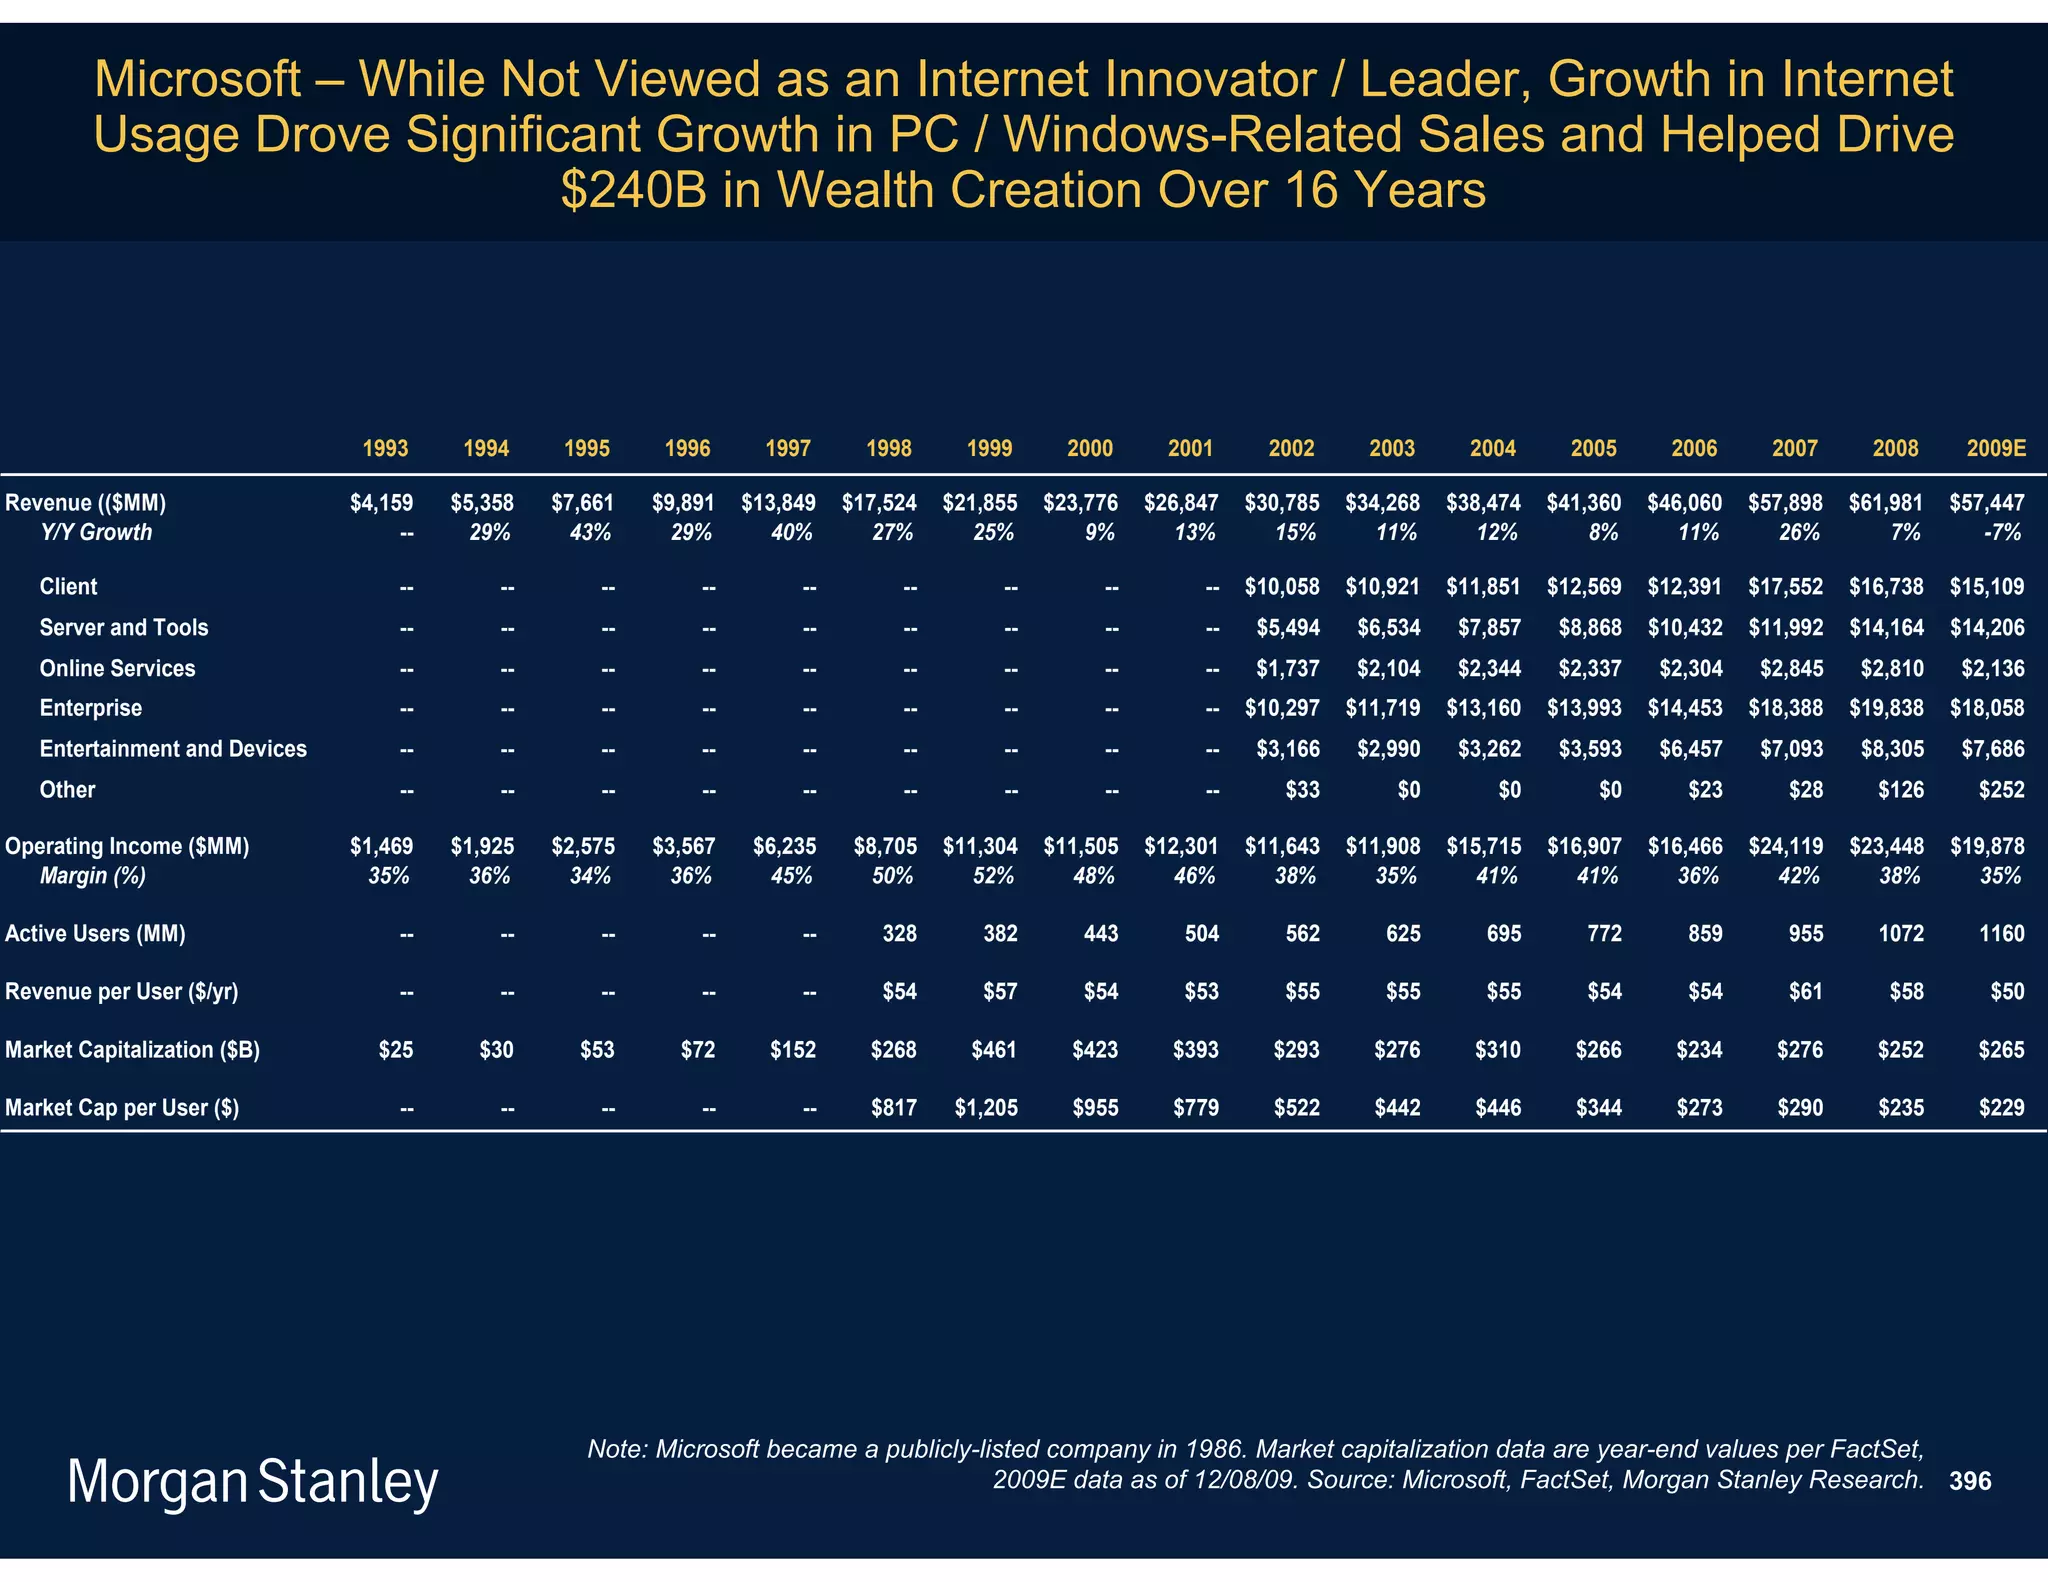
The document summarizes key themes from Morgan Stanley's Mobile Internet Report. The first theme is that wealth creation and destruction is material during new computing cycles, and we are currently in the early innings of the mobile internet cycle. History shows that massive technology changes typically shift dynamics between incumbents and attackers, creating winners and losers. A handful of current incumbents like Apple, Google, Amazon and Skype appear well positioned for the mobile changes.


