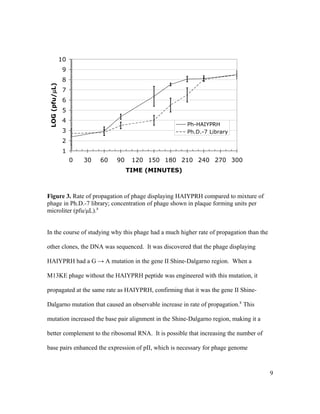
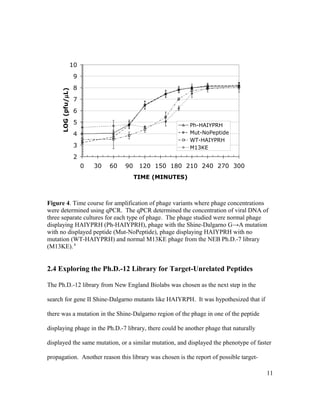
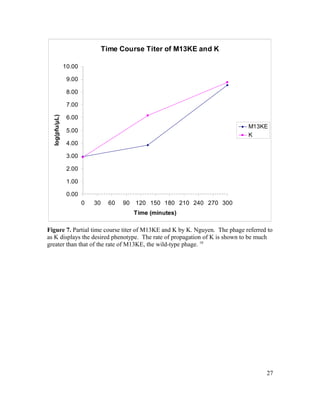
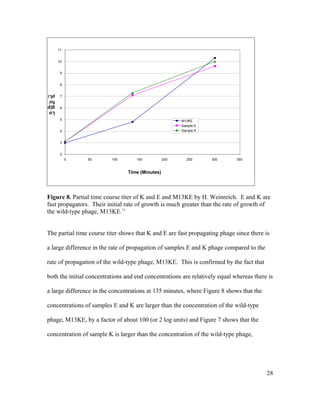
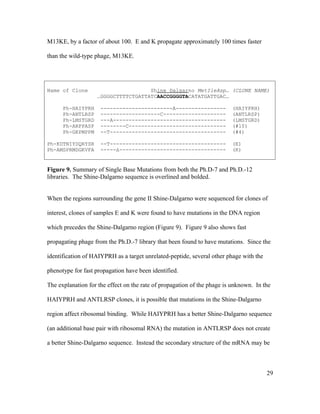
Identifying Fast-Propagating M13KE Bacteriophage from the
New England Biolabs Ph.D.-12 Phage Displayed Peptide
Library
BY
MICHELLE HOULE
SENIOR THESIS
CHEMISTRY
2010
Identifying Fast-Propagating M13KE Bacteriophage from the
New England Biolabs Ph.D.-12 Phage Displayed Peptide Library
by
Michelle L. Houle
SENIOR THESIS
Submitted to Stonehill College
in Partial Fulfillment of the
Requirements for the Degree of
Bachelor of Science
in
Chemistry
May 2010
ii
This thesis has been examined and approved.
________________________________________________
Marilena F. Hall, Ph.D.
Thesis Advisor
Associate Professor of Chemistry
Stonehill College
________________________________________________
Maria Curtin, Ph.D.
Professor of Chemistry
Stonehill College
________________________________________________
Magdalena James-Pederson, Ph. D.
Assistant Professor of Chemistry
Stonehill College
iii
TABLE OF CONTENTS
DEDICATION v
ACKNOWLEDGEMENTS vi
I. ABSTRACT 1
II. INTRODUCTION 2
2.1 Bacteriophage 2
2.2 Peptide Phage-Displayed Libraries 5
2.3 A Target-Unrelated Peptide in the Ph.D.-7 Library 7
2.4 Exploring the Ph.D.-12 Library for Target-Unrelated Peptides 11
III. MATERIALS AND METHODS 13
3.1 Overview 13
3.2 Materials 13
3.3 Methods 15
3.3.1 Amplification of New England Biolabs’ Ph.D.-12 Library 15
3.3.2 Titer of Amplified Phage 16
3.3.3 Plaque Pick of Round Three Amplified Phage 17
3.3.4 Deviations from Standard Procedure 19
IV. RESULTS AND DISCUSSION 20
4.1 Serial Amplification of the New England Biolabs’ Ph.D.-12 library 20
4.2 Time Course Titers of Serial Amplifications 24
V. CONCLUSIONS 31
VI. LITERATURE CITED 32
iv
DEDICATION
I would like to dedicate this thesis to my father, who has continually supported
my education in multiple ways. He recently told me that when I was learning how to
read, being read to by me was a painful experience. Hopefully reading this paper will not
prove to be such a painful task.
v
ACKNOWLEDGEMENTS
I would like to acknowledge the contributions of Stonehill College towards the
completion of this thesis, as well as the Research Corporation for funding. In addition, I
would like to thank Kieu Nguyen and Heidi Weinreich for their aid with research and
Evan Tallmadge for reading many, many drafts. I would also like to thank our primary
collaborator, Dr. Christopher Noren at New England Biolabs. Without his material
support and knowledge of molecular biology this project would not have been possible.
Above all else, I would like to thank my research advisor, Professor Marilena Hall.
Professor Hall is an inspirational woman who handles the laboratory and life with
apparent ease. She has shown extreme patience in correcting my disjointed drafts and
has shared her knowledge with great generosity.
vi
I. ABSTRACT
The commercially available Ph.D.-12 phage-displayed dodecapeptide library was
explored in the search for phage with the phenotype for a rate of propagation greater than
the average rate of propagation of the library. This was done as an extension of the work
performed with the Ph.D.-7 library from New England Biolabs, which presented the
target-unrelated peptide, HAIYPRH. The Ph.D.-12 library was serially amplified (3
times) to allow fast propagating phage to enrich their concentrations relative to normal
phage. A sampling of 48 phage clones were isolated from the amplified library and
identified by sequencing the DNA corresponding to the displayed peptide. While none of
the clones that were sequenced appeared more than once, the sequences will be kept as
part of a compilation project. The amplified phage solutions were later analyzed in the
search for clones having the phenotype of fast propagation. Two phage clones were
selected as fast propagators and time course titers were performed to confirm their
propagation rates. Both phage were shown to have mutations preceding the Shine-
Dalgarno region of gene II of the M13 bacteriophage.
1
II. INTRODUCTION
2.1 Bacteriophage
Andre Lwoff irradiated Escherichia coli (E. coli) with UV light in the 1940s and found
that the bacteria stopped growing only to burst, letting out a second biomaterial into the
culture medium. 1
This biomaterial was referred to as bacteriophage. Since Lwoff, it has
been determined that bacteriophage are viruses that infect cells and are often referred to
as phage. In Lwoff’s studies, they referred to the bacteriophage as lambda, λ. Another
type of phage able to infect E. coli are filamentous phage, which are commonly used by
researchers to study the interactions between phage and bacteria.2
Filamentous phage are
phage whose protein capsid is long and extremely thin, making the phage appear like a
filament under SEM inspection.
M13 is a filamentous bacteriophage which is a nonlytic, single-stranded DNA virus that
consists of 11 proteins, whose life cycle is shown in Figure 1. To have a nonlytic cycle
refers to a cycle in which the bacteriophage propagate within the bacteria and are released
without killing the bacteria. The life cycle begins when E. coli binds to protein III (pIII)
of the phage by the tip of the F pilus.2
The tip receives a phage attachment which allows
2
for the displacement of a pIII domain. The immediate steps following displacement of
the domain are unknown and the next known step is after phage infection has been
completed and the viral (+) strand of DNA has been formed. The complementary (-)
strand is formed and a double stranded DNA is produced. The final product is the
parental replicative form (RF) which is used transcription. The (+) strand is then nicked
by pII, forming a 3’-hydroxyl which acts as a primer so that polymerase may begin
synthesizing a new strand of DNA. As a result of round one replication a new (+) strand
was formed and the original (+) strand that was displaced so that the first replication
could be made forms a supercoiled double-stranded progeny that can direct the synthesis
of the phage proteins. The mRNA is translated into all of the phage proteins and
replication occurs to synthesize new viral strands. The single stranded (+) DNA that are
synthesized are coated by pV until a critical concentration of pV is reached. After the
critical concentration is reached, single stranded (+) viral DNA is replicated almost
exclusively as packaging occurs and pV represses the expression of gene II. As synthesis
of the proteins occurs, the proteins are inserted into the cell membrane, with the
exception of pII, pX and pV, which remain in the cytoplasm. After the synthesis of the
proteins, the DNA of the phage is then injected from the cell membrane of the host cell
into the periplasmic space and then into the cytoplasm.2, 3
The coat proteins are
synthesized in the cell and attached to the genome as the genome is excreted from the
cell. The virus is secreted from the cell without killing the host cell through a mechanism
similar to the insertion of the phage genome.
3
Figure 1. M13 lifecycle within the bacteria4
Figure 2. Mature M13 bacteriophage. Proteins not represented in this diagram, including
protein II, while not present in the mature phage are involved in replication. Figure
prepared by Evan Tallmadge ’10.
4
2.2 Peptide Phage-Displayed Libraries
In nature, there are biological macromolecules with specific binding locations. Examples
of these types of biomolecules include enzymes, hormone receptors, and antibodies.5
When studying binding mechanisms to understand interactions between macromolecules,
researchers try to imitate a target binding site and possibly any specific conditions that
are necessary for binding. Conditions are varied to determine which set of conditions
results in strong specific binding and which conditions result in weak or non-specific
binding. Generally, if the proper conditions and substrates are presented, the
macromolecule will bind to the substrate that has been presented.
Often when researchers are looking for macromolecules that bind to a specific substrate,
they will use a technique called phage display.5
A peptide phage display library contains
randomized sequences of amino acids expressed on the N-terminus of a coat protein, for
example pIII in M13 bacteriophage. This results in five copies of the randomized peptide
displayed per phage virion (shown in left side of Figure 2). These peptides are exposed
to a target allowing those with affinity for the target to bind in a process called panning.
Peptides that bind are allowed to propagate, a process known as amplification. The
likelihood of randomly selecting a peptide multiple times after panning is extremely
small unless it has taken over the culture. The library is made by inserting a randomized
section of DNA just after the start codon of gene III. This randomized sequence codes
5
for every possible combination of amino acids, resulting in a complete library of peptides
attached to protein III. New England Biolabs (NEB) produces several phage display
libraries with various lengths, including the seven randomized amino acid, Ph.D.-7,
library and the twelve randomized amino acid, Ph.D.-12, library. These libraries are
constructed in M13KE, which is a M13 varient with the LacZα gene inserted into its
genome and cloning sites embedded in the intergenic region near origin of replication.6
The E. coli bacteria serves as host for the replication of bacteriophage. An infected host
cell experiences a decrease in rate of replication but it continues to grow and divide as the
phage is released. Due to the decreased rate of growth of infected cells, when phage are
placed on an E. coli lawn, regions of low bacterial density, called plaques, form where
the E. coli is infected with M13KE.1
The plaques are blue because the LacZα gene of the
M13KE genome produces β-galactosidase. β-galactosidase metabolizes the X-gal in the
media, producing a blue precipitate.
There are several purposes for using phage display to find specific peptides that bind to
small molecules. These include the determination of the optimal enzyme active site or
the design of antibodies. When using a phage-displayed random peptide library, most of
the phage clones in the library do not bind to anything and are “nonbinding phage”.
Sometimes when searching for the peptide that best binds to a target, there are peptides
that appear to bind for unknown reasons. While there are many possible situations, this
may be the result of the peptide binding to the plate on which the target is held stationary,
6
other times it is due to the peptide binding to other phage.7
These peptides have been
termed target-unrelated peptides. Menendez and Scott define them most specifically as
peptides that have been selected for their affinity of a component within the system that is
not the target.7
2.3 A Target-Unrelated Peptide in the Ph.D.-7 Library
In panning experiments using the Ph.D.-7 library for zinc binding heptamers, phage
displaying the HAIYPRH peptide appeared. This peptide had also appeared in other
laboratories and there were questions about why this phage was being selected.8
It did
not have the characteristics of a peptide with theoretically good binding to zinc. Typical
zinc-binding peptides had four or five histidine residues whereas HAIYPRH only has
two. Then, when HAIYPRH appeared in multiple separate panning trials under varied
conditions, the phage clone displaying HAIYPRH was studied to determine why it
appeared so often. It was discovered that the peptide did not bind the zinc,8
meaning it
was not a target unrelated peptide of the type described by Menedez and Scott.7
Therefore, the HAIYPRH phage itself was studied to determine what was causing the
phage to appear at such a high rate in panning experiments. Comparisons of HAIYPRH
and the M13KE library showed that HAIYPRH had a faster rate of propagation than the
average phage in the Ph.D.-7 NEB library. 8
7
A time course titer experiment (TCT) was performed to study the rates of propagation. A
TCT is when phage is allowed to propagate in cells and samples are taken at given time
intervals and plated to determine the concentration of phage at each time point. The
greater initial rate of propagation, displayed as a high concentration of phage through the
middle period of the TCT (~120-150 minutes), for the HAIYPRH sample compared to
the library confirmed that that phage displaying the HAIYPRH peptide propagated faster
than the normal library. Early in the titer and the final period of the titer, both the titer for
the HAIYPRH and for the library show relatively similar concentrations of phage. This
solidified the conclusion that the phage displaying HAIYPRH must propagate at a rate
that is faster than that of the library, reaching the maximum concentration of phage in
solution in much less time. (Figure 3)
8
1
2
3
4
5
6
7
8
9
10
0 30 60 90 120 150 180 210 240 270 300
TIME (MINUTES)
LOG(pfu/µL)
Ph-HAIYPRH
Ph.D.-7 Library
Figure 3. Rate of propagation of phage displaying HAIYPRH compared to mixture of
phage in Ph.D.-7 library; concentration of phage shown in plaque forming units per
microliter (pfu/μL).8
In the course of studying why this phage had a much higher rate of propagation than the
other clones, the DNA was sequenced. It was discovered that the phage displaying
HAIYPRH had a G → A mutation in the gene II Shine-Dalgarno region. When a
M13KE phage without the HAIYPRH peptide was engineered with this mutation, it
propagated at the same rate as HAIYPRH, confirming that it was the gene II Shine-
Dalgarno mutation that caused an observable increase in rate of propagation.8
This
mutation increased the base pair alignment in the Shine-Dalgarno region, making it a
better complement to the ribosomal RNA. It is possible that increasing the number of
base pairs enhanced the expression of pII, which is necessary for phage genome
9
replication. Since it had previously been confirmed that HAIYPRH was not a target
unrelated peptide of the type described by Menendez and Scott,7
it was possible that a
faster rate of propagation was the reason why HAIYPRH had been selected during
panning experiments. 8
As Figure 4 shows, the mutation increased the rate of propagation
while the displayed peptide, HAIYPRH, did not impact the rate if it was displayed on the
phage. During the panning experiments, amplification was performed between rounds so
that the phage with the Shine-Dalgarno mutation enriched their concentration relative to
the other clones. While HAIYPRH had little or no affinity for the target, making it a
target-unrelated peptide, its high concentration allowed it to be selected with phage
displaying peptides that had much greater affinity for the target.
10
2
3
4
5
6
7
8
9
10
0 30 60 90 120 150 180 210 240 270 300
TIME (MINUTES)
LOG(pfu/µL)
Ph-HAIYPRH
Mut-NoPeptide
WT-HAIYPRH
M13KE
Figure 4. Time course for amplification of phage variants where phage concentrations
were determined using qPCR. The qPCR determined the concentration of viral DNA of
three separate cultures for each type of phage. The phage studied were normal phage
displaying HAIYPRH (Ph-HAIYPRH), phage with the Shine-Dalgarno G→A mutation
with no displayed peptide (Mut-NoPeptide), phage displaying HAIYPRH with no
mutation (WT-HAIYPRH) and normal M13KE phage from the NEB Ph.D.-7 library
(M13KE).8
2.4 Exploring the Ph.D.-12 Library for Target-Unrelated Peptides
The Ph.D.-12 library from New England Biolabs was chosen as the next step in the
search for gene II Shine-Dalgarno mutants like HAIYRPH. It was hypothesized that if
there was a mutation in the Shine-Dalgarno region of the phage in one of the peptide
displaying phage in the Ph.D.-7 library, there could be another phage that naturally
displayed the same mutation, or a similar mutation, and displayed the phenotype of faster
propagation. Another reason this library was chosen is the report of possible target-
11
unrelated peptides and/or peptides with an especially high rate of occurrence.9
These
reported peptides are listed in Figure 5.
APWHLSSQYSRT
IDTFYMSTMSHS
ALTLHPQPLDHP
SVSVGMKPSPRP
HSNWRVPSPWQL
AHRHPISFLSTL
ATWSHHLSSAGL
Figure 5. Potential target-unrelated peptides in the Ph.D.-12 library that were reported by
researchers to the Ph.D.-12 product manager at New England Biolabs.
The NEB Ph.D.-12 library was serially amplified to search for phage with the phenotype
for fast propagation. Serial amplification may be considered “targetless panning” in
which the library is amplified three times without being exposed to a target. This was
done to enrich the concentrations of phage with faster rates of propagation compared to
the library. The phage clones selected at the completion of the experiment were isolated
and identified by sequencing the DNA corresponding to the displayed peptide. If a fast
growing phage is present in the amplification, it should have propagated more rapidly
than the rest of the phage, and so its peptide should occur at a higher frequency in a
random selection from the library. Due to the immense number of unique clones, it was
expected that only fast growing phage would show up more than once in a random
selection of the library.
12
III. MATERIALS AND METHODS
3.1 Overview
The New England Biolab Ph.D.-12 library was amplified serially three times. After each
round of amplification the phage was titered to confirm that the propagation of phage
occurred during each round of amplification. After the third round of amplification and
titering were completed, a plaque pick was performed so that the DNA of the phage could
be sequenced by New England Biolabs. The amplified phage were later analyzed to
determine if any of the sequences propagated faster than average. This research was
performed by Kieu Nguyen ‘12 and Heidi Weinreich ‘10.
3.2 Materials
LB Broth LB broth (Miller, 12.5 g) was added to 500 mL of deionized water. This
solution was either distributed to culture tubes in 5 mL portions or left in a 1 L bottle.
The LB broth was autoclaved. The solution was then stored at room temperature.
Plates LB Agar (20 g) was added to 500 mL deionized water. This solution was mixed,
autoclaved, and let cool to 60 °C. For LIX plates, 500 µL IPTG (40 mg/mL) and X-gal
13
(50 mg/mL) stock solution was added. For LB/tet plates, 500 µL of tetracycline (50
mg/mL) were added. This solution was poured into individual plates and allowed to cool.
These plates, once hardened, were stored at 4 °C.
Streak Plate A small sample of ER2738 E. coli cells (NEB) stored in glycerol at -80°C
was extracted using a sterile inoculating loop. The loop was then dragged across the
surface of a LB/Tet plate in a cross hatch pattern to spread the sample. The plate was
incubated in a 37 °C incubator; the cells were returned to the freezer and the inoculating
loop was re-sterilized. To prevent contamination the plate was sealed by wrapping the
edges of the plate with parafilm the following morning and the plate was wrapped in
aluminum foil to slow decay of tetracyclin by light. The wrapped plate was stored at 4
°C in the refrigerator and was used as needed.
Overnight Culture A colony of E. coli was scraped from the streak plate and mixed with
5 mL of LB Broth and 5 μL 40 mg/mL Tetrycylin (Tet). The culture was shaken
overnight at 250 rpm and at 37 °C.
TE Buffer Tris base (1.21 g) was added to 29.2 g of EDTA and the pH of the solution
was adjusted to 8.5 with 3 M HCl. The total volume of the solution was adjusted to 1 L
with deionized water.
TBS (Tris Buffered Saline) To a total volume of 1 L of deionized water, 6.06 g of Tris
base and 8.76 g sodium chloride were added and the pH was adjusted to 7.6 using HCl.
Agarose Top LB broth (12.5 g), 3.5 g agarose, and 500 mg MgCl2 dissolved in 500 mL
deionized water. This solution was separated into 200 mL bottles in aliquots of
approximately 60 mL each, autoclaved and allowed to solidify.
14
PEG/NaCl Polyethylene glycol-8000 (20 g) and 14.61 g of NaCl were dissolved to a
final volume of 100 mL deionized water.
Iodide Buffer TE buffer (500 μL) at pH 8.0, 500 μL 0.1 M EDTA, and 29.98 g sodium
iodide were mixed then added water so that the total volume of solution was 50 mL.
70% Ethanol Absolute ethanol (70 mL) were added to 30 mL deionized water.
10X Tris/Borate/EDTA (TBE) 107.8 g of Tris base, 5.4 g of EDTA, and 55.0 g of boric
acid diluted to 1 L.
1X TBE 100 mL of the 10X TBE stock was diluted with deionized water to 1 L.
3.3 Methods
3.3.1 Amplification of New England Biolab’s Ph.D.-12 Library
To amplify the Ph.D.-12 Library, 20 mL of autoclaved LB Broth, 200 µL of ER2738
overnight culture and 10 µL of Ph.D.-12 library were added to a 250 mL flask and shaken
for 4.5 hours at 250 rpm and 37°C. The contents of the flask were then transferred to a
50 mL centrifuge tube and spun for ten minutes at 10,000 rpm at 4°C. The supernatant
was then poured off into a new 50 mL centrifuge tube. Residual supernatant was also
transferred to the new centrifuge tube via pipetman. The supernatant was spun for three
minutes at 10,000 rpm at 4°C. The top 16 mL of supernatant was transferred from the
second centrifuge tube to a new centrifuge tube. Then, 2.7 mL of PEG/NaCl was added
and the centrifuge tube was put on ice for a minimum of one hour and a maximum of two
hours. The cold centrifuge tube was then spun for ten minutes at 10,000 rpm at 4°C. The
supernatant was removed as waste. The cold centrifuge tube was then respun briefly at
15
10,000 rpm at 4°C. Again, the supernatant was removed as waste. The pellet in the cold
centrifuge tube was resuspended in 1 mL TBS and transferred to a microcentrifuge tube.
This tube was spun for five minutes at 10,000 rpm at 4°C. The supernatant was
transferred to a new microcentrifuge tube. In the new microcentrifuge tube, 170 µL
PEG/NaCl was added to the supernatant. This tube was placed on ice for fifteen to
twenty minutes and centrifuged for ten minutes at 10,000 rpm at 4°C. The supernatant
was removed as waste. The cold microcentrifuge tube was respun briefly at 10,000 rpm
at 4°C. Again, the supernatant was removed as waste. The pellet was resuspended in
200 µL TBS and the microcentrifuge tube was centrifuged for 1 minute. The supernatant
was transferred to a new microcentrifuge tube. The resulting solution was the amplified
phage.
3.3.2 Titer of Amplified Phage
Amplified phage were titered to confirm success of amplification and to determine the
concentration of phage. Amplified phage were diluted by factors of 109
, 1010
, and 1011
.
This was done by taking 1 µL of the most recently amplified phage and adding 999 µL of
autoclaved LB Broth to a fresh microcentrifuge tube and then mixing via pipetman. This
gave a 103
dilution. This process was repeated to dilute phage to a factor of 109
. Next, a
dilution by a factor of 101
was prepared by transferring 10 µL of the 109
dilution to a fresh
microcentrifuge tube and adding 900 µL of autoclaved LB Broth and then mixing via
pipetman to achieve a dilution of 1010
phage. This process was repeated to dilute phage to
a dilution of 1011
. Mixing was performed by sucking up the solution and then returning it
16
to the microcentrifuge tube. This was repeated several times. Agarose top was then
heated in the microwave for approximately two minutes at 80% power until it was
entirely liquid. Three autoclaved tubes were placed in the dri-bath at 45°C and 3 mL of
agarose top were then transferred to each tube. These tubes were kept in the dri-bath
until phage were ready to be plated. Dilutions of 109
, 1010
, and 1011
were added to new
microcentrifuge tubes in aliquots of 10 µL, one dilution per tube. To each dilution, 200
µL of ER2738 day culture were added and phage were allowed to infect cells for five
minutes before being plated. A P200 was set to 215 µL and all the contents of the
microcentrifuge tube were sucked up and transferred to a tube of agarose top. After
transfer, the tube was immediately spun on the Vortex Genie and then the solution was
spread on a IPTG/X-gal plate, starting at the center of the plate and spreading outwards
until the entire plate was covered. This was done for each of the dilutions. The plates
were allowed to sit until the agarose top hardened and then they were transferred to the
37°C incubator to sit overnight, with the agarose plate on top and the empty plate below.
The following day, the number of blue plaques on each plate were counted and recorded.
3.3.3 Plaque Pick of Round Three Amplified Phage
Diluted culture was prepared by combining 300 µL of ER2738 overnight culture and 30
mL of autoclaved LB Broth in a beaker. There was one tube prepared for each of the 24
plaques to be picked; to prepare the culture tubes 1 mL of diluted culture was transferred
to each culture tube. A sterile pipet tip was used to stab one blue plaque and then transfer
the single plaque to a culture tube. The plaque was released into the culture tube by
17
pipeting up and down rapidly several times. Plaques that were chosen were well spaced
from plates where there were fewer than 100 plaques per plate. The culture tubes were
incubated for 4.5 hours at 250 rpm and 37°C. Each culture was then transferred to a
microcentrifuge tube, labeled A, and centrifuged for 30 seconds at 10,000 rpm at 4°C.
The top 500 µL of supernatant was then transferred to a new microcentrifuge tube,
labeled B. The A centrifuge tubes were labeled and refrigerated. Then, an aliquot of 200
µL PEG/NaCl was added to each B microcentrifuge tube and the tubes were inverted
immediately. Once the PEG/NaCl had been added to every microcentrifuge tube the
tubes were again inverted, beginning with the first microcentrifuge tube. The
microcentrifuge tube were allowed to sit at room temperature for ten minutes. The
microcentrifuge tubes were then centrifuged for 10 minutes at 10,000 rpm at 4°C. The
supernatant was discarded as waste. The microcentrifuge tube was respun briefly at
10,000 rpm at 4°C. Again, the supernatant was removed as waste. The pellets were
stored at -20 °C overnight. The pellets were then suspended in 100 µL of iodide buffer
and 250 µL of ethanol was added. The microcentrifuge tubes were incubated for exactly
10 minutes. The microcentrifuge tubes were then centrifuged for 10 minutes at 10,000
rpm and 4°C. The supernatant was discarded and the pellets were washed with 70%
ethanol. To wash the pellets, 250 µL of 70% ethanol was added to the microcentrifuge
tube, spun for 1 minute and then poured out. Residual ethanol was allowed to evaporate
into the air. Once the residual ethanol had evaporated, the pellets were then suspended in
30 µL of TE Buffer and refrigerated. A gel was run and DNA was observed for almost
all samples. There are no visible results available because the gel visualizing software
18
was not operating properly when the electrophoresis was performed. The DNA was
sequenced by NEB.
3.3.4 Deviations from Standard Procedure
During Amplification 2 Round 2 and Round 3 only 15 mL of supernatant was transferred
from the second centrifuge tube to the cold centrifuge tube. Due to the low
concentrations of plaques from Amplification II Round II titer plates, the 108
dilution was
included in the titering of Amplification II Round III. The Amplification 2 Round 3 titer
was repeated so that a plaque pick could be performed. The plaque pick of Amplification
2 Round 3 experienced a deviation during the washing of the pellets. The 250 µL of 70%
ethanol was immediately poured out once it was added to the microcentrifuge tube rather
than spun and then poured. In both instances the residual ethanol was allowed to
evaporate overnight.
19
IV. RESULTS AND DISCUSSION
4.1 Serial Amplification of the New England Biolabs Ph.D.-12 library
To search for new mutant clones, serial amplification experiments were performed to
select for the fast propagating phenotype. Since there were no selection mechanisms
(i.e., no exposure to target) favoring a phage with a unique displayed peptide, the fastest
propagating phage should be present in greater concentrations, which increases the
chances of randomly selecting fast mutant clones for sequencing. There were two
experiments performed, referred to as Serial Amplifications 1 and 2. For both
experiments phage were amplified three times and then titered. Plaques were selected
from the titer plates and then sent for sequencing. Between each round of amplification,
titers were performed to ensure that the library had been amplified successfully.
20
Round Dilution Plaque Count Sample Concentration (pfu/µL)
1 109
32 3.2×10⁹
1010
2 2.0×10⁹
1011
0 0.0
2 109
13 1.3×10⁹
1010
0 0.0
1011
0 0.0
3 108
90 9.0×10⁸
109
13 1.3×10⁹
1010
0 0.0
Round Average Plaque Count (pfu/µL)
1 2.6×10⁹
2 1.3×10⁹
3 1.1×10⁹
Table 1: Three rounds of Serial Amplification 1 of the Ph. D.-12 library. The sample
concentrations were found by multiplying the number of plaques counted by the dilution
number. This is then divided by ten to account for the 10 µL of solution that were plated.
For example, the sample concentration of Serial Amplification 1 round 1 dilution 9 is
(32 pfu×109
)/10µL=3.2×109
pfu/µL.
Round Dilution Plaque Count Sample Concentration (pfu/µL)
1 109
3 3.0×10⁸
1010
0 0.0
1011
0 0.0
2 109
30 3.0×10⁹
1010
2 2.0×10⁹
1011
0 0.0
3 108
165 1.7×10⁹
109
17 1.7×10⁹
1010
1 1.0×10⁹
Round Average Plaque Count (pfu/µL)
1 3.0×10⁸
2 2.5×10⁹
3 1.5×10⁹
Table 2: Three rounds of Serial Amplification 2 of the Ph. D.-12 library.
21
Twelve plaques were randomly selected from each of the round three serial
amplifications 1 and 2. The DNA of each of the plaques was isolated and checked on a
1% agarose gel (data is not available since the gel visualizing software was out of order).
Since most of the isolated DNA was observed on the gel, all the DNA was sent to be
sequenced at New England Biolabs. Each of the plaques has readily identifiable DNA
due to the peptide at 5’ end of gene III, which was sequenced (Figure 6).
Sample DNA sequence (amino acid sequence shown below codons)
1 ACTCT AAG ANG AAT GCG GAG CAT GCT ACT ACG CAT ATT ACG GGTGGA
K ? N A E H A T T H I T
2 ACTCT CAG CNG NCT TCT AAT TTG TCT TAT CCG GCG CAT GAG GGTGGA
P ? ? S N L S Y P A H E
3 ACTCT NCG CNT NNT NRG NCT NNT CGG TCG AAG TNT ANG CNN GGNGGN
? ? ? ? ? ? R S K ? ? ?
4 ACTCT GAT GTT CCG AAT AAG ACG CAG TTT GCT CGT TTT CCT GGTGGN
N V P N K T Q F A R F P
5 ACTCT GGT GTT ACG TAG GCG GCG GGG GCT CCT TTG TGG GGT GGTGGA
G V T - A A G A P L W G
6 ACTCT CTT CCG CCG ATT CAT TAT AAT CGG TCG CCG CCT CCG GGTGGA
G P P I H Y N R S P P P
7 ACTCT GGG TTT ACT ATG GAG CAG CGG ACG ACG TTT CTG CAT GGTGGA
G F T M E Q R T T F L H
8 ACTCT TCT CCT CCG TTG CTG TTG TTT GGT GCT CTG ACG CGG GGTGGA
S P P L L L F G A L T R
9 ACTCT ATT GCT AAG CCG ACT GCT GTG CCT CCT TCG GAT CAT GGTGGA
I A K P T A V P P S D H
10 ACTCT GTT GAG AAG TAT TCT AGT ATG GAT TAT CCG CCG AGG GGTGGA
V E K Y S S M D Y P P R
11 AAT CAG GCG GCT TCT ATT ACT AAG CGT GTT CCG TAT GGTGGA
N Q A A S I T N R V P Y
12 ACTCT GAT GNG NCT ACG AAT TCG TGG AAT GTT CCG AAG CCT GGTGGA
D ? ? T N S S N V P K P
13 ACTCT TAN CCT ANA CAG ACT AGT AAG GAT GGT AGT CTT NGG GGNNGA
Y P ? Q T S K D G S L ?
14 ACTCT TTT GNG GTT CCG GAT AGT TCG TTG TCG AGT ACT CGG GGTGGN
F V P D S S L S S L T R
15 ACTCT GGT GNG TGG CAT GCG ACT ACG CAT CCG GCT GAG TCG GGTGGA
G ? W H A T S H P A E S
16 ACTCT GGG ACT TTG TGT CTT GCG CAT CGT CCG TGT CAG AAT GGNGGA
G T L C L A H R P C Q N
17 ACTCT GAG CAT ACG CTT GGT TAT CGT CTT GAG CGG CCG CTG GGTGGA
E H T L G Y R L E R P L
18 ACTCT GCG AGT CTT AAT AAT ATG ATG GCG CCT CTG CTT CCG GGTGGA
A S L N N M M A P L L P
22
19 ACTCT TAT CCG CCT CGT GCG TGG GAT ACG CCG CAT CCT CAT GGTGGA
Y P P R A W D T P H P H
20 ACTC GGCCGAAACTGTTGAAAGTTG
21 ACTCT TTT CAT TTT GAT CTT CAT CAG AAG AAT CCT TAT CAG GGTGGN
F H F D L H Q K N P Y Q
22 ACTCT CAT AAT CCT ATG TCT CGT TTG CAT ATG AAT TAT TCT GGTGGA
H N P M S R L H M N Y S
23 ACTCT AAG CCG CCT CCT CAG ACT CCG CAG GCG CTT GAG GGG GGTGGA
K P P P Q T P Q A L E G
24 ACTCT TCT GCT CAG GAT TCT GGG TTT GTT CCG TTT ACG CCG GGTGGA
S A Q D S G F V P F T P
25 ACTCT GAT TCG GTT GAG ATG GCT CCG CAT ACT CGG CAG CAT GGTGGA
D S V E M A P H T R Q H
26 ACTCT AAT GCT CAT CAG TCT CAT AGG CTG CAT ACT CAT CTG GGTGGA
N A H Q S H R L H T H L
27 ACTCT AAT GCT CAT CAG TCT CAT AGG CTG CAT ACT CAT CTG GGTGGA
N A H Q S H R L H T H P
28 ACTCT CTT CCT AGT GCG AAG CTG CCT CCG GGT CCT CCG AAG GGTGGA
L P S A K L P P G P P K
29 ACTCT TCT ATT CCT CCT TCT CGG GAT CAG CCT TCG CAT AAG GGTGGA
S I P P S R D Q P S H K
30 ACTCT GAT AAT GCG AAT TCT AGT ATT CGG TCG CAG ACG TAT GGTGGA
D N A N S S I R S Q T Y
31 ACTCT GAT CCG CTT ACT TAT GCT ATG ACG CGT ACT ATT AAG GGTGGA
D P L T Y A M T R T I K
32 ACTCT TAT CAG ACG ACG ATT ATT AAT ACG GCT GAT CGT TTT GGTGGA
Y Q T T I I N T A D R F
33 ACTCT ACG ACT TCT CTG GCT AGG CCT CAT TAT TTG AAT GAG GGTGGA
T T S L A R P H Y L N E
34 ACTCT TCT CTT TCG CAT CCG AAT GCG TTT AAT TCT GAG TCT GGTGGA
S L S H P N A F N S E S
35 ACTCT TAT TCG CCG GCT AGT AAG AGT CCT GTT CCT TCG CTG GGTGGA
Y S P A M K S P V P S L
36 ACTCT TGG AGG TTT TCT TCT CCG GAG CAT CTG GCT ATG AAG GGTGGA
W R F S S P E H L A M K
37 ACTCT GAT AGG ATG CTG CTG CCT TTT AAT CTT CTG GCG CTG GGTGGA
D R M L L P F N L L A L
38 ACTCT TCG TTT TTG CAT CCG TCG CGG AGT CTG GGT ATG ACG GGTGGA
S F L H P S R S L G M T
39 ACTCT ATT AGT AGG CCG GCG CCG ATT TCT GTG GAT ATG AAG GGTGGA
I S R P A P I S V D M K
40 ACTCT TCT CAT TCT ACA GCT TCT TCG CAG TGG CGT TTT CCG GGTGGA
S H S T A S S Q W R F P
41 ACTCT GGT CCG AGT GCG TGG TAT CCG ACG GCT TAT TCG AGG GGTGGA
Y S L P R H L V S L P P
42 ACTCT GGT CCG AGT GCG TGG TAT CCG ACG GCT TAT TCG AGG GGTGGA
G P S A W Y P T A Y S R
43 ACTCT ACT ATG TCT CCT AAT CCT ACT TCT AGG CAG CTT CCG GGTGGA
T M S P N P T S R Q L P
44 ACTCT ATG AGG GAG GAT ATT TTG CTG CAT ACG GAT GTG GGG GGTGGA
M R E D I L L H T D V G
45 ACTCT GAT CTG AAT TAT TTT ACG CTG TCT TCT AAG CGG GAG GGTGGA
D L N Y F T L S S K R E
23
46 ACTC GGCCGAAACTGTTGAAAGTTG
47 ACTCT AAT CCT CCG CCT TAT GCT CGT ACT GCG TCT GCT GCG GGTGGA
N P P P Y A R T A S A A
48 ACTCT GCT AAT CAG AGT AAT GCT TAT AAT ACG TTG AAG ATT GGTGGA
A N Q S N A Y N T L K I
Figure 6. Raw DNA data and translated amino acids from plaque picks of round three
serial amplifications 1 and 2. Question marks (?) represent when it was not possible to
translate the raw DNA into amino acids. This generally occurred when the DNA codon
unit N appeared. The codon unit N means that sequencing failed.
The raw DNA sequences were obtained from New England Biolabs and the peptide
sequences were then translated, as shown above. It is unknown whether or not each of
these clones displays the phenotype for faster propagation than the average wild-type
phage since time course titers have not been performed. If multiple phage displaying the
same amino acid sequence were selected in the random selection of plaques, this would
have been a good indication that the phage was fast growing. It is unlikely that multiple
phage displaying the same peptide on protein III would arise unless that phage clone had
an advantage in its propagation ability.
4.2 Time Course Titers of Serial Amplifications
While performing multiple serial amplification experiments increases the chances of
finding fast propagating phage, three rounds of amplification may not be enough to allow
for fast propagating phage to out compete all other phage. When there are no
evolutionary pressures to force phage displaying a unique peptide to take over the
amplification, fast propagating phage will appear at greater percentage than normal
24
propagating phage. This increases the likelihood of finding fast propagating phage in a
random selection of phage culture, but it does not ensure that all, or even any, fast
propagating phage will be selected during viral DNA isolation and sequencing. Many of
the plaques that are selected are phage that grow at average rates and will not display the
desired phenotype.
To increase the likelihood of finding fast propagating phage, and thus mutations in the
Shine-Dalgarno region, a 135-minute screen was performed by Kieu Nguyen. Round 3
of serial amplification 1 (described above) was plated and plaques were removed from
the plate individually. Each plaque was put into 1 mL LB and 10 µL of overnight
culture. These solutions were incubated for 135 minutes and then titered to determine
their concentrations. The results of a titer performed by Nguyen are shown in Table 3.
Plaques are counted at 135 minutes because this is the time at which the faster
propagating clones and normal clones have the most dramatic difference in phage
concentrations. This point in the incubation was utilized to compare relative
concentrations of the selected phage. Assuming that each original plaque contains
approximately the same number of phage, a high concentration of phage at 135 minutes
could indicate one of two things: either the initial concentration of phage was very high
or the phage propagated at an above average rate. There were two phage displaying
peptides that were identified as probable fast propagating phage, samples E and K. Both
samples had more plaques than could be accurately counted for a dilution of 105
.
25
Label
Number of plaques in
dilution of 105
Number of plaques in
dilution of 106
Concentration (pfu/μL)
A 137 18 1.6×10⁶
B 222 23 2.3×10⁶
C 542 79 6.7×10⁶
D 239 20 2.2×10⁶
E 2336 220 2.3×10⁷
F 1536 103 1.3×10⁷
G 49 10 7.5×10⁵
H 1616 146 1.5×10⁷
I 240 25 2.5×10⁶
J 63 2 4.2×10⁵
K 3216 250 2.9×10⁷
L 24 3 2.7×10⁵
Table 3: 135-minute screen by K. Nguyen to select potential fast propagating phage
Partial time course titers were performed on phage with extremely high concentrations
(pfu/µL). Partial time course titers were used to confirm that the phage that had the
highest concentrations were faster propagators than the average phage, and that it was not
just an effect of the screening phage having a large initial amount of phage. Experiments
with samples E and K were performed by Kieu Nguyen and later Heidi Weinreich.
26
Time Course Titer of M13KE and K
0.00
1.00
2.00
3.00
4.00
5.00
6.00
7.00
8.00
9.00
10.00
0 30 60 90 120 150 180 210 240 270 300
Time (minutes)
log(pfu/μL)
M13KE
K
Figure 7. Partial time course titer of M13KE and K by K. Nguyen. The phage referred to
as K displays the desired phenotype. The rate of propagation of K is shown to be much
greater than that of the rate of M13KE, the wild-type phage. 10
27
Figure 8. Partial time course titer of K and E and M13KE by H. Weinreich. E and K are
fast propagators. Their initial rate of growth is much greater than the rate of growth of
the wild-type phage, M13KE.11
The partial time course titer shows that K and E are fast propagating phage since there is
a large difference in the rate of propagation of samples E and K phage compared to the
rate of propagation of the wild-type phage, M13KE. This is confirmed by the fact that
both the initial concentrations and end concentrations are relatively equal whereas there is
a large difference in the concentrations at 135 minutes, where Figure 8 shows that the
concentrations of samples E and K are larger than the concentration of the wild-type
phage, M13KE, by a factor of about 100 (or 2 log units) and Figure 7 shows that the
concentration of sample K is larger than the concentration of the wild-type phage,
28
2
3
4
5
6
7
8
9
10
11
0 50 100 150 200 250 300 350
Time (Minutes)
Lo
g(p
fu/
µL)
M13KE
Sample E
Sample K
M13KE, by a factor of about 100. E and K propagate approximately 100 times faster
than the wild-type phage, M13KE.
Name of Clone Shine Dalgarno MetIleAsp… (CLONE NAME)
…GGGGCTTTTCTGATTATCAACCGGGGTACATATGATTGAC…
Ph-HAIYPRH -----------------------A---------------- (HAIYPRH)
Ph-ANTLRSP -------------------C-------------------- (ANTLRSP)
Ph-LMSTGRD ---A------------------------------------ (LMSTGRD)
Ph-ARPPASP --------C------------------------------- (#10)
Ph-GKPMPPM --T------------------------------------- (#4)
Ph-KDTNIYDQRYSR --T------------------------------------- (E)
Ph-AMSPRMDGKVFA -----Δ---------------------------------- (K)
Figure 9. Summary of Single Base Mutations from both the Ph.D-7 and Ph.D.-12
libraries. The Shine-Dalgarno sequence is overlined and bolded.
When the regions surrounding the gene II Shine-Dalgarno were sequenced for clones of
interest, clones of samples E and K were found to have mutations in the DNA region
which precedes the Shine-Dalgarno region (Figure 9). Figure 9 also shows fast
propagating phage from the Ph.D.-7 library that been found to have mutations. Since the
identification of HAIYPRH as a target unrelated-peptide, several other phage with the
phenotype for fast propagation have been identified.
The explanation for the effect on the rate of propagation of the phage is unknown. In the
HAIYPRH and ANTLRSP clones, it is possible that mutations in the Shine-Dalgarno
region affect ribosomal binding. While HAIYPRH has a better Shine-Dalgarno sequence
(an additional base pair with ribosomal RNA) the mutation in ANTLRSP does not create
a better Shine-Dalgarno sequence. Instead the secondary structure of the mRNA may be
29
affected by the mutations. Changing the folding of the mRNA affects the ability of the
ribosome, pV, to bind to it.
Many of the mutations have been discovered upstream of the Shine-Dalgarno region in
the pV operator sequence. In contrast to the Shine-Dalgarno sequence, where ribosomal
binding occurs, the operator sequence is where pV binds to repress the expression of pII.
Protein II initiates replication by nicking the replicative form of the phage DNA. Since
replication is the slow step of reproduction of phage, increasing the likelihood for DNA
to be nicked may increase the rate of propagation. If pV can no longer bind as well to the
operator sequence due to a mutation, then repression is decreased and translation of gene
II is enhanced. This would increase the production of pII, relative to a phage without the
mutation, and the increased rate of replication allows for a greater rate of propagation.
30
V. CONCLUSIONS
Much more work needs to be done before any conclusions can be drawn from this
research. Experiments with the library should be continued to try to find both new and
repeated mutations. New clones with mutations in the operator sequence may be selected
with the phenotype for fast propagation. Also, the occurrence of the Shine-Dalgarno
mutations, like the HAIYPRH and ANTLRSP clones, cannot predict the overall effect of
mutations on secondary structure but it may be possible to determine whether these
mutations affect the binding of ribosome. If pII production increases while pV binding
remains consistent it would suggest that ribosomal binding has a direct effect on gene II
expression. This may be caused by changes in the secondary structure. Computer
modeling will be utilized to predict changes in the secondary structure due to mutations
so that the effects of the binding of pV and ribosome may be decoupled. It will also help
to design new mutations to observe how mRNA affects the translation of gene II.
31
VI. LITERATURE CITED
1. Ptashne, M. A Genetic Switch; Phage and Higher Organisms, 2nd
ed.; Cell Press and
Blackwell Scientific Publications: Cambridge, MA, 1992.
2. Burton, D.R.; Scott, J.K.;Silverman, G.J. (Eds.). Phage Display: A Laboratory
Manual, ed. Barbas, C.; Cold Spring Harbor Laboratory Press, 2001.
3. Nakamura, M.; Tsumoto, K.; Kumagai, I.; Ishimura, K. A Morphologic Study of
Filamentous Phage Infection of Escherichia coli using biotinylated Phages. FEBS Letters
536 (2003) 167-172.4.
4. Stassen, A.P.M.; Folmer, R.H.A.; Hilbers, C.W.; Konings, R.N.H. Single-stranded
DNA Binding Protein Encoded by the Filamentous Bacteriophage M13: Structural and
Functional Characteristics. Molecular Biology Reports 20:109-127, 1995.
5. Smith, G.P; Petrenko, V.A. Phage Display, Chem Rev 97,391-410, 1997.
6. Ph.D.-12 Phage Display Peptide Library Kit Manual, New England Biolabs, Ipswich,
MA.
7. Menendez, A.; Scott, J. The nature of target-unrelated peptides recovered in the
screening of phage-displayed random peptide libraries with antibodies. Anal. Biochem.
336, 145-157, 2005.
8. Brammer, L.A.; Bolduc, B.; Kass, J.L.; Felice, K.M.; Noren, C.J.; Hall, M.F. A Target-
Unrelated Peptide in an M13 Phage Display Library Traced to an Advantageous Mutation
in the Gene II Ribosome-Binding Site. Anal. Biochem 373: 88-98, 2008.
9. Personal communications with Dr. Beth Paschal, Ph.D.-12 product manager at NEB.
10. Nguyen, K., Identifying Fast-Propagating M13 Bacteriophage from Ph.D.-7 Phage
Displayed Library, STEP Report, 2009.
11. Weinreich, H., Senior Thesis, 2010.
32

MLH Sr. Thesis, March 2010.

  • 1.
    Identifying Fast-Propagating M13KEBacteriophage from the New England Biolabs Ph.D.-12 Phage Displayed Peptide Library BY MICHELLE HOULE SENIOR THESIS CHEMISTRY 2010
  • 2.
    Identifying Fast-Propagating M13KEBacteriophage from the New England Biolabs Ph.D.-12 Phage Displayed Peptide Library by Michelle L. Houle SENIOR THESIS Submitted to Stonehill College in Partial Fulfillment of the Requirements for the Degree of Bachelor of Science in Chemistry May 2010 ii
  • 3.
    This thesis hasbeen examined and approved. ________________________________________________ Marilena F. Hall, Ph.D. Thesis Advisor Associate Professor of Chemistry Stonehill College ________________________________________________ Maria Curtin, Ph.D. Professor of Chemistry Stonehill College ________________________________________________ Magdalena James-Pederson, Ph. D. Assistant Professor of Chemistry Stonehill College iii
  • 4.
    TABLE OF CONTENTS DEDICATIONv ACKNOWLEDGEMENTS vi I. ABSTRACT 1 II. INTRODUCTION 2 2.1 Bacteriophage 2 2.2 Peptide Phage-Displayed Libraries 5 2.3 A Target-Unrelated Peptide in the Ph.D.-7 Library 7 2.4 Exploring the Ph.D.-12 Library for Target-Unrelated Peptides 11 III. MATERIALS AND METHODS 13 3.1 Overview 13 3.2 Materials 13 3.3 Methods 15 3.3.1 Amplification of New England Biolabs’ Ph.D.-12 Library 15 3.3.2 Titer of Amplified Phage 16 3.3.3 Plaque Pick of Round Three Amplified Phage 17 3.3.4 Deviations from Standard Procedure 19 IV. RESULTS AND DISCUSSION 20 4.1 Serial Amplification of the New England Biolabs’ Ph.D.-12 library 20 4.2 Time Course Titers of Serial Amplifications 24 V. CONCLUSIONS 31 VI. LITERATURE CITED 32 iv
  • 5.
    DEDICATION I would liketo dedicate this thesis to my father, who has continually supported my education in multiple ways. He recently told me that when I was learning how to read, being read to by me was a painful experience. Hopefully reading this paper will not prove to be such a painful task. v
  • 6.
    ACKNOWLEDGEMENTS I would liketo acknowledge the contributions of Stonehill College towards the completion of this thesis, as well as the Research Corporation for funding. In addition, I would like to thank Kieu Nguyen and Heidi Weinreich for their aid with research and Evan Tallmadge for reading many, many drafts. I would also like to thank our primary collaborator, Dr. Christopher Noren at New England Biolabs. Without his material support and knowledge of molecular biology this project would not have been possible. Above all else, I would like to thank my research advisor, Professor Marilena Hall. Professor Hall is an inspirational woman who handles the laboratory and life with apparent ease. She has shown extreme patience in correcting my disjointed drafts and has shared her knowledge with great generosity. vi
  • 7.
    I. ABSTRACT The commerciallyavailable Ph.D.-12 phage-displayed dodecapeptide library was explored in the search for phage with the phenotype for a rate of propagation greater than the average rate of propagation of the library. This was done as an extension of the work performed with the Ph.D.-7 library from New England Biolabs, which presented the target-unrelated peptide, HAIYPRH. The Ph.D.-12 library was serially amplified (3 times) to allow fast propagating phage to enrich their concentrations relative to normal phage. A sampling of 48 phage clones were isolated from the amplified library and identified by sequencing the DNA corresponding to the displayed peptide. While none of the clones that were sequenced appeared more than once, the sequences will be kept as part of a compilation project. The amplified phage solutions were later analyzed in the search for clones having the phenotype of fast propagation. Two phage clones were selected as fast propagators and time course titers were performed to confirm their propagation rates. Both phage were shown to have mutations preceding the Shine- Dalgarno region of gene II of the M13 bacteriophage. 1
  • 8.
    II. INTRODUCTION 2.1 Bacteriophage AndreLwoff irradiated Escherichia coli (E. coli) with UV light in the 1940s and found that the bacteria stopped growing only to burst, letting out a second biomaterial into the culture medium. 1 This biomaterial was referred to as bacteriophage. Since Lwoff, it has been determined that bacteriophage are viruses that infect cells and are often referred to as phage. In Lwoff’s studies, they referred to the bacteriophage as lambda, λ. Another type of phage able to infect E. coli are filamentous phage, which are commonly used by researchers to study the interactions between phage and bacteria.2 Filamentous phage are phage whose protein capsid is long and extremely thin, making the phage appear like a filament under SEM inspection. M13 is a filamentous bacteriophage which is a nonlytic, single-stranded DNA virus that consists of 11 proteins, whose life cycle is shown in Figure 1. To have a nonlytic cycle refers to a cycle in which the bacteriophage propagate within the bacteria and are released without killing the bacteria. The life cycle begins when E. coli binds to protein III (pIII) of the phage by the tip of the F pilus.2 The tip receives a phage attachment which allows 2
  • 9.
    for the displacementof a pIII domain. The immediate steps following displacement of the domain are unknown and the next known step is after phage infection has been completed and the viral (+) strand of DNA has been formed. The complementary (-) strand is formed and a double stranded DNA is produced. The final product is the parental replicative form (RF) which is used transcription. The (+) strand is then nicked by pII, forming a 3’-hydroxyl which acts as a primer so that polymerase may begin synthesizing a new strand of DNA. As a result of round one replication a new (+) strand was formed and the original (+) strand that was displaced so that the first replication could be made forms a supercoiled double-stranded progeny that can direct the synthesis of the phage proteins. The mRNA is translated into all of the phage proteins and replication occurs to synthesize new viral strands. The single stranded (+) DNA that are synthesized are coated by pV until a critical concentration of pV is reached. After the critical concentration is reached, single stranded (+) viral DNA is replicated almost exclusively as packaging occurs and pV represses the expression of gene II. As synthesis of the proteins occurs, the proteins are inserted into the cell membrane, with the exception of pII, pX and pV, which remain in the cytoplasm. After the synthesis of the proteins, the DNA of the phage is then injected from the cell membrane of the host cell into the periplasmic space and then into the cytoplasm.2, 3 The coat proteins are synthesized in the cell and attached to the genome as the genome is excreted from the cell. The virus is secreted from the cell without killing the host cell through a mechanism similar to the insertion of the phage genome. 3
  • 10.
    Figure 1. M13lifecycle within the bacteria4 Figure 2. Mature M13 bacteriophage. Proteins not represented in this diagram, including protein II, while not present in the mature phage are involved in replication. Figure prepared by Evan Tallmadge ’10. 4
  • 11.
    2.2 Peptide Phage-DisplayedLibraries In nature, there are biological macromolecules with specific binding locations. Examples of these types of biomolecules include enzymes, hormone receptors, and antibodies.5 When studying binding mechanisms to understand interactions between macromolecules, researchers try to imitate a target binding site and possibly any specific conditions that are necessary for binding. Conditions are varied to determine which set of conditions results in strong specific binding and which conditions result in weak or non-specific binding. Generally, if the proper conditions and substrates are presented, the macromolecule will bind to the substrate that has been presented. Often when researchers are looking for macromolecules that bind to a specific substrate, they will use a technique called phage display.5 A peptide phage display library contains randomized sequences of amino acids expressed on the N-terminus of a coat protein, for example pIII in M13 bacteriophage. This results in five copies of the randomized peptide displayed per phage virion (shown in left side of Figure 2). These peptides are exposed to a target allowing those with affinity for the target to bind in a process called panning. Peptides that bind are allowed to propagate, a process known as amplification. The likelihood of randomly selecting a peptide multiple times after panning is extremely small unless it has taken over the culture. The library is made by inserting a randomized section of DNA just after the start codon of gene III. This randomized sequence codes 5
  • 12.
    for every possiblecombination of amino acids, resulting in a complete library of peptides attached to protein III. New England Biolabs (NEB) produces several phage display libraries with various lengths, including the seven randomized amino acid, Ph.D.-7, library and the twelve randomized amino acid, Ph.D.-12, library. These libraries are constructed in M13KE, which is a M13 varient with the LacZα gene inserted into its genome and cloning sites embedded in the intergenic region near origin of replication.6 The E. coli bacteria serves as host for the replication of bacteriophage. An infected host cell experiences a decrease in rate of replication but it continues to grow and divide as the phage is released. Due to the decreased rate of growth of infected cells, when phage are placed on an E. coli lawn, regions of low bacterial density, called plaques, form where the E. coli is infected with M13KE.1 The plaques are blue because the LacZα gene of the M13KE genome produces β-galactosidase. β-galactosidase metabolizes the X-gal in the media, producing a blue precipitate. There are several purposes for using phage display to find specific peptides that bind to small molecules. These include the determination of the optimal enzyme active site or the design of antibodies. When using a phage-displayed random peptide library, most of the phage clones in the library do not bind to anything and are “nonbinding phage”. Sometimes when searching for the peptide that best binds to a target, there are peptides that appear to bind for unknown reasons. While there are many possible situations, this may be the result of the peptide binding to the plate on which the target is held stationary, 6
  • 13.
    other times itis due to the peptide binding to other phage.7 These peptides have been termed target-unrelated peptides. Menendez and Scott define them most specifically as peptides that have been selected for their affinity of a component within the system that is not the target.7 2.3 A Target-Unrelated Peptide in the Ph.D.-7 Library In panning experiments using the Ph.D.-7 library for zinc binding heptamers, phage displaying the HAIYPRH peptide appeared. This peptide had also appeared in other laboratories and there were questions about why this phage was being selected.8 It did not have the characteristics of a peptide with theoretically good binding to zinc. Typical zinc-binding peptides had four or five histidine residues whereas HAIYPRH only has two. Then, when HAIYPRH appeared in multiple separate panning trials under varied conditions, the phage clone displaying HAIYPRH was studied to determine why it appeared so often. It was discovered that the peptide did not bind the zinc,8 meaning it was not a target unrelated peptide of the type described by Menedez and Scott.7 Therefore, the HAIYPRH phage itself was studied to determine what was causing the phage to appear at such a high rate in panning experiments. Comparisons of HAIYPRH and the M13KE library showed that HAIYPRH had a faster rate of propagation than the average phage in the Ph.D.-7 NEB library. 8 7
  • 14.
    A time coursetiter experiment (TCT) was performed to study the rates of propagation. A TCT is when phage is allowed to propagate in cells and samples are taken at given time intervals and plated to determine the concentration of phage at each time point. The greater initial rate of propagation, displayed as a high concentration of phage through the middle period of the TCT (~120-150 minutes), for the HAIYPRH sample compared to the library confirmed that that phage displaying the HAIYPRH peptide propagated faster than the normal library. Early in the titer and the final period of the titer, both the titer for the HAIYPRH and for the library show relatively similar concentrations of phage. This solidified the conclusion that the phage displaying HAIYPRH must propagate at a rate that is faster than that of the library, reaching the maximum concentration of phage in solution in much less time. (Figure 3) 8
  • 15.
    1 2 3 4 5 6 7 8 9 10 0 30 6090 120 150 180 210 240 270 300 TIME (MINUTES) LOG(pfu/µL) Ph-HAIYPRH Ph.D.-7 Library Figure 3. Rate of propagation of phage displaying HAIYPRH compared to mixture of phage in Ph.D.-7 library; concentration of phage shown in plaque forming units per microliter (pfu/μL).8 In the course of studying why this phage had a much higher rate of propagation than the other clones, the DNA was sequenced. It was discovered that the phage displaying HAIYPRH had a G → A mutation in the gene II Shine-Dalgarno region. When a M13KE phage without the HAIYPRH peptide was engineered with this mutation, it propagated at the same rate as HAIYPRH, confirming that it was the gene II Shine- Dalgarno mutation that caused an observable increase in rate of propagation.8 This mutation increased the base pair alignment in the Shine-Dalgarno region, making it a better complement to the ribosomal RNA. It is possible that increasing the number of base pairs enhanced the expression of pII, which is necessary for phage genome 9
  • 16.
    replication. Since ithad previously been confirmed that HAIYPRH was not a target unrelated peptide of the type described by Menendez and Scott,7 it was possible that a faster rate of propagation was the reason why HAIYPRH had been selected during panning experiments. 8 As Figure 4 shows, the mutation increased the rate of propagation while the displayed peptide, HAIYPRH, did not impact the rate if it was displayed on the phage. During the panning experiments, amplification was performed between rounds so that the phage with the Shine-Dalgarno mutation enriched their concentration relative to the other clones. While HAIYPRH had little or no affinity for the target, making it a target-unrelated peptide, its high concentration allowed it to be selected with phage displaying peptides that had much greater affinity for the target. 10
  • 17.
    2 3 4 5 6 7 8 9 10 0 30 6090 120 150 180 210 240 270 300 TIME (MINUTES) LOG(pfu/µL) Ph-HAIYPRH Mut-NoPeptide WT-HAIYPRH M13KE Figure 4. Time course for amplification of phage variants where phage concentrations were determined using qPCR. The qPCR determined the concentration of viral DNA of three separate cultures for each type of phage. The phage studied were normal phage displaying HAIYPRH (Ph-HAIYPRH), phage with the Shine-Dalgarno G→A mutation with no displayed peptide (Mut-NoPeptide), phage displaying HAIYPRH with no mutation (WT-HAIYPRH) and normal M13KE phage from the NEB Ph.D.-7 library (M13KE).8 2.4 Exploring the Ph.D.-12 Library for Target-Unrelated Peptides The Ph.D.-12 library from New England Biolabs was chosen as the next step in the search for gene II Shine-Dalgarno mutants like HAIYRPH. It was hypothesized that if there was a mutation in the Shine-Dalgarno region of the phage in one of the peptide displaying phage in the Ph.D.-7 library, there could be another phage that naturally displayed the same mutation, or a similar mutation, and displayed the phenotype of faster propagation. Another reason this library was chosen is the report of possible target- 11
  • 18.
    unrelated peptides and/orpeptides with an especially high rate of occurrence.9 These reported peptides are listed in Figure 5. APWHLSSQYSRT IDTFYMSTMSHS ALTLHPQPLDHP SVSVGMKPSPRP HSNWRVPSPWQL AHRHPISFLSTL ATWSHHLSSAGL Figure 5. Potential target-unrelated peptides in the Ph.D.-12 library that were reported by researchers to the Ph.D.-12 product manager at New England Biolabs. The NEB Ph.D.-12 library was serially amplified to search for phage with the phenotype for fast propagation. Serial amplification may be considered “targetless panning” in which the library is amplified three times without being exposed to a target. This was done to enrich the concentrations of phage with faster rates of propagation compared to the library. The phage clones selected at the completion of the experiment were isolated and identified by sequencing the DNA corresponding to the displayed peptide. If a fast growing phage is present in the amplification, it should have propagated more rapidly than the rest of the phage, and so its peptide should occur at a higher frequency in a random selection from the library. Due to the immense number of unique clones, it was expected that only fast growing phage would show up more than once in a random selection of the library. 12
  • 19.
    III. MATERIALS ANDMETHODS 3.1 Overview The New England Biolab Ph.D.-12 library was amplified serially three times. After each round of amplification the phage was titered to confirm that the propagation of phage occurred during each round of amplification. After the third round of amplification and titering were completed, a plaque pick was performed so that the DNA of the phage could be sequenced by New England Biolabs. The amplified phage were later analyzed to determine if any of the sequences propagated faster than average. This research was performed by Kieu Nguyen ‘12 and Heidi Weinreich ‘10. 3.2 Materials LB Broth LB broth (Miller, 12.5 g) was added to 500 mL of deionized water. This solution was either distributed to culture tubes in 5 mL portions or left in a 1 L bottle. The LB broth was autoclaved. The solution was then stored at room temperature. Plates LB Agar (20 g) was added to 500 mL deionized water. This solution was mixed, autoclaved, and let cool to 60 °C. For LIX plates, 500 µL IPTG (40 mg/mL) and X-gal 13
  • 20.
    (50 mg/mL) stocksolution was added. For LB/tet plates, 500 µL of tetracycline (50 mg/mL) were added. This solution was poured into individual plates and allowed to cool. These plates, once hardened, were stored at 4 °C. Streak Plate A small sample of ER2738 E. coli cells (NEB) stored in glycerol at -80°C was extracted using a sterile inoculating loop. The loop was then dragged across the surface of a LB/Tet plate in a cross hatch pattern to spread the sample. The plate was incubated in a 37 °C incubator; the cells were returned to the freezer and the inoculating loop was re-sterilized. To prevent contamination the plate was sealed by wrapping the edges of the plate with parafilm the following morning and the plate was wrapped in aluminum foil to slow decay of tetracyclin by light. The wrapped plate was stored at 4 °C in the refrigerator and was used as needed. Overnight Culture A colony of E. coli was scraped from the streak plate and mixed with 5 mL of LB Broth and 5 μL 40 mg/mL Tetrycylin (Tet). The culture was shaken overnight at 250 rpm and at 37 °C. TE Buffer Tris base (1.21 g) was added to 29.2 g of EDTA and the pH of the solution was adjusted to 8.5 with 3 M HCl. The total volume of the solution was adjusted to 1 L with deionized water. TBS (Tris Buffered Saline) To a total volume of 1 L of deionized water, 6.06 g of Tris base and 8.76 g sodium chloride were added and the pH was adjusted to 7.6 using HCl. Agarose Top LB broth (12.5 g), 3.5 g agarose, and 500 mg MgCl2 dissolved in 500 mL deionized water. This solution was separated into 200 mL bottles in aliquots of approximately 60 mL each, autoclaved and allowed to solidify. 14
  • 21.
    PEG/NaCl Polyethylene glycol-8000(20 g) and 14.61 g of NaCl were dissolved to a final volume of 100 mL deionized water. Iodide Buffer TE buffer (500 μL) at pH 8.0, 500 μL 0.1 M EDTA, and 29.98 g sodium iodide were mixed then added water so that the total volume of solution was 50 mL. 70% Ethanol Absolute ethanol (70 mL) were added to 30 mL deionized water. 10X Tris/Borate/EDTA (TBE) 107.8 g of Tris base, 5.4 g of EDTA, and 55.0 g of boric acid diluted to 1 L. 1X TBE 100 mL of the 10X TBE stock was diluted with deionized water to 1 L. 3.3 Methods 3.3.1 Amplification of New England Biolab’s Ph.D.-12 Library To amplify the Ph.D.-12 Library, 20 mL of autoclaved LB Broth, 200 µL of ER2738 overnight culture and 10 µL of Ph.D.-12 library were added to a 250 mL flask and shaken for 4.5 hours at 250 rpm and 37°C. The contents of the flask were then transferred to a 50 mL centrifuge tube and spun for ten minutes at 10,000 rpm at 4°C. The supernatant was then poured off into a new 50 mL centrifuge tube. Residual supernatant was also transferred to the new centrifuge tube via pipetman. The supernatant was spun for three minutes at 10,000 rpm at 4°C. The top 16 mL of supernatant was transferred from the second centrifuge tube to a new centrifuge tube. Then, 2.7 mL of PEG/NaCl was added and the centrifuge tube was put on ice for a minimum of one hour and a maximum of two hours. The cold centrifuge tube was then spun for ten minutes at 10,000 rpm at 4°C. The supernatant was removed as waste. The cold centrifuge tube was then respun briefly at 15
  • 22.
    10,000 rpm at4°C. Again, the supernatant was removed as waste. The pellet in the cold centrifuge tube was resuspended in 1 mL TBS and transferred to a microcentrifuge tube. This tube was spun for five minutes at 10,000 rpm at 4°C. The supernatant was transferred to a new microcentrifuge tube. In the new microcentrifuge tube, 170 µL PEG/NaCl was added to the supernatant. This tube was placed on ice for fifteen to twenty minutes and centrifuged for ten minutes at 10,000 rpm at 4°C. The supernatant was removed as waste. The cold microcentrifuge tube was respun briefly at 10,000 rpm at 4°C. Again, the supernatant was removed as waste. The pellet was resuspended in 200 µL TBS and the microcentrifuge tube was centrifuged for 1 minute. The supernatant was transferred to a new microcentrifuge tube. The resulting solution was the amplified phage. 3.3.2 Titer of Amplified Phage Amplified phage were titered to confirm success of amplification and to determine the concentration of phage. Amplified phage were diluted by factors of 109 , 1010 , and 1011 . This was done by taking 1 µL of the most recently amplified phage and adding 999 µL of autoclaved LB Broth to a fresh microcentrifuge tube and then mixing via pipetman. This gave a 103 dilution. This process was repeated to dilute phage to a factor of 109 . Next, a dilution by a factor of 101 was prepared by transferring 10 µL of the 109 dilution to a fresh microcentrifuge tube and adding 900 µL of autoclaved LB Broth and then mixing via pipetman to achieve a dilution of 1010 phage. This process was repeated to dilute phage to a dilution of 1011 . Mixing was performed by sucking up the solution and then returning it 16
  • 23.
    to the microcentrifugetube. This was repeated several times. Agarose top was then heated in the microwave for approximately two minutes at 80% power until it was entirely liquid. Three autoclaved tubes were placed in the dri-bath at 45°C and 3 mL of agarose top were then transferred to each tube. These tubes were kept in the dri-bath until phage were ready to be plated. Dilutions of 109 , 1010 , and 1011 were added to new microcentrifuge tubes in aliquots of 10 µL, one dilution per tube. To each dilution, 200 µL of ER2738 day culture were added and phage were allowed to infect cells for five minutes before being plated. A P200 was set to 215 µL and all the contents of the microcentrifuge tube were sucked up and transferred to a tube of agarose top. After transfer, the tube was immediately spun on the Vortex Genie and then the solution was spread on a IPTG/X-gal plate, starting at the center of the plate and spreading outwards until the entire plate was covered. This was done for each of the dilutions. The plates were allowed to sit until the agarose top hardened and then they were transferred to the 37°C incubator to sit overnight, with the agarose plate on top and the empty plate below. The following day, the number of blue plaques on each plate were counted and recorded. 3.3.3 Plaque Pick of Round Three Amplified Phage Diluted culture was prepared by combining 300 µL of ER2738 overnight culture and 30 mL of autoclaved LB Broth in a beaker. There was one tube prepared for each of the 24 plaques to be picked; to prepare the culture tubes 1 mL of diluted culture was transferred to each culture tube. A sterile pipet tip was used to stab one blue plaque and then transfer the single plaque to a culture tube. The plaque was released into the culture tube by 17
  • 24.
    pipeting up anddown rapidly several times. Plaques that were chosen were well spaced from plates where there were fewer than 100 plaques per plate. The culture tubes were incubated for 4.5 hours at 250 rpm and 37°C. Each culture was then transferred to a microcentrifuge tube, labeled A, and centrifuged for 30 seconds at 10,000 rpm at 4°C. The top 500 µL of supernatant was then transferred to a new microcentrifuge tube, labeled B. The A centrifuge tubes were labeled and refrigerated. Then, an aliquot of 200 µL PEG/NaCl was added to each B microcentrifuge tube and the tubes were inverted immediately. Once the PEG/NaCl had been added to every microcentrifuge tube the tubes were again inverted, beginning with the first microcentrifuge tube. The microcentrifuge tube were allowed to sit at room temperature for ten minutes. The microcentrifuge tubes were then centrifuged for 10 minutes at 10,000 rpm at 4°C. The supernatant was discarded as waste. The microcentrifuge tube was respun briefly at 10,000 rpm at 4°C. Again, the supernatant was removed as waste. The pellets were stored at -20 °C overnight. The pellets were then suspended in 100 µL of iodide buffer and 250 µL of ethanol was added. The microcentrifuge tubes were incubated for exactly 10 minutes. The microcentrifuge tubes were then centrifuged for 10 minutes at 10,000 rpm and 4°C. The supernatant was discarded and the pellets were washed with 70% ethanol. To wash the pellets, 250 µL of 70% ethanol was added to the microcentrifuge tube, spun for 1 minute and then poured out. Residual ethanol was allowed to evaporate into the air. Once the residual ethanol had evaporated, the pellets were then suspended in 30 µL of TE Buffer and refrigerated. A gel was run and DNA was observed for almost all samples. There are no visible results available because the gel visualizing software 18
  • 25.
    was not operatingproperly when the electrophoresis was performed. The DNA was sequenced by NEB. 3.3.4 Deviations from Standard Procedure During Amplification 2 Round 2 and Round 3 only 15 mL of supernatant was transferred from the second centrifuge tube to the cold centrifuge tube. Due to the low concentrations of plaques from Amplification II Round II titer plates, the 108 dilution was included in the titering of Amplification II Round III. The Amplification 2 Round 3 titer was repeated so that a plaque pick could be performed. The plaque pick of Amplification 2 Round 3 experienced a deviation during the washing of the pellets. The 250 µL of 70% ethanol was immediately poured out once it was added to the microcentrifuge tube rather than spun and then poured. In both instances the residual ethanol was allowed to evaporate overnight. 19
  • 26.
    IV. RESULTS ANDDISCUSSION 4.1 Serial Amplification of the New England Biolabs Ph.D.-12 library To search for new mutant clones, serial amplification experiments were performed to select for the fast propagating phenotype. Since there were no selection mechanisms (i.e., no exposure to target) favoring a phage with a unique displayed peptide, the fastest propagating phage should be present in greater concentrations, which increases the chances of randomly selecting fast mutant clones for sequencing. There were two experiments performed, referred to as Serial Amplifications 1 and 2. For both experiments phage were amplified three times and then titered. Plaques were selected from the titer plates and then sent for sequencing. Between each round of amplification, titers were performed to ensure that the library had been amplified successfully. 20
  • 27.
    Round Dilution PlaqueCount Sample Concentration (pfu/µL) 1 109 32 3.2×10⁹ 1010 2 2.0×10⁹ 1011 0 0.0 2 109 13 1.3×10⁹ 1010 0 0.0 1011 0 0.0 3 108 90 9.0×10⁸ 109 13 1.3×10⁹ 1010 0 0.0 Round Average Plaque Count (pfu/µL) 1 2.6×10⁹ 2 1.3×10⁹ 3 1.1×10⁹ Table 1: Three rounds of Serial Amplification 1 of the Ph. D.-12 library. The sample concentrations were found by multiplying the number of plaques counted by the dilution number. This is then divided by ten to account for the 10 µL of solution that were plated. For example, the sample concentration of Serial Amplification 1 round 1 dilution 9 is (32 pfu×109 )/10µL=3.2×109 pfu/µL. Round Dilution Plaque Count Sample Concentration (pfu/µL) 1 109 3 3.0×10⁸ 1010 0 0.0 1011 0 0.0 2 109 30 3.0×10⁹ 1010 2 2.0×10⁹ 1011 0 0.0 3 108 165 1.7×10⁹ 109 17 1.7×10⁹ 1010 1 1.0×10⁹ Round Average Plaque Count (pfu/µL) 1 3.0×10⁸ 2 2.5×10⁹ 3 1.5×10⁹ Table 2: Three rounds of Serial Amplification 2 of the Ph. D.-12 library. 21
  • 28.
    Twelve plaques wererandomly selected from each of the round three serial amplifications 1 and 2. The DNA of each of the plaques was isolated and checked on a 1% agarose gel (data is not available since the gel visualizing software was out of order). Since most of the isolated DNA was observed on the gel, all the DNA was sent to be sequenced at New England Biolabs. Each of the plaques has readily identifiable DNA due to the peptide at 5’ end of gene III, which was sequenced (Figure 6). Sample DNA sequence (amino acid sequence shown below codons) 1 ACTCT AAG ANG AAT GCG GAG CAT GCT ACT ACG CAT ATT ACG GGTGGA K ? N A E H A T T H I T 2 ACTCT CAG CNG NCT TCT AAT TTG TCT TAT CCG GCG CAT GAG GGTGGA P ? ? S N L S Y P A H E 3 ACTCT NCG CNT NNT NRG NCT NNT CGG TCG AAG TNT ANG CNN GGNGGN ? ? ? ? ? ? R S K ? ? ? 4 ACTCT GAT GTT CCG AAT AAG ACG CAG TTT GCT CGT TTT CCT GGTGGN N V P N K T Q F A R F P 5 ACTCT GGT GTT ACG TAG GCG GCG GGG GCT CCT TTG TGG GGT GGTGGA G V T - A A G A P L W G 6 ACTCT CTT CCG CCG ATT CAT TAT AAT CGG TCG CCG CCT CCG GGTGGA G P P I H Y N R S P P P 7 ACTCT GGG TTT ACT ATG GAG CAG CGG ACG ACG TTT CTG CAT GGTGGA G F T M E Q R T T F L H 8 ACTCT TCT CCT CCG TTG CTG TTG TTT GGT GCT CTG ACG CGG GGTGGA S P P L L L F G A L T R 9 ACTCT ATT GCT AAG CCG ACT GCT GTG CCT CCT TCG GAT CAT GGTGGA I A K P T A V P P S D H 10 ACTCT GTT GAG AAG TAT TCT AGT ATG GAT TAT CCG CCG AGG GGTGGA V E K Y S S M D Y P P R 11 AAT CAG GCG GCT TCT ATT ACT AAG CGT GTT CCG TAT GGTGGA N Q A A S I T N R V P Y 12 ACTCT GAT GNG NCT ACG AAT TCG TGG AAT GTT CCG AAG CCT GGTGGA D ? ? T N S S N V P K P 13 ACTCT TAN CCT ANA CAG ACT AGT AAG GAT GGT AGT CTT NGG GGNNGA Y P ? Q T S K D G S L ? 14 ACTCT TTT GNG GTT CCG GAT AGT TCG TTG TCG AGT ACT CGG GGTGGN F V P D S S L S S L T R 15 ACTCT GGT GNG TGG CAT GCG ACT ACG CAT CCG GCT GAG TCG GGTGGA G ? W H A T S H P A E S 16 ACTCT GGG ACT TTG TGT CTT GCG CAT CGT CCG TGT CAG AAT GGNGGA G T L C L A H R P C Q N 17 ACTCT GAG CAT ACG CTT GGT TAT CGT CTT GAG CGG CCG CTG GGTGGA E H T L G Y R L E R P L 18 ACTCT GCG AGT CTT AAT AAT ATG ATG GCG CCT CTG CTT CCG GGTGGA A S L N N M M A P L L P 22
  • 29.
    19 ACTCT TATCCG CCT CGT GCG TGG GAT ACG CCG CAT CCT CAT GGTGGA Y P P R A W D T P H P H 20 ACTC GGCCGAAACTGTTGAAAGTTG 21 ACTCT TTT CAT TTT GAT CTT CAT CAG AAG AAT CCT TAT CAG GGTGGN F H F D L H Q K N P Y Q 22 ACTCT CAT AAT CCT ATG TCT CGT TTG CAT ATG AAT TAT TCT GGTGGA H N P M S R L H M N Y S 23 ACTCT AAG CCG CCT CCT CAG ACT CCG CAG GCG CTT GAG GGG GGTGGA K P P P Q T P Q A L E G 24 ACTCT TCT GCT CAG GAT TCT GGG TTT GTT CCG TTT ACG CCG GGTGGA S A Q D S G F V P F T P 25 ACTCT GAT TCG GTT GAG ATG GCT CCG CAT ACT CGG CAG CAT GGTGGA D S V E M A P H T R Q H 26 ACTCT AAT GCT CAT CAG TCT CAT AGG CTG CAT ACT CAT CTG GGTGGA N A H Q S H R L H T H L 27 ACTCT AAT GCT CAT CAG TCT CAT AGG CTG CAT ACT CAT CTG GGTGGA N A H Q S H R L H T H P 28 ACTCT CTT CCT AGT GCG AAG CTG CCT CCG GGT CCT CCG AAG GGTGGA L P S A K L P P G P P K 29 ACTCT TCT ATT CCT CCT TCT CGG GAT CAG CCT TCG CAT AAG GGTGGA S I P P S R D Q P S H K 30 ACTCT GAT AAT GCG AAT TCT AGT ATT CGG TCG CAG ACG TAT GGTGGA D N A N S S I R S Q T Y 31 ACTCT GAT CCG CTT ACT TAT GCT ATG ACG CGT ACT ATT AAG GGTGGA D P L T Y A M T R T I K 32 ACTCT TAT CAG ACG ACG ATT ATT AAT ACG GCT GAT CGT TTT GGTGGA Y Q T T I I N T A D R F 33 ACTCT ACG ACT TCT CTG GCT AGG CCT CAT TAT TTG AAT GAG GGTGGA T T S L A R P H Y L N E 34 ACTCT TCT CTT TCG CAT CCG AAT GCG TTT AAT TCT GAG TCT GGTGGA S L S H P N A F N S E S 35 ACTCT TAT TCG CCG GCT AGT AAG AGT CCT GTT CCT TCG CTG GGTGGA Y S P A M K S P V P S L 36 ACTCT TGG AGG TTT TCT TCT CCG GAG CAT CTG GCT ATG AAG GGTGGA W R F S S P E H L A M K 37 ACTCT GAT AGG ATG CTG CTG CCT TTT AAT CTT CTG GCG CTG GGTGGA D R M L L P F N L L A L 38 ACTCT TCG TTT TTG CAT CCG TCG CGG AGT CTG GGT ATG ACG GGTGGA S F L H P S R S L G M T 39 ACTCT ATT AGT AGG CCG GCG CCG ATT TCT GTG GAT ATG AAG GGTGGA I S R P A P I S V D M K 40 ACTCT TCT CAT TCT ACA GCT TCT TCG CAG TGG CGT TTT CCG GGTGGA S H S T A S S Q W R F P 41 ACTCT GGT CCG AGT GCG TGG TAT CCG ACG GCT TAT TCG AGG GGTGGA Y S L P R H L V S L P P 42 ACTCT GGT CCG AGT GCG TGG TAT CCG ACG GCT TAT TCG AGG GGTGGA G P S A W Y P T A Y S R 43 ACTCT ACT ATG TCT CCT AAT CCT ACT TCT AGG CAG CTT CCG GGTGGA T M S P N P T S R Q L P 44 ACTCT ATG AGG GAG GAT ATT TTG CTG CAT ACG GAT GTG GGG GGTGGA M R E D I L L H T D V G 45 ACTCT GAT CTG AAT TAT TTT ACG CTG TCT TCT AAG CGG GAG GGTGGA D L N Y F T L S S K R E 23
  • 30.
    46 ACTC GGCCGAAACTGTTGAAAGTTG 47ACTCT AAT CCT CCG CCT TAT GCT CGT ACT GCG TCT GCT GCG GGTGGA N P P P Y A R T A S A A 48 ACTCT GCT AAT CAG AGT AAT GCT TAT AAT ACG TTG AAG ATT GGTGGA A N Q S N A Y N T L K I Figure 6. Raw DNA data and translated amino acids from plaque picks of round three serial amplifications 1 and 2. Question marks (?) represent when it was not possible to translate the raw DNA into amino acids. This generally occurred when the DNA codon unit N appeared. The codon unit N means that sequencing failed. The raw DNA sequences were obtained from New England Biolabs and the peptide sequences were then translated, as shown above. It is unknown whether or not each of these clones displays the phenotype for faster propagation than the average wild-type phage since time course titers have not been performed. If multiple phage displaying the same amino acid sequence were selected in the random selection of plaques, this would have been a good indication that the phage was fast growing. It is unlikely that multiple phage displaying the same peptide on protein III would arise unless that phage clone had an advantage in its propagation ability. 4.2 Time Course Titers of Serial Amplifications While performing multiple serial amplification experiments increases the chances of finding fast propagating phage, three rounds of amplification may not be enough to allow for fast propagating phage to out compete all other phage. When there are no evolutionary pressures to force phage displaying a unique peptide to take over the amplification, fast propagating phage will appear at greater percentage than normal 24
  • 31.
    propagating phage. Thisincreases the likelihood of finding fast propagating phage in a random selection of phage culture, but it does not ensure that all, or even any, fast propagating phage will be selected during viral DNA isolation and sequencing. Many of the plaques that are selected are phage that grow at average rates and will not display the desired phenotype. To increase the likelihood of finding fast propagating phage, and thus mutations in the Shine-Dalgarno region, a 135-minute screen was performed by Kieu Nguyen. Round 3 of serial amplification 1 (described above) was plated and plaques were removed from the plate individually. Each plaque was put into 1 mL LB and 10 µL of overnight culture. These solutions were incubated for 135 minutes and then titered to determine their concentrations. The results of a titer performed by Nguyen are shown in Table 3. Plaques are counted at 135 minutes because this is the time at which the faster propagating clones and normal clones have the most dramatic difference in phage concentrations. This point in the incubation was utilized to compare relative concentrations of the selected phage. Assuming that each original plaque contains approximately the same number of phage, a high concentration of phage at 135 minutes could indicate one of two things: either the initial concentration of phage was very high or the phage propagated at an above average rate. There were two phage displaying peptides that were identified as probable fast propagating phage, samples E and K. Both samples had more plaques than could be accurately counted for a dilution of 105 . 25
  • 32.
    Label Number of plaquesin dilution of 105 Number of plaques in dilution of 106 Concentration (pfu/μL) A 137 18 1.6×10⁶ B 222 23 2.3×10⁶ C 542 79 6.7×10⁶ D 239 20 2.2×10⁶ E 2336 220 2.3×10⁷ F 1536 103 1.3×10⁷ G 49 10 7.5×10⁵ H 1616 146 1.5×10⁷ I 240 25 2.5×10⁶ J 63 2 4.2×10⁵ K 3216 250 2.9×10⁷ L 24 3 2.7×10⁵ Table 3: 135-minute screen by K. Nguyen to select potential fast propagating phage Partial time course titers were performed on phage with extremely high concentrations (pfu/µL). Partial time course titers were used to confirm that the phage that had the highest concentrations were faster propagators than the average phage, and that it was not just an effect of the screening phage having a large initial amount of phage. Experiments with samples E and K were performed by Kieu Nguyen and later Heidi Weinreich. 26
  • 33.
    Time Course Titerof M13KE and K 0.00 1.00 2.00 3.00 4.00 5.00 6.00 7.00 8.00 9.00 10.00 0 30 60 90 120 150 180 210 240 270 300 Time (minutes) log(pfu/μL) M13KE K Figure 7. Partial time course titer of M13KE and K by K. Nguyen. The phage referred to as K displays the desired phenotype. The rate of propagation of K is shown to be much greater than that of the rate of M13KE, the wild-type phage. 10 27
  • 34.
    Figure 8. Partialtime course titer of K and E and M13KE by H. Weinreich. E and K are fast propagators. Their initial rate of growth is much greater than the rate of growth of the wild-type phage, M13KE.11 The partial time course titer shows that K and E are fast propagating phage since there is a large difference in the rate of propagation of samples E and K phage compared to the rate of propagation of the wild-type phage, M13KE. This is confirmed by the fact that both the initial concentrations and end concentrations are relatively equal whereas there is a large difference in the concentrations at 135 minutes, where Figure 8 shows that the concentrations of samples E and K are larger than the concentration of the wild-type phage, M13KE, by a factor of about 100 (or 2 log units) and Figure 7 shows that the concentration of sample K is larger than the concentration of the wild-type phage, 28 2 3 4 5 6 7 8 9 10 11 0 50 100 150 200 250 300 350 Time (Minutes) Lo g(p fu/ µL) M13KE Sample E Sample K
  • 35.
    M13KE, by afactor of about 100. E and K propagate approximately 100 times faster than the wild-type phage, M13KE. Name of Clone Shine Dalgarno MetIleAsp… (CLONE NAME) …GGGGCTTTTCTGATTATCAACCGGGGTACATATGATTGAC… Ph-HAIYPRH -----------------------A---------------- (HAIYPRH) Ph-ANTLRSP -------------------C-------------------- (ANTLRSP) Ph-LMSTGRD ---A------------------------------------ (LMSTGRD) Ph-ARPPASP --------C------------------------------- (#10) Ph-GKPMPPM --T------------------------------------- (#4) Ph-KDTNIYDQRYSR --T------------------------------------- (E) Ph-AMSPRMDGKVFA -----Δ---------------------------------- (K) Figure 9. Summary of Single Base Mutations from both the Ph.D-7 and Ph.D.-12 libraries. The Shine-Dalgarno sequence is overlined and bolded. When the regions surrounding the gene II Shine-Dalgarno were sequenced for clones of interest, clones of samples E and K were found to have mutations in the DNA region which precedes the Shine-Dalgarno region (Figure 9). Figure 9 also shows fast propagating phage from the Ph.D.-7 library that been found to have mutations. Since the identification of HAIYPRH as a target unrelated-peptide, several other phage with the phenotype for fast propagation have been identified. The explanation for the effect on the rate of propagation of the phage is unknown. In the HAIYPRH and ANTLRSP clones, it is possible that mutations in the Shine-Dalgarno region affect ribosomal binding. While HAIYPRH has a better Shine-Dalgarno sequence (an additional base pair with ribosomal RNA) the mutation in ANTLRSP does not create a better Shine-Dalgarno sequence. Instead the secondary structure of the mRNA may be 29
  • 36.
    affected by themutations. Changing the folding of the mRNA affects the ability of the ribosome, pV, to bind to it. Many of the mutations have been discovered upstream of the Shine-Dalgarno region in the pV operator sequence. In contrast to the Shine-Dalgarno sequence, where ribosomal binding occurs, the operator sequence is where pV binds to repress the expression of pII. Protein II initiates replication by nicking the replicative form of the phage DNA. Since replication is the slow step of reproduction of phage, increasing the likelihood for DNA to be nicked may increase the rate of propagation. If pV can no longer bind as well to the operator sequence due to a mutation, then repression is decreased and translation of gene II is enhanced. This would increase the production of pII, relative to a phage without the mutation, and the increased rate of replication allows for a greater rate of propagation. 30
  • 37.
    V. CONCLUSIONS Much morework needs to be done before any conclusions can be drawn from this research. Experiments with the library should be continued to try to find both new and repeated mutations. New clones with mutations in the operator sequence may be selected with the phenotype for fast propagation. Also, the occurrence of the Shine-Dalgarno mutations, like the HAIYPRH and ANTLRSP clones, cannot predict the overall effect of mutations on secondary structure but it may be possible to determine whether these mutations affect the binding of ribosome. If pII production increases while pV binding remains consistent it would suggest that ribosomal binding has a direct effect on gene II expression. This may be caused by changes in the secondary structure. Computer modeling will be utilized to predict changes in the secondary structure due to mutations so that the effects of the binding of pV and ribosome may be decoupled. It will also help to design new mutations to observe how mRNA affects the translation of gene II. 31
  • 38.
    VI. LITERATURE CITED 1.Ptashne, M. A Genetic Switch; Phage and Higher Organisms, 2nd ed.; Cell Press and Blackwell Scientific Publications: Cambridge, MA, 1992. 2. Burton, D.R.; Scott, J.K.;Silverman, G.J. (Eds.). Phage Display: A Laboratory Manual, ed. Barbas, C.; Cold Spring Harbor Laboratory Press, 2001. 3. Nakamura, M.; Tsumoto, K.; Kumagai, I.; Ishimura, K. A Morphologic Study of Filamentous Phage Infection of Escherichia coli using biotinylated Phages. FEBS Letters 536 (2003) 167-172.4. 4. Stassen, A.P.M.; Folmer, R.H.A.; Hilbers, C.W.; Konings, R.N.H. Single-stranded DNA Binding Protein Encoded by the Filamentous Bacteriophage M13: Structural and Functional Characteristics. Molecular Biology Reports 20:109-127, 1995. 5. Smith, G.P; Petrenko, V.A. Phage Display, Chem Rev 97,391-410, 1997. 6. Ph.D.-12 Phage Display Peptide Library Kit Manual, New England Biolabs, Ipswich, MA. 7. Menendez, A.; Scott, J. The nature of target-unrelated peptides recovered in the screening of phage-displayed random peptide libraries with antibodies. Anal. Biochem. 336, 145-157, 2005. 8. Brammer, L.A.; Bolduc, B.; Kass, J.L.; Felice, K.M.; Noren, C.J.; Hall, M.F. A Target- Unrelated Peptide in an M13 Phage Display Library Traced to an Advantageous Mutation in the Gene II Ribosome-Binding Site. Anal. Biochem 373: 88-98, 2008. 9. Personal communications with Dr. Beth Paschal, Ph.D.-12 product manager at NEB. 10. Nguyen, K., Identifying Fast-Propagating M13 Bacteriophage from Ph.D.-7 Phage Displayed Library, STEP Report, 2009. 11. Weinreich, H., Senior Thesis, 2010. 32