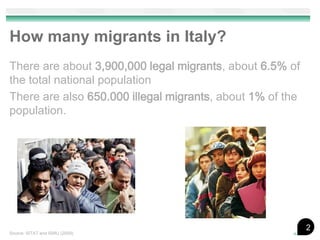
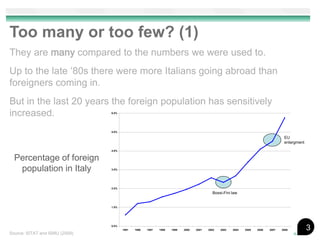
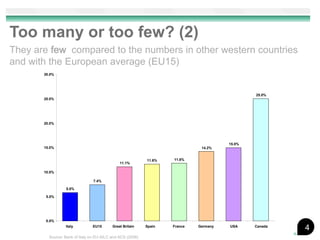
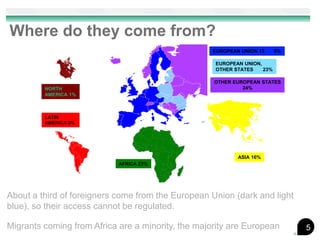
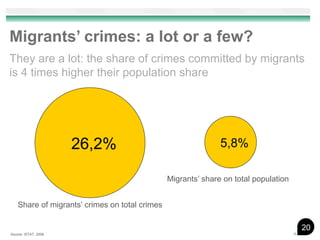
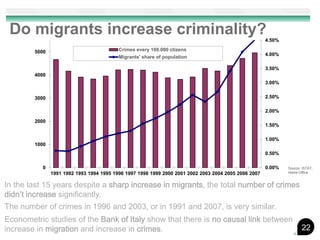
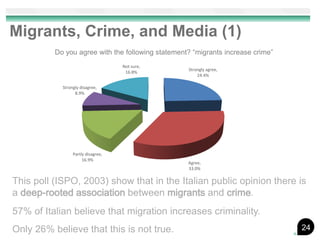
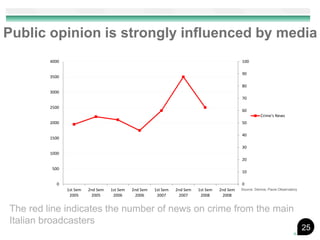
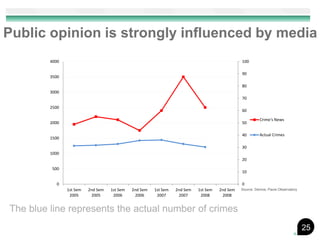
Migration in Italy:
Resource or Threat?
         by Fadi Hassan and Luigi Minale
How many migrants in Italy?
There are about 3,900,000 legal migrants, about 6.5% of
the total national population
There are also 650.000 illegal migrants, about 1% of the
population.


                                                           2
Source: ISTAT and ISMU (2009)
Too many or too few? (1)
They are many compared to the numbers we were used to.
Up to the late ‘80s there were more Italians going abroad than
foreigners coming in.
But in the last 20 years the foreign population has sensitively
increased.                      6.0%


                                5.0%

                                                                                                                                   EU
                                                                                                                                   enlargment

                                4.0%


  Percentage of foreign
   population in Italy          3.0%


                                2.0%
                                                                                          Bossi-Fini law


                                1.0%


                                0.0%
                                       1991   1996   1997   1998   1999   2000   2001   2002   2003   2004   2005   2006   2007   2008          3
Source: ISTAT and ISMU (2009)
Too many or too few? (2)
They are few compared to the numbers in other western countries
and with the European average (EU15)
       30.0%


                                                                                              25.0%
       25.0%


       20.0%


                                                                                      15.0%
       15.0%                                                                 14.2%


                                                           11.6%   11.8%
                                              11.1%

       10.0%

                                7.4%

                 5.8%

        5.0%


        0.0%
                 Italy          EU15      Great Britain    Spain   France   Germany   USA     Canada
                                                                                                       4
         Source: Bank of Italy on EU-SILC and ACS (2008)
Where do they come from?
                                                    EUROPEAN UNION 15     5%

                                                    EUROPEAN UNION,
                                                    OTHER STATES    23%

                                                    OTHER EUROPEAN STATES
         NORTH                                               24%
         AMERICA 1%


         LATIN
         AMERICA 8%


                                                            ASIA 16%
                            AFRICA 23%


About a third of foreigners come from the European Union (dark and light
blue), so their access cannot be regulated.

Migrants coming from Africa are a minority, the majority are European          5
How do illegal migrants enter the
country?                                                            By land 15%


About 73% enter with a touristic visa   Malpensa
and then overstay.

Only 12% enter with a pontoon from        With turistic visa from the
Africa.                                   main airports 73%


This means that the mass rejections
of migrants coming from the                            Fiumicino
Mediterranean sea have a high media
and political impact, but are a poor
tool for illegal migrant control.

Moreover, many of the migrants
coming by sea are asylum seekers.         By sea 12%


                                                                                  6
                                                    Source: Home Office (2008)
How do they look like? (Education)
                  Education Level, Italian and Foreigners
          60.0%

                             51.2%
          50.0%    48.2%


                                     39.4%   38.9%
          40.0%


                                                                            Italian
          30.0%
                                                                            Foreigners

          20.0%

                                                     12.5%
                                                             10.2%
          10.0%


           0.0%
                   Primary School     High School       College


Perhaps surprisingly, Italian and foreigners have very similar
education levels.
                                                                                                7
                                                        Source: ISTAT and Bank of Italy, 2010
How do they look like? (Demographics)
                  Italian                                  Foreigners
                   AGE                                       AGE

   Men                         Women          Men                         Women


 Source: ISTAT


From these “Demographic Pyramids” we can see that migrants are younger
More than 80% of them are less than 45 (vs. 50% of Italians) and 20% are less
than 15 (vs. 12% Italians).
Also, migrants have higher fertility rates: on average 2.12 children per woman,
against just 1.26 for an Italian woman                                            8
How will we look like?
According to projections from ISMU, 1 Italian out of 3, younger
than 24, will be of foreign origins by 2050.
Migrants’ sons will give a crucial contribution to tomorrow’s
Italy.
Their integrations is one of the most important political
challenges for our country and the second-generation
immigrants is the key one

                               The school will play a crucial
                               role to reach this integration
                                         objective!


                                                                  9
Migration and the labor market


                                 10
Employment rates
        80%


        70%                  67%            68%
                                     65%

               58%                                          59%
        60%


        50%                                           46%
                                                                  Italian
        40%


        30%                                                       Foreigners

        20%


        10%


        0%
                     Italy         North and Centre     South


Foreigners have higher employment rates than natives
The difference is even more striking for females.
This suggests that working is the primary reason for migration                 11
The effects of migration
Two major concerns related to migration are:
1. Do migrants take jobs away from Italian workers?
2. Does their presence force Italian workers to accept lower pay?

Some general answers regarding Italy come from a couple of studies:
•   A study from the Bank of Italy says that “the growth of
    immigration has not been associated with lower employment
    opportunities for natives.”
    •    No evidence of negative aggregate impact on employment

•   A study from INPS shows that “in provinces with higher
    concentration of migrants the salaries for natives did not show
    any difference in trend with respect to other provinces”
    •    No evidence of negative aggregate impact on salaries
                                                                      12
Not everybody is affected in the same way
Migrant workers certainly have a positive aggregate effect on the economy. They
represent 6.5% of the population but contribute to about 10% of the GDP.

Nonetheless the effects of immigration on employment and wages are not
homogenous for everybody, there are losers and winners:

•   Low-skilled native workers are slightly worse off because face direct competition
    from migrants, especially from illegal migrants. Regularizing the position of these
    migrants would probably favor low-skilled Italian workers.

•   High-skilled native workers are better off because they exploit complementarities
    with low skilled workers

•   Women beneficiate from the presence of migrants who provide services such as
    childcare and housekeeping. Migrants in Italy often substitute the state in the
    provision of services that are crucial to allow females to get back to work.
                                                                                     13
Migration and Welfare State


                              14
Are Migrants a Fiscal Cost?
                 4.5
                                    4%
                  4

                 3.5

                  3
                                                                    2.6%
                 2.5

                  2

                 1.5

                  1

                 0.5

                  0                                                                      Source: ISTAT
                       Fiscal revenues from migrants   Fiscal expenditure for migrants


Migrants are actually a resource for the State!
They provide 4% of total fiscal revenues, but they receive 2.6% of total expenditure!

                                                                                                         15
Some fiscal details
o   Taxation
      •      Migrants pay 4.5 billions of income tax
      •      They also pay 10 billions of other taxes and social contributions
      •      They pay 5% of IRAP

o   Education
      •      Migrants receive almost 4 billions (5% of total expenditure on
             education)

o   Health
      •      They receive almost 3 billions (3% of total health expenditure). On
             average they are younger and they get sick less than Italians

o   Income Subsidies
      •      They receive almost 1 billion (7% of the total expenditure)


                                                                                   16
Do Migrants Pay our Pensions?

                                         For now the answer is certainly yes!

 Italy, after Japan, has the oldest population of the world.

 Foreign migration is on average much younger than the Italian population
 and this helps to diminish the dependency ratio*

 However, this offsetting effect is just temporary and limited in time and
 cannot be considered as a permanent solution to our pension system.


* The dependency ratio is the ratio of older dependents people to the working-age population. It provides a figure of the population ageing trend
and it’s an important indicator of the weight that pension and health expenditure is expected to have on the State’s balance.                       17
Migration and Crime


                      18
How many crimes do migrants
 commit?
 26% of crimes are committed by foreigners

 37% of people in jail are foreigners


                                             19
Source: ISTAT and Ministry of Justice
Migrants’ crimes: a lot or a few?
They are a lot: the share of crimes committed by migrants
is 4 times higher their population share


                      26,2%                                    5,8%

                                                Migrants’ share on total population


    Share of migrants’ crimes on total crimes

                                                                                      20
Source: ISTAT, 2008
Delinquency rates
Despite the absolute number of crimes being high, migrants’
delinquency rate has decreased sharply
                         Migrants’ delinquency rate
                  5.3%


                                   3.5%


                                                      2.2%


                  2000             2003               2006   Source: ISTAT


This suggests that the majority of migrants that come to Italy
are not criminal, but people looking for better opportunities                21
Do migrants increase criminality?                                                                    4.50%

        5000                              Crimes every 100.000 ctizens
                                                                                                      4.00%
                                          Migrants' share of population

                                                                                                      3.50%
        4000
                                                                                                      3.00%


        3000                                                                                          2.50%

                                                                                                      2.00%

        2000
                                                                                                      1.50%

                                                                                                      1.00%
        1000
                                                                                                      0.50%

           0                                                                                          0.00%   Source: ISTAT,
               1991 1992 1993 1994 1995 1996 1997 1998 1999 2000 2001 2002 2003 2004 2005 2006 2007           Home Office


In the last 15 years despite a sharp increase in migrants, the total number of crimes
didn’t increase significantly.
The number of crimes in 1996 and 2003, or in 1991 and 2007, is very similar.
Econometric studies of the Bank of Italy show that there is no causal link between
increase in migration and increase in crimes.                                                                        22
So, no problems on migrants and
crimes?
The high delinquency rate among migrants creates problems of
integration.
But the point is: do Italian citizens care about reducing the
overall number of crimes or the crimes committed by migrants?

If the overall number of crimes is the issue, then a restrictive or
repressive attitude towards migration is not the right answer.
An effective action on the roots that favor criminality in Italy is
what really matters.

                                                                      23
Migrants, Crime, and Media (1)
          Do you agree with the following statement? “migrants increase crime”
                                    Not sure,
                                                   Strongly agree,
                                     16.8%
                                                       24.4%

            Strongly disagree,
                  8.9%


                 Partly disagree,
                      16.9%
                                                   Agree,
                                                   33.0%

This poll (ISPO, 2003) show that in the Italian public opinion there is
a deep-rooted association between migrants and crime.
57% of Italian believe that migration increases criminality.
Only 26% believe that this is not true.                                          24
Public opinion is strongly influenced by media
         4000                                                                                   100

                                                                                                90
         3500

                                                                                                80
         3000
                                                                                                70

         2500
                                                                                                60
                                                                                                           Crime's News
         2000                                                                                   50

                                                                                                40
         1500

                                                                                                30
         1000
                                                                                                20

          500
                                                                                                10

            0                                                                                   0
                1st Sem   2nd Sem   1st Sem   2nd Sem   1st Sem   2nd Sem   1st Sem   2nd Sem   Source: Demos, Pavia Observatory
                 2005      2005      2006      2006      2007      2007      2008      2008


The red line indicates the number of news on crime from the main
Italian broadcasters
                                                                                                                                   25
Public opinion is strongly influenced by media
         4000                                                                                   100

                                                                                                90
         3500

                                                                                                80
         3000
                                                                                                70

         2500
                                                                                                60

                                                                                                          Crime's News
         2000                                                                                   50

                                                                                                40        Actual Crimes
         1500

                                                                                                30
         1000
                                                                                                20

          500
                                                                                                10

            0                                                                                   0
                1st Sem   2nd Sem   1st Sem   2nd Sem   1st Sem   2nd Sem   1st Sem   2nd Sem   Source: Demos, Pavia Observatory
                 2005      2005      2006      2006      2007      2007      2008      2008


The blue line represents the actual number of crimes
                                                                                                                                   25
Public opinion is strongly influenced by media
         4000                                                                                      100

                                                                                                   90
         3500

                                                                                                   80
         3000
                                                                                                   70        Crime's News

         2500
                                                                                                   60
                                                                                  53.1                       Actual Crimes
         2000                                                                                      50
                                                                       50.7
                                                             44.2
                                                                                                   40
         1500              33.8                                                                              Crime's
                                                                                           39.8
                                                                                                             Perception
                                                                                                   30
         1000
                                                                                                   20

          500
                                                                                                   10

            0                                                                                      0
                1st Sem   2nd Sem   1st Sem   2nd Sem   1st Sem     2nd Sem   1st Sem    2nd Sem   Source: Demos, Pavia Observatory
                 2005      2005      2006      2006      2007        2007      2008       2008


The yellow line captures citizens’ perception of crime
                                                                                                                                      25
Public opinion is strongly influenced by media
         4000                                                                                      100

                                                                                                   90
         3500

                                                                                                   80
         3000
                                                                                                   70        Crime's News

         2500
                                                                                                   60
                                                                                  53.1                       Actual Crimes
         2000                                                                                      50
                                                                       50.7
                                                             44.2
                                                                                                   40
         1500              33.8                                                                              Crime's
                                                                                           39.8
                                                                                                             Perception
                                                                                                   30
         1000
                                                                                                   20

          500
                                                                                                   10

            0                                                                                      0
                1st Sem   2nd Sem   1st Sem   2nd Sem   1st Sem     2nd Sem   1st Sem    2nd Sem   Source: Demos, Pavia Observatory
                 2005      2005      2006      2006      2007        2007      2008       2008

We can see that the media bombardment on crime leads to an
increase of crime’s perception from 34% to 53% without an actual
increase in the number of crimes                                                                                                      25
Conclusions
This presentation suggests that migration is an important
resource for Italy.

This does not mean that migration is unproblematic or
that we should open our borders indiscriminately.

Migration is a resource that needs to be managed,
programmed and regulated properly.

We need a forward-looking policy grounded on sound
data, not on ideologies, that enhances the positive sides
of migration and minimize the negative ones.
                                                            26
Literary Conclusion: Migration and Culture
From Massimo Montanari’s book “Food as a Culture”:
“Often we oppose migration to defend our cultural roots. But the
roots of trees, under ground, bifurcate going very far from the tree.
They take unpredictable paths and lead to different points,
sometimes remote.
Think about the meal course “Spaghetti al Pomodoro”, our typical
national dish and an Italian brand all over the world. Well, the roots
of this meal are not Italian at all.
The invention of Spaghetti is disputed between Chinese and Arab,
we made it our only by getting in touch with these civilizations.
Tomato is not an Italian plant, not even European, but it was taken
from America…”
                                                                         27
Thanks!
If you liked it, forward the link to you friends and sustain
                          our project!


                                Authors:
    fadi.hassan@quattrogatti.info | luigi.minale@quattrogatti.info


                             Contacts:
         quattrogatti@quattrogatti.info | @_quattrogatti |
                     facebook.com/quattrogatti.info

Migration in Italy: resource or threat?

  • 1.
    Migration in Italy: Resourceor Threat? by Fadi Hassan and Luigi Minale
  • 2.
    How many migrantsin Italy? There are about 3,900,000 legal migrants, about 6.5% of the total national population There are also 650.000 illegal migrants, about 1% of the population. 2 Source: ISTAT and ISMU (2009)
  • 3.
    Too many ortoo few? (1) They are many compared to the numbers we were used to. Up to the late ‘80s there were more Italians going abroad than foreigners coming in. But in the last 20 years the foreign population has sensitively increased. 6.0% 5.0% EU enlargment 4.0% Percentage of foreign population in Italy 3.0% 2.0% Bossi-Fini law 1.0% 0.0% 1991 1996 1997 1998 1999 2000 2001 2002 2003 2004 2005 2006 2007 2008 3 Source: ISTAT and ISMU (2009)
  • 4.
    Too many ortoo few? (2) They are few compared to the numbers in other western countries and with the European average (EU15) 30.0% 25.0% 25.0% 20.0% 15.0% 15.0% 14.2% 11.6% 11.8% 11.1% 10.0% 7.4% 5.8% 5.0% 0.0% Italy EU15 Great Britain Spain France Germany USA Canada 4 Source: Bank of Italy on EU-SILC and ACS (2008)
  • 5.
    Where do theycome from? EUROPEAN UNION 15 5% EUROPEAN UNION, OTHER STATES 23% OTHER EUROPEAN STATES NORTH 24% AMERICA 1% LATIN AMERICA 8% ASIA 16% AFRICA 23% About a third of foreigners come from the European Union (dark and light blue), so their access cannot be regulated. Migrants coming from Africa are a minority, the majority are European 5
  • 6.
    How do illegalmigrants enter the country? By land 15% About 73% enter with a touristic visa Malpensa and then overstay. Only 12% enter with a pontoon from With turistic visa from the Africa. main airports 73% This means that the mass rejections of migrants coming from the Fiumicino Mediterranean sea have a high media and political impact, but are a poor tool for illegal migrant control. Moreover, many of the migrants coming by sea are asylum seekers. By sea 12% 6 Source: Home Office (2008)
  • 7.
    How do theylook like? (Education) Education Level, Italian and Foreigners 60.0% 51.2% 50.0% 48.2% 39.4% 38.9% 40.0% Italian 30.0% Foreigners 20.0% 12.5% 10.2% 10.0% 0.0% Primary School High School College Perhaps surprisingly, Italian and foreigners have very similar education levels. 7 Source: ISTAT and Bank of Italy, 2010
  • 8.
    How do theylook like? (Demographics) Italian Foreigners AGE AGE Men Women Men Women Source: ISTAT From these “Demographic Pyramids” we can see that migrants are younger More than 80% of them are less than 45 (vs. 50% of Italians) and 20% are less than 15 (vs. 12% Italians). Also, migrants have higher fertility rates: on average 2.12 children per woman, against just 1.26 for an Italian woman 8
  • 9.
    How will welook like? According to projections from ISMU, 1 Italian out of 3, younger than 24, will be of foreign origins by 2050. Migrants’ sons will give a crucial contribution to tomorrow’s Italy. Their integrations is one of the most important political challenges for our country and the second-generation immigrants is the key one The school will play a crucial role to reach this integration objective! 9
  • 10.
    Migration and thelabor market 10
  • 11.
    Employment rates 80% 70% 67% 68% 65% 58% 59% 60% 50% 46% Italian 40% 30% Foreigners 20% 10% 0% Italy North and Centre South Foreigners have higher employment rates than natives The difference is even more striking for females. This suggests that working is the primary reason for migration 11
  • 12.
    The effects ofmigration Two major concerns related to migration are: 1. Do migrants take jobs away from Italian workers? 2. Does their presence force Italian workers to accept lower pay? Some general answers regarding Italy come from a couple of studies: • A study from the Bank of Italy says that “the growth of immigration has not been associated with lower employment opportunities for natives.” •  No evidence of negative aggregate impact on employment • A study from INPS shows that “in provinces with higher concentration of migrants the salaries for natives did not show any difference in trend with respect to other provinces” •  No evidence of negative aggregate impact on salaries 12
  • 13.
    Not everybody isaffected in the same way Migrant workers certainly have a positive aggregate effect on the economy. They represent 6.5% of the population but contribute to about 10% of the GDP. Nonetheless the effects of immigration on employment and wages are not homogenous for everybody, there are losers and winners: • Low-skilled native workers are slightly worse off because face direct competition from migrants, especially from illegal migrants. Regularizing the position of these migrants would probably favor low-skilled Italian workers. • High-skilled native workers are better off because they exploit complementarities with low skilled workers • Women beneficiate from the presence of migrants who provide services such as childcare and housekeeping. Migrants in Italy often substitute the state in the provision of services that are crucial to allow females to get back to work. 13
  • 14.
  • 15.
    Are Migrants aFiscal Cost? 4.5 4% 4 3.5 3 2.6% 2.5 2 1.5 1 0.5 0 Source: ISTAT Fiscal revenues from migrants Fiscal expenditure for migrants Migrants are actually a resource for the State! They provide 4% of total fiscal revenues, but they receive 2.6% of total expenditure! 15
  • 16.
    Some fiscal details o Taxation • Migrants pay 4.5 billions of income tax • They also pay 10 billions of other taxes and social contributions • They pay 5% of IRAP o Education • Migrants receive almost 4 billions (5% of total expenditure on education) o Health • They receive almost 3 billions (3% of total health expenditure). On average they are younger and they get sick less than Italians o Income Subsidies • They receive almost 1 billion (7% of the total expenditure) 16
  • 17.
    Do Migrants Payour Pensions? For now the answer is certainly yes! Italy, after Japan, has the oldest population of the world. Foreign migration is on average much younger than the Italian population and this helps to diminish the dependency ratio* However, this offsetting effect is just temporary and limited in time and cannot be considered as a permanent solution to our pension system. * The dependency ratio is the ratio of older dependents people to the working-age population. It provides a figure of the population ageing trend and it’s an important indicator of the weight that pension and health expenditure is expected to have on the State’s balance. 17
  • 18.
  • 19.
    How many crimesdo migrants commit? 26% of crimes are committed by foreigners 37% of people in jail are foreigners 19 Source: ISTAT and Ministry of Justice
  • 20.
    Migrants’ crimes: alot or a few? They are a lot: the share of crimes committed by migrants is 4 times higher their population share 26,2% 5,8% Migrants’ share on total population Share of migrants’ crimes on total crimes 20 Source: ISTAT, 2008
  • 21.
    Delinquency rates Despite theabsolute number of crimes being high, migrants’ delinquency rate has decreased sharply Migrants’ delinquency rate 5.3% 3.5% 2.2% 2000 2003 2006 Source: ISTAT This suggests that the majority of migrants that come to Italy are not criminal, but people looking for better opportunities 21
  • 22.
    Do migrants increasecriminality? 4.50% 5000 Crimes every 100.000 ctizens 4.00% Migrants' share of population 3.50% 4000 3.00% 3000 2.50% 2.00% 2000 1.50% 1.00% 1000 0.50% 0 0.00% Source: ISTAT, 1991 1992 1993 1994 1995 1996 1997 1998 1999 2000 2001 2002 2003 2004 2005 2006 2007 Home Office In the last 15 years despite a sharp increase in migrants, the total number of crimes didn’t increase significantly. The number of crimes in 1996 and 2003, or in 1991 and 2007, is very similar. Econometric studies of the Bank of Italy show that there is no causal link between increase in migration and increase in crimes. 22
  • 23.
    So, no problemson migrants and crimes? The high delinquency rate among migrants creates problems of integration. But the point is: do Italian citizens care about reducing the overall number of crimes or the crimes committed by migrants? If the overall number of crimes is the issue, then a restrictive or repressive attitude towards migration is not the right answer. An effective action on the roots that favor criminality in Italy is what really matters. 23
  • 24.
    Migrants, Crime, andMedia (1) Do you agree with the following statement? “migrants increase crime” Not sure, Strongly agree, 16.8% 24.4% Strongly disagree, 8.9% Partly disagree, 16.9% Agree, 33.0% This poll (ISPO, 2003) show that in the Italian public opinion there is a deep-rooted association between migrants and crime. 57% of Italian believe that migration increases criminality. Only 26% believe that this is not true. 24
  • 25.
    Public opinion isstrongly influenced by media 4000 100 90 3500 80 3000 70 2500 60 Crime's News 2000 50 40 1500 30 1000 20 500 10 0 0 1st Sem 2nd Sem 1st Sem 2nd Sem 1st Sem 2nd Sem 1st Sem 2nd Sem Source: Demos, Pavia Observatory 2005 2005 2006 2006 2007 2007 2008 2008 The red line indicates the number of news on crime from the main Italian broadcasters 25
  • 26.
    Public opinion isstrongly influenced by media 4000 100 90 3500 80 3000 70 2500 60 Crime's News 2000 50 40 Actual Crimes 1500 30 1000 20 500 10 0 0 1st Sem 2nd Sem 1st Sem 2nd Sem 1st Sem 2nd Sem 1st Sem 2nd Sem Source: Demos, Pavia Observatory 2005 2005 2006 2006 2007 2007 2008 2008 The blue line represents the actual number of crimes 25
  • 27.
    Public opinion isstrongly influenced by media 4000 100 90 3500 80 3000 70 Crime's News 2500 60 53.1 Actual Crimes 2000 50 50.7 44.2 40 1500 33.8 Crime's 39.8 Perception 30 1000 20 500 10 0 0 1st Sem 2nd Sem 1st Sem 2nd Sem 1st Sem 2nd Sem 1st Sem 2nd Sem Source: Demos, Pavia Observatory 2005 2005 2006 2006 2007 2007 2008 2008 The yellow line captures citizens’ perception of crime 25
  • 28.
    Public opinion isstrongly influenced by media 4000 100 90 3500 80 3000 70 Crime's News 2500 60 53.1 Actual Crimes 2000 50 50.7 44.2 40 1500 33.8 Crime's 39.8 Perception 30 1000 20 500 10 0 0 1st Sem 2nd Sem 1st Sem 2nd Sem 1st Sem 2nd Sem 1st Sem 2nd Sem Source: Demos, Pavia Observatory 2005 2005 2006 2006 2007 2007 2008 2008 We can see that the media bombardment on crime leads to an increase of crime’s perception from 34% to 53% without an actual increase in the number of crimes 25
  • 29.
    Conclusions This presentation suggeststhat migration is an important resource for Italy. This does not mean that migration is unproblematic or that we should open our borders indiscriminately. Migration is a resource that needs to be managed, programmed and regulated properly. We need a forward-looking policy grounded on sound data, not on ideologies, that enhances the positive sides of migration and minimize the negative ones. 26
  • 30.
    Literary Conclusion: Migrationand Culture From Massimo Montanari’s book “Food as a Culture”: “Often we oppose migration to defend our cultural roots. But the roots of trees, under ground, bifurcate going very far from the tree. They take unpredictable paths and lead to different points, sometimes remote. Think about the meal course “Spaghetti al Pomodoro”, our typical national dish and an Italian brand all over the world. Well, the roots of this meal are not Italian at all. The invention of Spaghetti is disputed between Chinese and Arab, we made it our only by getting in touch with these civilizations. Tomato is not an Italian plant, not even European, but it was taken from America…” 27
  • 31.
    Thanks! If you likedit, forward the link to you friends and sustain our project! Authors: fadi.hassan@quattrogatti.info | luigi.minale@quattrogatti.info Contacts: quattrogatti@quattrogatti.info | @_quattrogatti | facebook.com/quattrogatti.info