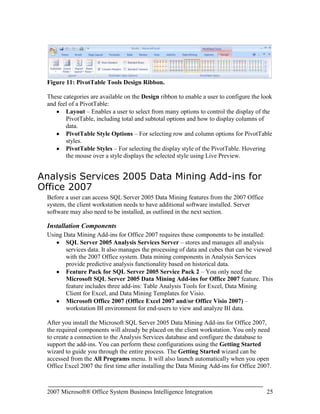
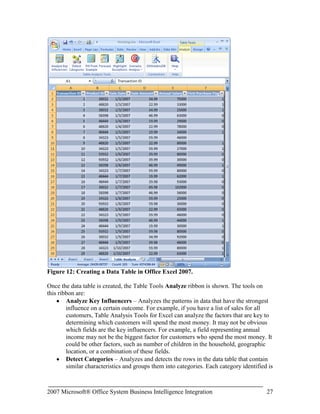
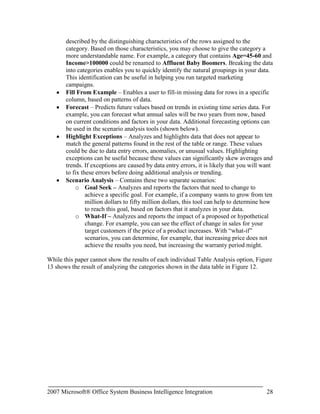
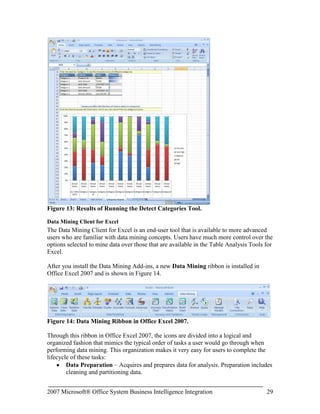
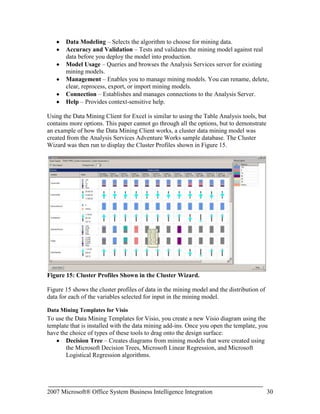
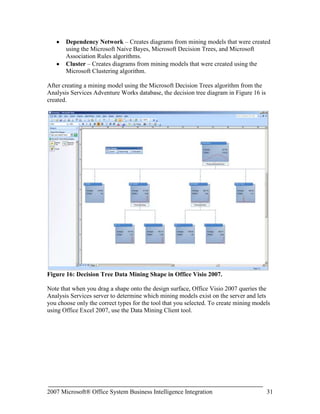
2007 Microsoft® Office System Business Intelligence Integration<br />White Paper<br />Published: February 1, 2007<br />Author: Anthony T. Mann, PresidentMann Publishing Group<br />For the latest information, please see:<br />http://www.microsoft.com/sql/<br />http://www.microsoft.com/BI<br />Contents<br /> TOC \h \z \t \"
Heading 4,1,Heading 5,2,Heading 6,3\"
 Overview PAGEREF _Toc158050607 \h 3<br />Introduction PAGEREF _Toc158050608 \h 3<br />The Microsoft Vision for Business Intelligence PAGEREF _Toc158050609 \h 4<br />Analyzing Business Data PAGEREF _Toc158050610 \h 5<br />The BI Platform PAGEREF _Toc158050611 \h 5<br />The End-User Tools PAGEREF _Toc158050612 \h 6<br />Reporting Services 2005 and Office SharePoint Server 2007 PAGEREF _Toc158050613 \h 6<br />Analysis Services 2005 and Office Excel 2007 PAGEREF _Toc158050614 \h 7<br />Microsoft SQL Server 2005 Data Mining Add-ins for Office 2007 PAGEREF _Toc158050615 \h 8<br />Microsoft SQL Server 2005 Reporting Services and Microsoft Office SharePoint Server 2007 PAGEREF _Toc158050616 \h 8<br />Office SharePoint Server 2007 Integration Features and Benefits PAGEREF _Toc158050617 \h 8<br />Integration with Report Center PAGEREF _Toc158050618 \h 9<br />Selecting the Right Mode PAGEREF _Toc158050619 \h 11<br />Native Mode PAGEREF _Toc158050620 \h 11<br />SharePoint Integration Mode PAGEREF _Toc158050621 \h 11<br />Installation Components and Setup PAGEREF _Toc158050622 \h 12<br />Report Server Configuration PAGEREF _Toc158050623 \h 12<br />SharePoint Server Configuration PAGEREF _Toc158050624 \h 13<br />Creating Reports PAGEREF _Toc158050625 \h 14<br />Developers PAGEREF _Toc158050626 \h 15<br />End-Users PAGEREF _Toc158050627 \h 15<br />Viewing Reports PAGEREF _Toc158050628 \h 16<br />Managing Reports PAGEREF _Toc158050629 \h 17<br />Microsoft SQL Server 2005 Analysis Services and Microsoft Office Excel 2007 PAGEREF _Toc158050630 \h 19<br />Microsoft Office Excel 2007 Integration Features and Benefits PAGEREF _Toc158050631 \h 20<br />Installation Components and Setup PAGEREF _Toc158050632 \h 23<br />Using Office Excel 2007 with Analysis Services PAGEREF _Toc158050633 \h 23<br />Analysis Services 2005 Data Mining Add-ins for Office 2007 PAGEREF _Toc158050634 \h 25<br />Installation Components PAGEREF _Toc158050635 \h 25<br />Using Data Mining Add-ins PAGEREF _Toc158050636 \h 26<br />Table Analysis Tools for Excel PAGEREF _Toc158050637 \h 26<br />Data Mining Client for Excel PAGEREF _Toc158050638 \h 29<br />Data Mining Templates for Visio PAGEREF _Toc158050639 \h 30<br />Conclusion PAGEREF _Toc158050640 \h 32<br />Appendix - SQL Server 2005 Editions PAGEREF _Toc158050641 \h 33<br />Overview<br />Business Intelligence (BI) just became a lot easier! The release of the 2007 Microsoft® Office system, used in conjunction with Microsoft® SQL Server 2005, delivers numerous benefits in terms of Return on Investment (ROI) for a company, design and implementation for its Information Technology (IT) department, and ease of use for end-users.<br />According to the research firm IDC, Microsoft’s BI tools are growing at more than twice the rate of the overall market. Microsoft technologies are at the forefront of the BI market and are continuing to grow in breadth and capabilities. This paper discusses the important drivers, reasons, and technology features when integrating SQL Server 2005 and the 2007 Office system. To keep this paper as brief as possible, it references some additional Web sites that you can visit for more information.<br />This paper is divided into two main sections. The first shows an overview of the three main BI integration points between Microsoft SQL Server 2005 and the 2007 Microsoft Office system:<br />Microsoft® SQL Server™ 2005 Reporting Services and Microsoft® Office SharePoint® Server 2007
Microsoft® SQL Server™ 2005 Analysis Services and Microsoft® Office Excel® 2007
Microsoft SQL Server 2005 Data Mining Add-Ins for Office 2007The second part of the paper breaks down each of the above integration points by showing what software components are needed, features and benefits, how to install and configure the components, and how to use them.<br />Introduction<br />Business Intelligence is considered by some to be an elusive and mysterious technology. Users who think that BI is too difficult may be reluctant to use it. Businesses that think BI is too expensive may never implement it. When using Microsoft technologies, these fears become moot. SQL Server 2005 provides an enterprise-ready BI platform (the “hard” part of BI) while the 2007 Office system provides familiar front-end tools for end-users to easily access data from the BI platform of SQL Server 2005. In many cases, comprehensive BI solutions can be developed, deployed, and used in a matter of hours or days, instead of weeks, months, or years.<br />This section introduces Microsoft’s vision for Business Intelligence, the keys to analyzing business data, and an overview of the Business Intelligence technologies available in SQL Server 2005.<br />The Microsoft Vision for Business Intelligence<br />Microsoft’s vision for BI is to: <br />“Improve organizations by providing business insights to all employees leading to better, faster, more relevant decisions”<br />Many BI vendors aim to enable employees to make better, faster, and more relevant decisions, but Microsoft’s vision is to extend this statement to all employees – not just business analysts, financial analysts, or executives. Every employee needs to make business decisions every day. However, the impact and scope of those decisions differ. For example, an executive has to make decisions on whether to acquire a competitor. On the other hand, a product manager has to decide how to price products. The list of decisions, whether conscious or not, is endless, so employees need help from software. <br />Microsoft tackles the challenge of making BI accessible to all employees by addressing key issues to enable them to have the right information at the right time in the right format:<br />Total Cost of Ownership (TCO) is too high – By building BI into the core SQL Server platform, TCO is low. This covers all aspects of total cost, including software, tools, development, installation, uptime, maintenance, support, and training.
BI tools are too difficult to use – By enabling the 2007 Microsoft Office system as one of the end-user tools, employees can access and analyze BI information using tools they already have on their desktops and already know how to use.
Complete offering – Microsoft offers a complete end-to-end solution to ensure that all employees have access to BI data, including:
SQL Server database platform – Platform for database and application designers, developers, and network administrators. This same platform that runs an organization’s Line of Business applications offers high scale data warehousing. The platform can leverage built-in BI features, such as Analysis Services, Reporting Services, and Integration Services. All BI technologies are tightly integrated into the Microsoft Visual Studio® development environment for software developers and designers.
2007 Microsoft Office system – End-user tools for general users and business executives that enable access to business insight from every desktop.
Performance management applications – Delivered with Microsoft® Office PerformancePoint™ Server 2007 for end-users and business executives. Office PerformancePoint Server 2007 is designed to help improve performance by integrating monitoring, analysis, and planning into a single application.This paper focuses on the integration between the 2007 Office system and the SQL Server 2005 back-end BI technologies. The goal is to show how simple it is to bring BI to every desktop in every organization. In most cases, a few simple mouse clicks put information into the hands of even the most skeptical and novice users.<br />Analyzing Business Data<br />Businesses need to constantly analyze their efficiency and profitability to streamline their operations. The only way to adequately do this is to analyze the Line of Business (LOB) data to find answers to questions like:<br />Which products/services are the most profitable and what factors determine their profitability?
How can non-profitable products/services become profitable?
How well are customer service programs operating?
How effective are business processes, including sales cycles, fulfillment timeliness, customer satisfaction, and employee retention? There are two key parts in using technology to help businesses analyze their business data to answer the questions presented above – the BI platform and the end-user tools.<br />The BI Platform<br />The back-end BI platform performs complex calculations and analytics. SQL Server 2005 forms the core of the Microsoft Business Intelligence platform, enabling end-users to analyze their consolidated enterprise data through the 2007 Office system. SQL Server 2005 is a complete BI platform that includes these technologies:<br />SQL Server Relational Database – Technology that provides a robust, scalable, and enterprise-ready Data Warehouse platform. SQL Server 2005 has substantial enhancements in partitioning, manageability, and query optimizations to streamline data warehouse operations and increase performance. Additional information about data warehousing can be found at the Microsoft Web site at: http://www.microsoft.com/sql/solutions/dw/default.mspx.
SQL Server Analysis Services – Technology that enables businesses to analyze its corporate data by using Online Analytical Processing (OLAP). Analysis Services includes advanced analytical features such as complete data mining and key performance indicator frameworks, enabling organizations to accommodate multiple analytic needs within one solution. Additional information about Analysis Services can be found throughout this paper and from the Microsoft Web site at:http://www.microsoft.com/sql/technologies/analysis/overview.mspx and http://www.microsoft.com/sql/technologies/dm/default.mspx<br />SQL Server Reporting Services – Technology that serves as a complete reporting platform so that end-users can view data using a Web browser or custom application. Reporting Services includes report authoring tools for software developers and end-users themselves. More information about Reporting Services can be found throughout this paper and from the Microsoft Web site at: http://www.microsoft.com/sql/technologies/reporting/default.mspx.<br />SQL Server Integration Services – Technology that can be used to move and transform data between sources and destinations, regardless of format. It can also cleanse data and ensure data integrity to allow organizations to integrate heterogeneous data sources when building data warehouse solutions. Integration Services is not the focus of this paper, but more information can be found on the Microsoft Web site at:http://www.microsoft.com/sql/technologies/integration/default.mspx.<br />The SQL Server Business Development Studio is a common, Visual Studio-based development environment that extends across all of the SQL Server BI technologies. The familiar Visual Studio environment provides great developer productivity and is optimized to provide a true application development environment that supports the full project development lifecycle.<br />The End-User Tools<br />End-user tools are used by employees to access and analyze complex business data stored on the BI platform. The new release of the 2007 Office system has been optimized to make it very easy for users to access the server-based data hosted on the BI platform. End-users can use a familiar desktop environment to enable them to be more productive without learning new software. <br />In addition to the 2007 Microsoft Office system for end-user analysis, the end-to-end BI solution from Microsoft also includes Microsoft Office PerformancePoint Server 2007. Office Performance Point Server is an integrated performance management application that helps organizations drive alignment across the enterprise, while allowing business executives and end-users to monitor, analyze, and plan key business activities. <br />Even though this paper focuses on the capabilities of the 2007 Office system, it is important to note that this is not the only Microsoft offering for accessing BI data on the SQL Server platform. Additional details on the components of the complete Microsoft BI offering can be found at: http://www.microsoft.com/BI/default.mspx.<br />Reporting Services 2005 and Office SharePoint Server 2007<br />SQL Server 2005 Service Pack 2 (SP2) enables deep integration between Reporting Services and the Microsoft SharePoint technologies (Windows SharePoint Services 3.0 and Office SharePoint Server 2007). This integration enables an end-user to view and manage reports completely from within a SharePoint document library.<br />Integrating Reporting Services with Office SharePoint Server 2007 is referred to as SharePoint Integration Mode. Having Reporting Services host reports in the reporting services database only and not integrating with Office SharePoint Server 2007 is referred to as Native Mode.<br />Additional information about integration mode and native mode, specific integration features between Reporting Services 2005 and Office SharePoint Server 2007, installation and configuration, and the usage of Reporting Services 2005 is discussed in the second part of this paper.<br />Analysis Services 2005 and Office Excel 2007 <br />The release of Office Excel 2007 greatly enhances a user’s ability to access and analyze data from SQL Server 2005 Analysis Services. With Office Excel 2007, end-users can browse data stored in multidimensional OLAP cubes in Analysis Services. Office Excel 2007 enables users to easily build PivotTable views to “slice and dice” data any way they wish. Figure 1 shows a PivotTable™ in Office Excel 2007 that connects to Analysis Services sample data.<br />Figure 1: PivotTable in Office Excel 2007.<br />Using Office Excel 2007 to access Analysis Services data is significantly easier than it was with prior versions of Excel. With only a couple of mouse clicks, the PivotTable Field List exposes a user-friendly metadata layer of Analysis Services to the end-user (see Figure 1). The PivotTable Field List enables end-users to quickly select important business data that they want to include in the PivotTable for further analysis.<br />Additional information about the specific features that enrich the end-user analysis experience, installation, configuration, and using Office Excel 2007 with Analysis Services 2005 is discussed in the second part of this paper.<br />Microsoft SQL Server 2005 Data Mining Add-ins for Office 2007<br />It can be quite easy to write a report to view any data metrics that you are looking for. For example, if you want to view all sales in a given fiscal year grouped by division and quarter, this would be a very simple report to create. Using Reporting Services, you could create and deploy such a report in a matter of only minutes. Developers can also quickly create an Analysis Services cube that can be browsed by end-users to display this type of data. <br />However, what if you didn’t know what you were looking for? What if there was a way to spot trends in data that you didn’t even know existed? That’s where data mining comes into play. Data mining uses machine learning algorithms to analyze existing data and to build models that represent the patterns found in the data. This technology alone can help increase a company’s bottom-line and become more efficient.<br />The Data Mining Add-ins for Office 2007 is comprised of three separate components:<br />Table Analysis Tools for Excel –Allows you to analyze your spreadsheet data in powerful ways with just a few mouse clicks, by employing SQL Server Data Mining behind the scenes.<br />Data Mining Client for Excel – Enables you to create and manage the entire lifecycle of a data mining project, including preparing data, building and managing mining models, and predicting results. <br />Data Mining Templates for Visio – Enables you to render graphical Visio diagrams to communicate the results of data mining operations to others in your company.<br />Additional information about specific features, installation and configuration, and using the data mining add-ins is discussed in the second part of this paper.<br />Microsoft SQL Server 2005 Reporting Services and Microsoft Office SharePoint Server 2007 <br />The first part of this paper gave you an overview of integrating Reporting Services and Office SharePoint Server 2007. Integration between Reporting Services and Office SharePoint Server 2007 is simple to implement, but requires some configuration before it will work. You must install specific components on the Reporting Services and Office SharePoint server 2007. Then, you must configure each server. This part of the paper dives into the details to show the benefits of integrating the two products and the configurations needed to perform the integration.<br />Office SharePoint Server 2007 Integration Features and Benefits<br />There are numerous benefits and advantages to integrating Reporting Services with Office SharePoint Server 2007. Prior to SP2, Reporting Services reports were published to a report server and were executed solely in that environment. The integration point between Reporting Services and SharePoint was two separate Web Parts: Report Explorer and Report Viewer. These Web Parts made it possible to view reports within SharePoint, but presented these challenges:<br />The report content source was always separate from the SharePoint content source.<br />Reports were hosted on a report server and were only displayed within the SharePoint environment.<br />Security of reports was managed by the report server, so there was no unified security model.<br />The user interface was not consistent between managing and viewing reports because each was performed in a separate environment.<br />Filtering of report data could only be done by using report parameters that had to be defined in the reports themselves.<br />Internet-facing SharePoint sites required deploying the report server outside the firewall.<br />With SQL Server 2005 SP2, deep integration with Office SharePoint Server 2007 offers numerous advantages, including:<br />Single consistent user interface for managing and viewing reports.<br />A much richer user experience.<br />Storing reports in Office SharePoint Server 2007 document libraries. This allows a report to use standard Office SharePoint Server 2007 features, such as workflow, versioning, and collaboration.<br />Reports and all associated resources are stored within the Office SharePoint Server 2007 database and are automatically synchronized with the same reports that are stored and executed from the report server. Scheduling, caching, and subscriptions are stored in the report server database only because this functionality is not available natively in a SharePoint document library.<br />Single security model for reports because they are treated like any other document inside a SharePoint document library.<br />Common report filtering paradigm that is used in SharePoint document libraries and filtering Web Parts.<br />Integration with Report Center<br />While Reporting Services reports can be managed in any site or document library, Office SharePoint Server 2007 includes out of the box functionality for reporting, referred to as the Report Center. Report Center is delivered as a site template to enable you to easily create an Office SharePoint Server 2007 site for hosting reports. When you create a site using this template, navigation bar links are added to manage reporting resources, as shown in Figure 2. Figure 2 also shows a sample dashboard with defined Key Performance Indicators (KPIs).<br />Figure 2: Navigation Bar Links Highlighting New Resources Category.<br />The navigation bar links in the Report Center site template are:<br />Documents – Document library to store a collection of documents.<br />Reports – Document library that can be used for managing Reporting Services and Excel Services reports.<br />Dashboards – Listing of all dashboards that you can configure for your users. For example, you can have one dashboard that shows executives the report KPIs that are useful to them. However, project managers need to see more detailed information about their projects, so they would need a different dashboard with different KPIs.<br />Resources – Folder containing these types of resources that can be used with Reporting Services reports:<br />Data Connections – Document library that contains shared data sources and/or report models that can be used among all reports.<br />Report Calendar – Calendar list that can contain any date-related information for a report or report schedule. For example, you can indicate on which dates report data is refreshed or loaded. This item has no specific integration points with Reporting Services. <br />Reference Library – Document library for you to place documents that can help end-users with the navigation and usage of the report center. This item has no specific integration points with Reporting Services.<br />Having resources stored in separate document libraries enables you to configure versioning, workflow, and security separately for each resource. For example, you can configure security to only allow members of the IT department to modify or upload data connections. Likewise, you can configure workflow in Office SharePoint Server 2007 to require approval for new reports.<br />Selecting the Right Mode<br />SQL Server 2005 Reporting Services can operate in either Native Mode or SharePoint Integration Mode. As Reporting Services supports multiple instances, you also have the option of using both modes simultaneously on a single server. This section outlines some considerations you should think about to help determine which mode to use in your organization.<br />Native Mode<br />The term Native Mode in Reporting Services 2005 Service Pack 2 refers to the existing way that Reporting Services operates. The report server is responsible for management of all Reporting Services functionality, including report storage, rendering, scheduling, subscriptions, security, and administration. Reports, data sources, and report models are all stored in the report server database.<br />Native Mode is appropriate for any organization that does not implement Windows SharePoint Services 3.0 or Office SharePoint Server 2007, or does not need the added functionality of Integration Mode (see next section). If your organization uses Windows SharePoint Services 2.0 or SharePoint Portal Server 2003, you will not be able to leverage the additional productivity and security features of Integration Mode until you upgrade to Windows SharePoint Services 3.0 or SharePoint Portal Server 2007.<br />SharePoint Integration Mode<br />Using Reporting Services 2005 in SharePoint Integration Mode enables some significant benefits to the end-user and the organization as a whole, as follows:<br />Uses SharePoint document libraries to store reports, data sources, and report models.
Enables publishing, viewing, management, and delivery of Reporting Services reports from the same user interface used for managing Office documents.
Enables organizations to construct BI dashboards with rich reports.
Leverages workflow and collaboration capabilities that are already available in Office SharePoint Server 2007.When using SharePoint Integration Mode, some features that are available in Native Mode are replaced with comparable functionality in Office SharePoint Server 2007 or are no longer available. The Reporting Services features that are not available in Integration Mode are: <br />Report Manager
Management Studio
My Reports
Linked Reports
Job ManagementNote: There is no support for migrating native mode reports to SharePoint integration mode. You can use those reports, but you must manually republish them to the Office SharePoint Server 2007. <br />Installation Components and Setup<br />Integrating Reporting Services with Office SharePoint Server 2007 requires these components to be installed:<br />SQL Server 2005 Reporting Services – hosts Reporting Services reports and communicates with Office SharePoint Server 2007 using a Web Services interface. The Reporting Services server also manages subscriptions and report caching. This server can be separate from the Office SharePoint Server 2007, but if it is, you must also do a basic install of Office SharePoint Server 2007 on the Reporting Services server to ensure that the Windows SharePoint Services (WSS) 3.0 object model is installed.<br />SQL Server 2005 Service Pack 2 – enables Office SharePoint Server 2007 and Reporting Services integration on the report server.<br />Office SharePoint Server 2007 –Serves as the central access point for all reports and business data. Alternately, you can use Windows SharePoint Services 3.0.<br />Microsoft SQL Server 2005 Reporting Services Add-in for Microsoft SharePoint Technologies - This feature includes the Report Viewer Web Part and the new report management user interface.<br />After installing the required components to integrate Reporting Services with Office SharePoint Server 2007, both the report server and SharePoint server need to be configured. The following sections outline the configurations necessary to achieve integration.<br />Report Server Configuration<br />After installing SQL Server 2005 Service Pack 2 on the Reporting Services server, a new configuration option becomes available, called SharePoint Integration, as shown in Figure 3.<br />Figure 3: Configuring Report Server SharePoint Integration.<br />SharePoint Server Configuration<br />After installing the Microsoft SQL Server 2005 Reporting Services Add-in for Microsoft SharePoint Technologies feature of the Feature Pack for SQL Server 2005 Service Pack 2, a new application becomes available under the Application Management tab. This new application is shown in Figure 4.<br />Figure 4: Configuring the Reporting Services Application in Office SharePoint Server 2007.<br />To configure Reporting Services, you must set each of the options shown in Figure 4, as follows:<br />Manage integration settings – To configure the Report Server Web Service URL and Authentication Mode (either Windows or other trusted account).<br />Grant database access – To configure the name of the report server database server instance name.<br />Set server defaults – To configure report server timeouts and other options.<br />Creating Reports<br />Once Reporting Services and Office SharePoint Server 2007 integration is setup, reports can be created and deployed to the Office SharePoint Server 2007. Creation of reports can be done in one of two ways: one for developers and one for end-users. Each is discussed in the following sections.<br />Developers<br />Developers use Visual Studio®-based SQL Server Business Intelligence Development Studio to create reports. After installing the SQL Server 2005 workstation components, many business intelligence project templates become available, as shown in Figure 5.<br />Figure 5: Visual Studio 2005 Business Intelligence Project Types.<br />Note in Figure 5 that Report Model Project is selected. A Report Model is a way to define the data which can be used by end-users to create reports (see next section). Alternatively, developers can create a blank Report Server Project or use the Report Server Project Wizard to help guide the user through the process of creating reports and specifying data sources.<br />End-Users<br />End-Users can create reports as well as developers, but a developer must first make the data available to those users. Making data available is done using a Report Model. A Report Model defines the data source of a report, the security parameters for the data source, and the tables, fields, and relationships used for the model. This model is then published to an Office SharePoint Server 2007.<br />Once the Report Model is published to the Office SharePoint Server 2007, end-users can create reports using Report Builder. This is a ClickOnce application that is downloaded automatically from the Office SharePoint Server 2007 and installed as a component on the user’s workstation. Report Builder enables the end-user to create and publish reports to the Office SharePoint Server 2007 using the Report Model that the developer created. Figure 6 shows the Report Builder tool.<br />Figure 6: Designing Reports in Report Builder.<br />Viewing Reports<br />Once reports are created and deployed to the Office SharePoint Server 2007, they are ready to be viewed. Report security is set the same way it is for any SharePoint document. You can set security permissions on libraries, folders, or individual files.<br />If a user navigates to a report in a report library on the Office SharePoint Server 2007, the reports can be viewed simply by clicking the desired file name. The integration components know how to connect to the report server Web Service to render the report from within the Office SharePoint Server 2007 environment. Figure 7 shows a rendered report in Office SharePoint Server 2007.<br />Figure 7: Rendered Report within the Office SharePoint Server 2007 Environment.<br />Reports in a report library are rendered using a Report Viewer Web Part. Any SharePoint page can also be modified to display reports by using the Report Viewer Web Part. Report Viewer Web Parts can also be connected to SharePoint Filter Web Parts to limit the data displayed in reports.<br />Managing Reports<br />When Reporting Services is integrated with Office SharePoint Server 2007, report management is then performed using the same SharePoint document library as the one used to launch reports. Managing reports is as simple as navigating to the correct report in the SharePoint document library and clicking the down arrow. The user is presented with a host of options, as shown in Figure 8.<br /> <br />Figure 8: Managing Reports in Office SharePoint Server 2007.<br />Figure 8 shows these possible report management actions:<br />View Properties – Standard Office SharePoint Server 2007 functionality to view document properties. Organizations can employ standardization for properties that will be used in reports, such as including categories, sub-categories, timestamps, approvals, and more.
Edit Properties – Standard Office SharePoint Server 2007 functionality to edit document properties. SharePoint Office Server 2007 can be configured to make properties mandatory. This can enable organizations to provide valid metadata for each report in the report library.
Manage Permissions – Standard Office SharePoint Server 2007 functionality to manage the permissions of the document. This is one of the main benefits of integrating Reporting Services with Office SharePoint Server 2007. A common security model is used to secure reports, folders, files, and libraries. System Administrators can easily assign security and troubleshoot report execution problems.
Edit in Report Builder – Reporting Services functionality to launch the Report Builder tool to edit the definition of the report (see Figure 6). Report Builder enables end-users to easily modify or create reports and publish them to the Office SharePoint Server 2007.
Delete – Standard Office SharePoint Server 2007 functionality to delete the document from the document library.
Manage Subscriptions – Reporting Services functionality to add, edit, and delete report subscriptions. Users that subscribe to reports can automatically be notified when data changes in reports. For example, sales people can subscribe to a report to automatically receive their weekly sales figures via email.
Manage Data Sources – Reporting Services functionality to select a shared or custom data source for the report. Shared data sources enable one data source definition to be used across multiple reports.
Manage Parameters – Reporting Services functionality to manage the values and prompts for all parameters passed into the report. Parameters are a way to limit the data that is displayed in a report. For example, a report parameter named Year can be specified to limit the report data to the selected year when the report is run.
Manage Processing Options – Reporting Services functionality to choose processing and snapshot options and timeouts. Snapshots and timeouts affect the performance of the Reporting Services server. It is important to consider these options to keep the server performing as well as possible.
View Report History – Reporting Services functionality to view the history of report processing.
Send To – Standard Office SharePoint Server 2007 functionality to send the document to another location.
Check Out – Standard Office SharePoint Server 2007 functionality to check out the document in order to publish changes. The ability to check out, and then publish a report, data source, or data model is one of the major advantages to integrating Reporting Services with Office SharePoint Server 2007. A report, or any other document, can be checked out, modified, and have workflow optionally applied to the document before it is published back into the Office SharePoint Server 2007.
Publish a Major Version – Standard Office SharePoint Server 2007 functionality to publish a version of a checked-out document. When significant changes to a document occur, it can be helpful to flag the document as a major version so that users have an indication as to the scope of changes in the document. A major version uses the format of version 1.x, 2.x, 3.x, etc.
Version History – Standard Office SharePoint Server 2007 functionality to view the published versions of a document.
Alert Me – Standard Office SharePoint Server 2007 functionality to alert a user to changes in the document. This option notifies a user when there is a change to the report definition itself, as opposed to the data being changed in a report.Microsoft SQL Server 2005 Analysis Services and Microsoft Office Excel 2007 <br />Analysis Services enables companies to build and deploy cubes to analyze enterprise-wide data. Analysis Services cubes are built by developers and published to an Analysis Services server to consolidate, aggregate, and instantly present complex business data to end-users in meaningful ways. Using Office Excel 2007 these users can easily create PivotTable views to analyze the data that pertains to them. For example, an executive can quickly and easily create a PivotTable in Office Excel 2007 to view all sales by division, and by quarter. However, if the executive wants to drill-down into the details that make up those sales, no recalculation or additional work has to take place. This is because the Analysis Services cube already contains detail and pre-aggregated data that is accessible to the end-user.<br />Using the familiar Excel environment, a user can leverage Analysis Services data to quickly and easily analyze critical business data. In only minutes, the features of Office Excel 2007 make it possible to create professional-looking reports of complex Analysis Services data.<br />Microsoft Office Excel 2007 Integration Features and Benefits<br />In SQL Server 2005 SP2 Analysis Services is designed to work seamlessly with Office Excel 2007 to provide end-users with a rich analysis experience. SQL Server 2005 Analysis Services and Office Excel 2007 each contain too many features and benefits to list in this one paper, but the following features specifically come to life as results of the enhanced interoperability points between the two products:<br />Get External Data – A new enhancement introduced with Office Excel 2007 to allow end-users to leverage predefined data source connections to eliminate the complexity of connecting to external data sources. This feature is not specific to connecting solely to Analysis Services, but is included here due to the major impact this poses on a business’ ability to enable more users than ever to access data. The benefit of connecting to Analysis Services data using existing connections is that users no longer need to know anything about the server, the data sources, or the connection strings required to create a connection to the back-end data.

SQL Server 2005 Everywhere Edition Value Proposition

  • 1.
    2007 Microsoft® OfficeSystem Business Intelligence Integration<br />White Paper<br />Published: February 1, 2007<br />Author: Anthony T. Mann, PresidentMann Publishing Group<br />For the latest information, please see:<br />http://www.microsoft.com/sql/<br />http://www.microsoft.com/BI<br />Contents<br /> TOC \h \z \t \" Heading 4,1,Heading 5,2,Heading 6,3\" Overview PAGEREF _Toc158050607 \h 3<br />Introduction PAGEREF _Toc158050608 \h 3<br />The Microsoft Vision for Business Intelligence PAGEREF _Toc158050609 \h 4<br />Analyzing Business Data PAGEREF _Toc158050610 \h 5<br />The BI Platform PAGEREF _Toc158050611 \h 5<br />The End-User Tools PAGEREF _Toc158050612 \h 6<br />Reporting Services 2005 and Office SharePoint Server 2007 PAGEREF _Toc158050613 \h 6<br />Analysis Services 2005 and Office Excel 2007 PAGEREF _Toc158050614 \h 7<br />Microsoft SQL Server 2005 Data Mining Add-ins for Office 2007 PAGEREF _Toc158050615 \h 8<br />Microsoft SQL Server 2005 Reporting Services and Microsoft Office SharePoint Server 2007 PAGEREF _Toc158050616 \h 8<br />Office SharePoint Server 2007 Integration Features and Benefits PAGEREF _Toc158050617 \h 8<br />Integration with Report Center PAGEREF _Toc158050618 \h 9<br />Selecting the Right Mode PAGEREF _Toc158050619 \h 11<br />Native Mode PAGEREF _Toc158050620 \h 11<br />SharePoint Integration Mode PAGEREF _Toc158050621 \h 11<br />Installation Components and Setup PAGEREF _Toc158050622 \h 12<br />Report Server Configuration PAGEREF _Toc158050623 \h 12<br />SharePoint Server Configuration PAGEREF _Toc158050624 \h 13<br />Creating Reports PAGEREF _Toc158050625 \h 14<br />Developers PAGEREF _Toc158050626 \h 15<br />End-Users PAGEREF _Toc158050627 \h 15<br />Viewing Reports PAGEREF _Toc158050628 \h 16<br />Managing Reports PAGEREF _Toc158050629 \h 17<br />Microsoft SQL Server 2005 Analysis Services and Microsoft Office Excel 2007 PAGEREF _Toc158050630 \h 19<br />Microsoft Office Excel 2007 Integration Features and Benefits PAGEREF _Toc158050631 \h 20<br />Installation Components and Setup PAGEREF _Toc158050632 \h 23<br />Using Office Excel 2007 with Analysis Services PAGEREF _Toc158050633 \h 23<br />Analysis Services 2005 Data Mining Add-ins for Office 2007 PAGEREF _Toc158050634 \h 25<br />Installation Components PAGEREF _Toc158050635 \h 25<br />Using Data Mining Add-ins PAGEREF _Toc158050636 \h 26<br />Table Analysis Tools for Excel PAGEREF _Toc158050637 \h 26<br />Data Mining Client for Excel PAGEREF _Toc158050638 \h 29<br />Data Mining Templates for Visio PAGEREF _Toc158050639 \h 30<br />Conclusion PAGEREF _Toc158050640 \h 32<br />Appendix - SQL Server 2005 Editions PAGEREF _Toc158050641 \h 33<br />Overview<br />Business Intelligence (BI) just became a lot easier! The release of the 2007 Microsoft® Office system, used in conjunction with Microsoft® SQL Server 2005, delivers numerous benefits in terms of Return on Investment (ROI) for a company, design and implementation for its Information Technology (IT) department, and ease of use for end-users.<br />According to the research firm IDC, Microsoft’s BI tools are growing at more than twice the rate of the overall market. Microsoft technologies are at the forefront of the BI market and are continuing to grow in breadth and capabilities. This paper discusses the important drivers, reasons, and technology features when integrating SQL Server 2005 and the 2007 Office system. To keep this paper as brief as possible, it references some additional Web sites that you can visit for more information.<br />This paper is divided into two main sections. The first shows an overview of the three main BI integration points between Microsoft SQL Server 2005 and the 2007 Microsoft Office system:<br />Microsoft® SQL Server™ 2005 Reporting Services and Microsoft® Office SharePoint® Server 2007
  • 2.
    Microsoft® SQL Server™2005 Analysis Services and Microsoft® Office Excel® 2007
  • 3.
    Microsoft SQL Server2005 Data Mining Add-Ins for Office 2007The second part of the paper breaks down each of the above integration points by showing what software components are needed, features and benefits, how to install and configure the components, and how to use them.<br />Introduction<br />Business Intelligence is considered by some to be an elusive and mysterious technology. Users who think that BI is too difficult may be reluctant to use it. Businesses that think BI is too expensive may never implement it. When using Microsoft technologies, these fears become moot. SQL Server 2005 provides an enterprise-ready BI platform (the “hard” part of BI) while the 2007 Office system provides familiar front-end tools for end-users to easily access data from the BI platform of SQL Server 2005. In many cases, comprehensive BI solutions can be developed, deployed, and used in a matter of hours or days, instead of weeks, months, or years.<br />This section introduces Microsoft’s vision for Business Intelligence, the keys to analyzing business data, and an overview of the Business Intelligence technologies available in SQL Server 2005.<br />The Microsoft Vision for Business Intelligence<br />Microsoft’s vision for BI is to: <br />“Improve organizations by providing business insights to all employees leading to better, faster, more relevant decisions”<br />Many BI vendors aim to enable employees to make better, faster, and more relevant decisions, but Microsoft’s vision is to extend this statement to all employees – not just business analysts, financial analysts, or executives. Every employee needs to make business decisions every day. However, the impact and scope of those decisions differ. For example, an executive has to make decisions on whether to acquire a competitor. On the other hand, a product manager has to decide how to price products. The list of decisions, whether conscious or not, is endless, so employees need help from software. <br />Microsoft tackles the challenge of making BI accessible to all employees by addressing key issues to enable them to have the right information at the right time in the right format:<br />Total Cost of Ownership (TCO) is too high – By building BI into the core SQL Server platform, TCO is low. This covers all aspects of total cost, including software, tools, development, installation, uptime, maintenance, support, and training.
  • 4.
    BI tools aretoo difficult to use – By enabling the 2007 Microsoft Office system as one of the end-user tools, employees can access and analyze BI information using tools they already have on their desktops and already know how to use.
  • 5.
    Complete offering –Microsoft offers a complete end-to-end solution to ensure that all employees have access to BI data, including:
  • 6.
    SQL Server databaseplatform – Platform for database and application designers, developers, and network administrators. This same platform that runs an organization’s Line of Business applications offers high scale data warehousing. The platform can leverage built-in BI features, such as Analysis Services, Reporting Services, and Integration Services. All BI technologies are tightly integrated into the Microsoft Visual Studio® development environment for software developers and designers.
  • 7.
    2007 Microsoft Officesystem – End-user tools for general users and business executives that enable access to business insight from every desktop.
  • 8.
    Performance management applications– Delivered with Microsoft® Office PerformancePoint™ Server 2007 for end-users and business executives. Office PerformancePoint Server 2007 is designed to help improve performance by integrating monitoring, analysis, and planning into a single application.This paper focuses on the integration between the 2007 Office system and the SQL Server 2005 back-end BI technologies. The goal is to show how simple it is to bring BI to every desktop in every organization. In most cases, a few simple mouse clicks put information into the hands of even the most skeptical and novice users.<br />Analyzing Business Data<br />Businesses need to constantly analyze their efficiency and profitability to streamline their operations. The only way to adequately do this is to analyze the Line of Business (LOB) data to find answers to questions like:<br />Which products/services are the most profitable and what factors determine their profitability?
  • 9.
    How can non-profitableproducts/services become profitable?
  • 10.
    How well arecustomer service programs operating?
  • 11.
    How effective arebusiness processes, including sales cycles, fulfillment timeliness, customer satisfaction, and employee retention? There are two key parts in using technology to help businesses analyze their business data to answer the questions presented above – the BI platform and the end-user tools.<br />The BI Platform<br />The back-end BI platform performs complex calculations and analytics. SQL Server 2005 forms the core of the Microsoft Business Intelligence platform, enabling end-users to analyze their consolidated enterprise data through the 2007 Office system. SQL Server 2005 is a complete BI platform that includes these technologies:<br />SQL Server Relational Database – Technology that provides a robust, scalable, and enterprise-ready Data Warehouse platform. SQL Server 2005 has substantial enhancements in partitioning, manageability, and query optimizations to streamline data warehouse operations and increase performance. Additional information about data warehousing can be found at the Microsoft Web site at: http://www.microsoft.com/sql/solutions/dw/default.mspx.
  • 12.
    SQL Server AnalysisServices – Technology that enables businesses to analyze its corporate data by using Online Analytical Processing (OLAP). Analysis Services includes advanced analytical features such as complete data mining and key performance indicator frameworks, enabling organizations to accommodate multiple analytic needs within one solution. Additional information about Analysis Services can be found throughout this paper and from the Microsoft Web site at:http://www.microsoft.com/sql/technologies/analysis/overview.mspx and http://www.microsoft.com/sql/technologies/dm/default.mspx<br />SQL Server Reporting Services – Technology that serves as a complete reporting platform so that end-users can view data using a Web browser or custom application. Reporting Services includes report authoring tools for software developers and end-users themselves. More information about Reporting Services can be found throughout this paper and from the Microsoft Web site at: http://www.microsoft.com/sql/technologies/reporting/default.mspx.<br />SQL Server Integration Services – Technology that can be used to move and transform data between sources and destinations, regardless of format. It can also cleanse data and ensure data integrity to allow organizations to integrate heterogeneous data sources when building data warehouse solutions. Integration Services is not the focus of this paper, but more information can be found on the Microsoft Web site at:http://www.microsoft.com/sql/technologies/integration/default.mspx.<br />The SQL Server Business Development Studio is a common, Visual Studio-based development environment that extends across all of the SQL Server BI technologies. The familiar Visual Studio environment provides great developer productivity and is optimized to provide a true application development environment that supports the full project development lifecycle.<br />The End-User Tools<br />End-user tools are used by employees to access and analyze complex business data stored on the BI platform. The new release of the 2007 Office system has been optimized to make it very easy for users to access the server-based data hosted on the BI platform. End-users can use a familiar desktop environment to enable them to be more productive without learning new software. <br />In addition to the 2007 Microsoft Office system for end-user analysis, the end-to-end BI solution from Microsoft also includes Microsoft Office PerformancePoint Server 2007. Office Performance Point Server is an integrated performance management application that helps organizations drive alignment across the enterprise, while allowing business executives and end-users to monitor, analyze, and plan key business activities. <br />Even though this paper focuses on the capabilities of the 2007 Office system, it is important to note that this is not the only Microsoft offering for accessing BI data on the SQL Server platform. Additional details on the components of the complete Microsoft BI offering can be found at: http://www.microsoft.com/BI/default.mspx.<br />Reporting Services 2005 and Office SharePoint Server 2007<br />SQL Server 2005 Service Pack 2 (SP2) enables deep integration between Reporting Services and the Microsoft SharePoint technologies (Windows SharePoint Services 3.0 and Office SharePoint Server 2007). This integration enables an end-user to view and manage reports completely from within a SharePoint document library.<br />Integrating Reporting Services with Office SharePoint Server 2007 is referred to as SharePoint Integration Mode. Having Reporting Services host reports in the reporting services database only and not integrating with Office SharePoint Server 2007 is referred to as Native Mode.<br />Additional information about integration mode and native mode, specific integration features between Reporting Services 2005 and Office SharePoint Server 2007, installation and configuration, and the usage of Reporting Services 2005 is discussed in the second part of this paper.<br />Analysis Services 2005 and Office Excel 2007 <br />The release of Office Excel 2007 greatly enhances a user’s ability to access and analyze data from SQL Server 2005 Analysis Services. With Office Excel 2007, end-users can browse data stored in multidimensional OLAP cubes in Analysis Services. Office Excel 2007 enables users to easily build PivotTable views to “slice and dice” data any way they wish. Figure 1 shows a PivotTable™ in Office Excel 2007 that connects to Analysis Services sample data.<br />Figure 1: PivotTable in Office Excel 2007.<br />Using Office Excel 2007 to access Analysis Services data is significantly easier than it was with prior versions of Excel. With only a couple of mouse clicks, the PivotTable Field List exposes a user-friendly metadata layer of Analysis Services to the end-user (see Figure 1). The PivotTable Field List enables end-users to quickly select important business data that they want to include in the PivotTable for further analysis.<br />Additional information about the specific features that enrich the end-user analysis experience, installation, configuration, and using Office Excel 2007 with Analysis Services 2005 is discussed in the second part of this paper.<br />Microsoft SQL Server 2005 Data Mining Add-ins for Office 2007<br />It can be quite easy to write a report to view any data metrics that you are looking for. For example, if you want to view all sales in a given fiscal year grouped by division and quarter, this would be a very simple report to create. Using Reporting Services, you could create and deploy such a report in a matter of only minutes. Developers can also quickly create an Analysis Services cube that can be browsed by end-users to display this type of data. <br />However, what if you didn’t know what you were looking for? What if there was a way to spot trends in data that you didn’t even know existed? That’s where data mining comes into play. Data mining uses machine learning algorithms to analyze existing data and to build models that represent the patterns found in the data. This technology alone can help increase a company’s bottom-line and become more efficient.<br />The Data Mining Add-ins for Office 2007 is comprised of three separate components:<br />Table Analysis Tools for Excel –Allows you to analyze your spreadsheet data in powerful ways with just a few mouse clicks, by employing SQL Server Data Mining behind the scenes.<br />Data Mining Client for Excel – Enables you to create and manage the entire lifecycle of a data mining project, including preparing data, building and managing mining models, and predicting results. <br />Data Mining Templates for Visio – Enables you to render graphical Visio diagrams to communicate the results of data mining operations to others in your company.<br />Additional information about specific features, installation and configuration, and using the data mining add-ins is discussed in the second part of this paper.<br />Microsoft SQL Server 2005 Reporting Services and Microsoft Office SharePoint Server 2007 <br />The first part of this paper gave you an overview of integrating Reporting Services and Office SharePoint Server 2007. Integration between Reporting Services and Office SharePoint Server 2007 is simple to implement, but requires some configuration before it will work. You must install specific components on the Reporting Services and Office SharePoint server 2007. Then, you must configure each server. This part of the paper dives into the details to show the benefits of integrating the two products and the configurations needed to perform the integration.<br />Office SharePoint Server 2007 Integration Features and Benefits<br />There are numerous benefits and advantages to integrating Reporting Services with Office SharePoint Server 2007. Prior to SP2, Reporting Services reports were published to a report server and were executed solely in that environment. The integration point between Reporting Services and SharePoint was two separate Web Parts: Report Explorer and Report Viewer. These Web Parts made it possible to view reports within SharePoint, but presented these challenges:<br />The report content source was always separate from the SharePoint content source.<br />Reports were hosted on a report server and were only displayed within the SharePoint environment.<br />Security of reports was managed by the report server, so there was no unified security model.<br />The user interface was not consistent between managing and viewing reports because each was performed in a separate environment.<br />Filtering of report data could only be done by using report parameters that had to be defined in the reports themselves.<br />Internet-facing SharePoint sites required deploying the report server outside the firewall.<br />With SQL Server 2005 SP2, deep integration with Office SharePoint Server 2007 offers numerous advantages, including:<br />Single consistent user interface for managing and viewing reports.<br />A much richer user experience.<br />Storing reports in Office SharePoint Server 2007 document libraries. This allows a report to use standard Office SharePoint Server 2007 features, such as workflow, versioning, and collaboration.<br />Reports and all associated resources are stored within the Office SharePoint Server 2007 database and are automatically synchronized with the same reports that are stored and executed from the report server. Scheduling, caching, and subscriptions are stored in the report server database only because this functionality is not available natively in a SharePoint document library.<br />Single security model for reports because they are treated like any other document inside a SharePoint document library.<br />Common report filtering paradigm that is used in SharePoint document libraries and filtering Web Parts.<br />Integration with Report Center<br />While Reporting Services reports can be managed in any site or document library, Office SharePoint Server 2007 includes out of the box functionality for reporting, referred to as the Report Center. Report Center is delivered as a site template to enable you to easily create an Office SharePoint Server 2007 site for hosting reports. When you create a site using this template, navigation bar links are added to manage reporting resources, as shown in Figure 2. Figure 2 also shows a sample dashboard with defined Key Performance Indicators (KPIs).<br />Figure 2: Navigation Bar Links Highlighting New Resources Category.<br />The navigation bar links in the Report Center site template are:<br />Documents – Document library to store a collection of documents.<br />Reports – Document library that can be used for managing Reporting Services and Excel Services reports.<br />Dashboards – Listing of all dashboards that you can configure for your users. For example, you can have one dashboard that shows executives the report KPIs that are useful to them. However, project managers need to see more detailed information about their projects, so they would need a different dashboard with different KPIs.<br />Resources – Folder containing these types of resources that can be used with Reporting Services reports:<br />Data Connections – Document library that contains shared data sources and/or report models that can be used among all reports.<br />Report Calendar – Calendar list that can contain any date-related information for a report or report schedule. For example, you can indicate on which dates report data is refreshed or loaded. This item has no specific integration points with Reporting Services. <br />Reference Library – Document library for you to place documents that can help end-users with the navigation and usage of the report center. This item has no specific integration points with Reporting Services.<br />Having resources stored in separate document libraries enables you to configure versioning, workflow, and security separately for each resource. For example, you can configure security to only allow members of the IT department to modify or upload data connections. Likewise, you can configure workflow in Office SharePoint Server 2007 to require approval for new reports.<br />Selecting the Right Mode<br />SQL Server 2005 Reporting Services can operate in either Native Mode or SharePoint Integration Mode. As Reporting Services supports multiple instances, you also have the option of using both modes simultaneously on a single server. This section outlines some considerations you should think about to help determine which mode to use in your organization.<br />Native Mode<br />The term Native Mode in Reporting Services 2005 Service Pack 2 refers to the existing way that Reporting Services operates. The report server is responsible for management of all Reporting Services functionality, including report storage, rendering, scheduling, subscriptions, security, and administration. Reports, data sources, and report models are all stored in the report server database.<br />Native Mode is appropriate for any organization that does not implement Windows SharePoint Services 3.0 or Office SharePoint Server 2007, or does not need the added functionality of Integration Mode (see next section). If your organization uses Windows SharePoint Services 2.0 or SharePoint Portal Server 2003, you will not be able to leverage the additional productivity and security features of Integration Mode until you upgrade to Windows SharePoint Services 3.0 or SharePoint Portal Server 2007.<br />SharePoint Integration Mode<br />Using Reporting Services 2005 in SharePoint Integration Mode enables some significant benefits to the end-user and the organization as a whole, as follows:<br />Uses SharePoint document libraries to store reports, data sources, and report models.
  • 13.
    Enables publishing, viewing,management, and delivery of Reporting Services reports from the same user interface used for managing Office documents.
  • 14.
    Enables organizations toconstruct BI dashboards with rich reports.
  • 15.
    Leverages workflow andcollaboration capabilities that are already available in Office SharePoint Server 2007.When using SharePoint Integration Mode, some features that are available in Native Mode are replaced with comparable functionality in Office SharePoint Server 2007 or are no longer available. The Reporting Services features that are not available in Integration Mode are: <br />Report Manager
  • 16.
  • 17.
  • 18.
  • 19.
    Job ManagementNote: Thereis no support for migrating native mode reports to SharePoint integration mode. You can use those reports, but you must manually republish them to the Office SharePoint Server 2007. <br />Installation Components and Setup<br />Integrating Reporting Services with Office SharePoint Server 2007 requires these components to be installed:<br />SQL Server 2005 Reporting Services – hosts Reporting Services reports and communicates with Office SharePoint Server 2007 using a Web Services interface. The Reporting Services server also manages subscriptions and report caching. This server can be separate from the Office SharePoint Server 2007, but if it is, you must also do a basic install of Office SharePoint Server 2007 on the Reporting Services server to ensure that the Windows SharePoint Services (WSS) 3.0 object model is installed.<br />SQL Server 2005 Service Pack 2 – enables Office SharePoint Server 2007 and Reporting Services integration on the report server.<br />Office SharePoint Server 2007 –Serves as the central access point for all reports and business data. Alternately, you can use Windows SharePoint Services 3.0.<br />Microsoft SQL Server 2005 Reporting Services Add-in for Microsoft SharePoint Technologies - This feature includes the Report Viewer Web Part and the new report management user interface.<br />After installing the required components to integrate Reporting Services with Office SharePoint Server 2007, both the report server and SharePoint server need to be configured. The following sections outline the configurations necessary to achieve integration.<br />Report Server Configuration<br />After installing SQL Server 2005 Service Pack 2 on the Reporting Services server, a new configuration option becomes available, called SharePoint Integration, as shown in Figure 3.<br />Figure 3: Configuring Report Server SharePoint Integration.<br />SharePoint Server Configuration<br />After installing the Microsoft SQL Server 2005 Reporting Services Add-in for Microsoft SharePoint Technologies feature of the Feature Pack for SQL Server 2005 Service Pack 2, a new application becomes available under the Application Management tab. This new application is shown in Figure 4.<br />Figure 4: Configuring the Reporting Services Application in Office SharePoint Server 2007.<br />To configure Reporting Services, you must set each of the options shown in Figure 4, as follows:<br />Manage integration settings – To configure the Report Server Web Service URL and Authentication Mode (either Windows or other trusted account).<br />Grant database access – To configure the name of the report server database server instance name.<br />Set server defaults – To configure report server timeouts and other options.<br />Creating Reports<br />Once Reporting Services and Office SharePoint Server 2007 integration is setup, reports can be created and deployed to the Office SharePoint Server 2007. Creation of reports can be done in one of two ways: one for developers and one for end-users. Each is discussed in the following sections.<br />Developers<br />Developers use Visual Studio®-based SQL Server Business Intelligence Development Studio to create reports. After installing the SQL Server 2005 workstation components, many business intelligence project templates become available, as shown in Figure 5.<br />Figure 5: Visual Studio 2005 Business Intelligence Project Types.<br />Note in Figure 5 that Report Model Project is selected. A Report Model is a way to define the data which can be used by end-users to create reports (see next section). Alternatively, developers can create a blank Report Server Project or use the Report Server Project Wizard to help guide the user through the process of creating reports and specifying data sources.<br />End-Users<br />End-Users can create reports as well as developers, but a developer must first make the data available to those users. Making data available is done using a Report Model. A Report Model defines the data source of a report, the security parameters for the data source, and the tables, fields, and relationships used for the model. This model is then published to an Office SharePoint Server 2007.<br />Once the Report Model is published to the Office SharePoint Server 2007, end-users can create reports using Report Builder. This is a ClickOnce application that is downloaded automatically from the Office SharePoint Server 2007 and installed as a component on the user’s workstation. Report Builder enables the end-user to create and publish reports to the Office SharePoint Server 2007 using the Report Model that the developer created. Figure 6 shows the Report Builder tool.<br />Figure 6: Designing Reports in Report Builder.<br />Viewing Reports<br />Once reports are created and deployed to the Office SharePoint Server 2007, they are ready to be viewed. Report security is set the same way it is for any SharePoint document. You can set security permissions on libraries, folders, or individual files.<br />If a user navigates to a report in a report library on the Office SharePoint Server 2007, the reports can be viewed simply by clicking the desired file name. The integration components know how to connect to the report server Web Service to render the report from within the Office SharePoint Server 2007 environment. Figure 7 shows a rendered report in Office SharePoint Server 2007.<br />Figure 7: Rendered Report within the Office SharePoint Server 2007 Environment.<br />Reports in a report library are rendered using a Report Viewer Web Part. Any SharePoint page can also be modified to display reports by using the Report Viewer Web Part. Report Viewer Web Parts can also be connected to SharePoint Filter Web Parts to limit the data displayed in reports.<br />Managing Reports<br />When Reporting Services is integrated with Office SharePoint Server 2007, report management is then performed using the same SharePoint document library as the one used to launch reports. Managing reports is as simple as navigating to the correct report in the SharePoint document library and clicking the down arrow. The user is presented with a host of options, as shown in Figure 8.<br /> <br />Figure 8: Managing Reports in Office SharePoint Server 2007.<br />Figure 8 shows these possible report management actions:<br />View Properties – Standard Office SharePoint Server 2007 functionality to view document properties. Organizations can employ standardization for properties that will be used in reports, such as including categories, sub-categories, timestamps, approvals, and more.
  • 20.
    Edit Properties –Standard Office SharePoint Server 2007 functionality to edit document properties. SharePoint Office Server 2007 can be configured to make properties mandatory. This can enable organizations to provide valid metadata for each report in the report library.
  • 21.
    Manage Permissions –Standard Office SharePoint Server 2007 functionality to manage the permissions of the document. This is one of the main benefits of integrating Reporting Services with Office SharePoint Server 2007. A common security model is used to secure reports, folders, files, and libraries. System Administrators can easily assign security and troubleshoot report execution problems.
  • 22.
    Edit in ReportBuilder – Reporting Services functionality to launch the Report Builder tool to edit the definition of the report (see Figure 6). Report Builder enables end-users to easily modify or create reports and publish them to the Office SharePoint Server 2007.
  • 23.
    Delete – StandardOffice SharePoint Server 2007 functionality to delete the document from the document library.
  • 24.
    Manage Subscriptions –Reporting Services functionality to add, edit, and delete report subscriptions. Users that subscribe to reports can automatically be notified when data changes in reports. For example, sales people can subscribe to a report to automatically receive their weekly sales figures via email.
  • 25.
    Manage Data Sources– Reporting Services functionality to select a shared or custom data source for the report. Shared data sources enable one data source definition to be used across multiple reports.
  • 26.
    Manage Parameters –Reporting Services functionality to manage the values and prompts for all parameters passed into the report. Parameters are a way to limit the data that is displayed in a report. For example, a report parameter named Year can be specified to limit the report data to the selected year when the report is run.
  • 27.
    Manage Processing Options– Reporting Services functionality to choose processing and snapshot options and timeouts. Snapshots and timeouts affect the performance of the Reporting Services server. It is important to consider these options to keep the server performing as well as possible.
  • 28.
    View Report History– Reporting Services functionality to view the history of report processing.
  • 29.
    Send To –Standard Office SharePoint Server 2007 functionality to send the document to another location.
  • 30.
    Check Out –Standard Office SharePoint Server 2007 functionality to check out the document in order to publish changes. The ability to check out, and then publish a report, data source, or data model is one of the major advantages to integrating Reporting Services with Office SharePoint Server 2007. A report, or any other document, can be checked out, modified, and have workflow optionally applied to the document before it is published back into the Office SharePoint Server 2007.
  • 31.
    Publish a MajorVersion – Standard Office SharePoint Server 2007 functionality to publish a version of a checked-out document. When significant changes to a document occur, it can be helpful to flag the document as a major version so that users have an indication as to the scope of changes in the document. A major version uses the format of version 1.x, 2.x, 3.x, etc.
  • 32.
    Version History –Standard Office SharePoint Server 2007 functionality to view the published versions of a document.
  • 33.
    Alert Me –Standard Office SharePoint Server 2007 functionality to alert a user to changes in the document. This option notifies a user when there is a change to the report definition itself, as opposed to the data being changed in a report.Microsoft SQL Server 2005 Analysis Services and Microsoft Office Excel 2007 <br />Analysis Services enables companies to build and deploy cubes to analyze enterprise-wide data. Analysis Services cubes are built by developers and published to an Analysis Services server to consolidate, aggregate, and instantly present complex business data to end-users in meaningful ways. Using Office Excel 2007 these users can easily create PivotTable views to analyze the data that pertains to them. For example, an executive can quickly and easily create a PivotTable in Office Excel 2007 to view all sales by division, and by quarter. However, if the executive wants to drill-down into the details that make up those sales, no recalculation or additional work has to take place. This is because the Analysis Services cube already contains detail and pre-aggregated data that is accessible to the end-user.<br />Using the familiar Excel environment, a user can leverage Analysis Services data to quickly and easily analyze critical business data. In only minutes, the features of Office Excel 2007 make it possible to create professional-looking reports of complex Analysis Services data.<br />Microsoft Office Excel 2007 Integration Features and Benefits<br />In SQL Server 2005 SP2 Analysis Services is designed to work seamlessly with Office Excel 2007 to provide end-users with a rich analysis experience. SQL Server 2005 Analysis Services and Office Excel 2007 each contain too many features and benefits to list in this one paper, but the following features specifically come to life as results of the enhanced interoperability points between the two products:<br />Get External Data – A new enhancement introduced with Office Excel 2007 to allow end-users to leverage predefined data source connections to eliminate the complexity of connecting to external data sources. This feature is not specific to connecting solely to Analysis Services, but is included here due to the major impact this poses on a business’ ability to enable more users than ever to access data. The benefit of connecting to Analysis Services data using existing connections is that users no longer need to know anything about the server, the data sources, or the connection strings required to create a connection to the back-end data.