Download to read offline


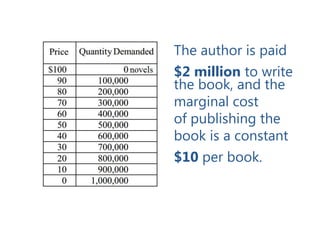
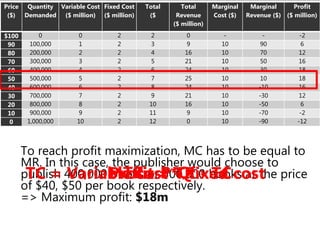
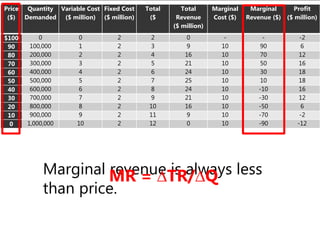
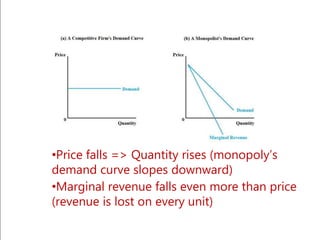
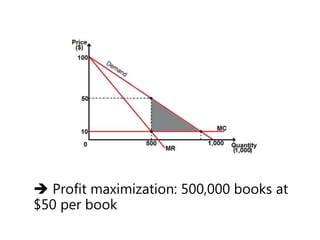
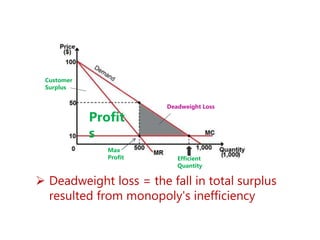
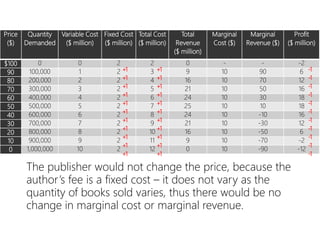
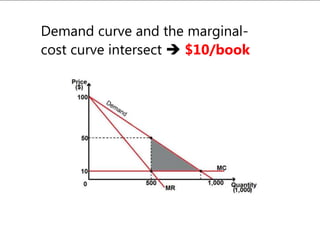
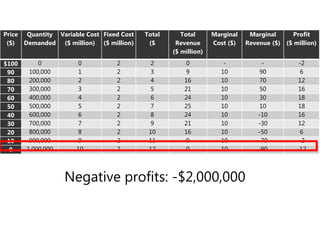


The document summarizes a presentation on monopoly and monopoly profit maximization using an example of a publisher. It analyzes the publisher's decision-making process regarding price and quantity for a new novel under different scenarios. Specifically, it finds that a profit-maximizing publisher would choose to publish 400,000 or 500,000 books at a price of $40 or $50 respectively to maximize its $18 million profit. It also discusses how the publisher's decision would be affected if the author's fee changed and what price it would charge if aiming to maximize economic efficiency rather than profits.


