Download to read offline


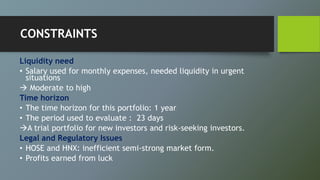


![JENSEN MEASURE
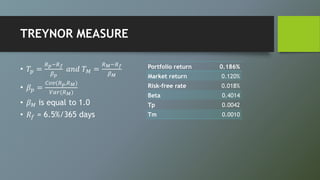
• E(Rp) = Rf + βp[E(RM) – Rf]
• Rpt – Rft = αp + βp(Rmt – Rft) + et
• α = 0.001277
Risk-free rate 0.018%
Beta 0.4014
Market return 0.12%
Expected portfolio return 0.06%
Actual portfolio return 0.19%](https://image.slidesharecdn.com/port-180225091110/85/Portfolio-Final-Project-31-320.jpg)

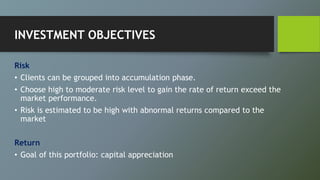
This document summarizes a student group project on portfolio theory and investment analysis. The group consists of 5 students and aims to create a portfolio targeting risk-seeking investors aged 25-40. The portfolio will be 100% invested in stocks listed on the HOSE exchange in Vietnam. Key points analyzed include macroeconomic factors, industries, individual stock selection, and performance evaluation metrics like the Treynor, Sharpe, and Jensen measures. 16 stocks were selected across various industries based on financial criteria. An evaluation of the 23-day trial portfolio found positive but modest performance.


![[FiinPro Data] Earnings Update](https://cdn.slidesharecdn.com/ss_thumbnails/fiinprodatarelease2earningsupdate07aug2019finaleng-190808073704-thumbnail.jpg?width=640&height=640&fit=bounds)


![[Microeconomics] Chapter 15 - Monopoly](https://cdn.slidesharecdn.com/ss_thumbnails/microchapter15monopoly-180225091108-thumbnail.jpg?width=640&height=640&fit=bounds)


