Download to read offline

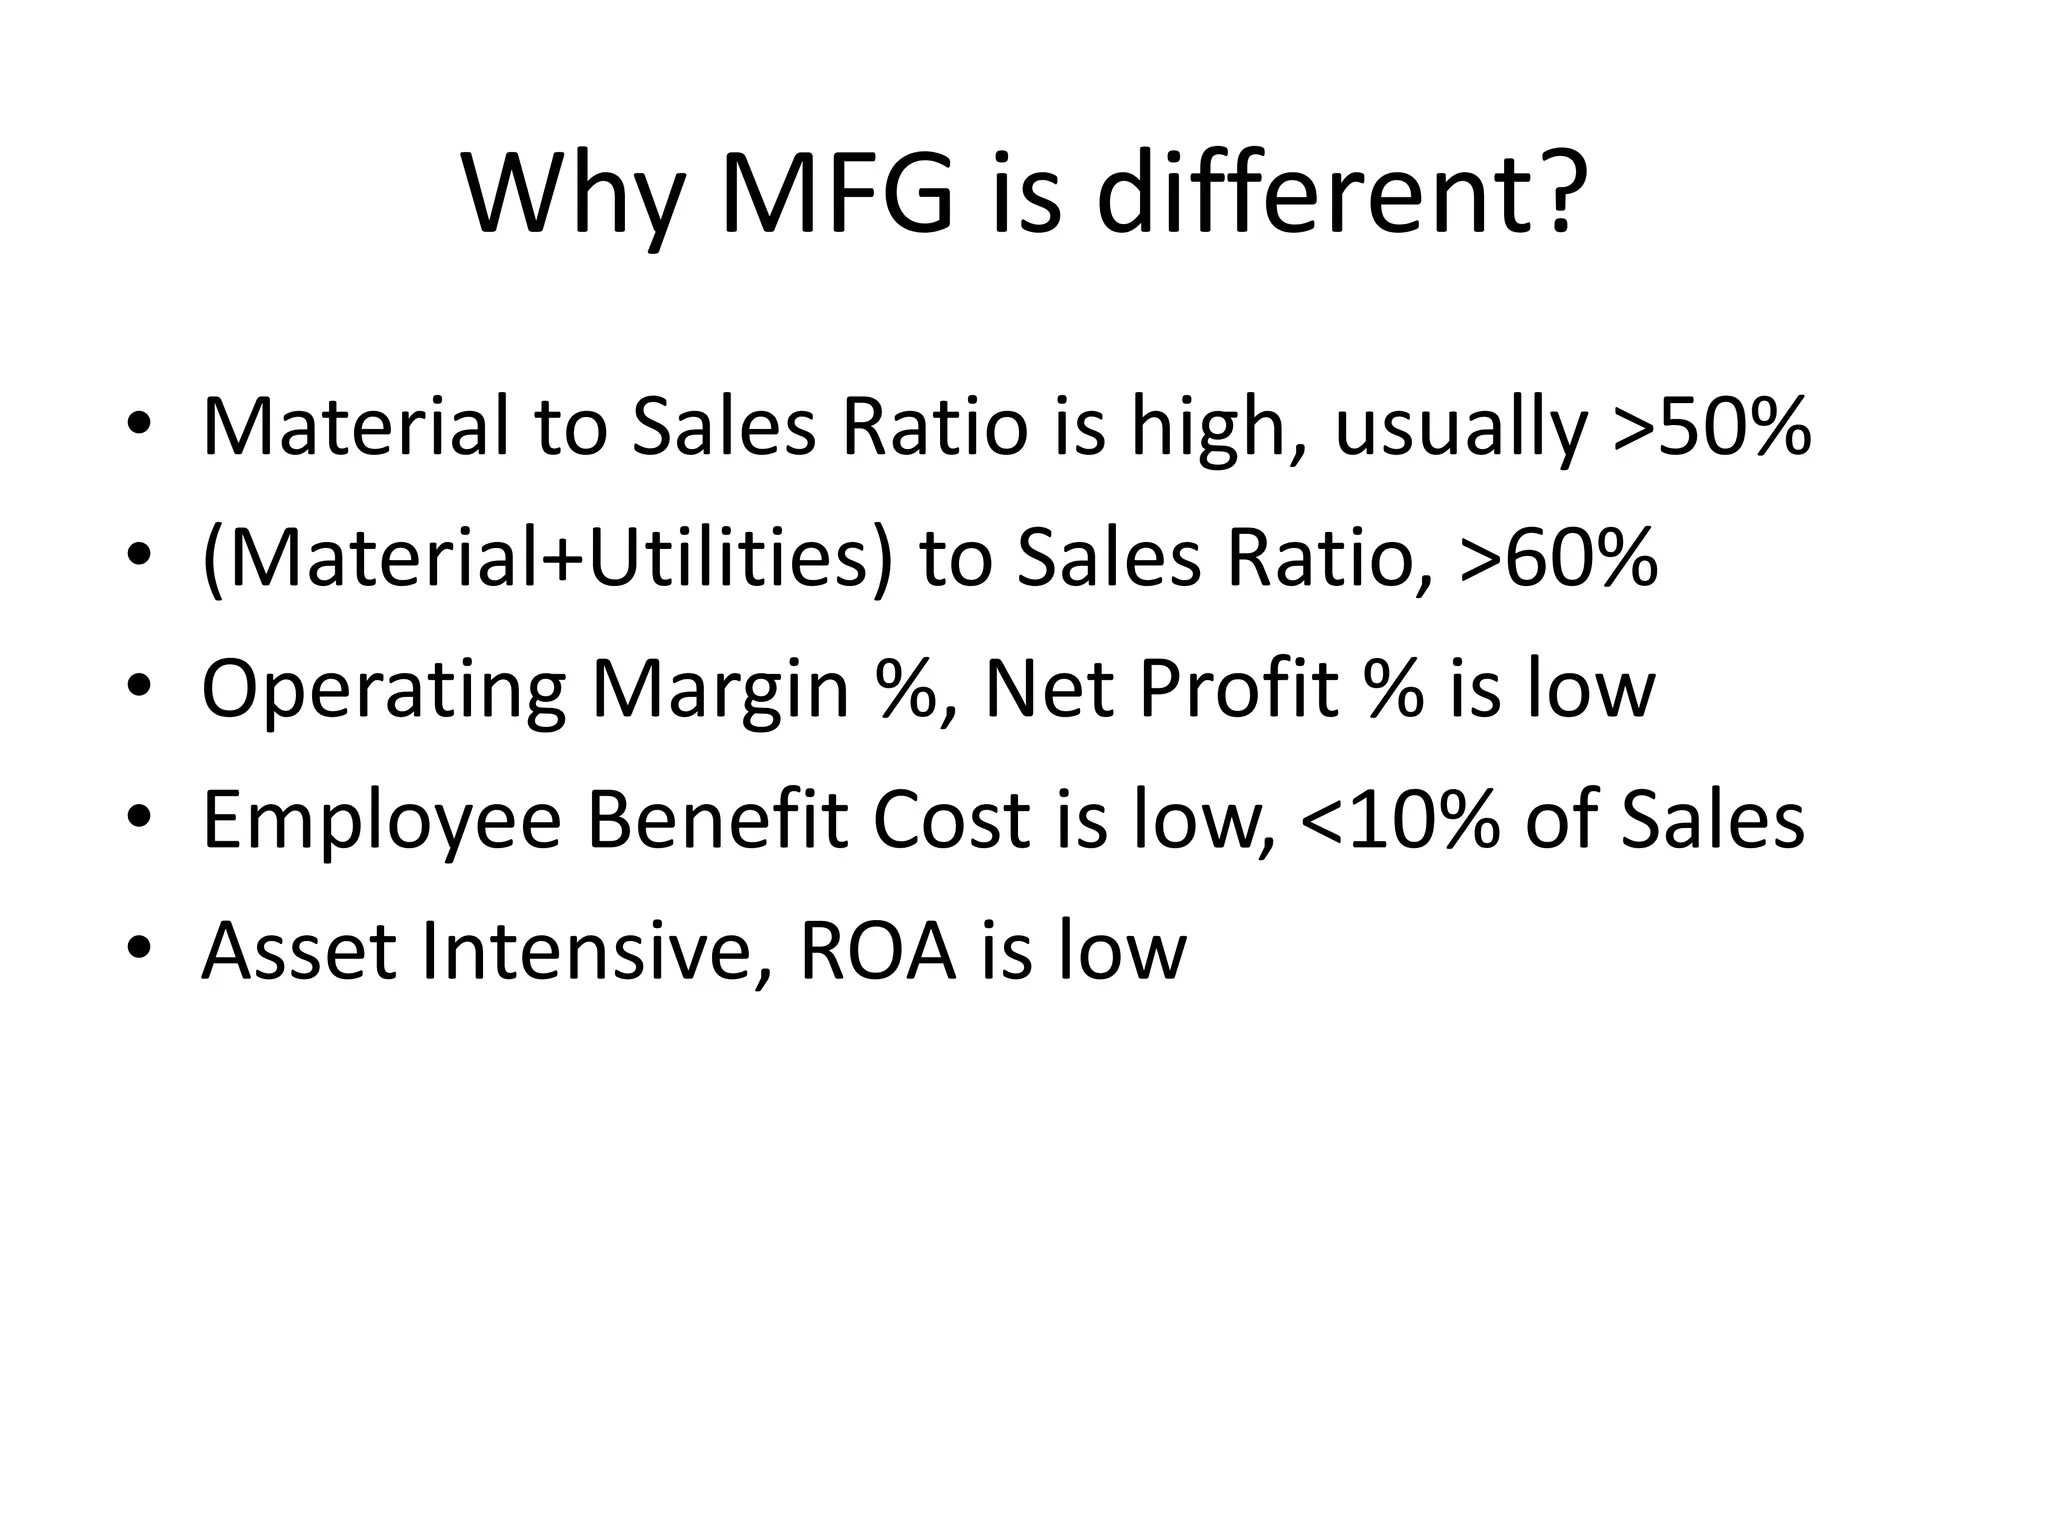
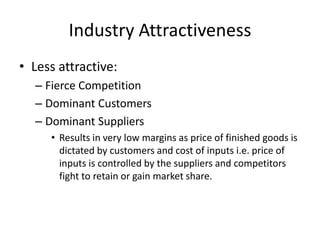
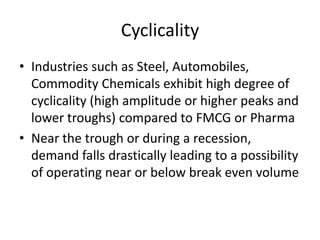


- MFG companies have high material costs, low operating margins, and asset-intensive business models with low returns. - The industry is not very attractive due to fierce competition, dominant customers and suppliers that dictate prices and margins. - MFG industries also experience high cyclicality with demand falling drastically during recessions.


