SlideShare a Scribd company logo
ABSTRACT
Title of Document: MECHANISTIC-EMPIRICAL DESIGN OF
FLEXIBLE PAVEMENTS: A SENSITIVITY STUDY
Regis L. Carvalho, Master of Science, 2006
Thesis directed by: Dr. Charles W. Schwartz
Department of Civil and Environmental Engineering
Pavement structural design is a daunting task. Traffic loading is a heterogeneous
mix of vehicles, axle types and loads with distributions that vary daily and over the
pavement design life. Pavement materials respond to these loads in complex ways
influenced by stress state and magnitude, temperature, moisture, loading rate, and other
factors. Environment exposure adds further complications. It should be no wonder the
profession has resorted to largely empirical methods. Developments over recent decades
offered an opportunity for more rational and rigorous pavement design procedures. The
latest of these accomplishments is the development of the mechanistic-empirical
pavement design procedure in NCHRP Project 1-37A. This study presents a comparison
of flexible pavement designs between the 1993 AASHTO guide and the NCHRP 1-37A
methodology and a sensitivity analysis of the NCHRP 1-37A’s input parameters.
Recommendations for future studies involving the application and implementation of the
new mechanistic-empirical pavement design guide concludes the study.
MECHANISTIC-EMPIRICAL DESIGN OF FLEXIBLE PAVEMENTS: A
SENSITIVITY STUDY
By
Régis Luis Egual de Carvalho
Thesis submitted to the Faculty of the Graduate School of the
University of Maryland, College Park, in partial fulfillment
of the requirements for the degree of
Master of Science
2006
Advisory Committee:
Dr. Charles W. Schwartz, Chair
Professor Deborah J. Goodings
Dr. Dimitrios G. Goulias
©Copyright by
Regis L. Carvalho
2006
ii
DEDICATION
To Ana, my unconditional and inspirational love.
iii
ACKNOWLEDGEMENTS
I would like to acknowledge Dr. Charles Schwartz for his valuable guidance and
continuous encouragement throughout this first phase of my graduate studies and for
keeping me motivated for the challenges ahead.
I would also like to express my gratitude to Professor Deborah Goodings and Dr.
Dimitrios Goulias for serving as committee members and for their support and help. I
wish to extend my gratitude to Dr. Ahmet Aydilek and Professor Sherif Aggour for their
valuable advices.
I would like to express my sincere appreciation to my friend Mr. Nelson Gibson
for his support, especially during the earlier stages of my graduate studies; our friendship
extends beyond school boundaries. I am also grateful to Mr. Mehmet Melih Demirkan,
Dr. Emin Kutay, and Mr. Haejin Kim for their friendship, for sharing valuable
geotechnical discussions and laughs at the geotech/pavements graduate student offices.
Finally, I would like to express my endless gratitude to my family, my brother
Arthur, my sisters Nathalia and Lele, and my mother Vitória Regia for their love and
support, and especially to my father eng. Luiz Antônio Carvalho, who always encouraged
me to pursue my dreams.
iv
TABLE OF CONTENTS
List of Tables………………………………………………....…………………………………...v
List of Figures…………………………………………………..………..……………………….vi
Chapter 1 : Introduction...................................................................................................................1
Chapter 2 : Review of Flexible Pavement Design Principles ..........................................................4
Chapter 3 : Pavement Design Procedures......................................................................................11
3.1. 1993 AASHTO Guide ........................................................................................................12
3.1.1. The AASHO Road Test and Previous Versions of the Guide__________________ 12
3.1.2. Current Design Equation______________________________________________ 19
3.1.3. Input Variables _____________________________________________________ 21
3.1.4. Reliability _________________________________________________________ 26
3.1.5. Considerations and Comments Found in the Literature ______________________ 28
3.2. NCHRP 1-37A Design Procedure ......................................................................................31
3.2.1. Design process______________________________________________________ 32
3.2.2. Inputs_____________________________________________________________ 35
3.2.3. Pavement Response Models ___________________________________________ 43
3.2.4. Empirical Performance Models_________________________________________ 50
3.2.5. Reliability _________________________________________________________ 64
3.2.6. Remarks___________________________________________________________ 66
Chapter 4 : Comparative Study between the 1993 AASHTO Guide and the NCHRP 1-37A
Procedure .......................................................................................................................................67
4.1. Conceptual Differences between 1993 AASHTO Guide and NCHRP 1-37A...................68
4.2. Description of Pavement Sections......................................................................................73
4.3. General Inputs ....................................................................................................................74
4.4. 1993 AASHTO Designs.....................................................................................................78
4.5. NCHRP 1-37A Analysis.....................................................................................................80
4.5.1. Traffic ____________________________________________________________ 80
4.5.2. Environment _______________________________________________________ 80
4.5.3. Material Properties __________________________________________________ 81
4.5.4. Performance Models and Criteria _______________________________________ 86
4.6. Results ................................................................................................................................87
Chapter 5 : NCHRP 1-37A Performance Prediction Sensitivity to Parameters.............................97
5.1. Thickness............................................................................................................................97
5.2. Traffic...............................................................................................................................104
5.3. Environment .....................................................................................................................108
5.4. Material Properties ...........................................................................................................111
5.4.1. Asphalt Concrete___________________________________________________ 112
5.4.2. Unbound Materials _________________________________________________ 121
5.5. Empirical Performance Model Calibration.......................................................................125
5.6. Service Life ......................................................................................................................133
Chapter 6 : Case Study: Maryland Designs .................................................................................142
Chapter 7 : Conclusions...............................................................................................................154
7.1. Summary...........................................................................................................................154
7.2. Principal Findings.............................................................................................................154
7.3. Implementation Issues......................................................................................................160
Chapter 8 : References.................................................................................................................162
v
LIST OF TABLES
Table 3.1. Recommended values for Regional Factor R (AASHTO, 1972)..................................16
Table 3.2. Ranges of structural layer coefficients (AASHTO, 1972)............................................17
Table 3.3.Recommended drainage coefficients for unbound bases and subbases in flexible
pavements (Huang, 1993). ....................................................................................................26
Table 3.4. Suggested levels of reliability for various highway classes (AASHTO, 1993)............27
Table 3.5. ZR values for various levels of reliability (Huang, 1993). ............................................28
Table 3.6. Material inputs requirement for flexible pavements.....................................................39
Table 4.1. Locations and climate conditions..................................................................................74
Table 4.2. Number of axle per truck class and vehicle distribution by traffic level. .....................77
Table 4.3.Traffic volume. ..............................................................................................................78
Table 4.4. Base layer coefficient and subgrade resilient modulus.................................................78
Table 4.5. 1993 AASHTO designs. ...............................................................................................79
Table 4.6. Location of designs and environmental data. ...............................................................81
Table 4.7. Asphalt concrete properties...........................................................................................83
Table 4.8. Binder grade by state for low traffic case. ....................................................................83
Table 4.9. Binder grade by state for moderate and high traffic cases............................................84
Table 4.10. Granular base resilient modulus calculated from the 1993 AASHTO’s structural layer
coefficient..............................................................................................................................84
Table 4.11. Granular aggregate base properties.............................................................................84
Table 4.12a. Subgrade properties...................................................................................................85
Table 5.1. AC mix properties.......................................................................................................117
Table 6.1. Traffic data for case study...........................................................................................144
Table 6.2. I-95 structural designs.................................................................................................152
Table 6.3. US-219 structural designs...........................................................................................153
Table 6.4. ICC structural designs.................................................................................................153
vi
LIST OF FIGURES
Figure 3.1. General procedure for computing thickness................................................................ 20
Figure 3.2. Chart for estimating layer coefficient for asphalt concrete based on elastic
modulus (AASHTO, 1993) ................................................................................................... 24
Figure 3.3. M-E flexible pavement design flow chart. .................................................................. 34
Figure 3.4. Summary of schematics for horizontal location of critical response predictions
(NCHRP, 2004)..................................................................................................................... 44
Figure 4.1. Pavement structure ...................................................................................................... 73
Figure 4.2. States selected for comparison study........................................................................... 73
Figure 4.3. Distribution mass function of single axle loads by vehicle class type......................... 75
Figure 4.4. Distribution mass function of tandem axle loads by vehicle class type. ..................... 76
Figure 4.5. Distribution mass function of tridem axle loads by vehicle class type........................ 76
Figure 4.6. Granular base thickness design.................................................................................... 88
Figure 4.7. Asphalt concrete thickness design............................................................................... 89
Figure 4.8. NCHRP 1-37A predictions for low traffic scenario. ................................................... 91
Figure 4.9. NCHRP 1-37A predictions for moderate traffic scenario. .......................................... 91
Figure 4.10. NCHRP 1-37A predictions for high traffic scenario. ................................................ 92
Figure 4.11. Summary of 1-37A predictions. ................................................................................ 93
Figure 4.12. “Alligator” fatigue cracking predictions range.......................................................... 94
Figure 4.13. Permanent deformation predictions range................................................................. 95
Figure 5.1. Sensitivity to base thickness........................................................................................ 98
Figure 5.2. MLET calculated horizontal tensile strain versus base thickness................................ 99
Figure 5.3. MLET calculated vertical compressive strain versus pavement depth: (a)
along the total thickness of the pavement; and (b) only base thickness, in percentage
of total base thickness ......................................................................................................... 101
Figure 5.4. NCHRP 1-37A rutting predictions versus base thickness. ........................................ 102
Figure 5.5. Sensitivity to AC thickness. ...................................................................................... 103
Figure 5.6. NCHRP 1-37A rutting predictions versus AC thickness........................................... 103
Figure 5.7. Rutting performance sensitivity to traffic load type at 15 years................................ 105
Figure 5.8. Effect of traffic load type on AC rutting (Basyouny et al., 2005)............................. 106
Figure 5.9. Fatigue cracking performance sensitivity to traffic load type at 15 years................. 106
Figure 5.10. Class 5 and class 9 percentages for different vehicle distribution scenarios........... 107
Figure 5.11. Performance for different vehicle class distributions. ............................................. 108
Figure 5.12. Sensitivity to local climate conditions..................................................................... 110
Figure 5.13. Sensitivity to ground water table............................................................................. 111
Figure 5.14. Sensitivity of predicted dynamic modulus to mixture inputs. (Schwartz et al.,
2006 – in preparation) ......................................................................................................... 113
Figure 5.15. Sensitivity to binder grade....................................................................................... 114
Figure 5.16. Sensitivity to effective binder content (% by volume). ........................................... 116
Figure 5.17. Sensitivity to air voids............................................................................................. 116
Figure 5.18. (a) Year seasonal variation of predicted |E*|; (b) Sensitivity to AC dense
graded mixture type............................................................................................................. 118
Figure 5.19. (a) Sensitivity to AC dense graded mixture and SMA; (b) year seasonal
variation of predicted |E*|. .................................................................................................. 120
Figure 5.20. Sensitivity to granular base resilient modulus......................................................... 122
Figure 5.21. Multi-layer linear elastic computation of vertical compressive strains versus
base MR. .............................................................................................................................. 123
vii
Figure 5.22. Multi-layer linear elastic computation of horizontal tensile strain at the
bottom of AC layer versus base MR. ................................................................................... 123
Figure 5.23. Sensitivity to subgrade resilient modulus................................................................ 124
Figure 5.24. Sensitivity to subgrade type..................................................................................... 125
Figure 5.25. Sensitivity to AC rutting model calibration coefficients. ........................................ 129
Figure 5.26. Sensitivity to base layer rutting model calibration coefficient. ............................... 130
Figure 5.27. Sensitivity to fatigue cracking model calibration coefficients. ............................... 132
Figure 5.28. Service life sensitivity to design criterion for different AC thickness: (a)
rutting; (b) fatigue cracking................................................................................................. 135
Figure 5.29. Service life sensitivity to design criterion for vehicle distribution: (a) rutting;
(b) fatigue cracking. ............................................................................................................ 136
Figure 5.30. Service life sensitivity to design criterion for MD climate conditions: (a)
rutting; (b) fatigue cracking................................................................................................. 137
Figure 5.31. Service life sensitivity to design criterion for different binder grade: (a)
rutting; (b) fatigue cracking................................................................................................. 138
Figure 5.32. Service life sensitivity to design criterion for different base resilient
modulus: (a) rutting; (b) fatigue cracking. .......................................................................... 139
Figure 5.33. Service life sensitivity to design criterion for different subgrade resilient
modulus: (a) rutting; (b) fatigue cracking. .......................................................................... 140
Figure 6.1. M-E flexible pavement design flow chart. ................................................................ 143
Figure 6.2. Vehicle distribution by project. ................................................................................. 145
Figure 6.3. Load distribution for the I-95 project. ....................................................................... 145
Figure 6.4. Load distribution for the US-219 project. ................................................................. 146
Figure 6.5. Load distribution estimated for the ICC project........................................................ 146
Figure 6.6. I-95 project performance predictions. ....................................................................... 150
Figure 6.7. US-219 project performance predictions................................................................... 151
Figure 6.8. ICC project performance predictions. ....................................................................... 151
1
Chapter 1: Introduction
Pavement structural design is a daunting task. Although the basic geometry of a
pavement system is quite simple, everything else is not. Traffic loading is a
heterogeneous mix of vehicles, axle types, and axle loads with distributions that vary
with time throughout the day, from season to season, and over the pavement design life.
Pavement materials respond to these loads in complex ways influenced by stress state and
magnitude, temperature, moisture, time, loading rate, and other factors. Exposure to harsh
environmental conditions ranging from subzero cold to blistering heat and from parched
to saturated moisture states adds further complications. It should be no wonder, then, that
the profession has resorted to largely empirical methods like the American Association of
State Highway and Transportation Officials (AASHTO) guides for pavement design
(AASHTO, 1993).
Several developments over recent decades have offered an opportunity for more
rational and rigorous pavement design procedures. Advances in computational mechanics
and in the computers available for performing the calculations have greatly improved our
ability to predict pavement response to load and climate effects. Improved material
characterization and constitutive models make it possible to incorporate nonlinearities,
rate effects, and other realistic features of material behavior. Large databases now exist
for traffic characteristics, site climate conditions, pavement material properties, and
historical performance of in-service pavement sections. These and other assets provided
the technical infrastructure that made possible the development of the mechanistic-
empirical pavement design procedure in NCHRP Project 1-37A (NCHRP, 2004).
2
The objectives of this study are (1) to compare flexible pavement designs and
performance between the empirical 1993 AASHTO pavement design guide and the
mechanistic-empirical NCHRP 1-37A methodology and (2) to perform a sensitivity
analysis of the NCHRP 1-37A methodology’s input parameters. The comparisons span a
range of locations within the United States, each with its own climate, subgrade and other
material properties, and local design preferences. Particular emphasis is devoted to the
influence of traffic and reliability levels on the comparisons. The sensitivity study is
performed for several key input variables. A design exercise consisting of three Maryland
projects is presented, from which inferences regarding appropriate design criteria for
rutting and bottom-up fatigue cracking are also drawn.
This thesis is divided in seven chapters. The first chapter presents an introduction,
the objective of the research, and the description of the chapters.
The second chapter is the literature review of the most relevant pavement design
methods. The methods are grouped in two categories, empirical and mechanistic-
empirical, attempting to maintain the focus at the research objectives.
The third chapter describes the 1993 AASHTO pavement design guide and the
new mechanistic-empirical NCHRP 1-37A procedure, currently under evaluation for
adoption as the new standard AASHTO Guide.
The fourth chapter discusses the differences between pavement designs in the
1993 AASHTO guide and the NCHRP 1-37A methodology. Typical 1993 AASHTO
designs for five different regions in the U.S. and three traffic levels are analyzed using
the latest version of the NCHRP 1-37A software. Comparisons are made based on fatigue
3
cracking and permanent deformation predictions from the mechanistic-empirical
procedure.
The fifth chapter describes the results of the NCHRP 1-37A sensitivity study. The
sensitivity study is a parametric evaluation of key inputs and their analysis of
reasonableness and consistency with expected field results. The sensitivity is performed
for fatigue cracking, permanent deformation and the impact on service life.
The sixth chapter presents application examples of Maryland designs obtained
from the Maryland State Highway Administration (MDSHA). Three 1993 AASHTO
designs are evaluated using the NCHRP 1-37A methodology.
The seventh chapter presents a summary of conclusions, final remarks and
recommendations for future studies involving the application and implementation of the
new mechanistic-empirical pavement design guide.
4
Chapter 2: Review of Flexible Pavement Design Principles
Before the 1920s pavement design consisted basically of defining thicknesses of
layered materials that would provide strength and protection to a soft, weak subgrade.
Pavements were designed against subgrade shear failure. Engineers used their experience
based on successes and failures of previous projects. As experience evolved, several
pavement design methods based on subgrade shear strength were developed.
Since then, traffic volume has increased and the design criteria have changed. As
important as providing subgrade support, it was equally important to evaluate pavement
performance through ride quality and other surface distresses that increase the rate of
deterioration of pavement structures. Performance became the focus point of pavement
designs. Methods based on serviceability (an index of the pavement service quality) were
developed based on test track experiments. The AASHO Road Test in 1960s was a
seminal experiment from which the AASHTO design guide was developed.
Methods developed from laboratory test data or test track experiment where
model curves are fitted to data are typical examples of empirical methods. Although they
may exhibit good accuracy, empirical methods are valid only for the material selection
and climate condition in which they were developed.
Meanwhile, new materials started to be used in pavement structures that provided
better subgrade protection, but with their own failure modes. New design criteria were
required to incorporate such failure mechanisms (e.g., fatigue cracking and permanent
deformation in the case of asphalt concrete). The Asphalt Institute method (Asphalt
Institute, 1982, 1991) and the Shell method (Claussen et al., 1977; Shook et al., 1982) are
5
examples of procedures based on asphalt concrete’s fatigue cracking and permanent
deformation failure modes. These methods were the first to use linear-elastic theory of
mechanics to compute structural responses (in this case strains) in combination with
empirical models to predict number of loads to failure for flexible pavements.
The dilemma is that pavement materials do not exhibit the simple behavior
assumed in isotropic linear-elastic theory. Nonlinearities, time and temperature
dependency, and anisotropy are some examples of complicated features often observed in
pavement materials. In this case, advanced modeling is required to mechanistically
predict performance. The mechanistic design approach is based on the theories of
mechanics to relate pavement structural behavior and performance to traffic loading and
environmental influences. Progress has been made in recent years on isolated pieces of
the mechanistic performance prediction problem. But the reality is that fully mechanistic
methods are not yet available for practical pavement design.
The mechanistic-empirical approach is the consolidation of the two sides.
Empirical models are used to fill in the gaps that exist between the theory of mechanics
and the performance of pavement structures. Simple mechanistic responses are easy to
compute with assumptions and simplifications (i.e., homogeneous material, small strain
analysis, static loading as typically assumed in linear elastic theory), but they by
themselves cannot be used to predict performance directly; some type of empirical model
is required to make the appropriate correlation. Mechanistic-empirical methods are
considered an intermediate step between empirical and fully mechanistic methods.
The objective of this section is to review briefly some of these advancements in
pavement design focusing on flexible pavements. The nomenclature in the literature often
6
shows several groups of different pavement design methods, mostly according to their
origin and development techniques. For simplification, pavement design methods in this
study are grouped as empirical and mechanistic-empirical.
Empirical Methods
An empirical design approach is one that is based solely on the results of
experiments or experience. Observations are used to establish correlations between the
inputs and the outcomes of a process--e.g., pavement design and performance. These
relationships generally do not have a firm scientific basis, although they must meet the
tests of engineering reasonableness (e.g., trends in the correct directions, correct behavior
for limiting cases, etc.). Empirical approaches are often used as an expedient when it is
too difficult to define theoretically the precise cause-and-effect relationships of a
phenomenon.
The first empirical methods for flexible pavement design date to the mid-1920s
when the first soil classifications were developed. One of the first to be published was the
Public Roads (PR) soil classification system (Hogentogler & Terzaghi, 1929, after
Huang, 2004). In 1929, the California Highway Department developed a method using
the California Bearing Ratio (CBR) strength test (Porter, 1950, after Huang, 2004). The
CBR method related the material’s CBR value to the required thickness to provide
protection against subgrade shear failure. The thickness computed was defined for the
standard crushed stone used in the definition of the CBR test. The CBR method was
improved by U.S. Corps of Engineers (USCE) during the World War II and later became
the most popular design method. In 1945 the Highway Research Board (HRB) modified
7
the PR classification. Soils were grouped in 7 categories (A-1 to A-7) with indexes to
differentiate soils within each group. The classification was applied to estimate the
subbase quality and total pavement thicknesses.
Several methods based on subgrade shear failure criteria were developed after the
CBR method. Barber (1946, after Huang 2004) used Terzaghi’s bearing capacity formula
to compute pavement thickness, while McLeod (1953, after Huang 2004) applied
logarithmic spirals to determine bearing capacity of pavements. However, with increasing
traffic volume and vehicle speed, new materials were introduced in the pavement
structure to improve performance and smoothness and shear failure was no longer the
governing design criterion.
The first attempt to consider a structural response as a quantitative measure of the
pavement structural capacity was measuring surface vertical deflection. A few methods
were developed based on the theory of elasticity for soil mass. These methods estimated
layer thickness based on a limit for surface vertical deflection. The first one published
was developed by the Kansas State Highway Commission, in 1947, in which
Boussinesq’s equation was used and the deflection of subgrade was limited to 2.54 mm.
Later in 1953, the U.S. Navy applied Burmister’s two-layer elastic theory and limited the
surface deflection to 6.35 mm. Other methods were developed over the years,
incorporating strength tests. More recently, resilient modulus has been used to establish
relationships between the strength and deflection limits for determining thicknesses of
new pavement structures and overlays (Preussler and Pinto, 1984). The deflection
methods were most appealing to practitioners because deflection is easy to measure in the
8
field. However, failures in pavements are caused by excessive stress and strain rather
than deflection.
After 1950 experimental tracks started to be used for gathering pavement
performance data. Regression models were developed linking the performance data to
design inputs. The empirical AASHTO method (AASHTO, 1993), based on the AASHO
Road Test (1960s), is the most widely used pavement design method today. The
AASHTO design equation is a relationship between the number of load cycles, pavement
structural capacity, and performance, measured in terms of serviceability. The concept of
serviceability was introduced in the AASHTO method as an indirect measure of the
pavement’s ride quality. The serviceability index is based on surface distresses
commonly found in pavements.
The biggest disadvantage of regression methods is the limitation on their
application. As any empirical method, regression methods can be applied only to the
conditions at the road test site in which they were developed. The AASHTO method, for
example, was adjusted several times over the years to incorporate extensive modifications
based on theory and experience that allowed the design equation to be used under
conditions other than those of the AASHO Road Test.
Regression equations can also be developed using performance data from existing
pavements, such as the COPES (Darter et al., 1985) and EXPEAR (Hall et al., 1989)
systems. Although these models can represent and explain the effects of several factors
on pavement performance, their limited consideration of materials and construction data
result in wide scatter and many uncertainties. Their use as pavement design tools is
therefore very limited.
9
Mechanistic-Empirical Methods
Mechanistic-Empirical methods represent one step forward from empirical
methods. The induced state of stress and strain in a pavement structure due to traffic
loading and environmental conditions is predicted using theory of mechanics. Empirical
models link these structural responses to distress predictions. Kerkhoven & Dormon
(1953) first suggested the use of vertical compressive strain on the top of subgrade as a
failure criterion to reduce permanent deformation. Saal & Pell (1960) published the use
of horizontal tensile strain at the bottom of asphalt layer to minimize fatigue cracking.
Dormon & Metcalf (1965) first used these concepts for pavement design. The Shell
method (Claussen et al., 1977) and the Asphalt Institute method (Shook et al., 1982; AI,
1992) incorporated strain-based criteria in their mechanistic-empirical procedures.
Several studies over the past fifteen years have advanced mechanistic-empirical
techniques. Most of work, however, was based on variants of the same two strain-based
criteria developed by Shell and the Asphalt Institute. The Departments of Transportation
of the Washington State (WSDOT), North Carolina (NCDOT) and Minnesota (MNDOT),
to name a few, developed their own M-E procedures. The National Cooperative Highway
Research Program (NCHRP) 1-26 project report, Calibrated Mechanistic Structural
Analysis Procedures for Pavements (1990), provided the basic framework for most of the
efforts attempted by state DOTs. WSDOT (Pierce et al., 1993; WSDOT, 1995) and
NCDOT (Corley-Lay, 1996) developed similar M-E frameworks incorporating
environmental variables (e.g., asphalt concrete temperature to determine stiffness) and
cumulative damage model using Miner’s Law with the fatigue cracking criterion.
10
MNDOT (Timm et al., 1998) adopted a variant of the Shell’s fatigue cracking model
developed in Illinois (Thompson, 1985) and the Asphalt Institute’s rutting model.
The NCHRP 1-37A project (NCHRP, 2004) delivered the most recent M-E-based
method that incorporates nationally calibrated models to predict distinct distresses
induced by traffic load and environmental conditions. The NCHRP 1-37A methodology
also incorporates vehicle class and load distributions in the design, a step forward from
the Equivalent Single Axle Load (ESAL) used in the AASHTO design equation and other
methods. The performance computation is done on a seasonal basis to incorporate the
effects of climate conditions on the behavior of materials.
The NCHRP 1-37A methodology is the main focus of this study. A complete
description of its components, key elements, and use is presented in Chapter 3. Chapter 3
also includes a complete review of the 1993 AASHTO Guide and its previous versions.
The comparison of the empirical 1993 AASHTO Guide and the mechanistic-empirical
NCHRP 1-37A procedure, which is one of the objectives of this study, is presented in
Chapter 4.
11
Chapter 3: Pavement Design Procedures
The current 1993 AASHTO Guide and the new mechanistic-empirical NCHRP 1-
37A procedure for flexible pavements are described in this chapter. The 1993 AASHTO
is the latest version of AASHTO Guide for pavement design and analysis, which is based
primarily on the AASHO Road Test conducted in the late 1950s. Over the years
adjustments and modifications have been made in an effort to upgrade and expand the
limits over which the AASHTO guide is valid (HRB, 1962; AASHTO, 1972, 1986,
1993).
The Federal Highway Administration’s 1995-1997 National Pavement Design
Review found that some 80 percent of states use one of the versions of the AASHTO
Guide. Of the 35 states that responded to a 1999 survey by Newcomb and Birgisson
(1999), 65 percent reported using the 1993 AASHTO guide for both flexible and rigid
pavement designs.
A 1996 workshop meant to develop a framework for improving the 1993 Guide
recommended instead the development of a new guide based as much as possible on
mechanistic principles. The NCHRP 1-37A procedure is the result of this effort.
Following independent reviews and validations that have been ongoing since its initial
release in April, 2004, the NCHRP 1-37A procedure is expected to be adopted by
AASHTO as the new national pavement design guide.
This chapter is divided in two sections. The first describes the AASHTO Guide
and its revisions since its first edition dated 1961, with the original empirical equations
12
derived from the AASHO Road Test, to its latest dated 19931
(HRB, 1961, 1962;
AASHTO, 1972, 1986, 1993). The second part explains in some detail the new
mechanistic-empirical NCHRP 1-37A pavement design procedure (NCHRP, 2004).
3.1. 1993 AASHTO Guide
The 1993 AASHTO Guide is the latest version of the AASHTO Interim Pavement
Design Guide, originally released in 1961. The evolution of the AASHTO Guide is
outlined, followed by a description of the current design equation and input variables. At
the end of this section, a summary of recent evaluation studies of the AASHTO guide is
also presented.
3.1.1. The AASHO Road Test and Previous Versions of the Guide
After two successful road projects, the Road Test One-MD and the WASHO
Road Test (Western Association of State Highway Officials), in 1955 the Highway
Research Board (HRB) approved the construction of a new test track project located in
Ottawa, Illinois. This test facility was opened to traffic in 1958. Traffic operated on the
pavement sections until November, 1960, and a little more than 1 million axle loads were
applied to the pavement and bridges. (HRB, 1961)
1
The supplement of the 1993 AASHTO Guide, released in 1998 (AASHTO, 1998), substantially
modified the rigid pavement design procedure, based on recommendations from NCHRP Project 1-30 and
studies conducted using the LTPP database. However this supplement is not addressed in this thesis
because it is solely related to rigid pavements.
13
The main objective of the AASHO Road Test was to determine the relation
between the number of repetitions of specified axle loads (different magnitudes and
arrangements) and the performance of different flexible and rigid pavement structures.
The test track consisted of 6 loops, each with a segment of four-lane divided
highway (two lanes per direction) whose parallel roadways were connected with a
turnaround at both ends. Five loops were trafficked and loop 1 received no traffic during
the entire experiment. Test sections were located only on tangents separated by a short
transition lengths. The inner and outer lane had identical pavement sections. Each lane
had its own assigned traffic level. The subgrade was identified as a fine grained silty clay
(A-6 or A-7-6 according to the AASHTO soil classification). For uniformity purposes,
the top 3 ft of the embankment consisted of a borrowed A-6 soil from areas along the
right-of-way of the project. The climate was temperate (average summer temperature of
76 °F and 27 °F in winter, annual precipitation of 34 inches) with frost/thaw cycles
during the winter/spring months. (HRB, 1962)
The Concept of Serviceability and Structural Number
The performance of various pavements is a function of their relative ability to
serve traffic over a period of time. This definition of “relative” performance was stated in
Appendix F of the HRB Special Report 61E that described the findings of the pavement
research at the AASHO Road Test (HRB, 1962). It goes further stating: “At the time,
there were no widely accepted definitions of performance and therefore, a “relative”
performance definition should be used instead.”
14
The concept of serviceability is supported by five fundamental assumptions: (1)
highways are for the comfort of the traveling user; (2) the user’s opinion as to how a
highway should perform is highly subjective; (3) there are characteristics that can be
measured and related to user’s perception of performance; (4) performance may be
expressed by the mean opinion of all users; and (5) performance is assumed to be a
reflection of serviceability with increasing load applications.
Based on these assumptions the definition of present serviceability is: “The ability
of a specific section of pavement to serve high speed, high volume, and mixed traffic in
its existing condition.” (HRB, 1962) The Present Serviceability Ratio (PSR) is the
average of all users’ ratings of a specific pavement section on a scale from 5 to 0 (being 5
very good and 0 very poor). The mathematical correlation of pavement distresses
observed during visual surveys and profile measurements (roughness) with PSR is termed
the Present Serviceability Index (PSI); PSI is the measure of performance in the
AASHTO design equation. The correlation between PSI and typical flexible pavement
distresses observed during the AASHO Road Test is represented by the following
equation (HRB, 1962):
( )
2
5.03 1.91 log 1 1.38 0.01PSI SV RD C P= − ⋅ + − − + (3.1)
in which:
SV = mean of slope variance in the wheelpaths
RD = mean rut depth (in)
C = cracking (ft2
/1000 ft2
)
P = patching (ft2
/1000 ft2
)
15
1961 Interim Guide
The first results from data collected at the AASHO Road Test were released in the
form of Highway Research Board reports (HRB, 1961, 1962). The original design
equation was empirically developed for the specific subgrade type, pavement materials
and environmental conditions at the location of the AASHO Road Test as follows:
( ) ( )
( ) ( )
( )
18 5.19
log 4.2 4.2 1.5
log 9.36 log 1 0.20
0.4 1094 1
tp
W SN
SN
− −
= ⋅ + − +
+ +
(3.2)
in which:
W18 = accumulated 18 kip equivalent single axle load for the design period
pt = terminal serviceability at the end of design life
SN = structural number
The structural number (SN) is the parameter that represents the pavement
structural strength. It is given as the sum of the product of each layer thickness by its
structural layer coefficient, which is an empirical coefficient representing each layer’s
relative contribution to the pavement strength:
332211 DaDaDaSN ++= (3.3)
in which:
a1, a2, a3 = structural layer coefficients for surface, base, and subbase
D1, D2, D3 = thicknesses for surface, base, and subbase
The Equation (3.2) is solved for the structural number for a given traffic and
terminal serviceability criterion. The layer thicknesses are determined from Equation
(3.3). Note that there is not a unique solution for the layer thicknesses.
16
1972 Interim Guide
The 1972 Interim Design Guide was the first attempt to extend the empirical
relationships developed at the AASHO Road Test to a broader range of materials and
environmental conditions. This version also included the first step towards an overlay
design procedure. Some of the added features for flexible pavement designs are described
below.
An empirical soil support (Si) scale was developed to reflect the influence of
different local subgrade soils in Equation (3.2). The scale ranged from 1 to 10, with 10
corresponding to crushed stone materials and 1 to highly plastic clays. The A-6 subgrade
soil at the AASHO Road Test was defined as Si value of 3. All other values were to be set
by local agency experience, but there were no guidelines on how to determine these
values.
There was also a new regional factor R for adjusting the structural number for
local environment, estimated from serviceability loss rates in the AASHO Road Test.
These values varied between 0.2 and 5.0, with an annual average of about 1.0. Table 3.1
summarizes the recommended values for R.
Table 3.1. Recommended values for Regional Factor R (AASHTO, 1972).
Roadbed material condition R
Frozen to depth of 5’’ or more (winter) 0.2 – 1.0
Dry (summer and fall) 0.3 – 1.5
Wet (spring thaw) 4.0 – 5.0
The 1972 Interim Guide also specified ranges for structural layer coefficients
applicable to materials other than those used during the AASHO Road Test. The values
were based on a survey of state highway agencies that were using the 1961 Interim
Guide. Table 3.2 summarizes these values for different layer applications.
17
Table 3.2. Ranges of structural layer coefficients (AASHTO, 1972).
Coefficient Range
a1 (surface course) 0.17 – 0.45
a2 (untreated base) 0.05 – 0.18
a3 (subbase) 0.05 – 0.14
Equation (3.2) was modified to account for the new input terms:
( ) ( )
( ) ( )
( )
( )18 5.19
log 4.2 4.2 1.5 1
log 9.36 log 1 0.20 log 0.372 3
0.4 1094 1
t
i
p
W SN S
RSN
− −
= ⋅ + − + + + −
+ +
(3.4)
in which:
R = regional factor
Si = soil support value
and other terms are as previously defined
1986 and 1993 Guides
The 1986 revision of the 1972 Interim Guide added more features to the design
procedure. The focus was on four important issues: (1) better characterization of the
subgrade and unbound materials, (2) incorporation of pavement drainage, (3) better
consideration of environmental effects, and (4) incorporation of reliability as a factor into
the design equation.
In the 1986 version of the AASHTO Guide, the subgrade was for the first time
characterized by its resilient modulus MR, a fundamental engineering material property.
The structural layer coefficients for unbound materials were also related quantitatively to
resilient modulus by empirical equations.
18
Drainage quality was incorporated in the design process by introducing empirical
drainage coefficients into the structural number equation. Equation (3.3) becomes:
1 1 2 2 2 3 3 3SN a D a D m a D m= + + (3.5)
in which:
m2, m3 = drainage coefficients for base and subbase
and other terms are as previously defined
Recommended values for the drainage coefficients are defined based on the
quality of drainage and period of exposure to moisture levels near saturation.
Environmental effects were also considered in two additional distinct ways: (1)
separation of total serviceability losses into traffic and environmental components, and
(2) estimation of an effective subgrade resilient modulus that reflects seasonal variations
due primarily to moisture susceptibility. The loss in serviceability ΔPSI was decomposed
into three components:
ΔPSI = ΔPSITR + ΔPSISW + ΔPSIFH (3.6)
in which:
ΔPSITR, ΔPSISW, ΔPSIFH = components attributed to traffic, swelling and
frost heave, respectively
Appendix G in the 1986 AASHTO Guide describes in more detail the methods for
evaluating these environmental losses, which depend on the swell/frost heave rate,
probability of swell/frost heave, and maximum potential serviceability loss.
Reliability was introduced into the 1986 AASHTO Guide to account for the
effects of uncertainty and variability in the design inputs. Although it represents the
19
uncertainty of all inputs, it is very simply incorporated in the design equation through
factors that modify the allowable design traffic (W18).
There were few changes to the flexible pavement design procedure between the
1986 version and the current 1993 version. Most of the enhancements were geared
towards rehabilitation, the use of nondestructive testing for evaluation of existing
pavements, and backcalculation of layer moduli for determination of the layer
coefficients. The design equation did not change from the 1986 to 1993 version. The
complete description of the 1993 AASHTO Guide is presented in the following
subsections.
3.1.2. Current Design Equation
The 1993 AASHTO Guide specifies the following empirical design equation for
flexible pavements:
( ) ( )
( ) ( )
( )
( )18 0 5.19
log 4.2 1.5
log 9.36 log 1 0.20 2.32 log 8.07
0.4 1094 1
R
PSI
W Z S SN MR
SN
Δ −
= ⋅ + ⋅ + − + + ⋅ −
+ +
(3.7)
in which:
W18 = accumulated 18 kip equivalent single axle load for the design period
ZR = reliability factor
S0 = standard deviation
SN = structural number
ΔPSI = initial PSI – terminal PSI
MR = subgrade resilient modulus (psi)
20
The solution of Equation (3.7) follows the same procedure described before for
the previous versions of the Guide. Given all the inputs Equation (3.7) is solved for the
structural number (SN) and then the layer thicknesses can be computed. The solution is
not unique and different combination of thicknesses can be found. Additional design
constraints, such as costs and constructability, must also be considered to determine the
optimal final design. The 1993 Guide recommends the top-to-bottom procedure in which
each of the upper layers is designed to provide adequate protection to the underlying
layers. Figure 3.1 illustrates the procedure for a 3-layer flexible pavement. The steps in
this case are as follows:
• Calculate SN1 required to protect the base, using E2 as MR in Equation
(3.7), and compute the thickness of layer 1 as:
1
1
1
a
SN
D ≥ (3.8)
• Calculate SN2 required to protect the subgrade, using Equation (3.7), now
with the subgrade effective resilient modulus as MR. The thickness of the
base is computed as:
22
112
2
ma
DaSN
D
−
≥ (3.9)
AC
GA
Subgrade
D2 E2 a2 m2
D1 E1 a1
MR
SN1 SN2
AC
GA
Subgrade
AC
GA
Subgrade
D2 E2 a2 m2
D1 E1 a1
MR
SN1 SN2
Figure 3.1. General procedure for computing thickness.
21
3.1.3. Input Variables
The input variables required for the 1993 AASHTO guide are summarized in this
section and the most important recommendations are described. Additional guidance can
be found in the literature (AASHTO, 1993; Huang, 2004).
Design period and serviceability loss are the initial inputs to be defined.
Serviceability loss is defined as the difference between initial and terminal serviceability.
Initial serviceability is the condition immediately after pavement construction. The
conventional value is 4.2 (the average initial serviceability value at the AASHO Road
Test). Terminal serviceability is the value at which the pavement is no longer capable of
providing adequate service and major rehabilitation is required. Most state agencies have
their own specification, although the 1993 AASHTO Guide recommends a terminal PSI
of 2.5 for major highways and 2.0 for low volume roads, unless otherwise specified.
The other input variables are separated into three groups: (a) traffic, (b) material
properties, and (c) environmental effects.
Traffic
Vehicle and load distributions grouped by axle type are used to transform mixed
traffic into a unified traffic parameter that can be used in the design equation. The mixed
traffic is converted into one parameter called the Equivalent Single Axle Load (ESAL).
ESAL is defined as the number of 18-kip single axles that causes the same pavement
damage as caused by the actual mixed axle load and axle configuration traffic. The
damage associated with the equivalent axle can be defined in numerous ways; in the 1993
AASHTO Guide it is defined in terms of serviceability. The 18-kip single axle load was
22
chosen because it was the maximum legal load permitted in many states at the time of the
AASHO Road Test (Zhang et al., 2000).
The first step in calculating ESALs for mixed traffic is to establish first the load
equivalent factor (LEF) of every axle of the traffic distribution. In the 1993 AASHTO
Guide, LEFs were developed based on empirical data obtained from the AASHO Road
Test. The AASHTO LEFs consider the following variables:
• Axle load
• Axle configuration (e.g., single, tandem, etc.)
• Structural number (for flexible pavements)
• Terminal serviceability
The computation of LEFs for flexible pavements is based on the following
equations (Huang, 2004):
18t
tx
W
LEF
W
= (3.10a)
( ) ( )2 2
18 18
log 4.79log 18 1 4.79log 4.33logtx t t
x
t x
W G G
L L L
W β β
⎛ ⎞
= + − − + + −⎜ ⎟
⎝ ⎠
(3.10b)
4.2
log
4.2 1.5
t
t
p
G
−⎛ ⎞
= ⎜ ⎟
−⎝ ⎠
(3.10c)
( )
( )
3.23
2
5.19 3.23
2
0.081
0.40
1
x
x
L L
SN L
β
+
= +
+
(3.10d)
in which:
Wtx = number of x-axle load applications applied over the design period
Wt18 = number of equivalent 18-kip (80 kN) single axle load applications
over the design period
23
Lx = load on one single axle, or a set of tandem or tridem, in kip
L2 = axle code (1 for single axle, 2 for tandem, and 3 for tridem)
SN = structural number of the designed pavement
pt = terminal serviceability
β18 = βx for Lx = 18 kip and L2 = 1
With LEF calculated for every load group, the second step is to compute the truck
factor Tf as follows:
( )f i i
i
T p LEF A= × ×∑ (3.11)
in which:
pi = percentage of repetitions for ith
load group
LEFi = LEF for the ith
load group (e.g., single-12kip, tandem-22kip, etc.)
A = average number of axles per truck
The number of ESALs is calculated as follows:
YLDGTTAADTESAL f ×××××××= 365 (3.12)
in which:
AADT = annual average daily traffic
T = percentage of trucks
G = growth factor
D = trucks in design direction (%)
L = trucks in design lane (%)
Y = design period
24
Material properties
The fundamental material property in the 1993 AASHTO Guide is the resilient
modulus. Since the framework was constructed based upon structural layer coefficients,
empirical relationships were developed to correlate resilient modulus with structural layer
coefficient. Figure 3.2 summarizes the relationship for the layer coefficient a1 for asphalt
concrete.
Figure 3.2. Chart for estimating layer coefficient for asphalt concrete based on elastic
modulus (AASHTO, 1993)
The layer coefficient a2 for nonstabilized base materials is given by:
977.0log249.0 22 −= Ea (3.13)
and the layer coefficient a3 for nonstabilized subbase materials is given by:
839.0log227.0 33 −= Ea (3.14)
in which:
25
E2 = resilient modulus of unbound base layer materials
E3 = resilient modulus of unbound subbase layer materials
The layer coefficients in the AASHO Road Test were assumed equal to 0.44 for
asphalt concrete, which corresponds to a MR = 450,000 psi; 0.14 for the granular base,
corresponding to MR = 30,000 psi; and 0.11 for the subbase, equivalent to MR = 15,000
psi.
The subgrade is characterized solely by its resilient modulus in Equation (3.7).
There are also several correlations between MR and other soil properties that can be found
in the literature. Most of them relate MR to CBR or R-Value (Heukelom and Klomp,
1962; Asphalt Institute, 1982; Van Til et al., 1972 – after Huang, 1993; NCHRP, 2004).
Environmental Effects
Environmental effects (other than swelling and frost heave) are accounted for in
two input parameters in the 1993 AASHTO Guide, the seasonally-adjusted subgrade
resilient modulus and the drainage coefficient mi applied to the structural number in
Equation (3.5).
It is recommended that an effective subgrade resilient modulus be used to
represent the effect of seasonal variations, especially for moisture-sensitive fine-grained
soils or for locations with significant freeze-thaw cycles (AASHTO, 1993). The effective
resilient modulus is the equivalent modulus that would result in the same damage to the
pavement as if seasonal modulus were used. The relative damage ur is describe by the
following empirical relationship:
32.28
1018.1
−
×= Rr Mu (3.15)
26
The average relative damage (uf) is computed by taking the average of ur of all
seasons. The effective subgrade resilient modulus is then given by:
431.0
3015
−
⋅= fR uM (3.16)
The drainage coefficient is related to the material’s permeability and the amount
of time that the material is expected to be at near saturation conditions. Table 3.3 shows
recommended drainage coefficients for unbound materials. However, in practice it is
difficult to assess the quality of drainage or the percentage of time the material is exposed
to near saturation conditions, and most agencies use drainage coefficient values of 1.0,
relying mostly on the effective subgrade resilient modulus as the climatic-sensitive input
parameter2
.
Table 3.3.Recommended drainage coefficients for unbound bases and subbases in
flexible pavements (Huang, 1993).
Quality of drainage
Percentage of time pavement structure exposed to
moisture levels approaching saturation
Rating
Water
removed
within
Less than
1%
1-5% 5-25%
Greater
than 25%
Excellent 2 hours 1.40-1.35 1.35-1.30 1.30-1.20 1.20
Good 1 day 1.35-1.25 1.25-1.15 1.15-1.00 1.00
Fair 1 week 1.25-1.15 1.15-10.5 1.00-0.80 0.80
Poor 1 month 1.15-1.05 1.05-0.80 0.80-0.60 0.60
Very poor Never drain 1.05-0.95 0.95-0.75 0.75-0.40 0.40
3.1.4. Reliability
There are many sources for uncertainties in pavement design problems – e.g.,
traffic prediction, material characterization and behavior modeling, environmental
2
In the survey done with 5 states for the sensitivity analysis presented in Chapter 4, all of them
responded that their drainage coefficient were equal to 1.0.
27
conditions, etc. – as well as variability during construction and maintenance. The
uncertainty comes not only from data collection, but also from the lack of input
parameters required to better characterize traffic, materials and environmental conditions.
The reliability factor was introduced in the design equation to account for these
uncertainties.
Reliability is defined as the probability that the design pavement will achieve its
design life with serviceability higher than or equal to the specified terminal serviceability.
Although the reliability factor is applied directly to traffic in the design equation, it does
not imply that traffic is the only source of uncertainty.
Table 3.4 suggests appropriate levels of reliability for various highway classes.
There is some guidance on how reliability is considered. High volume and high speed
highways have higher reliability factors than minor roads and local routes. The standard
deviation (S0) and reliability factor (ZR) parameters in the design equation are
respectively defined as the standard deviation of uncertainties and the area under a
normal distribution curve for p < reliability. The parameter ZR can be retrieved from
Table 3.5. The 1993 AASHTO Guide recommends values for S0 between 0.35 and 0.45
for flexible pavements.
Table 3.4. Suggested levels of reliability for various highway classes (AASHTO, 1993).
Recommended level of
reliabilityFunctional classification
Urban Rural
Interstate and freeways 85-99.9 80-99.9
Principal arterials 80-99 75-95
Collectors 80-95 75-95
Locals 50-80 50-80
28
Table 3.5. ZR values for various levels of reliability (Huang, 1993).
Reliability ZR Reliability ZR
50 0.000 93 -1.476
60 -0.253 94 -1.555
70 -0.524 95 -1.645
75 -0.674 96 -1.751
80 -0.841 97 -1.881
85 -1.037 98 -2.054
90 -1.282 99 -2.327
91 -1.340 99.9 -3.090
92 -1.405 99.99 -3.750
3.1.5. Considerations and Comments Found in the Literature
Several researchers have studied the AASHTO Guide in all its versions. This
section summarizes the relevant findings gathered from the literature that discuss
conflicting issues such as traffic, material properties, environmental conditions, and
parametric sensitivity of the design equation.
Serviceability cannot be directly measured in the field. A panel of users is
required to provide subjective assessments of serviceability. This value is the Present
Serviceability Ratio (PSR). The correlation of PSR with measured distresses is the
Present Serviceability Index (PSI). PSI is the input parameter of the design equation, not
the PSR, because determining PSR is very subjective, not to mention expensive and time
consuming. Alternative approaches are available correlating PSI with roughness, which is
a more reliable, and more easily measured parameter than the recommended distresses
given in Equation (3.1) (Al-Omari and Darter, 1994; Gulen et al., 1994).
Traffic has been a controversial parameter in the 1993 AASHTO Guide and its
earlier versions. The fact that it relies on a single value to represent the overall traffic
spectrum is questionable. The method used to convert the traffic spectra into ESALs by
29
applying LEFs is also questionable. The AASHTO LEFs consider serviceability as the
damage equivalency between two axles. Zhang et al. (2000) have found that Equations
3.10, used to determine LEFs, are also capable of capturing damage in terms of
equivalent deflection, which is easier to measure and validate. However quantifying
damage equivalency in terms of serviceability or even deflections is not enough to
represent the complex failure modes of flexible pavements.
Several studies were conducted to investigate effects of different load types and
magnitudes on damage of pavement structures using computed mechanistic pavement
responses (Sebaaly and Tabatabaee, 1992; Zaghloul and White, 1994). Hajek (1995)
proposed a general axle load equivalent factor – independent from pavement-related
variables and axle configurations, based only on axle load – suitable for use in pavement
management systems and simple routine design projects.
Today it is widely accepted that load equivalency factors are a simple technique
for incorporating mixed traffic into design equations and are well suited for pavement
management systems. However pavement design applications require more
comprehensive procedures. Mechanistic-empirical design procedures take a different
approach for this problem; different loads and axle geometrics are mechanistically
analyzed to determine directly the most critical structural responses that are significant to
performance predictions, avoiding the shortcut of load equivalency factors.
Layer coefficients have also been of interest to those developing and enhancing
pavement design methods. Several studies have been conducted to find layer coefficients
for local and new materials (Little, 1996; Richardson, 1996; MacGregor et al., 1999).
Coree and White (1990) presented a comprehensive analysis of layer coefficients and
30
structural number. They showed that the approach was not appropriate for design
purposes. Baladi and Thomas (1994), through a mechanistic evaluation of 243 pavement
sections designed with the 1986 AASHTO guide, demonstrated that the layer coefficient
is not a simple function of the individual layer modulus, but a function of all layer
thicknesses and properties.
There are several studies in the literature of the environmental influences in the
AASHTO method. There are two main environmental factors that impact service life of
flexible pavements: moisture and temperature. The effect of moisture on subgrade
strength has been well documented in past years and uncountable publications about
temperature effects on asphalt concrete are available. Basma and Al-Suleiman (1991)
suggested using empirical relations between moisture content and resilient modulus
directly in the design Equation (3.7). The variation of the structural number with moisture
content was defined as ΔSN and was used to adjust the calculated SN. Basma and Al-
Suleiman (1991) also suggested using a nomograph containing binder and mixture
properties to determine the layer coefficient for asphalt concrete layer. Noureldin et al.
(1996) developed an approach for considering temperature effects in the 1993 AASHTO
design equation. In their approach, the mean annual pavement temperature is used to
compute temperature coefficients that modify the original asphalt concrete layer
coefficient used to compute the structural number.
The 1993 AASHTO Guide and its earlier versions were developed based on
results from one test site trafficked over two years with a total of slightly over one million
ESALs. From this test track, which was built with the same materials varying only
thicknesses, the design equation was developed. Studies have shown that despite of the
31
adjustments made over the years to the design equation in attempts to expand its
suitability to different climate regions and materials, the design of flexible pavements still
lacks accuracy in performance predictions and in ability to include different materials and
their complex behavior.
3.2. NCHRP 1-37A Design Procedure
The NCHRP 1-37A procedure is a mechanistic-empirical (M-E) method for
designing and evaluating pavement structures. Structural responses (stresses, strains and
deflections) are mechanistically calculated based on material properties, environmental
conditions, and loading characteristics. These responses are used as inputs in empirical
models to compute distress performance predictions.
The NCHRP 1-37A procedure was developed under a research project funded by
the National Cooperative Highway Research Program (NCHRP) and released in draft
form in April, 2004 (NCHRP, 2004).
The NCHRP 1-37A still depends on empirical models to predict pavement
performance from calculated structural responses and material properties. The accuracy
of these models is a function of the quality of the input information and the calibration of
empirical distress models to observed field performance. Two types of empirical models
are used in the NCHRP 1-37A. One type predicts the magnitude of the distress
accumulation directly (e.g., rutting model for flexible pavements, and faulting for rigid);
the other type predicts first the number of load applications to failure (i.e., given a
specific load and climate condition) which is then empirically related to the distress
32
accumulation (e.g., fatigue cracking for flexible pavements, and transverse cracking for
rigid).
This section briefly describes the NCHRP 1-37A procedure. A description of the
design process is provided, followed by information about the components of the design
procedure: inputs (design criteria, traffic, material properties, and environmental
conditions), pavement response models (mechanistic structural computational tools and
climate model), empirical performance models, and reliability.
3.2.1. Design process
The NCHRP 1-37A design process is not as straightforward as the 1993
AASHTO guide, in which the structure’s thicknesses are obtained directly from the
design equation. Instead an iterative process is used in which predicted performance of
selected pavement structure is compared against the design criteria as shown in Figure
3.3. The structure and/or material selection are adjusted until a satisfactory design is
achieved. A step-by-step description is as follows:
• Definition of a trial design for specific site conditions: subgrade support,
material properties, traffic loading, and environmental conditions;
• Definition of design criteria for acceptable pavement performance at the
end of the design period (i.e., acceptable levels of rutting, fatigue cracking,
thermal cracking, and roughness);
• Selection of reliability level for each one of the distresses considered in
the design;
33
• Calculation of monthly traffic loading and seasonal climate conditions
(temperature gradients in asphalt concrete layers, moisture content in
unbound granular layers and subgrade);
• Modification of material properties in response to environmental
conditions;
• Computation of structural responses (stresses, strains and deflections) for
each axle type and load and for each time step throughout the design
period;
• Calculation of predicted distresses (e.g., rutting, fatigue cracking) at the
end of each time step throughout the design period using the calibrated
empirical performance models;
• Evaluation of the predicted performance of the trial design against the
specified reliability level. If the trial design does not meet the performance
criteria, the design (thicknesses or material selection) must be modified
and the calculations repeated until the design is acceptable.
The NCHRP 1-37A procedure is implemented in software in which all of above
steps are performed automatically, except for the pavement structure and material
selection.
34
Traffic
Foundation
Climate
Material Properties
Trial Design
Structural Response
Models
Distress Prediction
Models
Meet
Performance
Criteria?
Available for
Strategy Selection
Yes
No
No
InputsInputs AnalysisAnalysis
Results
Traffic
Foundation
Climate
Material Properties
Trial Design
Structural Response
Models
Distress Prediction
Models
Meet
Performance
Criteria?
Available for
Strategy Selection
Yes
No
No
InputsInputs AnalysisAnalysis
Results
Figure 3.3. M-E flexible pavement design flow chart.
The NCHRP 1-37A has a hierarchical approach for the design inputs, defined by
the quality of data available and importance of the project. There are three levels:
• Level 1 – Laboratory measured material properties are required (e.g.,
dynamic modulus master curve for asphalt concrete, nonlinear resilient
modulus for unbound materials). Project-specific traffic data is also
required (e.g., vehicle class and load distributions);
• Level 2 – Inputs are obtained through empirical correlations with other
parameters (e.g., resilient modulus estimated from CBR values);
• Level 3 – Inputs are selected from a database of national or regional
default values according to the material type or highway class (e.g., soil
35
classification to determine the range of resilient modulus, highway class to
determine vehicle class distribution).
According to the NCHRP 1-37A report, level 1 is recommended for heavily
trafficked highways where premature failure is economically undesirable. Level 2 can be
used for intermediate projects, while level 3 is recommended for minor projects, usually
low traffic roads. In addition, level 3 may be appropriate for pavement management
programs widely implemented in highway state agencies.
The NCHRP 1-37A methodology uses the Multi-Layer Linear Elastic Theory
(MLET) to predict mechanistic responses in the pavement structure. When level 1
nonlinear stiffness inputs for unbound material are selected, MLET is not appropriate and
a nonlinear Finite Element Method (FEM) is used instead.
Level 3 was used throughout this study because (a) at present there are rarely
level 1 input data to be used on a consistent basis, and (b) the final version of the NCHRP
1-37A software was calibrated using level 3.
3.2.2. Inputs
The hierarchical level defines what type of input parameter is required. This
section describes the input variables required for level 3.
Design Criteria
The design criteria are defined as the distress magnitudes at the minimum
acceptable level of service. The design criteria are agency-defined inputs that may vary
by roadway class, location, importance of the project, and economics.
36
The distresses considered for flexible pavements are: permanent deformation
(rutting), “alligator” fatigue cracking (bottom-up), “longitudinal” cracking (top-down),
thermal cracking, and roughness. The only functional distress predicted is roughness.
Friction is not considered in the NCHRP 1-37A methodology. Among all these distresses,
roughness is the only one not predicted entirely from mechanistic responses. Roughness
predictions also include other non-structural distresses and site factors. Design criteria
must be specified for each of these distresses predicted in the NCHRP 1-37A
methodology.
Traffic
The NCHRP 1-37A methodology uses the concept of load spectra for
characterizing traffic. Each axle type (e.g., single, tandem) is divided in a series of load
ranges. Vehicle class distributions, daily traffic volume, and axle load distributions define
the number of repetitions of each axle load group at each load level. The specific traffic
inputs consist of the following data:
• Traffic volume – base year information:
o Two-way annual average daily truck traffic (AADTT)
o Number of lanes in the design direction
o Percent trucks in design direction
o Percent trucks in design lane
o Vehicle (truck) operational speed
• Traffic volume adjustment factors:
o Vehicle class distribution factors
37
o Monthly truck distribution factors
o Hourly truck distribution factors
o Traffic growth factors
• Axle load distribution factors
• General traffic inputs:
o Number axles/trucks
o Axle configuration
o Wheel base
o Lateral traffic wander
Vehicle class is defined using the FHWA classification (FHWA, 2001).
Automatic Vehicle Classification (AVC) and Weigh-in-Motion (WIM) stations can be
used to provide data. The data needs to be sorted by axle type and vehicle class to be used
in the NCHRP 1-37A procedure. In case site-specific data are not available, default
values are recommended in the procedure.
The use of load spectra enhances pavement design. It allows mixed traffic to be
analyzed directly, avoiding the need for load equivalency factors. Additional advantages
of the load spectra approach include: the possibility of special vehicle analyses, analysis
of the impact on performance of overloaded trucks, and analysis of weight limits during
critical climate conditions (e.g., spring thawing).
Environment
The environmental conditions are predicted by the Enhanced Integrated Climatic
Model (EICM). The following data are required:
38
• Hourly air temperature
• Hourly precipitation
• Hourly wind speed
• Hourly percentage sunshine
• Hourly relative humidity
These parameters can be obtained from weather stations close to the project
location. The NCHRP 1-37A software includes a library of weather data for
approximately 800 weather stations throughout the U.S.
Additional environmental data are also required:
• Groundwater table depth
• Drainage/surface properties:
o Surface shortwave absorptivity
o Infiltration
o Drainage path length
o Cross slope
The climate inputs are used to predict moisture and temperature distributions
inside the pavement structure. Asphalt concrete stiffness is sensitive to temperature
variations and unbound material stiffness is sensitive to moisture variations. The EICM is
described later in Section 3.2.3.
39
Material Properties
The NCHRP 1-37A methodology requires a large set of material properties. Three
components of the design process require material properties: the climate model, the
pavement response models, and the distress models.
Climate-related properties are used to determine temperature and moisture
variations inside the pavement structure. The pavement response models use material
properties (corrected as appropriate for temperature and moisture effects) to compute the
state of stress/strain at critical locations in the structure due to traffic loading and
temperature changes. These structural responses are used by the distress models along
with complementary material properties to predict pavement performance.
Only flexible pavements were studied in this research and therefore only material
properties for asphalt concrete and unbound materials are described. Table 3.6
summarizes the flexible pavement material properties required by the NCHRP 1-37A
procedure. (Recall that measured properties are level 1 inputs, correlations with other
parameters are level 2, and default values selected from typical ranges are level 3.)
Table 3.6. Material inputs requirement for flexible pavements.
Material inputs requiredMaterial
Category Climatic models Response models Distress models
Asphalt
concrete
- mixture: surface shortwave
absorptivity, thermal
conductivity, and heat capacity
- asphalt binder: viscosity
(stiffness) characterization
- time-temperature
dependent dynamic
modulus (E*) of HMA
mixture
- Poisson’s ratio
- tensile strength,
- creep compliance
- coefficient of thermal
expansion
Unbound
materials
- plasticity index
- gradation parameters
- effective grain sizes
- specific gravity
- saturated hydraulic
conductivity
- optimum moisture content
- parameters to define the soil-
water characteristic curve
- resilient modulus (Mr)
at optimum density and
moisture content
- Poisson’s ratio
- unit weight
- coefficient of lateral
pressure
- gradation parameters
40
Two material properties required in the NCHRP 1-37A methodology are
considered innovative for pavement design methods, the dynamic modulus for asphalt
concrete and the nonlinear stiffness model for unbound materials. Time- and temperature-
dependency of asphalt mixtures is characterized by the dynamic modulus, |E*|. The
dynamic modulus master curve describes the variation of asphalt concrete stiffness due to
rate of loading and temperature variation (hardening with low temperature/high
frequency and softening with high temperature/low frequency). The nonlinear elastic
behavior of unbound granular materials is modeled by a stress-dependent resilient
modulus included as level 1 input.
Asphalt Concrete
The complex dynamic modulus |E*| is the principal material property input for
asphalt concrete. It is a function of mixture characteristics (binder, aggregate gradation,
and volumetrics), rate of loading, temperature, and age. For level 1 inputs, the dynamic
modulus master curve is constructed based on time-temperature superposition principles
(Huang, 2004; Pellinen et al., 2004) by shifting laboratory frequency sweep test data.
Binder viscosity measured using the dynamic shear rheometer (DSR) is also a required
level 1 input. Aging effects on binder viscosity are simulated using the Global Aging
System, which considers short term aging from mix/compaction and long term aging
from oxidation (NCHRP 1-37A report, appendix CC-4, 2004).
For level 2 and 3 inputs, the dynamic modulus master curve is obtained via an
empirical predictive equation. The |E*| predictive equation is an empirical relationship
between |E*| and mixture properties:
41
( )
2
200 200 4log * 3.750063 0.02932 0.001767 0.002841 0.058097 aE Vρ ρ ρ= + ⋅ − ⋅ − ⋅ − ⋅
( )
( ) ( )( )
2
4 38 38 34
0.603313 0.313351 log 0.393532 log
3.871977 0.0021 0.003958 0.000017 0.005470
0.802208
1
beff
f
beff a
V
V V e
η
ρ ρ ρ ρ
− − ⋅ − ⋅
⎛ ⎞ + ⋅ + ⋅ − ⋅ + ⋅
− ⋅ +⎜ ⎟⎜ ⎟+ +⎝ ⎠
(3.17)
in which:
E* = dynamic modulus, 105
psi
η = binder viscosity, 106
Poise
f = loading frequency, Hz
Va = air void content, %
Vbeff = effective binder content, % by volume
ρ34 = cumulative % retained on the 19-mm sieve
ρ38 = cumulative % retained on the 9.5-mm sieve
ρ4 = cumulative % retained on the 4.75-mm sieve
ρ200 = % passing the 0.075-mm sieve
The binder’s viscosity at any temperature is given by the binder’s viscosity-
temperature relationship:
RTVTSA logloglog ⋅+=η (3.18)
in which:
η = bitumen viscosity, cP
TR = temperature, Rankine (TR=TFahrenheit+460)
A = regression intercept
VTS = regression slope of viscosity temperature susceptibility
42
For level 2 asphalt concrete inputs, binder parameters A and VTS are determined
from DSR testing. For level 3, default A and VTS values are based on the binder grading
(e.g., Superpave performance grade, penetration grade, or viscosity grade).
Additional asphalt concrete material properties are required to predict thermal
cracking: (1) tensile strength, (2) creep compliance, (3) coefficient of thermal expansion,
(4) surface shortwave absorptivity, and (5) thermal conductivity and heat capacity. The
last two properties are also required for the climatic model (EICM). Tensile strength and
creep compliance are determined in the laboratory using the indirect tensile test for level
1 and 2 inputs. At level 3, these properties are correlated with other material parameters.
Unbound Materials
Resilient modulus is the principal unbound material property required for the
structural response model. Level 1 resilient modulus values are determined from
laboratory test data as fitted to the stress-dependent stiffness model:
2 3
1
k k
oct
R a
a a
M k p
p p
τθ⎛ ⎞ ⎛ ⎞
= ⎜ ⎟ ⎜ ⎟
⎝ ⎠ ⎝ ⎠
(3.19)
in which:
MR = resilient modulus
θ = bulk stress = σ1 + σ2 + σ3
σ1 = major principal stress
σ2 = intermediate principal stress = σ3 for MR test on cylindrical specimens
σ3 = minor principal stress/confining pressure
τoct = octahedral shear stress = ( ) ( ) ( )2
32
2
31
2
21
3
1
σσσσσσ −+−+−
pa = atmospheric pressure (used to normalize the equation)
43
k1, k2, k3 = regression constants determined from the laboratory tests
At level 2 the resilient modulus is correlated with other parameters (e.g.,
California Bearing Ratio (CBR), R-value, AASHTO layer coefficient). At level 3 the
resilient modulus can be selected from a range of default values that are typical for the
material type and/or soil classification. The input resilient modulus data at all levels are
assumed to be at optimum moisture content and density; this value is adjusted by the
EICM for seasonal climate variations. There is also an option for direct entry of a best
estimate for the seasonally-adjusted unbound resilient modulus, in which case the EICM
is bypassed.
Poisson’s ratio is also required for the structural response model. It can be
determined from laboratory testing, correlations with other properties, or estimated from
ranges of typical values. The Atterberg limits, gradation, hydraulic conductivity,
maximum dry unit weight, specific gravity, optimum moisture, and degree of saturation
are additional unbound material inputs used for determining the effect of seasonal climate
variations on resilient modulus.
3.2.3. Pavement Response Models
The NCHRP 1-37A procedure utilizes three models to predict pavement structural
responses (stresses, strains, and displacements). Multi-Layer Elastic Theory (MLET) and
the Finite Element Model (FEM) are used to compute responses due to traffic loading and
the Enhanced Integrated Climate Model (EICM) is used to predict temperature and
moisture histories throughout the pavement structure. When non-linear behavior of
44
unbound materials is desired–i.e., for level 1 inputs—the FEM is chosen; otherwise the
load-related analysis is done with MLET.
The load-related structural responses are predicted at critical locations based on
maximum damage. The response at each point is evaluated at various depths and
afterward the most critical is used to predict pavement distress performance. Figure 3.4
shows in plan view the location of possible critical points for single, tandem, and tridem
axles. If a single axle is being analyzed, line Y1 of points is used; if tandem, lines Y2 and
Y3; and if tridem, lines Y2, Y3, Y6 and Y7 (NCHRP, 2004).
Figure 3.4. Summary of schematics for horizontal location of critical response predictions
(NCHRP, 2004)
The depths at which the calculations are performed depend on the distress type:
• Fatigue cracking
o at surface (top-down cracking)
o 0.5 inches from the surface (top-down cracking)
o at the bottom of the asphalt concrete layer (bottom-up cracking)
• Rutting
o mid-depth of each layer/sublayer
o top of subgrade
45
o 6 inches below the top of subgrade
Each pavement layer is divided into thin sublayers so that properties varying in
the vertical direction are represented better (e.g., asphalt concrete layer is divided and
different dynamic moduli are assigned depending on the temperature in each sublayer).
For flexible pavements, the sublayering is determined as follows:
• The first 1 inch of asphalt concrete (AC) is divided into two 0.5-inch
sublayers. The remaining AC thickness is divided into 1-inch sublayers until 4
inches of total depth from the surface is achieved. The remaining thickness, if
there is any, is considered the final AC sublayer.
• The unbound base is divided into a + nb sublayers, in which a has half the
thickness of b. The number of remaining sublayers is determined by: n=int[(hbase-
2)/4]. Therefore, the total number of sublayers is n+1. This procedure is valid for
base thickness exceeding 6 inches.
• The subgrade is divided into 3 sublayers of equal thickness until the total
depth of the pavement structure reaches 8 feet. From this point on there is no
more sublayering and the remaining subgrade is treated as an infinite layer.
Multi-layer Linear Elastic Theory
The first attempt to calculate displacements due to loading on an elastic half-
space, such as the surface of an homogeneous material with infinite area and depth, was
made by Kelvin in 1868 (Croney and Croney, 1997). Later, Boussinesq’s solution (1885)
for a concentrated load became a fundamental tool to compute stress, strain and
deflection. The solution could be integrated to obtain responses due to a general surface
46
load, including a circular loaded area (Huang, 1993). The concept of multi-layer analysis
has its roots in the Burmister two-layer and three-layer solutions (Burmister, 1945);
charts and tables summarizing these solutions were developed later (Foster and Alvin,
1954; Burmister, 1958; Jones, 1962; Huang, 1969, and 1973).
Burmister’s layered theory can be applied to a multi-layer system of linear elastic
materials structured on top of a half space subgrade following the basic assumptions
(Huang, 1994):
• Each layer is homogeneous, isotropic, and linearly elastic, characterized
by Young’s modulus of elasticity, E, and Poisson’s ratio, ν.
• The material is weightless and horizontally infinite
• The thickness of each layer is finite, and the subgrade is considered as
infinite layer.
• The load is uniformly applied on the surface over a circular area.
• Continuity conditions are satisfied at the layer interfaces.
In the NCHRP 1-37A procedure, the MLET is implemented in a modified version
of the JULEA algorithm (NCHRP, 2004). Using the principle of superposition, single
wheels can be combined spatially into multi-wheel axles to simulate different axle
configurations.
The small set of input parameters required by MLET facilitates its
implementation and use. The only inputs required are the layer thicknesses, the elastic
properties (Young’s modulus of elasticity and Poisson’s ratio) for each layer, the tire
pressure, and the tire contact area. The main disadvantage of MLET is its inability to
consider nonlinearities often exhibited by pavement materials.
47
Finite Element Method
The Finite Element Method (FEM) allows structural modeling of a multi-layer
pavement section having material properties that can vary both vertically and horizontally
throughout the profile. It is a versatile tool capable of considering three dimensional
geometries, non-linear material behavior, large strain effects, dynamic loading and other
features. It is well suitable for structural evaluation and response prediction of pavements.
Although its robustness permits solving more complex problems, the longer
computational time compared to MLET represents a significant disadvantage.
The general idea of finite element technique is the partitioning of the problem into
small discrete elements (mesh), formulating an approximation to the stress and strain
variations across each individual element, and then applying equilibrium requirements to
combine the individual elements to get the formulation for the global problem in terms of
a set of simultaneous linear equations. The solution is therefore a piecewise
approximation to the true solution. In the NCHRP 1-37A methodology, the FEM was
implemented with the following features:
• Linearly elastic behavior for asphalt concrete
• Nonlinearly elastic behavior (stress-dependent stiffness model) with
tension cut-off for unbound materials
• Fully bonded, full slip, and intermediate interface conditions between
layers
The asphalt concrete layer is modeled as a linearly elastic material with stiffness
given by the mixture dynamic modulus master curve. The stress dependence of unbound
material is expressed by the stiffness model described in section 3.2.2 as:
48
32
1
k
a
oct
k
a
aR
pp
pkM ⎟⎟
⎠
⎞
⎜⎜
⎝
⎛
⎟⎟
⎠
⎞
⎜⎜
⎝
⎛
=
τθ
(3.20)
in which the parameters are as previously described. The tension cut-off feature is
triggered whenever tensile principal stresses are calculated in the unbound layers (the
excess tensile stress is distributed over neighboring elements in an iterative process). The
load is applied in small increments, and the stress/strain output from each increment
provides the initial condition for the next stage (NCHRP, Appendix RR, 2004).
EICM Environmental Model
EICM is a mechanistic model of one dimensional heat and moisture flow that
simulates changes in the behavior and characteristics of pavement and subgrade materials
induced by environmental factors (NCHRP, 2004). Daily and seasonal variations of
temperature and moisture within the pavement structure are induced by the weather
history at the project site.
Different material types have different responses to climatic variations. Unbound
materials are affected by moisture change and by freeze-thaw cycles during winter and
spring seasons. Asphalt concrete responds to temperature variations, which affects
directly the dynamic modulus of the mixture. Temperature is also the cause of thermal
cracks, either from a single thermal variation or from repetitive cycles of warm/cool
temperatures.
The EICM consists of three major components (NCHRP, 2004):
• The Climatic-Materials-Structural Model (CMS Model) originally
developed at the University of Illinois (Dempsey et al., 1985)
49
• The CRREL Frost Heave and Thaw Settlement Model (CRREL Model)
originally developed at the United States Army Cold Regions Research and
Engineering Laboratory (CRREL) (Guymon et al., 1986)
• The Infiltration and Drainage Model (ID Model) originally developed at
Texas A&M University (Lytton et al., 1990)
In the case of flexible pavements, three major environmental effects are of
particular interest:
• Temperature variations for the asphalt concrete. The dynamic modulus of
asphalt concrete mixtures is very sensitive to temperature. Temperature
distributions in asphalt concrete layers are predicted and then used to define the
stiffness of the mixture throughout the sublayers. Temperature distributions are
also used as inputs for the thermal cracking prediction model.
• Moisture variation for subgrade and unbound materials. The resilient
modulus input of unbound materials is defined as being at optimum density and
moisture content. A correction factor is defined to adjust the resilient modulus
based on predicted moisture content.
• Freezing and thawing for subgrade and unbound materials. The resilient
modulus of unbound materials located within the freezing zone increases during
freezing periods and decrease during thawing periods. The EICM predicts the
formation of ice lenses and defines the freezing zone.
50
3.2.4. Empirical Performance Models
This section presents a description of empirical models for predicting
performance of flexible pavements in the NCHRP 1-37A procedure. The models
described here are the following: “alligator” or bottom-up fatigue cracking, longitudinal
or top down fatigue cracking, thermal cracking, rutting and roughness. The calibration of
these models was done using the Long Term Pavement Performance (LTPP) database
with sections distributed all over the U.S. This calibration effort is defined in the NCHRP
1-37A methodology as the national calibration.
The national calibration was a task undertaken by the NCHRP 1-37A project team
to determine calibration coefficients for the empirical distress models that would be
representative of the wide range of materials available in the U.S. for pavement
construction. The LTPP database was used as primary source of data for this purpose.
Permanent deformation, longitudinal (top-down), alligator (bottom-up) and thermal
cracking were calibrated for flexible pavement sections. According to the NCHRP 1-37A
report, the roughness model was developed directly using the LTPP data and therefore
required no additional calibration.
The importance of calibration is evident. Pavement structures behave in different
ways and the current state-of-the-art mechanistic models are not capable of fully
predicting the behavior of pavement structures. The empirical models are not sufficient to
stand alone and capture the wide possibilities of failure mechanism. In addition, most of
these models were developed from laboratory test data and laboratory-field shifting
factors are required.
51
Alligator Fatigue Cracking
“Alligator” fatigue cracking develops from mechanical failure caused by tensile
strains at the bottom of asphalt concrete layers and once developed propagates upwards.
It is also known as bottom-up cracking. Stiffer mixtures or thin layers are more likely to
exhibit bottom-up fatigue cracking problems, which makes it a problem often aggravated
by cold weather. It is also noted that the supporting layers are important for the
development of fatigue cracking. Soft layers placed immediately below the asphalt
concrete layer increase the tensile strain magnitude at the bottom of the asphalt concrete
and consequently increase the probability of fatigue crack development.
Fatigue cracking is evaluated by first predicting damage and then converting
damage into cracked area. The model used in the NCHRP 1-37A procedure was adopted
from the Asphalt Institute (Asphalt Institute, 1991) and calibrated based on 82 LTPP
section data in 24 states across the country (NCHRP, 2004). The number of repetitions to
failure for a given load magnitude is computed as follows:
( ) ( )2 2 3 3
1 1
k k
f t tN k k C E
β β
β ε
− −
⎡ ⎤=
⎣ ⎦
(3.21)
in which:
Nf = number of repetitions of a given load to failure
kt = thickness correction factor
β1, β2, β3 = field calibration coefficients
k1, k2, k3 = material properties determined from regression analysis
laboratory test data
C = laboratory to field adjustment factor
εt = tensile strain at the critical location within asphalt concrete layer
52
E = asphalt concrete stiffness at given temperature
The calibration of the model using the LTPP database resulted in the following
values: k1 = 0.00432, k2 = 3.9492, k3 = 1.281. The βi field calibrations coefficients were
assumed to be equal to 1 for this calibration. This set of calibration coefficients is referred
to in the NCHRP 1-37A methodology as the national calibration.
The thickness correction factor is determined as follows:
AC(11.02-3.49*h )
1
0.003602
0.000398
1 e
tk =
+
+
(3.22)
in which:
hAC = total AC thickness
The laboratory-field adjustment factor is given by:
10M
C = (3.23a)
4.84 0.69beff
a beff
V
M
V V
⎛ ⎞
= −⎜ ⎟⎜ ⎟+⎝ ⎠
(3.23b)
in which:
Vbeff = effective binder content (% of volume)
Va = air voids (%)
The damage resulted from a given load is then computed from the number of
repetitions using Miner’s Law:
1
T
i
i fi
n
D
N=
= ∑ (3.24)
in which:
D = damage
53
T = total number of seasonal periods
ni = actual traffic for period i
Nfi = traffic repetitions of a given load to cause failure at period i
The last step is to convert damage into cracked area as follows:
( )( )1 1 2 2
4
' 'log 100
1
601
C C C C D
C
FC
e
+ ⋅
⎛ ⎞ ⎛ ⎞
= ⋅⎜ ⎟ ⎜ ⎟⎜ ⎟ ⎝ ⎠+⎝ ⎠
(3.25a)
( )
2.856
2 ' 2.40874 39.748 1 ACC h
−
= − − + (3.25b)
' '
1 22C C= − (3.25c)
in which:
FC = “alligator” fatigue cracking (% of lane area)
C1, C2, C4 = constants
D = damage
hAC = total AC thickness
The calibration using the LTPP database resulted in the following values for the
regression constants: C1 = 1, C2 = 1 and C4 = 6000. Equation (3.25a) is of a convenient
sigmoidal form that models the two end-conditions of the damage-cracked area
relationship. At 0% damage the percentage of cracked area is equal to zero. At the other
end, at 100% damage, an assumption was adopted that only half of the area would be
cracked. Therefore when damage is 100%, cracked area is equal to 50% or 3000 ft2
over
a 500 ft lane length (the total lane area considered in the NCHRP 1-37A methodology is
12 ft x 500 ft = 6000 ft2
). The statistics for the “alligator” fatigue cracking model after
calibration using 461 observations from the LTPP database standard error (Se) = 6.2%,
and Se/Sy = 0.947.
54
Longitudinal Cracking
Longitudinal cracking develops at the surface and propagates downward (top-
down cracking). Longitudinal crack formation in flexible pavements is conceptually
similar to “alligator” fatigue cracking. Tensile strains at the top of the surface asphalt
concrete layer induced by traffic loading cause the appearance of cracks.
The NCHRP 1-37A model for longitudinal cracking follows the same formulation
as for alligator cracking. The difference is in the damage-crack relationship. Equation
(3.21) is used to calculate the number of applications to failure for a given load. Damage
is computed using Miner’s Law, Equation (3.24). Cracking, in units of foot/mile, is then
given by:
( )( )1 2
4
log 100
10.56
1
C C D
C
FC
e
− ⋅ ⋅
⎛ ⎞
= ⋅⎜ ⎟
+⎝ ⎠
(3.26)
in which:
FC = longitudinal cracking (foot/mile)
C1, C2, C4 = calibration coefficients
D = damage
The calibration using the LTPP database resulted in the following values for the
regression constants: C1 = 7, C2 = 3.5 and C4 = 1000. The sigmoidal form model was
used to model the damage-crack length relationship. The two end-conditions are satisfied.
At 0% damage the model predicts no cracking, and at 100% damage, 500 ft of
longitudinal cracking per 500 ft of pavement (assumed only 50% of the lane with cracks
on both wheel paths: 2 x 250 ft). The statistics for the longitudinal cracking calibration
based on 414 field measurements are Se = 1242.25 feet/mile and Se/Sy = 0.977.
55
Thermal Cracking
Thermal cracking is a consequence of heating/cooling cycles occurring in the
asphalt concrete. The pavement surface cools down faster and with more intensity than
the core of the pavement structure, which causes thermal cracking to occur at the surface
of flexible pavements. Thermal cracks extend in the transverse direction across the full
width of the pavement.
The thermal cracking model used in the NCHRP 1-37A procedure is an enhanced
version of the TCMODEL developed under the SHRP A-005 research contract. This
model has a robust theoretical background and is the most fully mechanistic of the
distress prediction components in the NCHRP 1-37A procedure.
The main improvement from the SHRP A-005 model was the incorporation of an
advanced analysis technique to convert data directly from the Superpave Indirect Tensile
Test into viscoelastic properties, specifically the creep compliance function that is further
converted to the relaxation modulus. The relaxation modulus is coupled with the
temperature data from the EICM to predict thermal stresses. The growth behavior of the
thermal crack is calculated from the thermal stresses.
The crack propagation is computed using Paris’s law:
n
C A KΔ = ⋅Δ (3.27)
in which:
ΔC = change in crack depth for each thermal cycle
ΔK = change in stress intensity factor during thermal cycle
A, n = fracture parameters for the asphalt concrete mixture
The master creep compliance function is expressed as a power law:
Mechanistic Empirical Pavement Design

More Related Content

What's hot

Level of Service(LOS) of a road with Calculation Method
Level of Service(LOS) of a road with Calculation MethodLevel of Service(LOS) of a road with Calculation Method
Level of Service(LOS) of a road with Calculation Method
Md. Abdul Kader
 
Design flexible and rigid pavements
Design flexible and rigid pavementsDesign flexible and rigid pavements
Chapter 2
Chapter 2Chapter 2
Chapter 2
EWIT
 
Unit 4
Unit 4Unit 4
Geometric Design of highway
Geometric Design of highway Geometric Design of highway
Geometric Design of highway
RAMPRASAD KUMAWAT
 
PPT ON SUBGRADE.pptx
PPT ON SUBGRADE.pptxPPT ON SUBGRADE.pptx
PPT ON SUBGRADE.pptx
RajanDas20
 
Horizontal curve- IRC 38
Horizontal curve- IRC 38Horizontal curve- IRC 38
Horizontal curve- IRC 38
Surabhi Suman
 
Design Considerations for AASHTO Flexible pavement design
Design Considerations for AASHTO Flexible pavement designDesign Considerations for AASHTO Flexible pavement design
Design Considerations for AASHTO Flexible pavement design
Imran Nawaz
 
Desert and swampy road construction
Desert and swampy road constructionDesert and swampy road construction
Desert and swampy road construction
Bhavya Jaiswal
 
Modal split analysis
Modal split analysis Modal split analysis
Modal split analysis
ashahit
 
Parking Demand & Supply Analysis of Different Commercial Land Uses Along Mirp...
Parking Demand & Supply Analysis of Different Commercial Land Uses Along Mirp...Parking Demand & Supply Analysis of Different Commercial Land Uses Along Mirp...
Parking Demand & Supply Analysis of Different Commercial Land Uses Along Mirp...
Shahadat Hossain Shakil
 
Traffic engineering
Traffic engineeringTraffic engineering
Traffic engineering
AKANSHA GURELE
 
Capacity and LOS of Multi-Lane HIghways
Capacity and LOS of Multi-Lane HIghwaysCapacity and LOS of Multi-Lane HIghways
Capacity and LOS of Multi-Lane HIghways
Raghupathi Kandiboina
 
Traffic Engineering
Traffic Engineering Traffic Engineering
Traffic Engineering
PadduS
 
traffic characteristics
traffic characteristicstraffic characteristics
traffic characteristics
kamariya keyur
 
Dowel bars, tie bars and their design
Dowel bars, tie bars and their designDowel bars, tie bars and their design
Dowel bars, tie bars and their design
Bhavya Jaiswal
 
Irc method of design of flexible pavement 1
Irc method of design of flexible pavement 1Irc method of design of flexible pavement 1
Irc method of design of flexible pavement 1
GARRE RAVI KUMAR
 
Basic runway length
Basic runway lengthBasic runway length
Basic runway length
Gaurang Kakadiya
 
Benkelman beam deflection studies
Benkelman beam deflection studiesBenkelman beam deflection studies
Benkelman beam deflection studies
vikasravekar
 
Highway notes (planning, alignment, & geometric design )
Highway notes (planning, alignment, & geometric design )Highway notes (planning, alignment, & geometric design )
Highway notes (planning, alignment, & geometric design )
mohit kumar panchal
 

What's hot (20)

Level of Service(LOS) of a road with Calculation Method
Level of Service(LOS) of a road with Calculation MethodLevel of Service(LOS) of a road with Calculation Method
Level of Service(LOS) of a road with Calculation Method
 
Design flexible and rigid pavements
Design flexible and rigid pavementsDesign flexible and rigid pavements
Design flexible and rigid pavements
 
Chapter 2
Chapter 2Chapter 2
Chapter 2
 
Unit 4
Unit 4Unit 4
Unit 4
 
Geometric Design of highway
Geometric Design of highway Geometric Design of highway
Geometric Design of highway
 
PPT ON SUBGRADE.pptx
PPT ON SUBGRADE.pptxPPT ON SUBGRADE.pptx
PPT ON SUBGRADE.pptx
 
Horizontal curve- IRC 38
Horizontal curve- IRC 38Horizontal curve- IRC 38
Horizontal curve- IRC 38
 
Design Considerations for AASHTO Flexible pavement design
Design Considerations for AASHTO Flexible pavement designDesign Considerations for AASHTO Flexible pavement design
Design Considerations for AASHTO Flexible pavement design
 
Desert and swampy road construction
Desert and swampy road constructionDesert and swampy road construction
Desert and swampy road construction
 
Modal split analysis
Modal split analysis Modal split analysis
Modal split analysis
 
Parking Demand & Supply Analysis of Different Commercial Land Uses Along Mirp...
Parking Demand & Supply Analysis of Different Commercial Land Uses Along Mirp...Parking Demand & Supply Analysis of Different Commercial Land Uses Along Mirp...
Parking Demand & Supply Analysis of Different Commercial Land Uses Along Mirp...
 
Traffic engineering
Traffic engineeringTraffic engineering
Traffic engineering
 
Capacity and LOS of Multi-Lane HIghways
Capacity and LOS of Multi-Lane HIghwaysCapacity and LOS of Multi-Lane HIghways
Capacity and LOS of Multi-Lane HIghways
 
Traffic Engineering
Traffic Engineering Traffic Engineering
Traffic Engineering
 
traffic characteristics
traffic characteristicstraffic characteristics
traffic characteristics
 
Dowel bars, tie bars and their design
Dowel bars, tie bars and their designDowel bars, tie bars and their design
Dowel bars, tie bars and their design
 
Irc method of design of flexible pavement 1
Irc method of design of flexible pavement 1Irc method of design of flexible pavement 1
Irc method of design of flexible pavement 1
 
Basic runway length
Basic runway lengthBasic runway length
Basic runway length
 
Benkelman beam deflection studies
Benkelman beam deflection studiesBenkelman beam deflection studies
Benkelman beam deflection studies
 
Highway notes (planning, alignment, & geometric design )
Highway notes (planning, alignment, & geometric design )Highway notes (planning, alignment, & geometric design )
Highway notes (planning, alignment, & geometric design )
 

Viewers also liked

DESIGN PROJECT FOR PAVEMENT
DESIGN PROJECT FOR PAVEMENTDESIGN PROJECT FOR PAVEMENT
DESIGN PROJECT FOR PAVEMENT
Sukhdarshan Singh
 
Pavement ppt
Pavement pptPavement ppt
Pavement ppt
Harsha Singh
 
Pavement design
Pavement designPavement design
Pavement design
Garvit Goyal
 
V4I8-IJERTV4IS080396
V4I8-IJERTV4IS080396V4I8-IJERTV4IS080396
V4I8-IJERTV4IS080396Saurav Barua
 
Materials investigation and pavement design for upgrading Gachororo road to b...
Materials investigation and pavement design for upgrading Gachororo road to b...Materials investigation and pavement design for upgrading Gachororo road to b...
Materials investigation and pavement design for upgrading Gachororo road to b...
byebi basema fabrice
 
28 pavement design
28 pavement design28 pavement design
28 pavement design
AHMED NADIM JILANI
 
" Design of Flexible Pavement "
" Design of Flexible Pavement "" Design of Flexible Pavement "
" Design of Flexible Pavement "
Nishant Pandey
 
ppt on pavement design
ppt on pavement designppt on pavement design
ppt on pavement design
Rohit Ranjan
 
Pavement design
Pavement designPavement design
Pavement design
husna004
 
Flexible and-rigid-pavements
Flexible and-rigid-pavementsFlexible and-rigid-pavements
Flexible and-rigid-pavementsHARITSEHRAWAT
 
Final year project ppt - The Future of Pavement Design
Final year project ppt - The Future of Pavement DesignFinal year project ppt - The Future of Pavement Design
Final year project ppt - The Future of Pavement Design
Riaz Zalil
 
Design Of Flexible Pavements
Design Of Flexible PavementsDesign Of Flexible Pavements
Design Of Flexible Pavements
whutton1
 
Pavements PPT
 Pavements PPT  Pavements PPT
Pavements PPT
Amol Pawar
 
PROJECT REPORT ON ROAD CONSTRUCTION
PROJECT REPORT ON ROAD CONSTRUCTIONPROJECT REPORT ON ROAD CONSTRUCTION
PROJECT REPORT ON ROAD CONSTRUCTION
GLA University
 

Viewers also liked (15)

DESIGN PROJECT FOR PAVEMENT
DESIGN PROJECT FOR PAVEMENTDESIGN PROJECT FOR PAVEMENT
DESIGN PROJECT FOR PAVEMENT
 
Pavement ppt
Pavement pptPavement ppt
Pavement ppt
 
Pavement design
Pavement designPavement design
Pavement design
 
Ch 9
Ch 9Ch 9
Ch 9
 
V4I8-IJERTV4IS080396
V4I8-IJERTV4IS080396V4I8-IJERTV4IS080396
V4I8-IJERTV4IS080396
 
Materials investigation and pavement design for upgrading Gachororo road to b...
Materials investigation and pavement design for upgrading Gachororo road to b...Materials investigation and pavement design for upgrading Gachororo road to b...
Materials investigation and pavement design for upgrading Gachororo road to b...
 
28 pavement design
28 pavement design28 pavement design
28 pavement design
 
" Design of Flexible Pavement "
" Design of Flexible Pavement "" Design of Flexible Pavement "
" Design of Flexible Pavement "
 
ppt on pavement design
ppt on pavement designppt on pavement design
ppt on pavement design
 
Pavement design
Pavement designPavement design
Pavement design
 
Flexible and-rigid-pavements
Flexible and-rigid-pavementsFlexible and-rigid-pavements
Flexible and-rigid-pavements
 
Final year project ppt - The Future of Pavement Design
Final year project ppt - The Future of Pavement DesignFinal year project ppt - The Future of Pavement Design
Final year project ppt - The Future of Pavement Design
 
Design Of Flexible Pavements
Design Of Flexible PavementsDesign Of Flexible Pavements
Design Of Flexible Pavements
 
Pavements PPT
 Pavements PPT  Pavements PPT
Pavements PPT
 
PROJECT REPORT ON ROAD CONSTRUCTION
PROJECT REPORT ON ROAD CONSTRUCTIONPROJECT REPORT ON ROAD CONSTRUCTION
PROJECT REPORT ON ROAD CONSTRUCTION
 

Similar to Mechanistic Empirical Pavement Design

Leakage detection in water pipe networks using Ground Penetrating Radar (GPR)...
Leakage detection in water pipe networks using Ground Penetrating Radar (GPR)...Leakage detection in water pipe networks using Ground Penetrating Radar (GPR)...
Leakage detection in water pipe networks using Ground Penetrating Radar (GPR)...Dai Shi
 
Pankaj_thesis.pdf
Pankaj_thesis.pdfPankaj_thesis.pdf
Pankaj_thesis.pdf
krishnaprakashyadav
 
DESIGN MONOPILE FOUNDATION OF OFFSHORE WIND TURBINES
DESIGN MONOPILE FOUNDATION OF OFFSHORE WIND TURBINES DESIGN MONOPILE FOUNDATION OF OFFSHORE WIND TURBINES
DESIGN MONOPILE FOUNDATION OF OFFSHORE WIND TURBINES
nataliej4
 
PhD Thesis - Seyed Reza (Shauheen) Etminan
PhD Thesis - Seyed Reza (Shauheen) EtminanPhD Thesis - Seyed Reza (Shauheen) Etminan
PhD Thesis - Seyed Reza (Shauheen) EtminanShauheen Etminan, PhD
 
CREATING NEW FORM OF ARCHITECTURE USING ENTITIES THAT GOES WASTED
 CREATING NEW FORM OF ARCHITECTURE USING ENTITIES THAT GOES WASTED CREATING NEW FORM OF ARCHITECTURE USING ENTITIES THAT GOES WASTED
CREATING NEW FORM OF ARCHITECTURE USING ENTITIES THAT GOES WASTED
Irfan Ullah
 
creyn_1.pdf
creyn_1.pdfcreyn_1.pdf
creyn_1.pdf
AbhishekPatro13
 
Ph d model-driven physical-design for future nanoscale architectures
Ph d model-driven physical-design for future nanoscale architecturesPh d model-driven physical-design for future nanoscale architectures
Ph d model-driven physical-design for future nanoscale architecturesCiprian Teodorov
 
Gigliotti-L-2016-PhD-Thesis (2)
Gigliotti-L-2016-PhD-Thesis (2)Gigliotti-L-2016-PhD-Thesis (2)
Gigliotti-L-2016-PhD-Thesis (2)Luigi Gigliotti
 
Complete Thesis-Final
Complete Thesis-FinalComplete Thesis-Final
Complete Thesis-FinalHao SHEN
 
Zuo et al., 2016, JGE_Fractal modelling.pdf
Zuo et al., 2016, JGE_Fractal modelling.pdfZuo et al., 2016, JGE_Fractal modelling.pdf
Zuo et al., 2016, JGE_Fractal modelling.pdf
VictorValdivia20
 
Metodología para-el-diseño-semi-automático-y-optimizado-de-rampas-en-múltiple...
Metodología para-el-diseño-semi-automático-y-optimizado-de-rampas-en-múltiple...Metodología para-el-diseño-semi-automático-y-optimizado-de-rampas-en-múltiple...
Metodología para-el-diseño-semi-automático-y-optimizado-de-rampas-en-múltiple...
FLORTATIANAVARGASCUE
 

Similar to Mechanistic Empirical Pavement Design (20)

MIT PhD Thesis Molecular Self-Assembly of Thin Films of Organic LEDs
MIT PhD Thesis Molecular Self-Assembly of Thin Films of Organic LEDsMIT PhD Thesis Molecular Self-Assembly of Thin Films of Organic LEDs
MIT PhD Thesis Molecular Self-Assembly of Thin Films of Organic LEDs
 
Leakage detection in water pipe networks using Ground Penetrating Radar (GPR)...
Leakage detection in water pipe networks using Ground Penetrating Radar (GPR)...Leakage detection in water pipe networks using Ground Penetrating Radar (GPR)...
Leakage detection in water pipe networks using Ground Penetrating Radar (GPR)...
 
blanco
blancoblanco
blanco
 
Pankaj_thesis.pdf
Pankaj_thesis.pdfPankaj_thesis.pdf
Pankaj_thesis.pdf
 
DESIGN MONOPILE FOUNDATION OF OFFSHORE WIND TURBINES
DESIGN MONOPILE FOUNDATION OF OFFSHORE WIND TURBINES DESIGN MONOPILE FOUNDATION OF OFFSHORE WIND TURBINES
DESIGN MONOPILE FOUNDATION OF OFFSHORE WIND TURBINES
 
PhD dissertation
PhD dissertationPhD dissertation
PhD dissertation
 
PhD Thesis - Seyed Reza (Shauheen) Etminan
PhD Thesis - Seyed Reza (Shauheen) EtminanPhD Thesis - Seyed Reza (Shauheen) Etminan
PhD Thesis - Seyed Reza (Shauheen) Etminan
 
CREATING NEW FORM OF ARCHITECTURE USING ENTITIES THAT GOES WASTED
 CREATING NEW FORM OF ARCHITECTURE USING ENTITIES THAT GOES WASTED CREATING NEW FORM OF ARCHITECTURE USING ENTITIES THAT GOES WASTED
CREATING NEW FORM OF ARCHITECTURE USING ENTITIES THAT GOES WASTED
 
creyn_1.pdf
creyn_1.pdfcreyn_1.pdf
creyn_1.pdf
 
thesis_sillero
thesis_sillerothesis_sillero
thesis_sillero
 
thesis
thesisthesis
thesis
 
thesis
thesisthesis
thesis
 
Ph d model-driven physical-design for future nanoscale architectures
Ph d model-driven physical-design for future nanoscale architecturesPh d model-driven physical-design for future nanoscale architectures
Ph d model-driven physical-design for future nanoscale architectures
 
Gigliotti-L-2016-PhD-Thesis (2)
Gigliotti-L-2016-PhD-Thesis (2)Gigliotti-L-2016-PhD-Thesis (2)
Gigliotti-L-2016-PhD-Thesis (2)
 
Complete Thesis-Final
Complete Thesis-FinalComplete Thesis-Final
Complete Thesis-Final
 
GoffInvLinBet
GoffInvLinBetGoffInvLinBet
GoffInvLinBet
 
Master Thesis
Master ThesisMaster Thesis
Master Thesis
 
MuellerThesis
MuellerThesisMuellerThesis
MuellerThesis
 
Zuo et al., 2016, JGE_Fractal modelling.pdf
Zuo et al., 2016, JGE_Fractal modelling.pdfZuo et al., 2016, JGE_Fractal modelling.pdf
Zuo et al., 2016, JGE_Fractal modelling.pdf
 
Metodología para-el-diseño-semi-automático-y-optimizado-de-rampas-en-múltiple...
Metodología para-el-diseño-semi-automático-y-optimizado-de-rampas-en-múltiple...Metodología para-el-diseño-semi-automático-y-optimizado-de-rampas-en-múltiple...
Metodología para-el-diseño-semi-automático-y-optimizado-de-rampas-en-múltiple...
 

More from WSKT

Hec ras-dasar-simple-geometry-river-sep11
Hec ras-dasar-simple-geometry-river-sep11Hec ras-dasar-simple-geometry-river-sep11
Hec ras-dasar-simple-geometry-river-sep11
WSKT
 
Hec ras dasar simple geometry river jul14
Hec ras dasar simple geometry river jul14Hec ras dasar simple geometry river jul14
Hec ras dasar simple geometry river jul14
WSKT
 
Hec ras dasar simple geometry river okt12
Hec ras dasar simple geometry river okt12Hec ras dasar simple geometry river okt12
Hec ras dasar simple geometry river okt12
WSKT
 
Sni 1727 2013 tata cara pembebanan untuk rumah dan gedung
Sni 1727 2013 tata cara pembebanan untuk rumah dan gedungSni 1727 2013 tata cara pembebanan untuk rumah dan gedung
Sni 1727 2013 tata cara pembebanan untuk rumah dan gedung
WSKT
 
Sni 2847 2013 persyaratan beton stuktural untuk bangunan gedung
Sni 2847 2013 persyaratan beton stuktural untuk bangunan gedungSni 2847 2013 persyaratan beton stuktural untuk bangunan gedung
Sni 2847 2013 persyaratan beton stuktural untuk bangunan gedung
WSKT
 
Sni+1726+2012 gempa
Sni+1726+2012 gempaSni+1726+2012 gempa
Sni+1726+2012 gempa
WSKT
 
modul pelatihan geosintetik
modul pelatihan geosintetikmodul pelatihan geosintetik
modul pelatihan geosintetik
WSKT
 
Tutor civil 3d
Tutor civil 3dTutor civil 3d
Tutor civil 3d
WSKT
 
197521758 146043958-pengoperasian-plaxis-8-2
197521758 146043958-pengoperasian-plaxis-8-2197521758 146043958-pengoperasian-plaxis-8-2
197521758 146043958-pengoperasian-plaxis-8-2
WSKT
 
238431355 plaxis-tutorial-manual
238431355 plaxis-tutorial-manual238431355 plaxis-tutorial-manual
238431355 plaxis-tutorial-manual
WSKT
 
271083916 tekla-15-analysis-manual
271083916 tekla-15-analysis-manual271083916 tekla-15-analysis-manual
271083916 tekla-15-analysis-manual
WSKT
 
Rock slope design_guide
Rock slope design_guideRock slope design_guide
Rock slope design_guide
WSKT
 
struktur cangkang (sell structure) kel. 4
struktur cangkang (sell structure) kel. 4struktur cangkang (sell structure) kel. 4
struktur cangkang (sell structure) kel. 4
WSKT
 
Manual Pesain Perkerasan
Manual Pesain PerkerasanManual Pesain Perkerasan
Manual Pesain Perkerasan
WSKT
 
sni 1729-2015
sni 1729-2015sni 1729-2015
sni 1729-2015
WSKT
 
Baja tulangan beton SNI 2052-2014
Baja tulangan beton SNI 2052-2014Baja tulangan beton SNI 2052-2014
Baja tulangan beton SNI 2052-2014
WSKT
 
No - Fines Concrete
No - Fines ConcreteNo - Fines Concrete
No - Fines Concrete
WSKT
 
La tahzan (jangan bersedih) aidh al-qarni
La tahzan (jangan bersedih)   aidh al-qarniLa tahzan (jangan bersedih)   aidh al-qarni
La tahzan (jangan bersedih) aidh al-qarni
WSKT
 
Alinemen vertikal-teks1
Alinemen vertikal-teks1Alinemen vertikal-teks1
Alinemen vertikal-teks1
WSKT
 
243176098 3-superelevasi
243176098 3-superelevasi243176098 3-superelevasi
243176098 3-superelevasi
WSKT
 

More from WSKT (20)

Hec ras-dasar-simple-geometry-river-sep11
Hec ras-dasar-simple-geometry-river-sep11Hec ras-dasar-simple-geometry-river-sep11
Hec ras-dasar-simple-geometry-river-sep11
 
Hec ras dasar simple geometry river jul14
Hec ras dasar simple geometry river jul14Hec ras dasar simple geometry river jul14
Hec ras dasar simple geometry river jul14
 
Hec ras dasar simple geometry river okt12
Hec ras dasar simple geometry river okt12Hec ras dasar simple geometry river okt12
Hec ras dasar simple geometry river okt12
 
Sni 1727 2013 tata cara pembebanan untuk rumah dan gedung
Sni 1727 2013 tata cara pembebanan untuk rumah dan gedungSni 1727 2013 tata cara pembebanan untuk rumah dan gedung
Sni 1727 2013 tata cara pembebanan untuk rumah dan gedung
 
Sni 2847 2013 persyaratan beton stuktural untuk bangunan gedung
Sni 2847 2013 persyaratan beton stuktural untuk bangunan gedungSni 2847 2013 persyaratan beton stuktural untuk bangunan gedung
Sni 2847 2013 persyaratan beton stuktural untuk bangunan gedung
 
Sni+1726+2012 gempa
Sni+1726+2012 gempaSni+1726+2012 gempa
Sni+1726+2012 gempa
 
modul pelatihan geosintetik
modul pelatihan geosintetikmodul pelatihan geosintetik
modul pelatihan geosintetik
 
Tutor civil 3d
Tutor civil 3dTutor civil 3d
Tutor civil 3d
 
197521758 146043958-pengoperasian-plaxis-8-2
197521758 146043958-pengoperasian-plaxis-8-2197521758 146043958-pengoperasian-plaxis-8-2
197521758 146043958-pengoperasian-plaxis-8-2
 
238431355 plaxis-tutorial-manual
238431355 plaxis-tutorial-manual238431355 plaxis-tutorial-manual
238431355 plaxis-tutorial-manual
 
271083916 tekla-15-analysis-manual
271083916 tekla-15-analysis-manual271083916 tekla-15-analysis-manual
271083916 tekla-15-analysis-manual
 
Rock slope design_guide
Rock slope design_guideRock slope design_guide
Rock slope design_guide
 
struktur cangkang (sell structure) kel. 4
struktur cangkang (sell structure) kel. 4struktur cangkang (sell structure) kel. 4
struktur cangkang (sell structure) kel. 4
 
Manual Pesain Perkerasan
Manual Pesain PerkerasanManual Pesain Perkerasan
Manual Pesain Perkerasan
 
sni 1729-2015
sni 1729-2015sni 1729-2015
sni 1729-2015
 
Baja tulangan beton SNI 2052-2014
Baja tulangan beton SNI 2052-2014Baja tulangan beton SNI 2052-2014
Baja tulangan beton SNI 2052-2014
 
No - Fines Concrete
No - Fines ConcreteNo - Fines Concrete
No - Fines Concrete
 
La tahzan (jangan bersedih) aidh al-qarni
La tahzan (jangan bersedih)   aidh al-qarniLa tahzan (jangan bersedih)   aidh al-qarni
La tahzan (jangan bersedih) aidh al-qarni
 
Alinemen vertikal-teks1
Alinemen vertikal-teks1Alinemen vertikal-teks1
Alinemen vertikal-teks1
 
243176098 3-superelevasi
243176098 3-superelevasi243176098 3-superelevasi
243176098 3-superelevasi
 

Recently uploaded

weather web application report.pdf
weather web application report.pdfweather web application report.pdf
weather web application report.pdf
Pratik Pawar
 
AKS UNIVERSITY Satna Final Year Project By OM Hardaha.pdf
AKS UNIVERSITY Satna Final Year Project By OM Hardaha.pdfAKS UNIVERSITY Satna Final Year Project By OM Hardaha.pdf
AKS UNIVERSITY Satna Final Year Project By OM Hardaha.pdf
SamSarthak3
 
English lab ppt no titlespecENG PPTt.pdf
English lab ppt no titlespecENG PPTt.pdfEnglish lab ppt no titlespecENG PPTt.pdf
English lab ppt no titlespecENG PPTt.pdf
BrazilAccount1
 
一比一原版(IIT毕业证)伊利诺伊理工大学毕业证成绩单专业办理
一比一原版(IIT毕业证)伊利诺伊理工大学毕业证成绩单专业办理一比一原版(IIT毕业证)伊利诺伊理工大学毕业证成绩单专业办理
一比一原版(IIT毕业证)伊利诺伊理工大学毕业证成绩单专业办理
zwunae
 
Cosmetic shop management system project report.pdf
Cosmetic shop management system project report.pdfCosmetic shop management system project report.pdf
Cosmetic shop management system project report.pdf
Kamal Acharya
 
AP LAB PPT.pdf ap lab ppt no title specific
AP LAB PPT.pdf ap lab ppt no title specificAP LAB PPT.pdf ap lab ppt no title specific
AP LAB PPT.pdf ap lab ppt no title specific
BrazilAccount1
 
H.Seo, ICLR 2024, MLILAB, KAIST AI.pdf
H.Seo,  ICLR 2024, MLILAB,  KAIST AI.pdfH.Seo,  ICLR 2024, MLILAB,  KAIST AI.pdf
H.Seo, ICLR 2024, MLILAB, KAIST AI.pdf
MLILAB
 
WATER CRISIS and its solutions-pptx 1234
WATER CRISIS and its solutions-pptx 1234WATER CRISIS and its solutions-pptx 1234
WATER CRISIS and its solutions-pptx 1234
AafreenAbuthahir2
 
Fundamentals of Electric Drives and its applications.pptx
Fundamentals of Electric Drives and its applications.pptxFundamentals of Electric Drives and its applications.pptx
Fundamentals of Electric Drives and its applications.pptx
manasideore6
 
Nuclear Power Economics and Structuring 2024
Nuclear Power Economics and Structuring 2024Nuclear Power Economics and Structuring 2024
Nuclear Power Economics and Structuring 2024
Massimo Talia
 
MCQ Soil mechanics questions (Soil shear strength).pdf
MCQ Soil mechanics questions (Soil shear strength).pdfMCQ Soil mechanics questions (Soil shear strength).pdf
MCQ Soil mechanics questions (Soil shear strength).pdf
Osamah Alsalih
 
Gen AI Study Jams _ For the GDSC Leads in India.pdf
Gen AI Study Jams _ For the GDSC Leads in India.pdfGen AI Study Jams _ For the GDSC Leads in India.pdf
Gen AI Study Jams _ For the GDSC Leads in India.pdf
gdsczhcet
 
CFD Simulation of By-pass Flow in a HRSG module by R&R Consult.pptx
CFD Simulation of By-pass Flow in a HRSG module by R&R Consult.pptxCFD Simulation of By-pass Flow in a HRSG module by R&R Consult.pptx
CFD Simulation of By-pass Flow in a HRSG module by R&R Consult.pptx
R&R Consult
 
Hybrid optimization of pumped hydro system and solar- Engr. Abdul-Azeez.pdf
Hybrid optimization of pumped hydro system and solar- Engr. Abdul-Azeez.pdfHybrid optimization of pumped hydro system and solar- Engr. Abdul-Azeez.pdf
Hybrid optimization of pumped hydro system and solar- Engr. Abdul-Azeez.pdf
fxintegritypublishin
 
Water Industry Process Automation and Control Monthly - May 2024.pdf
Water Industry Process Automation and Control Monthly - May 2024.pdfWater Industry Process Automation and Control Monthly - May 2024.pdf
Water Industry Process Automation and Control Monthly - May 2024.pdf
Water Industry Process Automation & Control
 
Standard Reomte Control Interface - Neometrix
Standard Reomte Control Interface - NeometrixStandard Reomte Control Interface - Neometrix
Standard Reomte Control Interface - Neometrix
Neometrix_Engineering_Pvt_Ltd
 
Sachpazis:Terzaghi Bearing Capacity Estimation in simple terms with Calculati...
Sachpazis:Terzaghi Bearing Capacity Estimation in simple terms with Calculati...Sachpazis:Terzaghi Bearing Capacity Estimation in simple terms with Calculati...
Sachpazis:Terzaghi Bearing Capacity Estimation in simple terms with Calculati...
Dr.Costas Sachpazis
 
Student information management system project report ii.pdf
Student information management system project report ii.pdfStudent information management system project report ii.pdf
Student information management system project report ii.pdf
Kamal Acharya
 
road safety engineering r s e unit 3.pdf
road safety engineering  r s e unit 3.pdfroad safety engineering  r s e unit 3.pdf
road safety engineering r s e unit 3.pdf
VENKATESHvenky89705
 
NO1 Uk best vashikaran specialist in delhi vashikaran baba near me online vas...
NO1 Uk best vashikaran specialist in delhi vashikaran baba near me online vas...NO1 Uk best vashikaran specialist in delhi vashikaran baba near me online vas...
NO1 Uk best vashikaran specialist in delhi vashikaran baba near me online vas...
Amil Baba Dawood bangali
 

Recently uploaded (20)

weather web application report.pdf
weather web application report.pdfweather web application report.pdf
weather web application report.pdf
 
AKS UNIVERSITY Satna Final Year Project By OM Hardaha.pdf
AKS UNIVERSITY Satna Final Year Project By OM Hardaha.pdfAKS UNIVERSITY Satna Final Year Project By OM Hardaha.pdf
AKS UNIVERSITY Satna Final Year Project By OM Hardaha.pdf
 
English lab ppt no titlespecENG PPTt.pdf
English lab ppt no titlespecENG PPTt.pdfEnglish lab ppt no titlespecENG PPTt.pdf
English lab ppt no titlespecENG PPTt.pdf
 
一比一原版(IIT毕业证)伊利诺伊理工大学毕业证成绩单专业办理
一比一原版(IIT毕业证)伊利诺伊理工大学毕业证成绩单专业办理一比一原版(IIT毕业证)伊利诺伊理工大学毕业证成绩单专业办理
一比一原版(IIT毕业证)伊利诺伊理工大学毕业证成绩单专业办理
 
Cosmetic shop management system project report.pdf
Cosmetic shop management system project report.pdfCosmetic shop management system project report.pdf
Cosmetic shop management system project report.pdf
 
AP LAB PPT.pdf ap lab ppt no title specific
AP LAB PPT.pdf ap lab ppt no title specificAP LAB PPT.pdf ap lab ppt no title specific
AP LAB PPT.pdf ap lab ppt no title specific
 
H.Seo, ICLR 2024, MLILAB, KAIST AI.pdf
H.Seo,  ICLR 2024, MLILAB,  KAIST AI.pdfH.Seo,  ICLR 2024, MLILAB,  KAIST AI.pdf
H.Seo, ICLR 2024, MLILAB, KAIST AI.pdf
 
WATER CRISIS and its solutions-pptx 1234
WATER CRISIS and its solutions-pptx 1234WATER CRISIS and its solutions-pptx 1234
WATER CRISIS and its solutions-pptx 1234
 
Fundamentals of Electric Drives and its applications.pptx
Fundamentals of Electric Drives and its applications.pptxFundamentals of Electric Drives and its applications.pptx
Fundamentals of Electric Drives and its applications.pptx
 
Nuclear Power Economics and Structuring 2024
Nuclear Power Economics and Structuring 2024Nuclear Power Economics and Structuring 2024
Nuclear Power Economics and Structuring 2024
 
MCQ Soil mechanics questions (Soil shear strength).pdf
MCQ Soil mechanics questions (Soil shear strength).pdfMCQ Soil mechanics questions (Soil shear strength).pdf
MCQ Soil mechanics questions (Soil shear strength).pdf
 
Gen AI Study Jams _ For the GDSC Leads in India.pdf
Gen AI Study Jams _ For the GDSC Leads in India.pdfGen AI Study Jams _ For the GDSC Leads in India.pdf
Gen AI Study Jams _ For the GDSC Leads in India.pdf
 
CFD Simulation of By-pass Flow in a HRSG module by R&R Consult.pptx
CFD Simulation of By-pass Flow in a HRSG module by R&R Consult.pptxCFD Simulation of By-pass Flow in a HRSG module by R&R Consult.pptx
CFD Simulation of By-pass Flow in a HRSG module by R&R Consult.pptx
 
Hybrid optimization of pumped hydro system and solar- Engr. Abdul-Azeez.pdf
Hybrid optimization of pumped hydro system and solar- Engr. Abdul-Azeez.pdfHybrid optimization of pumped hydro system and solar- Engr. Abdul-Azeez.pdf
Hybrid optimization of pumped hydro system and solar- Engr. Abdul-Azeez.pdf
 
Water Industry Process Automation and Control Monthly - May 2024.pdf
Water Industry Process Automation and Control Monthly - May 2024.pdfWater Industry Process Automation and Control Monthly - May 2024.pdf
Water Industry Process Automation and Control Monthly - May 2024.pdf
 
Standard Reomte Control Interface - Neometrix
Standard Reomte Control Interface - NeometrixStandard Reomte Control Interface - Neometrix
Standard Reomte Control Interface - Neometrix
 
Sachpazis:Terzaghi Bearing Capacity Estimation in simple terms with Calculati...
Sachpazis:Terzaghi Bearing Capacity Estimation in simple terms with Calculati...Sachpazis:Terzaghi Bearing Capacity Estimation in simple terms with Calculati...
Sachpazis:Terzaghi Bearing Capacity Estimation in simple terms with Calculati...
 
Student information management system project report ii.pdf
Student information management system project report ii.pdfStudent information management system project report ii.pdf
Student information management system project report ii.pdf
 
road safety engineering r s e unit 3.pdf
road safety engineering  r s e unit 3.pdfroad safety engineering  r s e unit 3.pdf
road safety engineering r s e unit 3.pdf
 
NO1 Uk best vashikaran specialist in delhi vashikaran baba near me online vas...
NO1 Uk best vashikaran specialist in delhi vashikaran baba near me online vas...NO1 Uk best vashikaran specialist in delhi vashikaran baba near me online vas...
NO1 Uk best vashikaran specialist in delhi vashikaran baba near me online vas...
 

Mechanistic Empirical Pavement Design

  • 1. ABSTRACT Title of Document: MECHANISTIC-EMPIRICAL DESIGN OF FLEXIBLE PAVEMENTS: A SENSITIVITY STUDY Regis L. Carvalho, Master of Science, 2006 Thesis directed by: Dr. Charles W. Schwartz Department of Civil and Environmental Engineering Pavement structural design is a daunting task. Traffic loading is a heterogeneous mix of vehicles, axle types and loads with distributions that vary daily and over the pavement design life. Pavement materials respond to these loads in complex ways influenced by stress state and magnitude, temperature, moisture, loading rate, and other factors. Environment exposure adds further complications. It should be no wonder the profession has resorted to largely empirical methods. Developments over recent decades offered an opportunity for more rational and rigorous pavement design procedures. The latest of these accomplishments is the development of the mechanistic-empirical pavement design procedure in NCHRP Project 1-37A. This study presents a comparison of flexible pavement designs between the 1993 AASHTO guide and the NCHRP 1-37A methodology and a sensitivity analysis of the NCHRP 1-37A’s input parameters. Recommendations for future studies involving the application and implementation of the new mechanistic-empirical pavement design guide concludes the study.
  • 2. MECHANISTIC-EMPIRICAL DESIGN OF FLEXIBLE PAVEMENTS: A SENSITIVITY STUDY By Régis Luis Egual de Carvalho Thesis submitted to the Faculty of the Graduate School of the University of Maryland, College Park, in partial fulfillment of the requirements for the degree of Master of Science 2006 Advisory Committee: Dr. Charles W. Schwartz, Chair Professor Deborah J. Goodings Dr. Dimitrios G. Goulias
  • 3. ©Copyright by Regis L. Carvalho 2006
  • 4. ii DEDICATION To Ana, my unconditional and inspirational love.
  • 5. iii ACKNOWLEDGEMENTS I would like to acknowledge Dr. Charles Schwartz for his valuable guidance and continuous encouragement throughout this first phase of my graduate studies and for keeping me motivated for the challenges ahead. I would also like to express my gratitude to Professor Deborah Goodings and Dr. Dimitrios Goulias for serving as committee members and for their support and help. I wish to extend my gratitude to Dr. Ahmet Aydilek and Professor Sherif Aggour for their valuable advices. I would like to express my sincere appreciation to my friend Mr. Nelson Gibson for his support, especially during the earlier stages of my graduate studies; our friendship extends beyond school boundaries. I am also grateful to Mr. Mehmet Melih Demirkan, Dr. Emin Kutay, and Mr. Haejin Kim for their friendship, for sharing valuable geotechnical discussions and laughs at the geotech/pavements graduate student offices. Finally, I would like to express my endless gratitude to my family, my brother Arthur, my sisters Nathalia and Lele, and my mother Vitória Regia for their love and support, and especially to my father eng. Luiz Antônio Carvalho, who always encouraged me to pursue my dreams.
  • 6. iv TABLE OF CONTENTS List of Tables………………………………………………....…………………………………...v List of Figures…………………………………………………..………..……………………….vi Chapter 1 : Introduction...................................................................................................................1 Chapter 2 : Review of Flexible Pavement Design Principles ..........................................................4 Chapter 3 : Pavement Design Procedures......................................................................................11 3.1. 1993 AASHTO Guide ........................................................................................................12 3.1.1. The AASHO Road Test and Previous Versions of the Guide__________________ 12 3.1.2. Current Design Equation______________________________________________ 19 3.1.3. Input Variables _____________________________________________________ 21 3.1.4. Reliability _________________________________________________________ 26 3.1.5. Considerations and Comments Found in the Literature ______________________ 28 3.2. NCHRP 1-37A Design Procedure ......................................................................................31 3.2.1. Design process______________________________________________________ 32 3.2.2. Inputs_____________________________________________________________ 35 3.2.3. Pavement Response Models ___________________________________________ 43 3.2.4. Empirical Performance Models_________________________________________ 50 3.2.5. Reliability _________________________________________________________ 64 3.2.6. Remarks___________________________________________________________ 66 Chapter 4 : Comparative Study between the 1993 AASHTO Guide and the NCHRP 1-37A Procedure .......................................................................................................................................67 4.1. Conceptual Differences between 1993 AASHTO Guide and NCHRP 1-37A...................68 4.2. Description of Pavement Sections......................................................................................73 4.3. General Inputs ....................................................................................................................74 4.4. 1993 AASHTO Designs.....................................................................................................78 4.5. NCHRP 1-37A Analysis.....................................................................................................80 4.5.1. Traffic ____________________________________________________________ 80 4.5.2. Environment _______________________________________________________ 80 4.5.3. Material Properties __________________________________________________ 81 4.5.4. Performance Models and Criteria _______________________________________ 86 4.6. Results ................................................................................................................................87 Chapter 5 : NCHRP 1-37A Performance Prediction Sensitivity to Parameters.............................97 5.1. Thickness............................................................................................................................97 5.2. Traffic...............................................................................................................................104 5.3. Environment .....................................................................................................................108 5.4. Material Properties ...........................................................................................................111 5.4.1. Asphalt Concrete___________________________________________________ 112 5.4.2. Unbound Materials _________________________________________________ 121 5.5. Empirical Performance Model Calibration.......................................................................125 5.6. Service Life ......................................................................................................................133 Chapter 6 : Case Study: Maryland Designs .................................................................................142 Chapter 7 : Conclusions...............................................................................................................154 7.1. Summary...........................................................................................................................154 7.2. Principal Findings.............................................................................................................154 7.3. Implementation Issues......................................................................................................160 Chapter 8 : References.................................................................................................................162
  • 7. v LIST OF TABLES Table 3.1. Recommended values for Regional Factor R (AASHTO, 1972)..................................16 Table 3.2. Ranges of structural layer coefficients (AASHTO, 1972)............................................17 Table 3.3.Recommended drainage coefficients for unbound bases and subbases in flexible pavements (Huang, 1993). ....................................................................................................26 Table 3.4. Suggested levels of reliability for various highway classes (AASHTO, 1993)............27 Table 3.5. ZR values for various levels of reliability (Huang, 1993). ............................................28 Table 3.6. Material inputs requirement for flexible pavements.....................................................39 Table 4.1. Locations and climate conditions..................................................................................74 Table 4.2. Number of axle per truck class and vehicle distribution by traffic level. .....................77 Table 4.3.Traffic volume. ..............................................................................................................78 Table 4.4. Base layer coefficient and subgrade resilient modulus.................................................78 Table 4.5. 1993 AASHTO designs. ...............................................................................................79 Table 4.6. Location of designs and environmental data. ...............................................................81 Table 4.7. Asphalt concrete properties...........................................................................................83 Table 4.8. Binder grade by state for low traffic case. ....................................................................83 Table 4.9. Binder grade by state for moderate and high traffic cases............................................84 Table 4.10. Granular base resilient modulus calculated from the 1993 AASHTO’s structural layer coefficient..............................................................................................................................84 Table 4.11. Granular aggregate base properties.............................................................................84 Table 4.12a. Subgrade properties...................................................................................................85 Table 5.1. AC mix properties.......................................................................................................117 Table 6.1. Traffic data for case study...........................................................................................144 Table 6.2. I-95 structural designs.................................................................................................152 Table 6.3. US-219 structural designs...........................................................................................153 Table 6.4. ICC structural designs.................................................................................................153
  • 8. vi LIST OF FIGURES Figure 3.1. General procedure for computing thickness................................................................ 20 Figure 3.2. Chart for estimating layer coefficient for asphalt concrete based on elastic modulus (AASHTO, 1993) ................................................................................................... 24 Figure 3.3. M-E flexible pavement design flow chart. .................................................................. 34 Figure 3.4. Summary of schematics for horizontal location of critical response predictions (NCHRP, 2004)..................................................................................................................... 44 Figure 4.1. Pavement structure ...................................................................................................... 73 Figure 4.2. States selected for comparison study........................................................................... 73 Figure 4.3. Distribution mass function of single axle loads by vehicle class type......................... 75 Figure 4.4. Distribution mass function of tandem axle loads by vehicle class type. ..................... 76 Figure 4.5. Distribution mass function of tridem axle loads by vehicle class type........................ 76 Figure 4.6. Granular base thickness design.................................................................................... 88 Figure 4.7. Asphalt concrete thickness design............................................................................... 89 Figure 4.8. NCHRP 1-37A predictions for low traffic scenario. ................................................... 91 Figure 4.9. NCHRP 1-37A predictions for moderate traffic scenario. .......................................... 91 Figure 4.10. NCHRP 1-37A predictions for high traffic scenario. ................................................ 92 Figure 4.11. Summary of 1-37A predictions. ................................................................................ 93 Figure 4.12. “Alligator” fatigue cracking predictions range.......................................................... 94 Figure 4.13. Permanent deformation predictions range................................................................. 95 Figure 5.1. Sensitivity to base thickness........................................................................................ 98 Figure 5.2. MLET calculated horizontal tensile strain versus base thickness................................ 99 Figure 5.3. MLET calculated vertical compressive strain versus pavement depth: (a) along the total thickness of the pavement; and (b) only base thickness, in percentage of total base thickness ......................................................................................................... 101 Figure 5.4. NCHRP 1-37A rutting predictions versus base thickness. ........................................ 102 Figure 5.5. Sensitivity to AC thickness. ...................................................................................... 103 Figure 5.6. NCHRP 1-37A rutting predictions versus AC thickness........................................... 103 Figure 5.7. Rutting performance sensitivity to traffic load type at 15 years................................ 105 Figure 5.8. Effect of traffic load type on AC rutting (Basyouny et al., 2005)............................. 106 Figure 5.9. Fatigue cracking performance sensitivity to traffic load type at 15 years................. 106 Figure 5.10. Class 5 and class 9 percentages for different vehicle distribution scenarios........... 107 Figure 5.11. Performance for different vehicle class distributions. ............................................. 108 Figure 5.12. Sensitivity to local climate conditions..................................................................... 110 Figure 5.13. Sensitivity to ground water table............................................................................. 111 Figure 5.14. Sensitivity of predicted dynamic modulus to mixture inputs. (Schwartz et al., 2006 – in preparation) ......................................................................................................... 113 Figure 5.15. Sensitivity to binder grade....................................................................................... 114 Figure 5.16. Sensitivity to effective binder content (% by volume). ........................................... 116 Figure 5.17. Sensitivity to air voids............................................................................................. 116 Figure 5.18. (a) Year seasonal variation of predicted |E*|; (b) Sensitivity to AC dense graded mixture type............................................................................................................. 118 Figure 5.19. (a) Sensitivity to AC dense graded mixture and SMA; (b) year seasonal variation of predicted |E*|. .................................................................................................. 120 Figure 5.20. Sensitivity to granular base resilient modulus......................................................... 122 Figure 5.21. Multi-layer linear elastic computation of vertical compressive strains versus base MR. .............................................................................................................................. 123
  • 9. vii Figure 5.22. Multi-layer linear elastic computation of horizontal tensile strain at the bottom of AC layer versus base MR. ................................................................................... 123 Figure 5.23. Sensitivity to subgrade resilient modulus................................................................ 124 Figure 5.24. Sensitivity to subgrade type..................................................................................... 125 Figure 5.25. Sensitivity to AC rutting model calibration coefficients. ........................................ 129 Figure 5.26. Sensitivity to base layer rutting model calibration coefficient. ............................... 130 Figure 5.27. Sensitivity to fatigue cracking model calibration coefficients. ............................... 132 Figure 5.28. Service life sensitivity to design criterion for different AC thickness: (a) rutting; (b) fatigue cracking................................................................................................. 135 Figure 5.29. Service life sensitivity to design criterion for vehicle distribution: (a) rutting; (b) fatigue cracking. ............................................................................................................ 136 Figure 5.30. Service life sensitivity to design criterion for MD climate conditions: (a) rutting; (b) fatigue cracking................................................................................................. 137 Figure 5.31. Service life sensitivity to design criterion for different binder grade: (a) rutting; (b) fatigue cracking................................................................................................. 138 Figure 5.32. Service life sensitivity to design criterion for different base resilient modulus: (a) rutting; (b) fatigue cracking. .......................................................................... 139 Figure 5.33. Service life sensitivity to design criterion for different subgrade resilient modulus: (a) rutting; (b) fatigue cracking. .......................................................................... 140 Figure 6.1. M-E flexible pavement design flow chart. ................................................................ 143 Figure 6.2. Vehicle distribution by project. ................................................................................. 145 Figure 6.3. Load distribution for the I-95 project. ....................................................................... 145 Figure 6.4. Load distribution for the US-219 project. ................................................................. 146 Figure 6.5. Load distribution estimated for the ICC project........................................................ 146 Figure 6.6. I-95 project performance predictions. ....................................................................... 150 Figure 6.7. US-219 project performance predictions................................................................... 151 Figure 6.8. ICC project performance predictions. ....................................................................... 151
  • 10. 1 Chapter 1: Introduction Pavement structural design is a daunting task. Although the basic geometry of a pavement system is quite simple, everything else is not. Traffic loading is a heterogeneous mix of vehicles, axle types, and axle loads with distributions that vary with time throughout the day, from season to season, and over the pavement design life. Pavement materials respond to these loads in complex ways influenced by stress state and magnitude, temperature, moisture, time, loading rate, and other factors. Exposure to harsh environmental conditions ranging from subzero cold to blistering heat and from parched to saturated moisture states adds further complications. It should be no wonder, then, that the profession has resorted to largely empirical methods like the American Association of State Highway and Transportation Officials (AASHTO) guides for pavement design (AASHTO, 1993). Several developments over recent decades have offered an opportunity for more rational and rigorous pavement design procedures. Advances in computational mechanics and in the computers available for performing the calculations have greatly improved our ability to predict pavement response to load and climate effects. Improved material characterization and constitutive models make it possible to incorporate nonlinearities, rate effects, and other realistic features of material behavior. Large databases now exist for traffic characteristics, site climate conditions, pavement material properties, and historical performance of in-service pavement sections. These and other assets provided the technical infrastructure that made possible the development of the mechanistic- empirical pavement design procedure in NCHRP Project 1-37A (NCHRP, 2004).
  • 11. 2 The objectives of this study are (1) to compare flexible pavement designs and performance between the empirical 1993 AASHTO pavement design guide and the mechanistic-empirical NCHRP 1-37A methodology and (2) to perform a sensitivity analysis of the NCHRP 1-37A methodology’s input parameters. The comparisons span a range of locations within the United States, each with its own climate, subgrade and other material properties, and local design preferences. Particular emphasis is devoted to the influence of traffic and reliability levels on the comparisons. The sensitivity study is performed for several key input variables. A design exercise consisting of three Maryland projects is presented, from which inferences regarding appropriate design criteria for rutting and bottom-up fatigue cracking are also drawn. This thesis is divided in seven chapters. The first chapter presents an introduction, the objective of the research, and the description of the chapters. The second chapter is the literature review of the most relevant pavement design methods. The methods are grouped in two categories, empirical and mechanistic- empirical, attempting to maintain the focus at the research objectives. The third chapter describes the 1993 AASHTO pavement design guide and the new mechanistic-empirical NCHRP 1-37A procedure, currently under evaluation for adoption as the new standard AASHTO Guide. The fourth chapter discusses the differences between pavement designs in the 1993 AASHTO guide and the NCHRP 1-37A methodology. Typical 1993 AASHTO designs for five different regions in the U.S. and three traffic levels are analyzed using the latest version of the NCHRP 1-37A software. Comparisons are made based on fatigue
  • 12. 3 cracking and permanent deformation predictions from the mechanistic-empirical procedure. The fifth chapter describes the results of the NCHRP 1-37A sensitivity study. The sensitivity study is a parametric evaluation of key inputs and their analysis of reasonableness and consistency with expected field results. The sensitivity is performed for fatigue cracking, permanent deformation and the impact on service life. The sixth chapter presents application examples of Maryland designs obtained from the Maryland State Highway Administration (MDSHA). Three 1993 AASHTO designs are evaluated using the NCHRP 1-37A methodology. The seventh chapter presents a summary of conclusions, final remarks and recommendations for future studies involving the application and implementation of the new mechanistic-empirical pavement design guide.
  • 13. 4 Chapter 2: Review of Flexible Pavement Design Principles Before the 1920s pavement design consisted basically of defining thicknesses of layered materials that would provide strength and protection to a soft, weak subgrade. Pavements were designed against subgrade shear failure. Engineers used their experience based on successes and failures of previous projects. As experience evolved, several pavement design methods based on subgrade shear strength were developed. Since then, traffic volume has increased and the design criteria have changed. As important as providing subgrade support, it was equally important to evaluate pavement performance through ride quality and other surface distresses that increase the rate of deterioration of pavement structures. Performance became the focus point of pavement designs. Methods based on serviceability (an index of the pavement service quality) were developed based on test track experiments. The AASHO Road Test in 1960s was a seminal experiment from which the AASHTO design guide was developed. Methods developed from laboratory test data or test track experiment where model curves are fitted to data are typical examples of empirical methods. Although they may exhibit good accuracy, empirical methods are valid only for the material selection and climate condition in which they were developed. Meanwhile, new materials started to be used in pavement structures that provided better subgrade protection, but with their own failure modes. New design criteria were required to incorporate such failure mechanisms (e.g., fatigue cracking and permanent deformation in the case of asphalt concrete). The Asphalt Institute method (Asphalt Institute, 1982, 1991) and the Shell method (Claussen et al., 1977; Shook et al., 1982) are
  • 14. 5 examples of procedures based on asphalt concrete’s fatigue cracking and permanent deformation failure modes. These methods were the first to use linear-elastic theory of mechanics to compute structural responses (in this case strains) in combination with empirical models to predict number of loads to failure for flexible pavements. The dilemma is that pavement materials do not exhibit the simple behavior assumed in isotropic linear-elastic theory. Nonlinearities, time and temperature dependency, and anisotropy are some examples of complicated features often observed in pavement materials. In this case, advanced modeling is required to mechanistically predict performance. The mechanistic design approach is based on the theories of mechanics to relate pavement structural behavior and performance to traffic loading and environmental influences. Progress has been made in recent years on isolated pieces of the mechanistic performance prediction problem. But the reality is that fully mechanistic methods are not yet available for practical pavement design. The mechanistic-empirical approach is the consolidation of the two sides. Empirical models are used to fill in the gaps that exist between the theory of mechanics and the performance of pavement structures. Simple mechanistic responses are easy to compute with assumptions and simplifications (i.e., homogeneous material, small strain analysis, static loading as typically assumed in linear elastic theory), but they by themselves cannot be used to predict performance directly; some type of empirical model is required to make the appropriate correlation. Mechanistic-empirical methods are considered an intermediate step between empirical and fully mechanistic methods. The objective of this section is to review briefly some of these advancements in pavement design focusing on flexible pavements. The nomenclature in the literature often
  • 15. 6 shows several groups of different pavement design methods, mostly according to their origin and development techniques. For simplification, pavement design methods in this study are grouped as empirical and mechanistic-empirical. Empirical Methods An empirical design approach is one that is based solely on the results of experiments or experience. Observations are used to establish correlations between the inputs and the outcomes of a process--e.g., pavement design and performance. These relationships generally do not have a firm scientific basis, although they must meet the tests of engineering reasonableness (e.g., trends in the correct directions, correct behavior for limiting cases, etc.). Empirical approaches are often used as an expedient when it is too difficult to define theoretically the precise cause-and-effect relationships of a phenomenon. The first empirical methods for flexible pavement design date to the mid-1920s when the first soil classifications were developed. One of the first to be published was the Public Roads (PR) soil classification system (Hogentogler & Terzaghi, 1929, after Huang, 2004). In 1929, the California Highway Department developed a method using the California Bearing Ratio (CBR) strength test (Porter, 1950, after Huang, 2004). The CBR method related the material’s CBR value to the required thickness to provide protection against subgrade shear failure. The thickness computed was defined for the standard crushed stone used in the definition of the CBR test. The CBR method was improved by U.S. Corps of Engineers (USCE) during the World War II and later became the most popular design method. In 1945 the Highway Research Board (HRB) modified
  • 16. 7 the PR classification. Soils were grouped in 7 categories (A-1 to A-7) with indexes to differentiate soils within each group. The classification was applied to estimate the subbase quality and total pavement thicknesses. Several methods based on subgrade shear failure criteria were developed after the CBR method. Barber (1946, after Huang 2004) used Terzaghi’s bearing capacity formula to compute pavement thickness, while McLeod (1953, after Huang 2004) applied logarithmic spirals to determine bearing capacity of pavements. However, with increasing traffic volume and vehicle speed, new materials were introduced in the pavement structure to improve performance and smoothness and shear failure was no longer the governing design criterion. The first attempt to consider a structural response as a quantitative measure of the pavement structural capacity was measuring surface vertical deflection. A few methods were developed based on the theory of elasticity for soil mass. These methods estimated layer thickness based on a limit for surface vertical deflection. The first one published was developed by the Kansas State Highway Commission, in 1947, in which Boussinesq’s equation was used and the deflection of subgrade was limited to 2.54 mm. Later in 1953, the U.S. Navy applied Burmister’s two-layer elastic theory and limited the surface deflection to 6.35 mm. Other methods were developed over the years, incorporating strength tests. More recently, resilient modulus has been used to establish relationships between the strength and deflection limits for determining thicknesses of new pavement structures and overlays (Preussler and Pinto, 1984). The deflection methods were most appealing to practitioners because deflection is easy to measure in the
  • 17. 8 field. However, failures in pavements are caused by excessive stress and strain rather than deflection. After 1950 experimental tracks started to be used for gathering pavement performance data. Regression models were developed linking the performance data to design inputs. The empirical AASHTO method (AASHTO, 1993), based on the AASHO Road Test (1960s), is the most widely used pavement design method today. The AASHTO design equation is a relationship between the number of load cycles, pavement structural capacity, and performance, measured in terms of serviceability. The concept of serviceability was introduced in the AASHTO method as an indirect measure of the pavement’s ride quality. The serviceability index is based on surface distresses commonly found in pavements. The biggest disadvantage of regression methods is the limitation on their application. As any empirical method, regression methods can be applied only to the conditions at the road test site in which they were developed. The AASHTO method, for example, was adjusted several times over the years to incorporate extensive modifications based on theory and experience that allowed the design equation to be used under conditions other than those of the AASHO Road Test. Regression equations can also be developed using performance data from existing pavements, such as the COPES (Darter et al., 1985) and EXPEAR (Hall et al., 1989) systems. Although these models can represent and explain the effects of several factors on pavement performance, their limited consideration of materials and construction data result in wide scatter and many uncertainties. Their use as pavement design tools is therefore very limited.
  • 18. 9 Mechanistic-Empirical Methods Mechanistic-Empirical methods represent one step forward from empirical methods. The induced state of stress and strain in a pavement structure due to traffic loading and environmental conditions is predicted using theory of mechanics. Empirical models link these structural responses to distress predictions. Kerkhoven & Dormon (1953) first suggested the use of vertical compressive strain on the top of subgrade as a failure criterion to reduce permanent deformation. Saal & Pell (1960) published the use of horizontal tensile strain at the bottom of asphalt layer to minimize fatigue cracking. Dormon & Metcalf (1965) first used these concepts for pavement design. The Shell method (Claussen et al., 1977) and the Asphalt Institute method (Shook et al., 1982; AI, 1992) incorporated strain-based criteria in their mechanistic-empirical procedures. Several studies over the past fifteen years have advanced mechanistic-empirical techniques. Most of work, however, was based on variants of the same two strain-based criteria developed by Shell and the Asphalt Institute. The Departments of Transportation of the Washington State (WSDOT), North Carolina (NCDOT) and Minnesota (MNDOT), to name a few, developed their own M-E procedures. The National Cooperative Highway Research Program (NCHRP) 1-26 project report, Calibrated Mechanistic Structural Analysis Procedures for Pavements (1990), provided the basic framework for most of the efforts attempted by state DOTs. WSDOT (Pierce et al., 1993; WSDOT, 1995) and NCDOT (Corley-Lay, 1996) developed similar M-E frameworks incorporating environmental variables (e.g., asphalt concrete temperature to determine stiffness) and cumulative damage model using Miner’s Law with the fatigue cracking criterion.
  • 19. 10 MNDOT (Timm et al., 1998) adopted a variant of the Shell’s fatigue cracking model developed in Illinois (Thompson, 1985) and the Asphalt Institute’s rutting model. The NCHRP 1-37A project (NCHRP, 2004) delivered the most recent M-E-based method that incorporates nationally calibrated models to predict distinct distresses induced by traffic load and environmental conditions. The NCHRP 1-37A methodology also incorporates vehicle class and load distributions in the design, a step forward from the Equivalent Single Axle Load (ESAL) used in the AASHTO design equation and other methods. The performance computation is done on a seasonal basis to incorporate the effects of climate conditions on the behavior of materials. The NCHRP 1-37A methodology is the main focus of this study. A complete description of its components, key elements, and use is presented in Chapter 3. Chapter 3 also includes a complete review of the 1993 AASHTO Guide and its previous versions. The comparison of the empirical 1993 AASHTO Guide and the mechanistic-empirical NCHRP 1-37A procedure, which is one of the objectives of this study, is presented in Chapter 4.
  • 20. 11 Chapter 3: Pavement Design Procedures The current 1993 AASHTO Guide and the new mechanistic-empirical NCHRP 1- 37A procedure for flexible pavements are described in this chapter. The 1993 AASHTO is the latest version of AASHTO Guide for pavement design and analysis, which is based primarily on the AASHO Road Test conducted in the late 1950s. Over the years adjustments and modifications have been made in an effort to upgrade and expand the limits over which the AASHTO guide is valid (HRB, 1962; AASHTO, 1972, 1986, 1993). The Federal Highway Administration’s 1995-1997 National Pavement Design Review found that some 80 percent of states use one of the versions of the AASHTO Guide. Of the 35 states that responded to a 1999 survey by Newcomb and Birgisson (1999), 65 percent reported using the 1993 AASHTO guide for both flexible and rigid pavement designs. A 1996 workshop meant to develop a framework for improving the 1993 Guide recommended instead the development of a new guide based as much as possible on mechanistic principles. The NCHRP 1-37A procedure is the result of this effort. Following independent reviews and validations that have been ongoing since its initial release in April, 2004, the NCHRP 1-37A procedure is expected to be adopted by AASHTO as the new national pavement design guide. This chapter is divided in two sections. The first describes the AASHTO Guide and its revisions since its first edition dated 1961, with the original empirical equations
  • 21. 12 derived from the AASHO Road Test, to its latest dated 19931 (HRB, 1961, 1962; AASHTO, 1972, 1986, 1993). The second part explains in some detail the new mechanistic-empirical NCHRP 1-37A pavement design procedure (NCHRP, 2004). 3.1. 1993 AASHTO Guide The 1993 AASHTO Guide is the latest version of the AASHTO Interim Pavement Design Guide, originally released in 1961. The evolution of the AASHTO Guide is outlined, followed by a description of the current design equation and input variables. At the end of this section, a summary of recent evaluation studies of the AASHTO guide is also presented. 3.1.1. The AASHO Road Test and Previous Versions of the Guide After two successful road projects, the Road Test One-MD and the WASHO Road Test (Western Association of State Highway Officials), in 1955 the Highway Research Board (HRB) approved the construction of a new test track project located in Ottawa, Illinois. This test facility was opened to traffic in 1958. Traffic operated on the pavement sections until November, 1960, and a little more than 1 million axle loads were applied to the pavement and bridges. (HRB, 1961) 1 The supplement of the 1993 AASHTO Guide, released in 1998 (AASHTO, 1998), substantially modified the rigid pavement design procedure, based on recommendations from NCHRP Project 1-30 and studies conducted using the LTPP database. However this supplement is not addressed in this thesis because it is solely related to rigid pavements.
  • 22. 13 The main objective of the AASHO Road Test was to determine the relation between the number of repetitions of specified axle loads (different magnitudes and arrangements) and the performance of different flexible and rigid pavement structures. The test track consisted of 6 loops, each with a segment of four-lane divided highway (two lanes per direction) whose parallel roadways were connected with a turnaround at both ends. Five loops were trafficked and loop 1 received no traffic during the entire experiment. Test sections were located only on tangents separated by a short transition lengths. The inner and outer lane had identical pavement sections. Each lane had its own assigned traffic level. The subgrade was identified as a fine grained silty clay (A-6 or A-7-6 according to the AASHTO soil classification). For uniformity purposes, the top 3 ft of the embankment consisted of a borrowed A-6 soil from areas along the right-of-way of the project. The climate was temperate (average summer temperature of 76 °F and 27 °F in winter, annual precipitation of 34 inches) with frost/thaw cycles during the winter/spring months. (HRB, 1962) The Concept of Serviceability and Structural Number The performance of various pavements is a function of their relative ability to serve traffic over a period of time. This definition of “relative” performance was stated in Appendix F of the HRB Special Report 61E that described the findings of the pavement research at the AASHO Road Test (HRB, 1962). It goes further stating: “At the time, there were no widely accepted definitions of performance and therefore, a “relative” performance definition should be used instead.”
  • 23. 14 The concept of serviceability is supported by five fundamental assumptions: (1) highways are for the comfort of the traveling user; (2) the user’s opinion as to how a highway should perform is highly subjective; (3) there are characteristics that can be measured and related to user’s perception of performance; (4) performance may be expressed by the mean opinion of all users; and (5) performance is assumed to be a reflection of serviceability with increasing load applications. Based on these assumptions the definition of present serviceability is: “The ability of a specific section of pavement to serve high speed, high volume, and mixed traffic in its existing condition.” (HRB, 1962) The Present Serviceability Ratio (PSR) is the average of all users’ ratings of a specific pavement section on a scale from 5 to 0 (being 5 very good and 0 very poor). The mathematical correlation of pavement distresses observed during visual surveys and profile measurements (roughness) with PSR is termed the Present Serviceability Index (PSI); PSI is the measure of performance in the AASHTO design equation. The correlation between PSI and typical flexible pavement distresses observed during the AASHO Road Test is represented by the following equation (HRB, 1962): ( ) 2 5.03 1.91 log 1 1.38 0.01PSI SV RD C P= − ⋅ + − − + (3.1) in which: SV = mean of slope variance in the wheelpaths RD = mean rut depth (in) C = cracking (ft2 /1000 ft2 ) P = patching (ft2 /1000 ft2 )
  • 24. 15 1961 Interim Guide The first results from data collected at the AASHO Road Test were released in the form of Highway Research Board reports (HRB, 1961, 1962). The original design equation was empirically developed for the specific subgrade type, pavement materials and environmental conditions at the location of the AASHO Road Test as follows: ( ) ( ) ( ) ( ) ( ) 18 5.19 log 4.2 4.2 1.5 log 9.36 log 1 0.20 0.4 1094 1 tp W SN SN − − = ⋅ + − + + + (3.2) in which: W18 = accumulated 18 kip equivalent single axle load for the design period pt = terminal serviceability at the end of design life SN = structural number The structural number (SN) is the parameter that represents the pavement structural strength. It is given as the sum of the product of each layer thickness by its structural layer coefficient, which is an empirical coefficient representing each layer’s relative contribution to the pavement strength: 332211 DaDaDaSN ++= (3.3) in which: a1, a2, a3 = structural layer coefficients for surface, base, and subbase D1, D2, D3 = thicknesses for surface, base, and subbase The Equation (3.2) is solved for the structural number for a given traffic and terminal serviceability criterion. The layer thicknesses are determined from Equation (3.3). Note that there is not a unique solution for the layer thicknesses.
  • 25. 16 1972 Interim Guide The 1972 Interim Design Guide was the first attempt to extend the empirical relationships developed at the AASHO Road Test to a broader range of materials and environmental conditions. This version also included the first step towards an overlay design procedure. Some of the added features for flexible pavement designs are described below. An empirical soil support (Si) scale was developed to reflect the influence of different local subgrade soils in Equation (3.2). The scale ranged from 1 to 10, with 10 corresponding to crushed stone materials and 1 to highly plastic clays. The A-6 subgrade soil at the AASHO Road Test was defined as Si value of 3. All other values were to be set by local agency experience, but there were no guidelines on how to determine these values. There was also a new regional factor R for adjusting the structural number for local environment, estimated from serviceability loss rates in the AASHO Road Test. These values varied between 0.2 and 5.0, with an annual average of about 1.0. Table 3.1 summarizes the recommended values for R. Table 3.1. Recommended values for Regional Factor R (AASHTO, 1972). Roadbed material condition R Frozen to depth of 5’’ or more (winter) 0.2 – 1.0 Dry (summer and fall) 0.3 – 1.5 Wet (spring thaw) 4.0 – 5.0 The 1972 Interim Guide also specified ranges for structural layer coefficients applicable to materials other than those used during the AASHO Road Test. The values were based on a survey of state highway agencies that were using the 1961 Interim Guide. Table 3.2 summarizes these values for different layer applications.
  • 26. 17 Table 3.2. Ranges of structural layer coefficients (AASHTO, 1972). Coefficient Range a1 (surface course) 0.17 – 0.45 a2 (untreated base) 0.05 – 0.18 a3 (subbase) 0.05 – 0.14 Equation (3.2) was modified to account for the new input terms: ( ) ( ) ( ) ( ) ( ) ( )18 5.19 log 4.2 4.2 1.5 1 log 9.36 log 1 0.20 log 0.372 3 0.4 1094 1 t i p W SN S RSN − − = ⋅ + − + + + − + + (3.4) in which: R = regional factor Si = soil support value and other terms are as previously defined 1986 and 1993 Guides The 1986 revision of the 1972 Interim Guide added more features to the design procedure. The focus was on four important issues: (1) better characterization of the subgrade and unbound materials, (2) incorporation of pavement drainage, (3) better consideration of environmental effects, and (4) incorporation of reliability as a factor into the design equation. In the 1986 version of the AASHTO Guide, the subgrade was for the first time characterized by its resilient modulus MR, a fundamental engineering material property. The structural layer coefficients for unbound materials were also related quantitatively to resilient modulus by empirical equations.
  • 27. 18 Drainage quality was incorporated in the design process by introducing empirical drainage coefficients into the structural number equation. Equation (3.3) becomes: 1 1 2 2 2 3 3 3SN a D a D m a D m= + + (3.5) in which: m2, m3 = drainage coefficients for base and subbase and other terms are as previously defined Recommended values for the drainage coefficients are defined based on the quality of drainage and period of exposure to moisture levels near saturation. Environmental effects were also considered in two additional distinct ways: (1) separation of total serviceability losses into traffic and environmental components, and (2) estimation of an effective subgrade resilient modulus that reflects seasonal variations due primarily to moisture susceptibility. The loss in serviceability ΔPSI was decomposed into three components: ΔPSI = ΔPSITR + ΔPSISW + ΔPSIFH (3.6) in which: ΔPSITR, ΔPSISW, ΔPSIFH = components attributed to traffic, swelling and frost heave, respectively Appendix G in the 1986 AASHTO Guide describes in more detail the methods for evaluating these environmental losses, which depend on the swell/frost heave rate, probability of swell/frost heave, and maximum potential serviceability loss. Reliability was introduced into the 1986 AASHTO Guide to account for the effects of uncertainty and variability in the design inputs. Although it represents the
  • 28. 19 uncertainty of all inputs, it is very simply incorporated in the design equation through factors that modify the allowable design traffic (W18). There were few changes to the flexible pavement design procedure between the 1986 version and the current 1993 version. Most of the enhancements were geared towards rehabilitation, the use of nondestructive testing for evaluation of existing pavements, and backcalculation of layer moduli for determination of the layer coefficients. The design equation did not change from the 1986 to 1993 version. The complete description of the 1993 AASHTO Guide is presented in the following subsections. 3.1.2. Current Design Equation The 1993 AASHTO Guide specifies the following empirical design equation for flexible pavements: ( ) ( ) ( ) ( ) ( ) ( )18 0 5.19 log 4.2 1.5 log 9.36 log 1 0.20 2.32 log 8.07 0.4 1094 1 R PSI W Z S SN MR SN Δ − = ⋅ + ⋅ + − + + ⋅ − + + (3.7) in which: W18 = accumulated 18 kip equivalent single axle load for the design period ZR = reliability factor S0 = standard deviation SN = structural number ΔPSI = initial PSI – terminal PSI MR = subgrade resilient modulus (psi)
  • 29. 20 The solution of Equation (3.7) follows the same procedure described before for the previous versions of the Guide. Given all the inputs Equation (3.7) is solved for the structural number (SN) and then the layer thicknesses can be computed. The solution is not unique and different combination of thicknesses can be found. Additional design constraints, such as costs and constructability, must also be considered to determine the optimal final design. The 1993 Guide recommends the top-to-bottom procedure in which each of the upper layers is designed to provide adequate protection to the underlying layers. Figure 3.1 illustrates the procedure for a 3-layer flexible pavement. The steps in this case are as follows: • Calculate SN1 required to protect the base, using E2 as MR in Equation (3.7), and compute the thickness of layer 1 as: 1 1 1 a SN D ≥ (3.8) • Calculate SN2 required to protect the subgrade, using Equation (3.7), now with the subgrade effective resilient modulus as MR. The thickness of the base is computed as: 22 112 2 ma DaSN D − ≥ (3.9) AC GA Subgrade D2 E2 a2 m2 D1 E1 a1 MR SN1 SN2 AC GA Subgrade AC GA Subgrade D2 E2 a2 m2 D1 E1 a1 MR SN1 SN2 Figure 3.1. General procedure for computing thickness.
  • 30. 21 3.1.3. Input Variables The input variables required for the 1993 AASHTO guide are summarized in this section and the most important recommendations are described. Additional guidance can be found in the literature (AASHTO, 1993; Huang, 2004). Design period and serviceability loss are the initial inputs to be defined. Serviceability loss is defined as the difference between initial and terminal serviceability. Initial serviceability is the condition immediately after pavement construction. The conventional value is 4.2 (the average initial serviceability value at the AASHO Road Test). Terminal serviceability is the value at which the pavement is no longer capable of providing adequate service and major rehabilitation is required. Most state agencies have their own specification, although the 1993 AASHTO Guide recommends a terminal PSI of 2.5 for major highways and 2.0 for low volume roads, unless otherwise specified. The other input variables are separated into three groups: (a) traffic, (b) material properties, and (c) environmental effects. Traffic Vehicle and load distributions grouped by axle type are used to transform mixed traffic into a unified traffic parameter that can be used in the design equation. The mixed traffic is converted into one parameter called the Equivalent Single Axle Load (ESAL). ESAL is defined as the number of 18-kip single axles that causes the same pavement damage as caused by the actual mixed axle load and axle configuration traffic. The damage associated with the equivalent axle can be defined in numerous ways; in the 1993 AASHTO Guide it is defined in terms of serviceability. The 18-kip single axle load was
  • 31. 22 chosen because it was the maximum legal load permitted in many states at the time of the AASHO Road Test (Zhang et al., 2000). The first step in calculating ESALs for mixed traffic is to establish first the load equivalent factor (LEF) of every axle of the traffic distribution. In the 1993 AASHTO Guide, LEFs were developed based on empirical data obtained from the AASHO Road Test. The AASHTO LEFs consider the following variables: • Axle load • Axle configuration (e.g., single, tandem, etc.) • Structural number (for flexible pavements) • Terminal serviceability The computation of LEFs for flexible pavements is based on the following equations (Huang, 2004): 18t tx W LEF W = (3.10a) ( ) ( )2 2 18 18 log 4.79log 18 1 4.79log 4.33logtx t t x t x W G G L L L W β β ⎛ ⎞ = + − − + + −⎜ ⎟ ⎝ ⎠ (3.10b) 4.2 log 4.2 1.5 t t p G −⎛ ⎞ = ⎜ ⎟ −⎝ ⎠ (3.10c) ( ) ( ) 3.23 2 5.19 3.23 2 0.081 0.40 1 x x L L SN L β + = + + (3.10d) in which: Wtx = number of x-axle load applications applied over the design period Wt18 = number of equivalent 18-kip (80 kN) single axle load applications over the design period
  • 32. 23 Lx = load on one single axle, or a set of tandem or tridem, in kip L2 = axle code (1 for single axle, 2 for tandem, and 3 for tridem) SN = structural number of the designed pavement pt = terminal serviceability β18 = βx for Lx = 18 kip and L2 = 1 With LEF calculated for every load group, the second step is to compute the truck factor Tf as follows: ( )f i i i T p LEF A= × ×∑ (3.11) in which: pi = percentage of repetitions for ith load group LEFi = LEF for the ith load group (e.g., single-12kip, tandem-22kip, etc.) A = average number of axles per truck The number of ESALs is calculated as follows: YLDGTTAADTESAL f ×××××××= 365 (3.12) in which: AADT = annual average daily traffic T = percentage of trucks G = growth factor D = trucks in design direction (%) L = trucks in design lane (%) Y = design period
  • 33. 24 Material properties The fundamental material property in the 1993 AASHTO Guide is the resilient modulus. Since the framework was constructed based upon structural layer coefficients, empirical relationships were developed to correlate resilient modulus with structural layer coefficient. Figure 3.2 summarizes the relationship for the layer coefficient a1 for asphalt concrete. Figure 3.2. Chart for estimating layer coefficient for asphalt concrete based on elastic modulus (AASHTO, 1993) The layer coefficient a2 for nonstabilized base materials is given by: 977.0log249.0 22 −= Ea (3.13) and the layer coefficient a3 for nonstabilized subbase materials is given by: 839.0log227.0 33 −= Ea (3.14) in which:
  • 34. 25 E2 = resilient modulus of unbound base layer materials E3 = resilient modulus of unbound subbase layer materials The layer coefficients in the AASHO Road Test were assumed equal to 0.44 for asphalt concrete, which corresponds to a MR = 450,000 psi; 0.14 for the granular base, corresponding to MR = 30,000 psi; and 0.11 for the subbase, equivalent to MR = 15,000 psi. The subgrade is characterized solely by its resilient modulus in Equation (3.7). There are also several correlations between MR and other soil properties that can be found in the literature. Most of them relate MR to CBR or R-Value (Heukelom and Klomp, 1962; Asphalt Institute, 1982; Van Til et al., 1972 – after Huang, 1993; NCHRP, 2004). Environmental Effects Environmental effects (other than swelling and frost heave) are accounted for in two input parameters in the 1993 AASHTO Guide, the seasonally-adjusted subgrade resilient modulus and the drainage coefficient mi applied to the structural number in Equation (3.5). It is recommended that an effective subgrade resilient modulus be used to represent the effect of seasonal variations, especially for moisture-sensitive fine-grained soils or for locations with significant freeze-thaw cycles (AASHTO, 1993). The effective resilient modulus is the equivalent modulus that would result in the same damage to the pavement as if seasonal modulus were used. The relative damage ur is describe by the following empirical relationship: 32.28 1018.1 − ×= Rr Mu (3.15)
  • 35. 26 The average relative damage (uf) is computed by taking the average of ur of all seasons. The effective subgrade resilient modulus is then given by: 431.0 3015 − ⋅= fR uM (3.16) The drainage coefficient is related to the material’s permeability and the amount of time that the material is expected to be at near saturation conditions. Table 3.3 shows recommended drainage coefficients for unbound materials. However, in practice it is difficult to assess the quality of drainage or the percentage of time the material is exposed to near saturation conditions, and most agencies use drainage coefficient values of 1.0, relying mostly on the effective subgrade resilient modulus as the climatic-sensitive input parameter2 . Table 3.3.Recommended drainage coefficients for unbound bases and subbases in flexible pavements (Huang, 1993). Quality of drainage Percentage of time pavement structure exposed to moisture levels approaching saturation Rating Water removed within Less than 1% 1-5% 5-25% Greater than 25% Excellent 2 hours 1.40-1.35 1.35-1.30 1.30-1.20 1.20 Good 1 day 1.35-1.25 1.25-1.15 1.15-1.00 1.00 Fair 1 week 1.25-1.15 1.15-10.5 1.00-0.80 0.80 Poor 1 month 1.15-1.05 1.05-0.80 0.80-0.60 0.60 Very poor Never drain 1.05-0.95 0.95-0.75 0.75-0.40 0.40 3.1.4. Reliability There are many sources for uncertainties in pavement design problems – e.g., traffic prediction, material characterization and behavior modeling, environmental 2 In the survey done with 5 states for the sensitivity analysis presented in Chapter 4, all of them responded that their drainage coefficient were equal to 1.0.
  • 36. 27 conditions, etc. – as well as variability during construction and maintenance. The uncertainty comes not only from data collection, but also from the lack of input parameters required to better characterize traffic, materials and environmental conditions. The reliability factor was introduced in the design equation to account for these uncertainties. Reliability is defined as the probability that the design pavement will achieve its design life with serviceability higher than or equal to the specified terminal serviceability. Although the reliability factor is applied directly to traffic in the design equation, it does not imply that traffic is the only source of uncertainty. Table 3.4 suggests appropriate levels of reliability for various highway classes. There is some guidance on how reliability is considered. High volume and high speed highways have higher reliability factors than minor roads and local routes. The standard deviation (S0) and reliability factor (ZR) parameters in the design equation are respectively defined as the standard deviation of uncertainties and the area under a normal distribution curve for p < reliability. The parameter ZR can be retrieved from Table 3.5. The 1993 AASHTO Guide recommends values for S0 between 0.35 and 0.45 for flexible pavements. Table 3.4. Suggested levels of reliability for various highway classes (AASHTO, 1993). Recommended level of reliabilityFunctional classification Urban Rural Interstate and freeways 85-99.9 80-99.9 Principal arterials 80-99 75-95 Collectors 80-95 75-95 Locals 50-80 50-80
  • 37. 28 Table 3.5. ZR values for various levels of reliability (Huang, 1993). Reliability ZR Reliability ZR 50 0.000 93 -1.476 60 -0.253 94 -1.555 70 -0.524 95 -1.645 75 -0.674 96 -1.751 80 -0.841 97 -1.881 85 -1.037 98 -2.054 90 -1.282 99 -2.327 91 -1.340 99.9 -3.090 92 -1.405 99.99 -3.750 3.1.5. Considerations and Comments Found in the Literature Several researchers have studied the AASHTO Guide in all its versions. This section summarizes the relevant findings gathered from the literature that discuss conflicting issues such as traffic, material properties, environmental conditions, and parametric sensitivity of the design equation. Serviceability cannot be directly measured in the field. A panel of users is required to provide subjective assessments of serviceability. This value is the Present Serviceability Ratio (PSR). The correlation of PSR with measured distresses is the Present Serviceability Index (PSI). PSI is the input parameter of the design equation, not the PSR, because determining PSR is very subjective, not to mention expensive and time consuming. Alternative approaches are available correlating PSI with roughness, which is a more reliable, and more easily measured parameter than the recommended distresses given in Equation (3.1) (Al-Omari and Darter, 1994; Gulen et al., 1994). Traffic has been a controversial parameter in the 1993 AASHTO Guide and its earlier versions. The fact that it relies on a single value to represent the overall traffic spectrum is questionable. The method used to convert the traffic spectra into ESALs by
  • 38. 29 applying LEFs is also questionable. The AASHTO LEFs consider serviceability as the damage equivalency between two axles. Zhang et al. (2000) have found that Equations 3.10, used to determine LEFs, are also capable of capturing damage in terms of equivalent deflection, which is easier to measure and validate. However quantifying damage equivalency in terms of serviceability or even deflections is not enough to represent the complex failure modes of flexible pavements. Several studies were conducted to investigate effects of different load types and magnitudes on damage of pavement structures using computed mechanistic pavement responses (Sebaaly and Tabatabaee, 1992; Zaghloul and White, 1994). Hajek (1995) proposed a general axle load equivalent factor – independent from pavement-related variables and axle configurations, based only on axle load – suitable for use in pavement management systems and simple routine design projects. Today it is widely accepted that load equivalency factors are a simple technique for incorporating mixed traffic into design equations and are well suited for pavement management systems. However pavement design applications require more comprehensive procedures. Mechanistic-empirical design procedures take a different approach for this problem; different loads and axle geometrics are mechanistically analyzed to determine directly the most critical structural responses that are significant to performance predictions, avoiding the shortcut of load equivalency factors. Layer coefficients have also been of interest to those developing and enhancing pavement design methods. Several studies have been conducted to find layer coefficients for local and new materials (Little, 1996; Richardson, 1996; MacGregor et al., 1999). Coree and White (1990) presented a comprehensive analysis of layer coefficients and
  • 39. 30 structural number. They showed that the approach was not appropriate for design purposes. Baladi and Thomas (1994), through a mechanistic evaluation of 243 pavement sections designed with the 1986 AASHTO guide, demonstrated that the layer coefficient is not a simple function of the individual layer modulus, but a function of all layer thicknesses and properties. There are several studies in the literature of the environmental influences in the AASHTO method. There are two main environmental factors that impact service life of flexible pavements: moisture and temperature. The effect of moisture on subgrade strength has been well documented in past years and uncountable publications about temperature effects on asphalt concrete are available. Basma and Al-Suleiman (1991) suggested using empirical relations between moisture content and resilient modulus directly in the design Equation (3.7). The variation of the structural number with moisture content was defined as ΔSN and was used to adjust the calculated SN. Basma and Al- Suleiman (1991) also suggested using a nomograph containing binder and mixture properties to determine the layer coefficient for asphalt concrete layer. Noureldin et al. (1996) developed an approach for considering temperature effects in the 1993 AASHTO design equation. In their approach, the mean annual pavement temperature is used to compute temperature coefficients that modify the original asphalt concrete layer coefficient used to compute the structural number. The 1993 AASHTO Guide and its earlier versions were developed based on results from one test site trafficked over two years with a total of slightly over one million ESALs. From this test track, which was built with the same materials varying only thicknesses, the design equation was developed. Studies have shown that despite of the
  • 40. 31 adjustments made over the years to the design equation in attempts to expand its suitability to different climate regions and materials, the design of flexible pavements still lacks accuracy in performance predictions and in ability to include different materials and their complex behavior. 3.2. NCHRP 1-37A Design Procedure The NCHRP 1-37A procedure is a mechanistic-empirical (M-E) method for designing and evaluating pavement structures. Structural responses (stresses, strains and deflections) are mechanistically calculated based on material properties, environmental conditions, and loading characteristics. These responses are used as inputs in empirical models to compute distress performance predictions. The NCHRP 1-37A procedure was developed under a research project funded by the National Cooperative Highway Research Program (NCHRP) and released in draft form in April, 2004 (NCHRP, 2004). The NCHRP 1-37A still depends on empirical models to predict pavement performance from calculated structural responses and material properties. The accuracy of these models is a function of the quality of the input information and the calibration of empirical distress models to observed field performance. Two types of empirical models are used in the NCHRP 1-37A. One type predicts the magnitude of the distress accumulation directly (e.g., rutting model for flexible pavements, and faulting for rigid); the other type predicts first the number of load applications to failure (i.e., given a specific load and climate condition) which is then empirically related to the distress
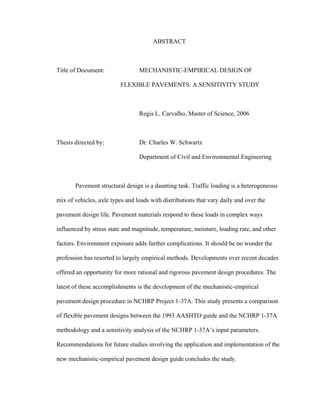
  • 41. 32 accumulation (e.g., fatigue cracking for flexible pavements, and transverse cracking for rigid). This section briefly describes the NCHRP 1-37A procedure. A description of the design process is provided, followed by information about the components of the design procedure: inputs (design criteria, traffic, material properties, and environmental conditions), pavement response models (mechanistic structural computational tools and climate model), empirical performance models, and reliability. 3.2.1. Design process The NCHRP 1-37A design process is not as straightforward as the 1993 AASHTO guide, in which the structure’s thicknesses are obtained directly from the design equation. Instead an iterative process is used in which predicted performance of selected pavement structure is compared against the design criteria as shown in Figure 3.3. The structure and/or material selection are adjusted until a satisfactory design is achieved. A step-by-step description is as follows: • Definition of a trial design for specific site conditions: subgrade support, material properties, traffic loading, and environmental conditions; • Definition of design criteria for acceptable pavement performance at the end of the design period (i.e., acceptable levels of rutting, fatigue cracking, thermal cracking, and roughness); • Selection of reliability level for each one of the distresses considered in the design;
  • 42. 33 • Calculation of monthly traffic loading and seasonal climate conditions (temperature gradients in asphalt concrete layers, moisture content in unbound granular layers and subgrade); • Modification of material properties in response to environmental conditions; • Computation of structural responses (stresses, strains and deflections) for each axle type and load and for each time step throughout the design period; • Calculation of predicted distresses (e.g., rutting, fatigue cracking) at the end of each time step throughout the design period using the calibrated empirical performance models; • Evaluation of the predicted performance of the trial design against the specified reliability level. If the trial design does not meet the performance criteria, the design (thicknesses or material selection) must be modified and the calculations repeated until the design is acceptable. The NCHRP 1-37A procedure is implemented in software in which all of above steps are performed automatically, except for the pavement structure and material selection.
  • 43. 34 Traffic Foundation Climate Material Properties Trial Design Structural Response Models Distress Prediction Models Meet Performance Criteria? Available for Strategy Selection Yes No No InputsInputs AnalysisAnalysis Results Traffic Foundation Climate Material Properties Trial Design Structural Response Models Distress Prediction Models Meet Performance Criteria? Available for Strategy Selection Yes No No InputsInputs AnalysisAnalysis Results Figure 3.3. M-E flexible pavement design flow chart. The NCHRP 1-37A has a hierarchical approach for the design inputs, defined by the quality of data available and importance of the project. There are three levels: • Level 1 – Laboratory measured material properties are required (e.g., dynamic modulus master curve for asphalt concrete, nonlinear resilient modulus for unbound materials). Project-specific traffic data is also required (e.g., vehicle class and load distributions); • Level 2 – Inputs are obtained through empirical correlations with other parameters (e.g., resilient modulus estimated from CBR values); • Level 3 – Inputs are selected from a database of national or regional default values according to the material type or highway class (e.g., soil
  • 44. 35 classification to determine the range of resilient modulus, highway class to determine vehicle class distribution). According to the NCHRP 1-37A report, level 1 is recommended for heavily trafficked highways where premature failure is economically undesirable. Level 2 can be used for intermediate projects, while level 3 is recommended for minor projects, usually low traffic roads. In addition, level 3 may be appropriate for pavement management programs widely implemented in highway state agencies. The NCHRP 1-37A methodology uses the Multi-Layer Linear Elastic Theory (MLET) to predict mechanistic responses in the pavement structure. When level 1 nonlinear stiffness inputs for unbound material are selected, MLET is not appropriate and a nonlinear Finite Element Method (FEM) is used instead. Level 3 was used throughout this study because (a) at present there are rarely level 1 input data to be used on a consistent basis, and (b) the final version of the NCHRP 1-37A software was calibrated using level 3. 3.2.2. Inputs The hierarchical level defines what type of input parameter is required. This section describes the input variables required for level 3. Design Criteria The design criteria are defined as the distress magnitudes at the minimum acceptable level of service. The design criteria are agency-defined inputs that may vary by roadway class, location, importance of the project, and economics.
  • 45. 36 The distresses considered for flexible pavements are: permanent deformation (rutting), “alligator” fatigue cracking (bottom-up), “longitudinal” cracking (top-down), thermal cracking, and roughness. The only functional distress predicted is roughness. Friction is not considered in the NCHRP 1-37A methodology. Among all these distresses, roughness is the only one not predicted entirely from mechanistic responses. Roughness predictions also include other non-structural distresses and site factors. Design criteria must be specified for each of these distresses predicted in the NCHRP 1-37A methodology. Traffic The NCHRP 1-37A methodology uses the concept of load spectra for characterizing traffic. Each axle type (e.g., single, tandem) is divided in a series of load ranges. Vehicle class distributions, daily traffic volume, and axle load distributions define the number of repetitions of each axle load group at each load level. The specific traffic inputs consist of the following data: • Traffic volume – base year information: o Two-way annual average daily truck traffic (AADTT) o Number of lanes in the design direction o Percent trucks in design direction o Percent trucks in design lane o Vehicle (truck) operational speed • Traffic volume adjustment factors: o Vehicle class distribution factors
  • 46. 37 o Monthly truck distribution factors o Hourly truck distribution factors o Traffic growth factors • Axle load distribution factors • General traffic inputs: o Number axles/trucks o Axle configuration o Wheel base o Lateral traffic wander Vehicle class is defined using the FHWA classification (FHWA, 2001). Automatic Vehicle Classification (AVC) and Weigh-in-Motion (WIM) stations can be used to provide data. The data needs to be sorted by axle type and vehicle class to be used in the NCHRP 1-37A procedure. In case site-specific data are not available, default values are recommended in the procedure. The use of load spectra enhances pavement design. It allows mixed traffic to be analyzed directly, avoiding the need for load equivalency factors. Additional advantages of the load spectra approach include: the possibility of special vehicle analyses, analysis of the impact on performance of overloaded trucks, and analysis of weight limits during critical climate conditions (e.g., spring thawing). Environment The environmental conditions are predicted by the Enhanced Integrated Climatic Model (EICM). The following data are required:
  • 47. 38 • Hourly air temperature • Hourly precipitation • Hourly wind speed • Hourly percentage sunshine • Hourly relative humidity These parameters can be obtained from weather stations close to the project location. The NCHRP 1-37A software includes a library of weather data for approximately 800 weather stations throughout the U.S. Additional environmental data are also required: • Groundwater table depth • Drainage/surface properties: o Surface shortwave absorptivity o Infiltration o Drainage path length o Cross slope The climate inputs are used to predict moisture and temperature distributions inside the pavement structure. Asphalt concrete stiffness is sensitive to temperature variations and unbound material stiffness is sensitive to moisture variations. The EICM is described later in Section 3.2.3.
  • 48. 39 Material Properties The NCHRP 1-37A methodology requires a large set of material properties. Three components of the design process require material properties: the climate model, the pavement response models, and the distress models. Climate-related properties are used to determine temperature and moisture variations inside the pavement structure. The pavement response models use material properties (corrected as appropriate for temperature and moisture effects) to compute the state of stress/strain at critical locations in the structure due to traffic loading and temperature changes. These structural responses are used by the distress models along with complementary material properties to predict pavement performance. Only flexible pavements were studied in this research and therefore only material properties for asphalt concrete and unbound materials are described. Table 3.6 summarizes the flexible pavement material properties required by the NCHRP 1-37A procedure. (Recall that measured properties are level 1 inputs, correlations with other parameters are level 2, and default values selected from typical ranges are level 3.) Table 3.6. Material inputs requirement for flexible pavements. Material inputs requiredMaterial Category Climatic models Response models Distress models Asphalt concrete - mixture: surface shortwave absorptivity, thermal conductivity, and heat capacity - asphalt binder: viscosity (stiffness) characterization - time-temperature dependent dynamic modulus (E*) of HMA mixture - Poisson’s ratio - tensile strength, - creep compliance - coefficient of thermal expansion Unbound materials - plasticity index - gradation parameters - effective grain sizes - specific gravity - saturated hydraulic conductivity - optimum moisture content - parameters to define the soil- water characteristic curve - resilient modulus (Mr) at optimum density and moisture content - Poisson’s ratio - unit weight - coefficient of lateral pressure - gradation parameters
  • 49. 40 Two material properties required in the NCHRP 1-37A methodology are considered innovative for pavement design methods, the dynamic modulus for asphalt concrete and the nonlinear stiffness model for unbound materials. Time- and temperature- dependency of asphalt mixtures is characterized by the dynamic modulus, |E*|. The dynamic modulus master curve describes the variation of asphalt concrete stiffness due to rate of loading and temperature variation (hardening with low temperature/high frequency and softening with high temperature/low frequency). The nonlinear elastic behavior of unbound granular materials is modeled by a stress-dependent resilient modulus included as level 1 input. Asphalt Concrete The complex dynamic modulus |E*| is the principal material property input for asphalt concrete. It is a function of mixture characteristics (binder, aggregate gradation, and volumetrics), rate of loading, temperature, and age. For level 1 inputs, the dynamic modulus master curve is constructed based on time-temperature superposition principles (Huang, 2004; Pellinen et al., 2004) by shifting laboratory frequency sweep test data. Binder viscosity measured using the dynamic shear rheometer (DSR) is also a required level 1 input. Aging effects on binder viscosity are simulated using the Global Aging System, which considers short term aging from mix/compaction and long term aging from oxidation (NCHRP 1-37A report, appendix CC-4, 2004). For level 2 and 3 inputs, the dynamic modulus master curve is obtained via an empirical predictive equation. The |E*| predictive equation is an empirical relationship between |E*| and mixture properties:
  • 50. 41 ( ) 2 200 200 4log * 3.750063 0.02932 0.001767 0.002841 0.058097 aE Vρ ρ ρ= + ⋅ − ⋅ − ⋅ − ⋅ ( ) ( ) ( )( ) 2 4 38 38 34 0.603313 0.313351 log 0.393532 log 3.871977 0.0021 0.003958 0.000017 0.005470 0.802208 1 beff f beff a V V V e η ρ ρ ρ ρ − − ⋅ − ⋅ ⎛ ⎞ + ⋅ + ⋅ − ⋅ + ⋅ − ⋅ +⎜ ⎟⎜ ⎟+ +⎝ ⎠ (3.17) in which: E* = dynamic modulus, 105 psi η = binder viscosity, 106 Poise f = loading frequency, Hz Va = air void content, % Vbeff = effective binder content, % by volume ρ34 = cumulative % retained on the 19-mm sieve ρ38 = cumulative % retained on the 9.5-mm sieve ρ4 = cumulative % retained on the 4.75-mm sieve ρ200 = % passing the 0.075-mm sieve The binder’s viscosity at any temperature is given by the binder’s viscosity- temperature relationship: RTVTSA logloglog ⋅+=η (3.18) in which: η = bitumen viscosity, cP TR = temperature, Rankine (TR=TFahrenheit+460) A = regression intercept VTS = regression slope of viscosity temperature susceptibility
  • 51. 42 For level 2 asphalt concrete inputs, binder parameters A and VTS are determined from DSR testing. For level 3, default A and VTS values are based on the binder grading (e.g., Superpave performance grade, penetration grade, or viscosity grade). Additional asphalt concrete material properties are required to predict thermal cracking: (1) tensile strength, (2) creep compliance, (3) coefficient of thermal expansion, (4) surface shortwave absorptivity, and (5) thermal conductivity and heat capacity. The last two properties are also required for the climatic model (EICM). Tensile strength and creep compliance are determined in the laboratory using the indirect tensile test for level 1 and 2 inputs. At level 3, these properties are correlated with other material parameters. Unbound Materials Resilient modulus is the principal unbound material property required for the structural response model. Level 1 resilient modulus values are determined from laboratory test data as fitted to the stress-dependent stiffness model: 2 3 1 k k oct R a a a M k p p p τθ⎛ ⎞ ⎛ ⎞ = ⎜ ⎟ ⎜ ⎟ ⎝ ⎠ ⎝ ⎠ (3.19) in which: MR = resilient modulus θ = bulk stress = σ1 + σ2 + σ3 σ1 = major principal stress σ2 = intermediate principal stress = σ3 for MR test on cylindrical specimens σ3 = minor principal stress/confining pressure τoct = octahedral shear stress = ( ) ( ) ( )2 32 2 31 2 21 3 1 σσσσσσ −+−+− pa = atmospheric pressure (used to normalize the equation)
  • 52. 43 k1, k2, k3 = regression constants determined from the laboratory tests At level 2 the resilient modulus is correlated with other parameters (e.g., California Bearing Ratio (CBR), R-value, AASHTO layer coefficient). At level 3 the resilient modulus can be selected from a range of default values that are typical for the material type and/or soil classification. The input resilient modulus data at all levels are assumed to be at optimum moisture content and density; this value is adjusted by the EICM for seasonal climate variations. There is also an option for direct entry of a best estimate for the seasonally-adjusted unbound resilient modulus, in which case the EICM is bypassed. Poisson’s ratio is also required for the structural response model. It can be determined from laboratory testing, correlations with other properties, or estimated from ranges of typical values. The Atterberg limits, gradation, hydraulic conductivity, maximum dry unit weight, specific gravity, optimum moisture, and degree of saturation are additional unbound material inputs used for determining the effect of seasonal climate variations on resilient modulus. 3.2.3. Pavement Response Models The NCHRP 1-37A procedure utilizes three models to predict pavement structural responses (stresses, strains, and displacements). Multi-Layer Elastic Theory (MLET) and the Finite Element Model (FEM) are used to compute responses due to traffic loading and the Enhanced Integrated Climate Model (EICM) is used to predict temperature and moisture histories throughout the pavement structure. When non-linear behavior of
  • 53. 44 unbound materials is desired–i.e., for level 1 inputs—the FEM is chosen; otherwise the load-related analysis is done with MLET. The load-related structural responses are predicted at critical locations based on maximum damage. The response at each point is evaluated at various depths and afterward the most critical is used to predict pavement distress performance. Figure 3.4 shows in plan view the location of possible critical points for single, tandem, and tridem axles. If a single axle is being analyzed, line Y1 of points is used; if tandem, lines Y2 and Y3; and if tridem, lines Y2, Y3, Y6 and Y7 (NCHRP, 2004). Figure 3.4. Summary of schematics for horizontal location of critical response predictions (NCHRP, 2004) The depths at which the calculations are performed depend on the distress type: • Fatigue cracking o at surface (top-down cracking) o 0.5 inches from the surface (top-down cracking) o at the bottom of the asphalt concrete layer (bottom-up cracking) • Rutting o mid-depth of each layer/sublayer o top of subgrade
  • 54. 45 o 6 inches below the top of subgrade Each pavement layer is divided into thin sublayers so that properties varying in the vertical direction are represented better (e.g., asphalt concrete layer is divided and different dynamic moduli are assigned depending on the temperature in each sublayer). For flexible pavements, the sublayering is determined as follows: • The first 1 inch of asphalt concrete (AC) is divided into two 0.5-inch sublayers. The remaining AC thickness is divided into 1-inch sublayers until 4 inches of total depth from the surface is achieved. The remaining thickness, if there is any, is considered the final AC sublayer. • The unbound base is divided into a + nb sublayers, in which a has half the thickness of b. The number of remaining sublayers is determined by: n=int[(hbase- 2)/4]. Therefore, the total number of sublayers is n+1. This procedure is valid for base thickness exceeding 6 inches. • The subgrade is divided into 3 sublayers of equal thickness until the total depth of the pavement structure reaches 8 feet. From this point on there is no more sublayering and the remaining subgrade is treated as an infinite layer. Multi-layer Linear Elastic Theory The first attempt to calculate displacements due to loading on an elastic half- space, such as the surface of an homogeneous material with infinite area and depth, was made by Kelvin in 1868 (Croney and Croney, 1997). Later, Boussinesq’s solution (1885) for a concentrated load became a fundamental tool to compute stress, strain and deflection. The solution could be integrated to obtain responses due to a general surface
  • 55. 46 load, including a circular loaded area (Huang, 1993). The concept of multi-layer analysis has its roots in the Burmister two-layer and three-layer solutions (Burmister, 1945); charts and tables summarizing these solutions were developed later (Foster and Alvin, 1954; Burmister, 1958; Jones, 1962; Huang, 1969, and 1973). Burmister’s layered theory can be applied to a multi-layer system of linear elastic materials structured on top of a half space subgrade following the basic assumptions (Huang, 1994): • Each layer is homogeneous, isotropic, and linearly elastic, characterized by Young’s modulus of elasticity, E, and Poisson’s ratio, ν. • The material is weightless and horizontally infinite • The thickness of each layer is finite, and the subgrade is considered as infinite layer. • The load is uniformly applied on the surface over a circular area. • Continuity conditions are satisfied at the layer interfaces. In the NCHRP 1-37A procedure, the MLET is implemented in a modified version of the JULEA algorithm (NCHRP, 2004). Using the principle of superposition, single wheels can be combined spatially into multi-wheel axles to simulate different axle configurations. The small set of input parameters required by MLET facilitates its implementation and use. The only inputs required are the layer thicknesses, the elastic properties (Young’s modulus of elasticity and Poisson’s ratio) for each layer, the tire pressure, and the tire contact area. The main disadvantage of MLET is its inability to consider nonlinearities often exhibited by pavement materials.
  • 56. 47 Finite Element Method The Finite Element Method (FEM) allows structural modeling of a multi-layer pavement section having material properties that can vary both vertically and horizontally throughout the profile. It is a versatile tool capable of considering three dimensional geometries, non-linear material behavior, large strain effects, dynamic loading and other features. It is well suitable for structural evaluation and response prediction of pavements. Although its robustness permits solving more complex problems, the longer computational time compared to MLET represents a significant disadvantage. The general idea of finite element technique is the partitioning of the problem into small discrete elements (mesh), formulating an approximation to the stress and strain variations across each individual element, and then applying equilibrium requirements to combine the individual elements to get the formulation for the global problem in terms of a set of simultaneous linear equations. The solution is therefore a piecewise approximation to the true solution. In the NCHRP 1-37A methodology, the FEM was implemented with the following features: • Linearly elastic behavior for asphalt concrete • Nonlinearly elastic behavior (stress-dependent stiffness model) with tension cut-off for unbound materials • Fully bonded, full slip, and intermediate interface conditions between layers The asphalt concrete layer is modeled as a linearly elastic material with stiffness given by the mixture dynamic modulus master curve. The stress dependence of unbound material is expressed by the stiffness model described in section 3.2.2 as:
  • 57. 48 32 1 k a oct k a aR pp pkM ⎟⎟ ⎠ ⎞ ⎜⎜ ⎝ ⎛ ⎟⎟ ⎠ ⎞ ⎜⎜ ⎝ ⎛ = τθ (3.20) in which the parameters are as previously described. The tension cut-off feature is triggered whenever tensile principal stresses are calculated in the unbound layers (the excess tensile stress is distributed over neighboring elements in an iterative process). The load is applied in small increments, and the stress/strain output from each increment provides the initial condition for the next stage (NCHRP, Appendix RR, 2004). EICM Environmental Model EICM is a mechanistic model of one dimensional heat and moisture flow that simulates changes in the behavior and characteristics of pavement and subgrade materials induced by environmental factors (NCHRP, 2004). Daily and seasonal variations of temperature and moisture within the pavement structure are induced by the weather history at the project site. Different material types have different responses to climatic variations. Unbound materials are affected by moisture change and by freeze-thaw cycles during winter and spring seasons. Asphalt concrete responds to temperature variations, which affects directly the dynamic modulus of the mixture. Temperature is also the cause of thermal cracks, either from a single thermal variation or from repetitive cycles of warm/cool temperatures. The EICM consists of three major components (NCHRP, 2004): • The Climatic-Materials-Structural Model (CMS Model) originally developed at the University of Illinois (Dempsey et al., 1985)
  • 58. 49 • The CRREL Frost Heave and Thaw Settlement Model (CRREL Model) originally developed at the United States Army Cold Regions Research and Engineering Laboratory (CRREL) (Guymon et al., 1986) • The Infiltration and Drainage Model (ID Model) originally developed at Texas A&M University (Lytton et al., 1990) In the case of flexible pavements, three major environmental effects are of particular interest: • Temperature variations for the asphalt concrete. The dynamic modulus of asphalt concrete mixtures is very sensitive to temperature. Temperature distributions in asphalt concrete layers are predicted and then used to define the stiffness of the mixture throughout the sublayers. Temperature distributions are also used as inputs for the thermal cracking prediction model. • Moisture variation for subgrade and unbound materials. The resilient modulus input of unbound materials is defined as being at optimum density and moisture content. A correction factor is defined to adjust the resilient modulus based on predicted moisture content. • Freezing and thawing for subgrade and unbound materials. The resilient modulus of unbound materials located within the freezing zone increases during freezing periods and decrease during thawing periods. The EICM predicts the formation of ice lenses and defines the freezing zone.
  • 59. 50 3.2.4. Empirical Performance Models This section presents a description of empirical models for predicting performance of flexible pavements in the NCHRP 1-37A procedure. The models described here are the following: “alligator” or bottom-up fatigue cracking, longitudinal or top down fatigue cracking, thermal cracking, rutting and roughness. The calibration of these models was done using the Long Term Pavement Performance (LTPP) database with sections distributed all over the U.S. This calibration effort is defined in the NCHRP 1-37A methodology as the national calibration. The national calibration was a task undertaken by the NCHRP 1-37A project team to determine calibration coefficients for the empirical distress models that would be representative of the wide range of materials available in the U.S. for pavement construction. The LTPP database was used as primary source of data for this purpose. Permanent deformation, longitudinal (top-down), alligator (bottom-up) and thermal cracking were calibrated for flexible pavement sections. According to the NCHRP 1-37A report, the roughness model was developed directly using the LTPP data and therefore required no additional calibration. The importance of calibration is evident. Pavement structures behave in different ways and the current state-of-the-art mechanistic models are not capable of fully predicting the behavior of pavement structures. The empirical models are not sufficient to stand alone and capture the wide possibilities of failure mechanism. In addition, most of these models were developed from laboratory test data and laboratory-field shifting factors are required.
  • 60. 51 Alligator Fatigue Cracking “Alligator” fatigue cracking develops from mechanical failure caused by tensile strains at the bottom of asphalt concrete layers and once developed propagates upwards. It is also known as bottom-up cracking. Stiffer mixtures or thin layers are more likely to exhibit bottom-up fatigue cracking problems, which makes it a problem often aggravated by cold weather. It is also noted that the supporting layers are important for the development of fatigue cracking. Soft layers placed immediately below the asphalt concrete layer increase the tensile strain magnitude at the bottom of the asphalt concrete and consequently increase the probability of fatigue crack development. Fatigue cracking is evaluated by first predicting damage and then converting damage into cracked area. The model used in the NCHRP 1-37A procedure was adopted from the Asphalt Institute (Asphalt Institute, 1991) and calibrated based on 82 LTPP section data in 24 states across the country (NCHRP, 2004). The number of repetitions to failure for a given load magnitude is computed as follows: ( ) ( )2 2 3 3 1 1 k k f t tN k k C E β β β ε − − ⎡ ⎤= ⎣ ⎦ (3.21) in which: Nf = number of repetitions of a given load to failure kt = thickness correction factor β1, β2, β3 = field calibration coefficients k1, k2, k3 = material properties determined from regression analysis laboratory test data C = laboratory to field adjustment factor εt = tensile strain at the critical location within asphalt concrete layer
  • 61. 52 E = asphalt concrete stiffness at given temperature The calibration of the model using the LTPP database resulted in the following values: k1 = 0.00432, k2 = 3.9492, k3 = 1.281. The βi field calibrations coefficients were assumed to be equal to 1 for this calibration. This set of calibration coefficients is referred to in the NCHRP 1-37A methodology as the national calibration. The thickness correction factor is determined as follows: AC(11.02-3.49*h ) 1 0.003602 0.000398 1 e tk = + + (3.22) in which: hAC = total AC thickness The laboratory-field adjustment factor is given by: 10M C = (3.23a) 4.84 0.69beff a beff V M V V ⎛ ⎞ = −⎜ ⎟⎜ ⎟+⎝ ⎠ (3.23b) in which: Vbeff = effective binder content (% of volume) Va = air voids (%) The damage resulted from a given load is then computed from the number of repetitions using Miner’s Law: 1 T i i fi n D N= = ∑ (3.24) in which: D = damage
  • 62. 53 T = total number of seasonal periods ni = actual traffic for period i Nfi = traffic repetitions of a given load to cause failure at period i The last step is to convert damage into cracked area as follows: ( )( )1 1 2 2 4 ' 'log 100 1 601 C C C C D C FC e + ⋅ ⎛ ⎞ ⎛ ⎞ = ⋅⎜ ⎟ ⎜ ⎟⎜ ⎟ ⎝ ⎠+⎝ ⎠ (3.25a) ( ) 2.856 2 ' 2.40874 39.748 1 ACC h − = − − + (3.25b) ' ' 1 22C C= − (3.25c) in which: FC = “alligator” fatigue cracking (% of lane area) C1, C2, C4 = constants D = damage hAC = total AC thickness The calibration using the LTPP database resulted in the following values for the regression constants: C1 = 1, C2 = 1 and C4 = 6000. Equation (3.25a) is of a convenient sigmoidal form that models the two end-conditions of the damage-cracked area relationship. At 0% damage the percentage of cracked area is equal to zero. At the other end, at 100% damage, an assumption was adopted that only half of the area would be cracked. Therefore when damage is 100%, cracked area is equal to 50% or 3000 ft2 over a 500 ft lane length (the total lane area considered in the NCHRP 1-37A methodology is 12 ft x 500 ft = 6000 ft2 ). The statistics for the “alligator” fatigue cracking model after calibration using 461 observations from the LTPP database standard error (Se) = 6.2%, and Se/Sy = 0.947.
  • 63. 54 Longitudinal Cracking Longitudinal cracking develops at the surface and propagates downward (top- down cracking). Longitudinal crack formation in flexible pavements is conceptually similar to “alligator” fatigue cracking. Tensile strains at the top of the surface asphalt concrete layer induced by traffic loading cause the appearance of cracks. The NCHRP 1-37A model for longitudinal cracking follows the same formulation as for alligator cracking. The difference is in the damage-crack relationship. Equation (3.21) is used to calculate the number of applications to failure for a given load. Damage is computed using Miner’s Law, Equation (3.24). Cracking, in units of foot/mile, is then given by: ( )( )1 2 4 log 100 10.56 1 C C D C FC e − ⋅ ⋅ ⎛ ⎞ = ⋅⎜ ⎟ +⎝ ⎠ (3.26) in which: FC = longitudinal cracking (foot/mile) C1, C2, C4 = calibration coefficients D = damage The calibration using the LTPP database resulted in the following values for the regression constants: C1 = 7, C2 = 3.5 and C4 = 1000. The sigmoidal form model was used to model the damage-crack length relationship. The two end-conditions are satisfied. At 0% damage the model predicts no cracking, and at 100% damage, 500 ft of longitudinal cracking per 500 ft of pavement (assumed only 50% of the lane with cracks on both wheel paths: 2 x 250 ft). The statistics for the longitudinal cracking calibration based on 414 field measurements are Se = 1242.25 feet/mile and Se/Sy = 0.977.
  • 64. 55 Thermal Cracking Thermal cracking is a consequence of heating/cooling cycles occurring in the asphalt concrete. The pavement surface cools down faster and with more intensity than the core of the pavement structure, which causes thermal cracking to occur at the surface of flexible pavements. Thermal cracks extend in the transverse direction across the full width of the pavement. The thermal cracking model used in the NCHRP 1-37A procedure is an enhanced version of the TCMODEL developed under the SHRP A-005 research contract. This model has a robust theoretical background and is the most fully mechanistic of the distress prediction components in the NCHRP 1-37A procedure. The main improvement from the SHRP A-005 model was the incorporation of an advanced analysis technique to convert data directly from the Superpave Indirect Tensile Test into viscoelastic properties, specifically the creep compliance function that is further converted to the relaxation modulus. The relaxation modulus is coupled with the temperature data from the EICM to predict thermal stresses. The growth behavior of the thermal crack is calculated from the thermal stresses. The crack propagation is computed using Paris’s law: n C A KΔ = ⋅Δ (3.27) in which: ΔC = change in crack depth for each thermal cycle ΔK = change in stress intensity factor during thermal cycle A, n = fracture parameters for the asphalt concrete mixture The master creep compliance function is expressed as a power law: