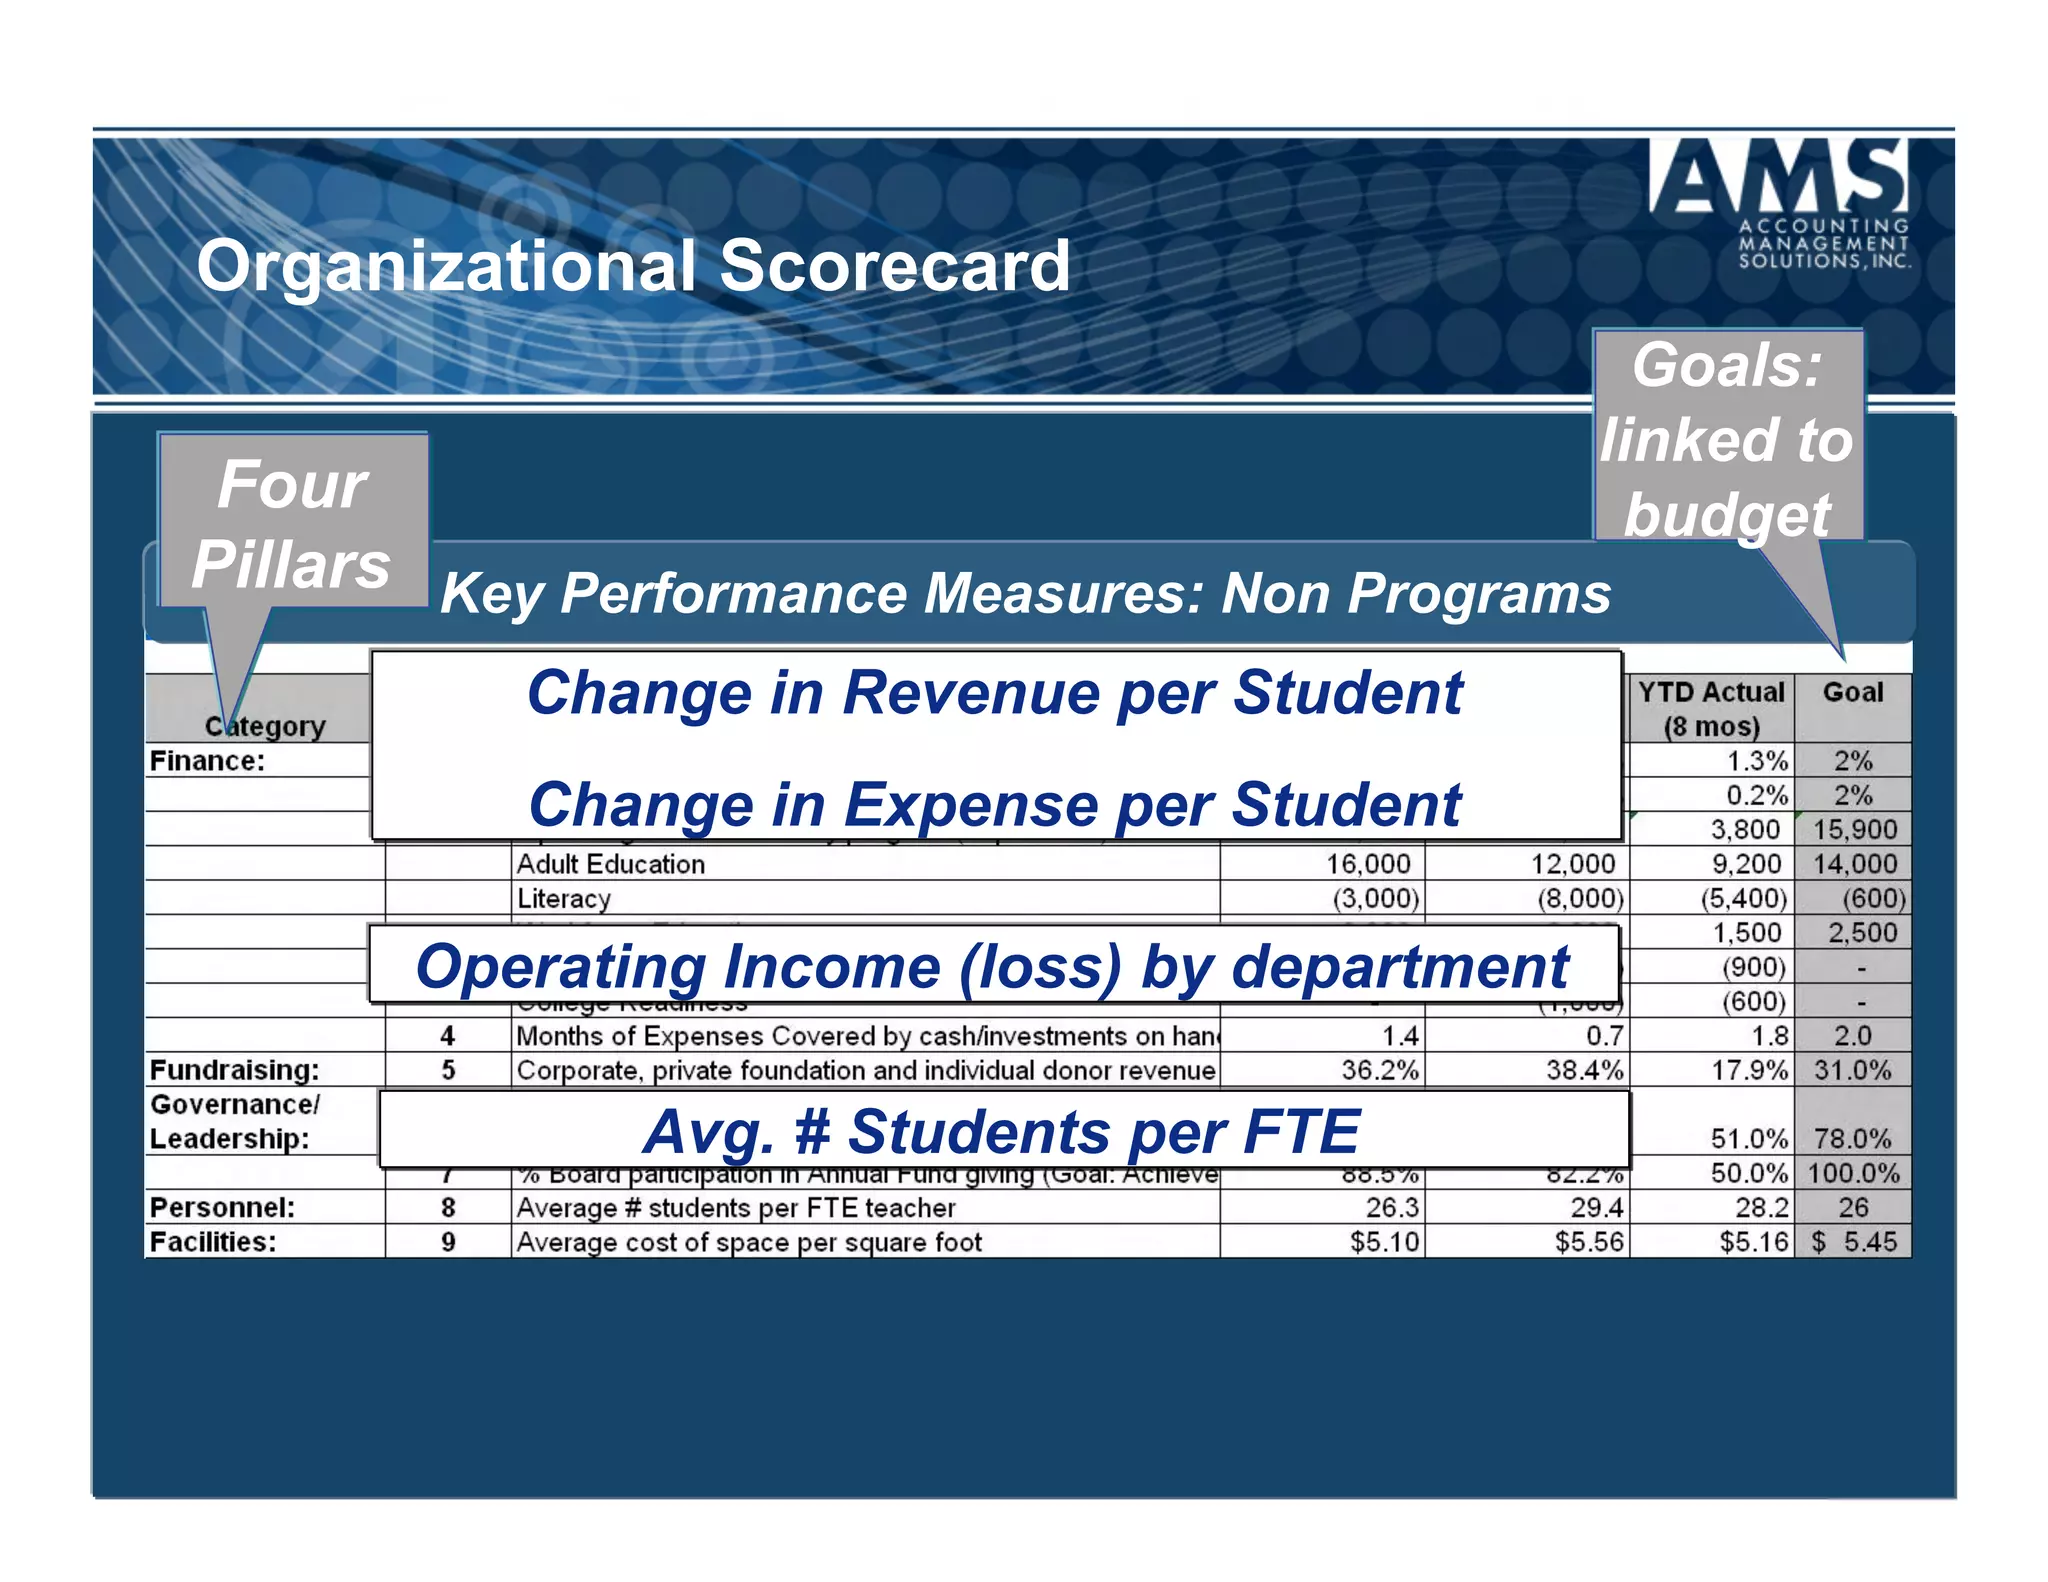
Measuring Performance: Linking Money to Mission
                 Rebeka Mazzone, CPA
         Accounting Management Solutions, Inc.
                  www.amsolutions.net
                         June 23, 2010

                 Use Twitter Hashtag #npweb

               Special Thanks To Our Sponsors
Helping ordinary people raise extraordinary amounts for nonprofits is all we do, and we love it.


                     A Proud Sponsor of NonprofitWebinars.com
Measuring Performance: Linking Money to Mission
                                   Rebeka Mazzone
              Accounting Management Solutions, Inc.
                                      June 30, 2010
About Us


           •  For more than a decade,
              Accounting Management
              Solutions, (AMS) has provided
              accounting support and financial
              management leadership at the
              consulting CFO, controller and
              accounting manager level to
              dynamic companies throughout
              the Northeast.
Objectives


•  Discuss why scorecards
   are important
•  Learn how scorecards are
   used as a form of measure
•  Understand the differences
   between scorecards, KPIs,
   dashboards, benchmarks
•  Getting started
Characteristics of Effective Financial
Reporting


•  No surprises for management –
   paralyzed by indecision
•  Link to strategic plan
•  Plan linked to budget
•  Measures: Key Performance
   Indicators (KPI) based on strategy
•  Easy to understand
•  Meaningful information
What do reports tell us?


•  Strategic plan – Where do we want to go?

•  Budget – How do we plan to get there?

•  Statement of Activity – How did we do?

•  Statement of Position – Where are we now?

•  Statement of Cash Flow – How did we
   use our money?

•  Cash Flow Projection – Do we have
   enough to get us there?
Understanding the Financial Condition


•  Reports should be designed for the audience.
•  There are 4 levels of reporting:
   1.  Transaction Detail – Finance Department/Department
       Managers
   2.  Detailed Financial – Finance Department/Department
       Managers
   3.  Management Financial Summary – Exec. Director/Finance
       Committee
   4.  Board Financial Summary – Full Board


Too much detail prevents users from focusing
      on the risks and opportunities.
Benefits of Scorecards


•  Power to capture relationship between financial and
   non-financial data
•  Ability to predict and manage future outcomes
•  Effectively present financial data to non-financial
   people
•  Drive strategic objectives throughout organization
   down to individuals
•  Align business activities
Example: Revenue and Expense
Example: Revenue and Expense Per Student
EXAMPLE: Organizational Scorecard


      Key Performance Measures: Non Programs
Going to School on Performance


•  Balanced Scorecards =
   Grade Point Average

•  Dashboards = Report card

•  KPIs = Class grade

•  Benchmarks = Class rank
Inputs & Outcomes
Getting Started

GETTING STARTED
Create a Cross-functional Team


•  Project Champion
   •  Clear leadership to drive vision

•  Core Leadership Group
   •  Assess core processes
      and programs

•  Limit team size
•  Team orientation
•  Requires long term commitment
Understand Your
Audience

                    •  Who will be using
                       the scorecards?
                    •  What impact do scorecards
                       have on resource allocation
                       and program decisions?
                    •  What is the key information
                       they need to understand to
                       make strategic decisions?

Achieving strategic goals is the priority
Create Buy-in and Ownership


•  Top leadership support

•  Cross functional /
   representative teams

•  Keep an open dialogue
   during planning stage

•  Keep the process
   transparent
Enterprise Performance Management
System (EPMS)

VISION /                                  Board &
                                          Executive
MISSION
                                          Director
             Organizational Scorecard


                                          Executive
                                          Director &
                                          Departments
                Departmental Scorecards


                                          Departments
                                          & Individuals
                         360 Review
Starting Point


1.  Examine mission
    and strategic plan
2.  Set goals tied to your
    mission
   •    Short-term
   •    Long-term

3.  Remember:
    Change takes time
What is the Goal?

 •  Organization-wide scorecard
    •  Used to drive strategic plan objectives

 •  Departmental scorecards
    •  Informed by Organization-wide scorecard
    •  Is generally division-specific (e.g. responsibilities and measures
       are unique to each department)

 •  Individual Performance Reviews
    •  Align individual performance to organizational goals


  “Measures start with a top down approach, but
ultimately some will rise up from individual plans”
Strategic Goals & Objectives
Deciding What to Measure


•  Mission and program
   effectiveness
•  Anticipated growth
•  Benchmarking / peer
   comparison
•  Major financial statement
   line items and ratios
•  Consider the relationship
   between money and
   people
Deciding What to Measure:
 External Drivers

•  Legal & compliance              •  Facilities
•  Public perception                   •  Remaining life
   •  Going green/sustainability       •  Capacity
   •  Safety                           •  Square foot per student
   •  IT                               •  Consumer satisfaction
•  Competition                         •  Cost per square foot
                                          (maintenance, utilities)
Deciding What to Measure:
Four Pillars

•  Financial measures – create      •  Operational Capacity
   value
                                       •  % time building /
   •  Profitability by program            classrooms occupied
   •  Ability to meet obligations
                                    •  Consumer satisfaction
   •  Budget success                   (Individuals/donors/
•  Human Capital                       grantors)
   •  Staff/Consumer Ratio             •  Retention
   •  Staff cost per individual        •  Completion Rates
      served
                                       •  Cost of success rates (link
   •  Quality of programs/
                                          $ to outcomes)
      education
   •  Diversity ratios
List and Prioritize – Critical


         HIGH


  Value to
Institution
& Mission            No Value to
                     Mission or
                     Customers


         LOW
                            Value to   HIGH

                          Customers
Strategic Objectives: Example


Mission:
     To assist low-income adults in realizing their full
     potential through literacy, employment, advocacy and
     community involvement.
Strategic Objectives:
•    Enhance the delivery of services by building       on
     the diversity of student strengths.
•    Expand the scope and array of our
     educational services.
•    Expand the base of our advocacy in the state      and
     community for adult basic education.
Strategic Drivers: Example


                  •  Increase service area by 10% over the
                     next 3 years
                  •  Enhance the Organization's admissions
                     and marketing efforts
                  •  Expand the “family service” continuum
                     to better support parents.
                  •  Establish operating reserves
                  •  Determine the effectiveness of our
                     programs and services through
                     evaluations and outcomes studies.
Organizational Scorecard


         Key Performance Measures: Programs

 Individual
 Programs
                  Quantity


                  Quality
Organizational Scorecard
                                                 Goals:
                                               linked to
 Four                                           budget
Pillars Key Performance Measures: Non Programs
          Change in Revenue per Student
          Change in Expense per Student

       Operating Income (loss) by department

              Avg. # Students per FTE
360 Performance Review

               360 Leadership Assessment
What should measures look like?
Key Performance Indicators (KPIs)
Scorecard Example


          Exceed Goal   Moderate

          Goal          Risk
Key Performance Indicators


•  KPIs can be both quantitative and qualitative

•  Cannot simply be the money
   •  Programmatic outcomes are the mission

   •  Finance is the backbone

•  Need to trend over time
Key Performance Indicators (cont’d)


•  KPI Review Cycle
   •  Annual scorecard
   •  Quarterly scorecard

•  K.I.S.S.
   •  Simple to operate
   •  Simple to understand
   •  Simple call to action
Review Data For…


                   •  Reliability
                   •  Accessibility / availability
                   •  Accuracy

                   •  Timeliness – past is used
                      to set future goals
                   •  Communicability – Does
                      your audience understand
                      it?
Challenges

             •  Year One:
                 •  Benchmark year
                 •  Lots of information not available
                 •  Goal – prioritize and focus

             •  Year Two:
                 •  Measurement tools in place
                 •  Review measures

             •  Ongoing: Reassessment

             Some measures might not be available
               each year
Keys to Success


                  •  A strategic plan and
                     leadership support
                  •  Clearly defined goals &
                     organizational priorities
                  •  Transparency across the
                     organization
Benefits

Do You See Any Benefits?
  •  Easier to understand – 1 hour Board meeting
  •  People outside of finance can now understand
  •  Ties money to outcomes to measure effectiveness
  •  Ability to monitor outcomes over time
  •  Monitor opportunities for
     improvement
  •  Better ability to
     communicate value
Cautions!


            •  Visions must be aligned
            •  Independent of any one
               department
            •  Sustained effort
            •  Start small
            •  Project manager vs. project
               champion
            •  Consistent measures/valid
               data
Next Steps


•  Measure key executive performance

•  Each department/division to implement

•  Share this with staff; help drive
 goals and measures

•  Data warehouse – move from Excel
 to database
For More Information


                       •  Rebeka J. Mazzone
                        CPA, Director Rhode Island Region
                        Accounting Management Solutions, Inc.
                        rmazzone@amsolutions.net


                       To keep current on this and
                        other topics, register for our
                        free newsletter at:
Find the listings for our current season of webinars
                    and register at

            NonprofitWebinars.com

                     Chris Dumas
              Chris@NonprofitWebinars.com
                     707-812-1234


    Special Thanks To Our Sponsors

Measuring Performance: Linking Money To Mission

  • 1.
    Measuring Performance: LinkingMoney to Mission Rebeka Mazzone, CPA Accounting Management Solutions, Inc. www.amsolutions.net June 23, 2010 Use Twitter Hashtag #npweb Special Thanks To Our Sponsors
  • 2.
    Helping ordinary peopleraise extraordinary amounts for nonprofits is all we do, and we love it. A Proud Sponsor of NonprofitWebinars.com
  • 3.
    Measuring Performance: LinkingMoney to Mission Rebeka Mazzone Accounting Management Solutions, Inc. June 30, 2010
  • 4.
    About Us •  For more than a decade, Accounting Management Solutions, (AMS) has provided accounting support and financial management leadership at the consulting CFO, controller and accounting manager level to dynamic companies throughout the Northeast.
  • 5.
    Objectives •  Discuss whyscorecards are important •  Learn how scorecards are used as a form of measure •  Understand the differences between scorecards, KPIs, dashboards, benchmarks •  Getting started
  • 6.
    Characteristics of EffectiveFinancial Reporting •  No surprises for management – paralyzed by indecision •  Link to strategic plan •  Plan linked to budget •  Measures: Key Performance Indicators (KPI) based on strategy •  Easy to understand •  Meaningful information
  • 7.
    What do reportstell us? •  Strategic plan – Where do we want to go? •  Budget – How do we plan to get there? •  Statement of Activity – How did we do? •  Statement of Position – Where are we now? •  Statement of Cash Flow – How did we use our money? •  Cash Flow Projection – Do we have enough to get us there?
  • 8.
    Understanding the FinancialCondition •  Reports should be designed for the audience. •  There are 4 levels of reporting: 1.  Transaction Detail – Finance Department/Department Managers 2.  Detailed Financial – Finance Department/Department Managers 3.  Management Financial Summary – Exec. Director/Finance Committee 4.  Board Financial Summary – Full Board Too much detail prevents users from focusing on the risks and opportunities.
  • 9.
    Benefits of Scorecards • Power to capture relationship between financial and non-financial data •  Ability to predict and manage future outcomes •  Effectively present financial data to non-financial people •  Drive strategic objectives throughout organization down to individuals •  Align business activities
  • 10.
  • 11.
    Example: Revenue andExpense Per Student
  • 12.
    Example: Revenue andExpense Per Student
  • 13.
    Example: Revenue andExpense Per Student
  • 14.
    EXAMPLE: Organizational Scorecard Key Performance Measures: Non Programs
  • 15.
    Going to Schoolon Performance •  Balanced Scorecards = Grade Point Average •  Dashboards = Report card •  KPIs = Class grade •  Benchmarks = Class rank
  • 16.
  • 17.
  • 18.
    Create a Cross-functionalTeam •  Project Champion •  Clear leadership to drive vision •  Core Leadership Group •  Assess core processes and programs •  Limit team size •  Team orientation •  Requires long term commitment
  • 19.
    Understand Your Audience •  Who will be using the scorecards? •  What impact do scorecards have on resource allocation and program decisions? •  What is the key information they need to understand to make strategic decisions? Achieving strategic goals is the priority
  • 20.
    Create Buy-in andOwnership •  Top leadership support •  Cross functional / representative teams •  Keep an open dialogue during planning stage •  Keep the process transparent
  • 21.
    Enterprise Performance Management System(EPMS) VISION / Board & Executive MISSION Director Organizational Scorecard Executive Director & Departments Departmental Scorecards Departments & Individuals 360 Review
  • 22.
    Starting Point 1.  Examinemission and strategic plan 2.  Set goals tied to your mission •  Short-term •  Long-term 3.  Remember: Change takes time
  • 23.
    What is theGoal? •  Organization-wide scorecard •  Used to drive strategic plan objectives •  Departmental scorecards •  Informed by Organization-wide scorecard •  Is generally division-specific (e.g. responsibilities and measures are unique to each department) •  Individual Performance Reviews •  Align individual performance to organizational goals “Measures start with a top down approach, but ultimately some will rise up from individual plans”
  • 24.
  • 25.
    Deciding What toMeasure •  Mission and program effectiveness •  Anticipated growth •  Benchmarking / peer comparison •  Major financial statement line items and ratios •  Consider the relationship between money and people
  • 26.
    Deciding What toMeasure: External Drivers •  Legal & compliance •  Facilities •  Public perception •  Remaining life •  Going green/sustainability •  Capacity •  Safety •  Square foot per student •  IT •  Consumer satisfaction •  Competition •  Cost per square foot (maintenance, utilities)
  • 27.
    Deciding What toMeasure: Four Pillars •  Financial measures – create •  Operational Capacity value •  % time building / •  Profitability by program classrooms occupied •  Ability to meet obligations •  Consumer satisfaction •  Budget success (Individuals/donors/ •  Human Capital grantors) •  Staff/Consumer Ratio •  Retention •  Staff cost per individual •  Completion Rates served •  Cost of success rates (link •  Quality of programs/ $ to outcomes) education •  Diversity ratios
  • 28.
    List and Prioritize– Critical HIGH Value to Institution & Mission No Value to Mission or Customers LOW Value to HIGH Customers
  • 29.
    Strategic Objectives: Example Mission: To assist low-income adults in realizing their full potential through literacy, employment, advocacy and community involvement. Strategic Objectives: •  Enhance the delivery of services by building on the diversity of student strengths. •  Expand the scope and array of our educational services. •  Expand the base of our advocacy in the state and community for adult basic education.
  • 30.
    Strategic Drivers: Example •  Increase service area by 10% over the next 3 years •  Enhance the Organization's admissions and marketing efforts •  Expand the “family service” continuum to better support parents. •  Establish operating reserves •  Determine the effectiveness of our programs and services through evaluations and outcomes studies.
  • 31.
    Organizational Scorecard Key Performance Measures: Programs Individual Programs Quantity Quality
  • 32.
    Organizational Scorecard Goals: linked to Four budget Pillars Key Performance Measures: Non Programs Change in Revenue per Student Change in Expense per Student Operating Income (loss) by department Avg. # Students per FTE
  • 33.
    360 Performance Review 360 Leadership Assessment
  • 34.
  • 35.
  • 36.
    Scorecard Example Exceed Goal Moderate Goal Risk
  • 37.
    Key Performance Indicators • KPIs can be both quantitative and qualitative •  Cannot simply be the money •  Programmatic outcomes are the mission •  Finance is the backbone •  Need to trend over time
  • 38.
    Key Performance Indicators(cont’d) •  KPI Review Cycle •  Annual scorecard •  Quarterly scorecard •  K.I.S.S. •  Simple to operate •  Simple to understand •  Simple call to action
  • 39.
    Review Data For… •  Reliability •  Accessibility / availability •  Accuracy •  Timeliness – past is used to set future goals •  Communicability – Does your audience understand it?
  • 40.
    Challenges •  Year One: •  Benchmark year •  Lots of information not available •  Goal – prioritize and focus •  Year Two: •  Measurement tools in place •  Review measures •  Ongoing: Reassessment Some measures might not be available each year
  • 41.
    Keys to Success •  A strategic plan and leadership support •  Clearly defined goals & organizational priorities •  Transparency across the organization
  • 42.
    Benefits Do You SeeAny Benefits? •  Easier to understand – 1 hour Board meeting •  People outside of finance can now understand •  Ties money to outcomes to measure effectiveness •  Ability to monitor outcomes over time •  Monitor opportunities for improvement •  Better ability to communicate value
  • 43.
    Cautions! •  Visions must be aligned •  Independent of any one department •  Sustained effort •  Start small •  Project manager vs. project champion •  Consistent measures/valid data
  • 44.
    Next Steps •  Measurekey executive performance •  Each department/division to implement •  Share this with staff; help drive goals and measures •  Data warehouse – move from Excel to database
  • 45.
    For More Information •  Rebeka J. Mazzone CPA, Director Rhode Island Region Accounting Management Solutions, Inc. rmazzone@amsolutions.net To keep current on this and other topics, register for our free newsletter at:
  • 46.
    Find the listingsfor our current season of webinars and register at NonprofitWebinars.com Chris Dumas Chris@NonprofitWebinars.com 707-812-1234 Special Thanks To Our Sponsors