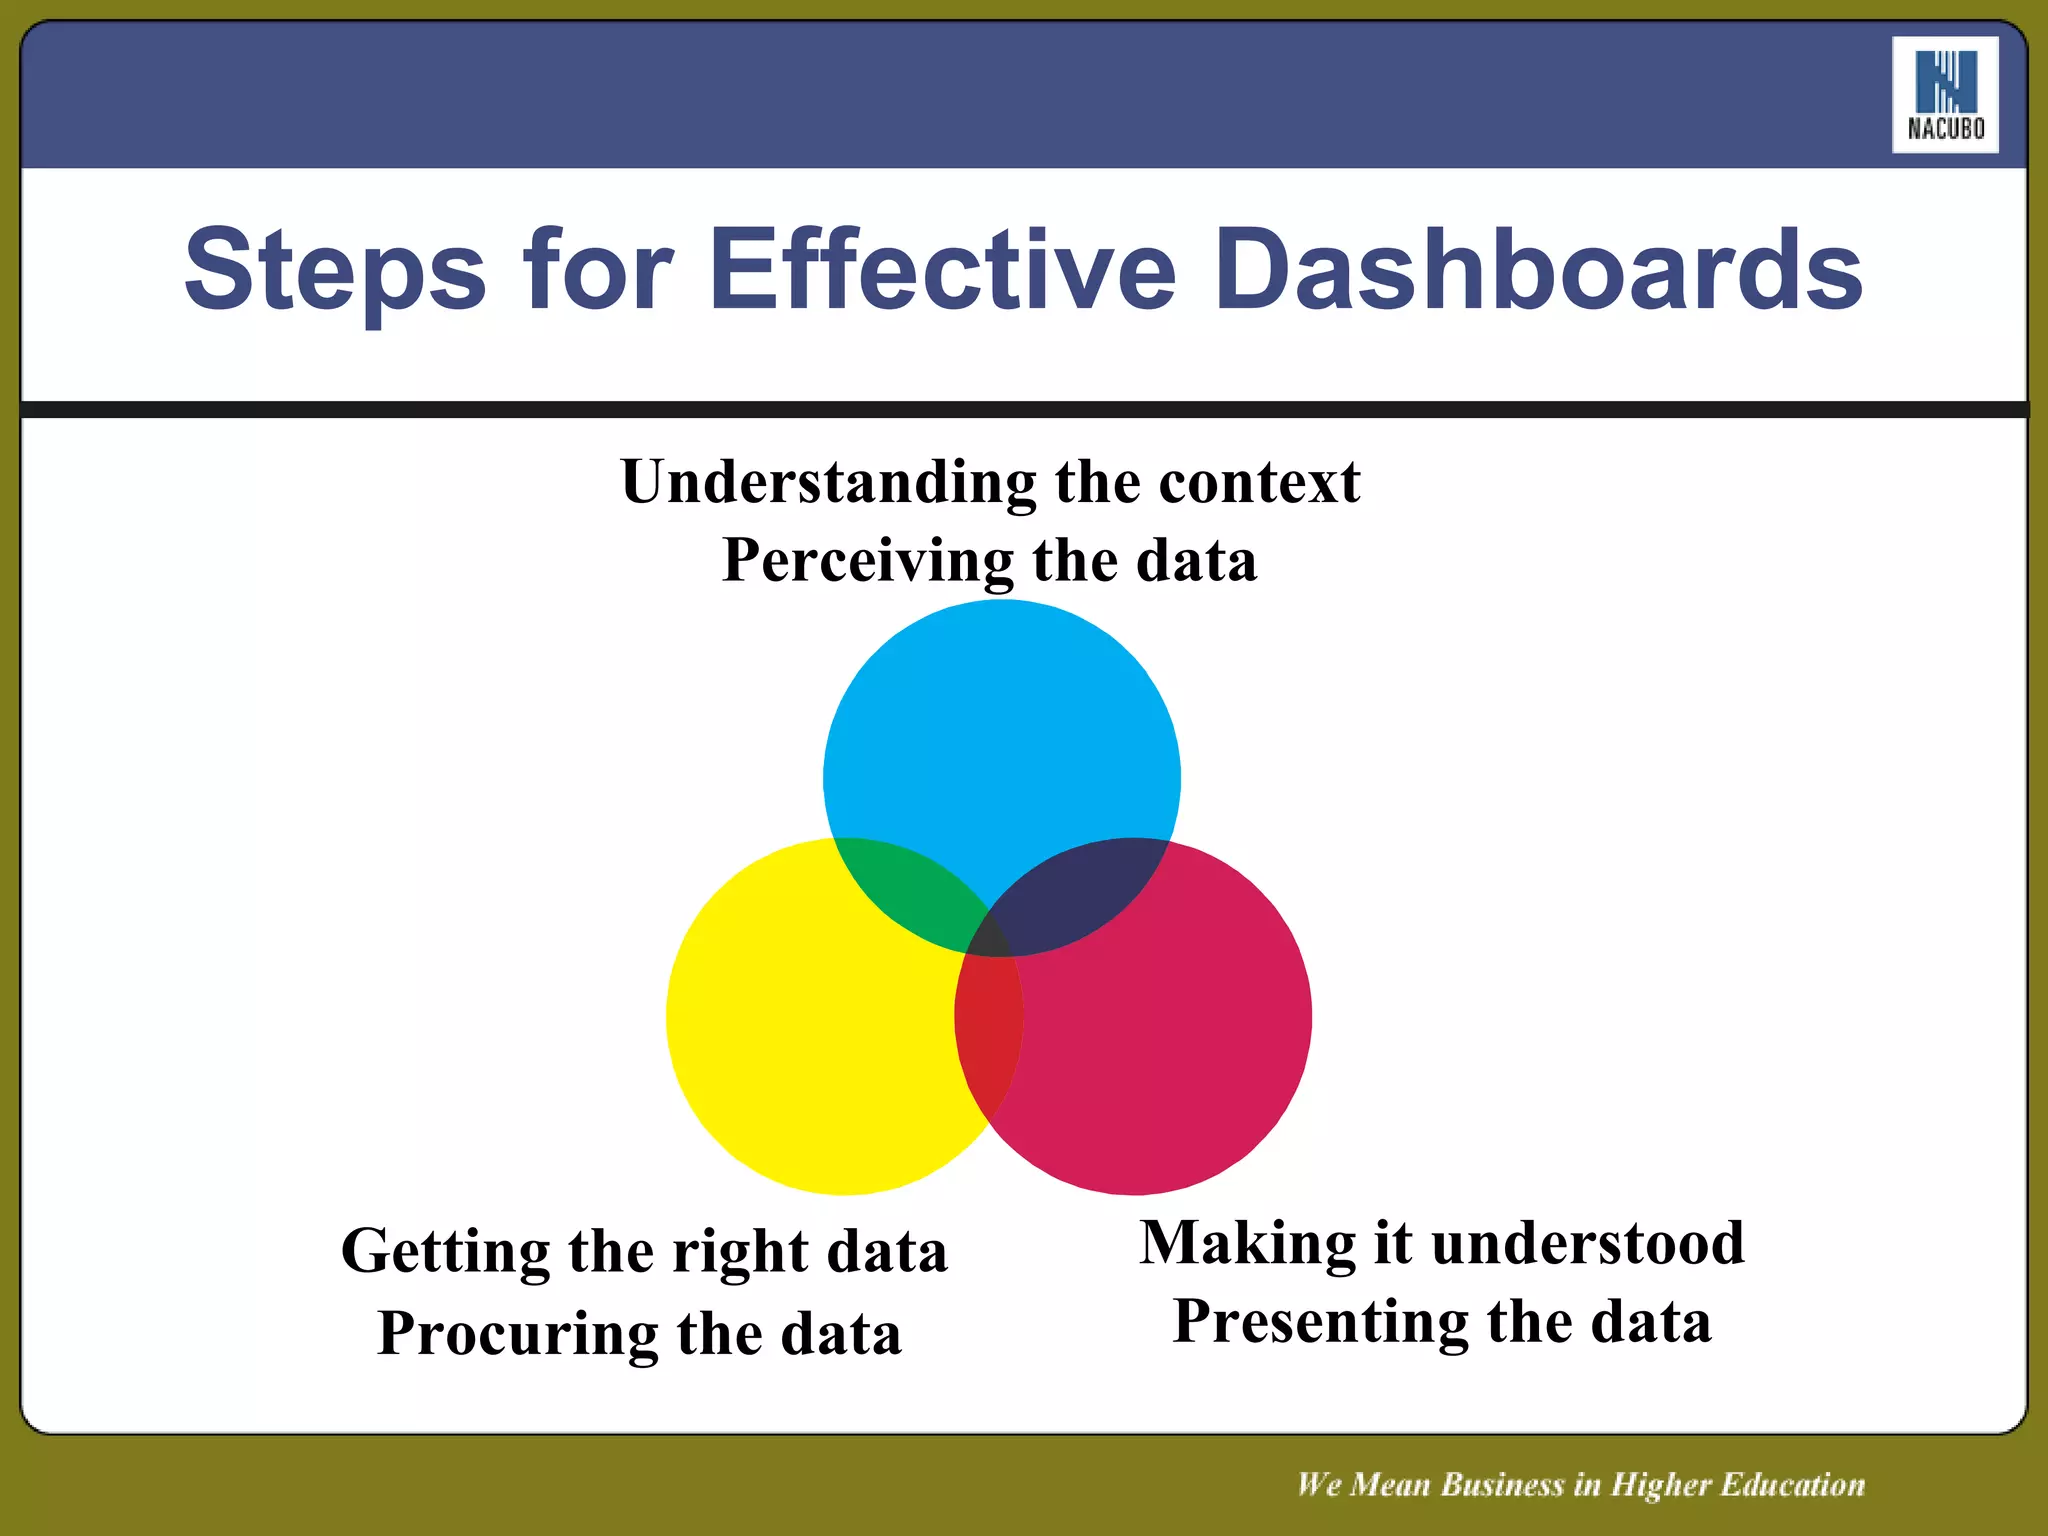
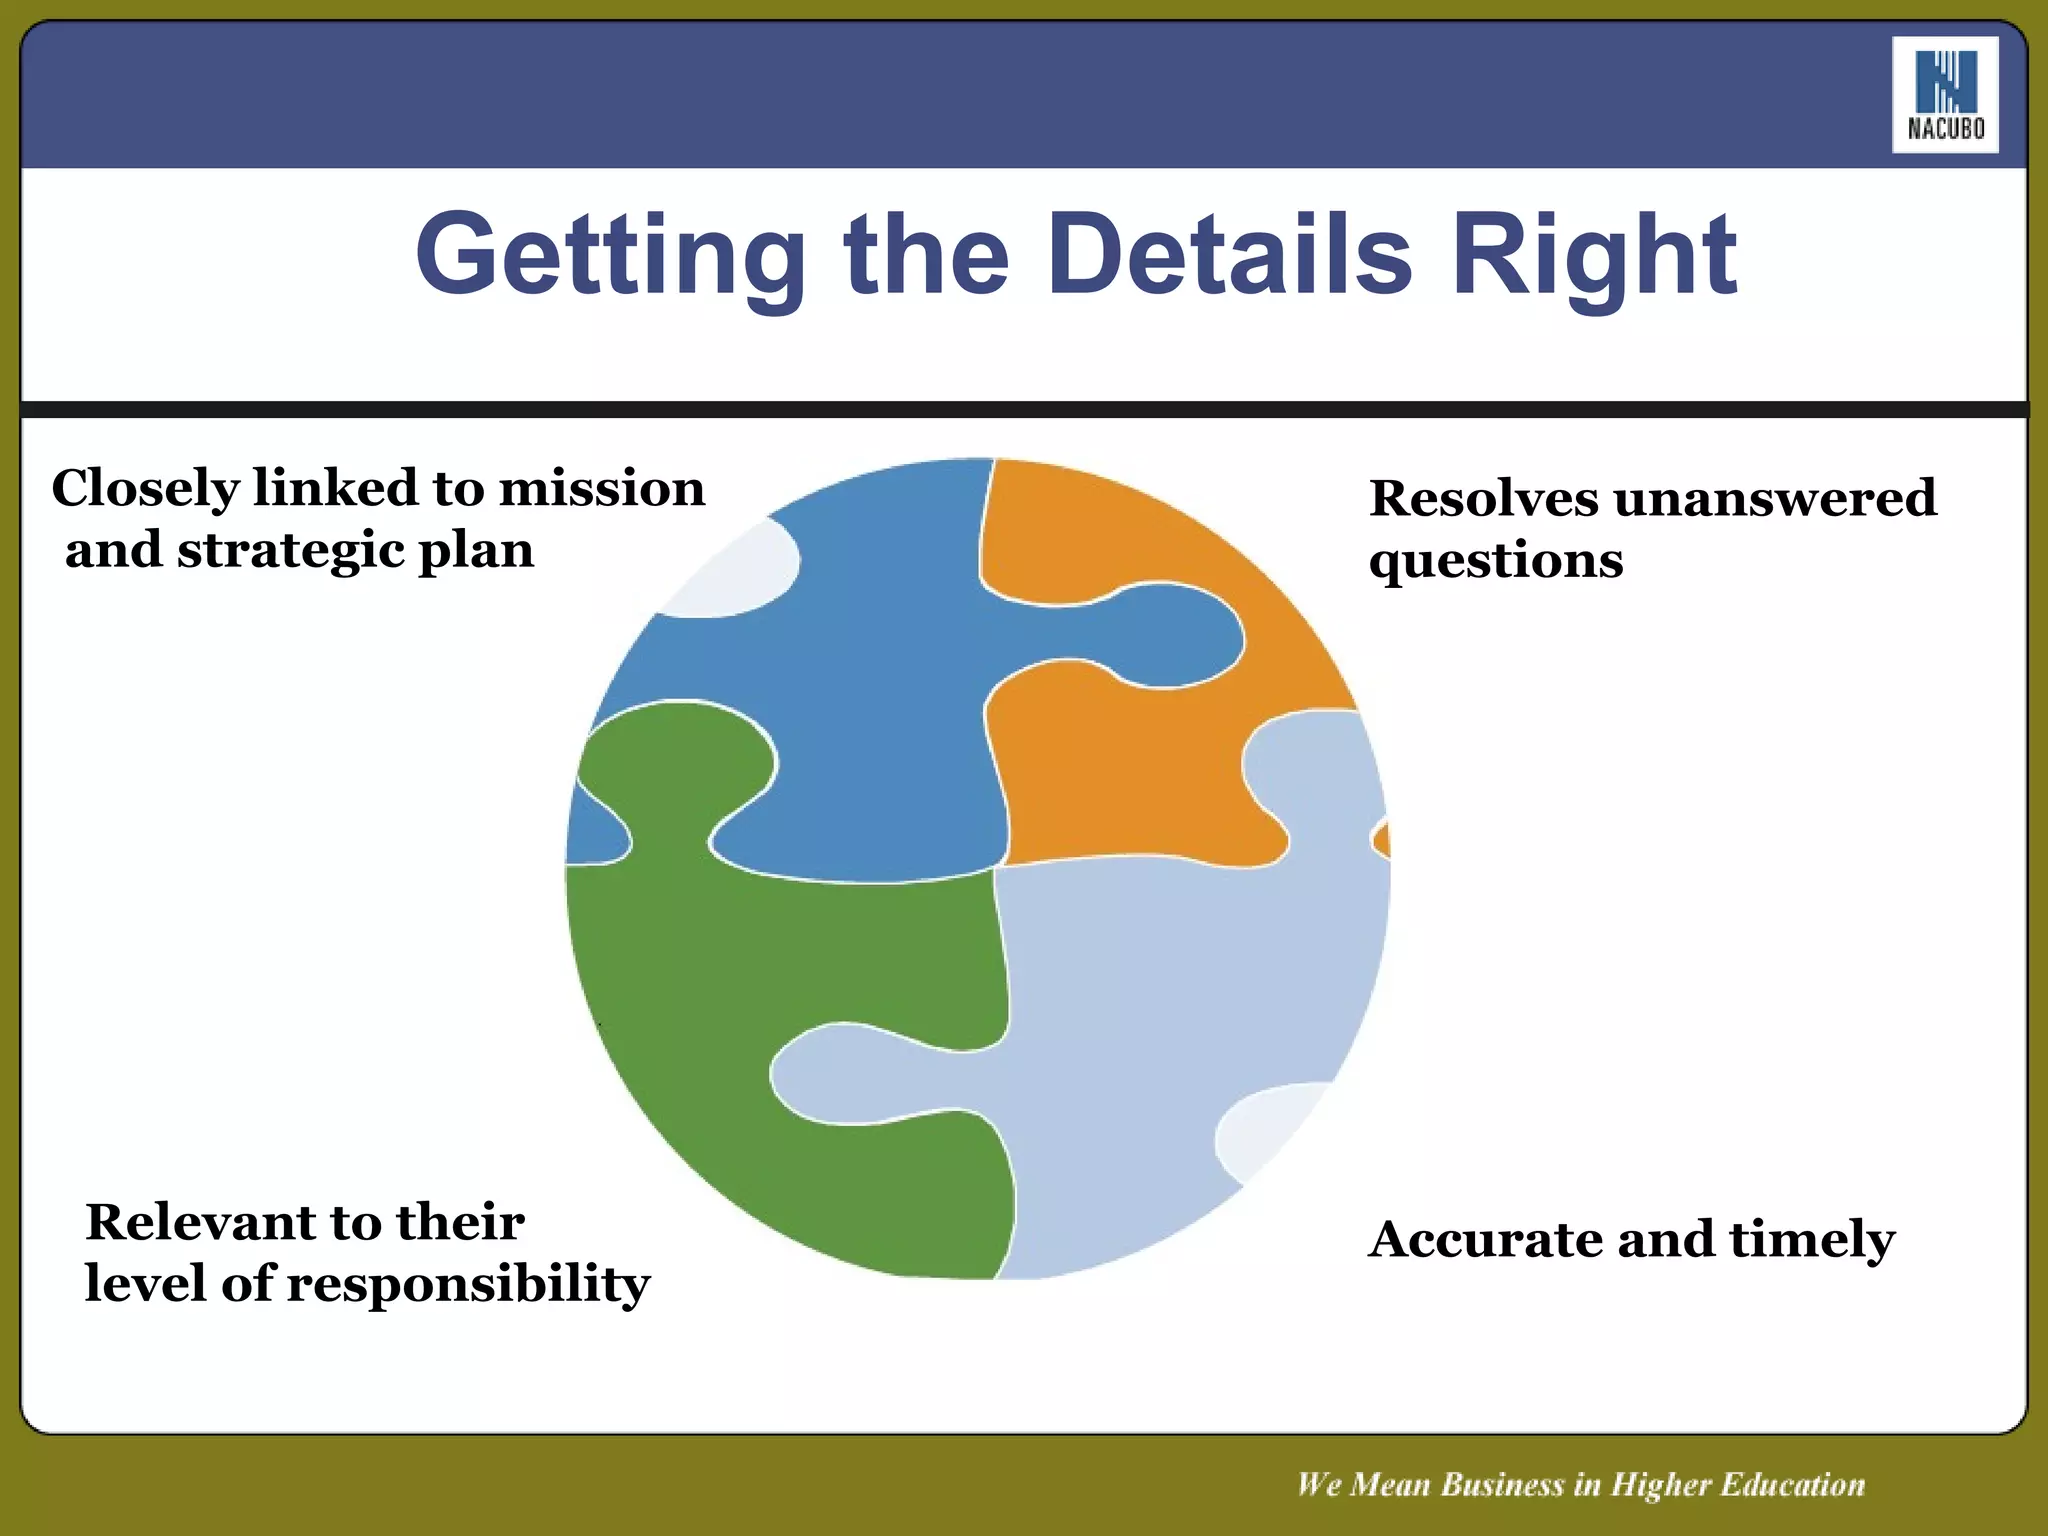
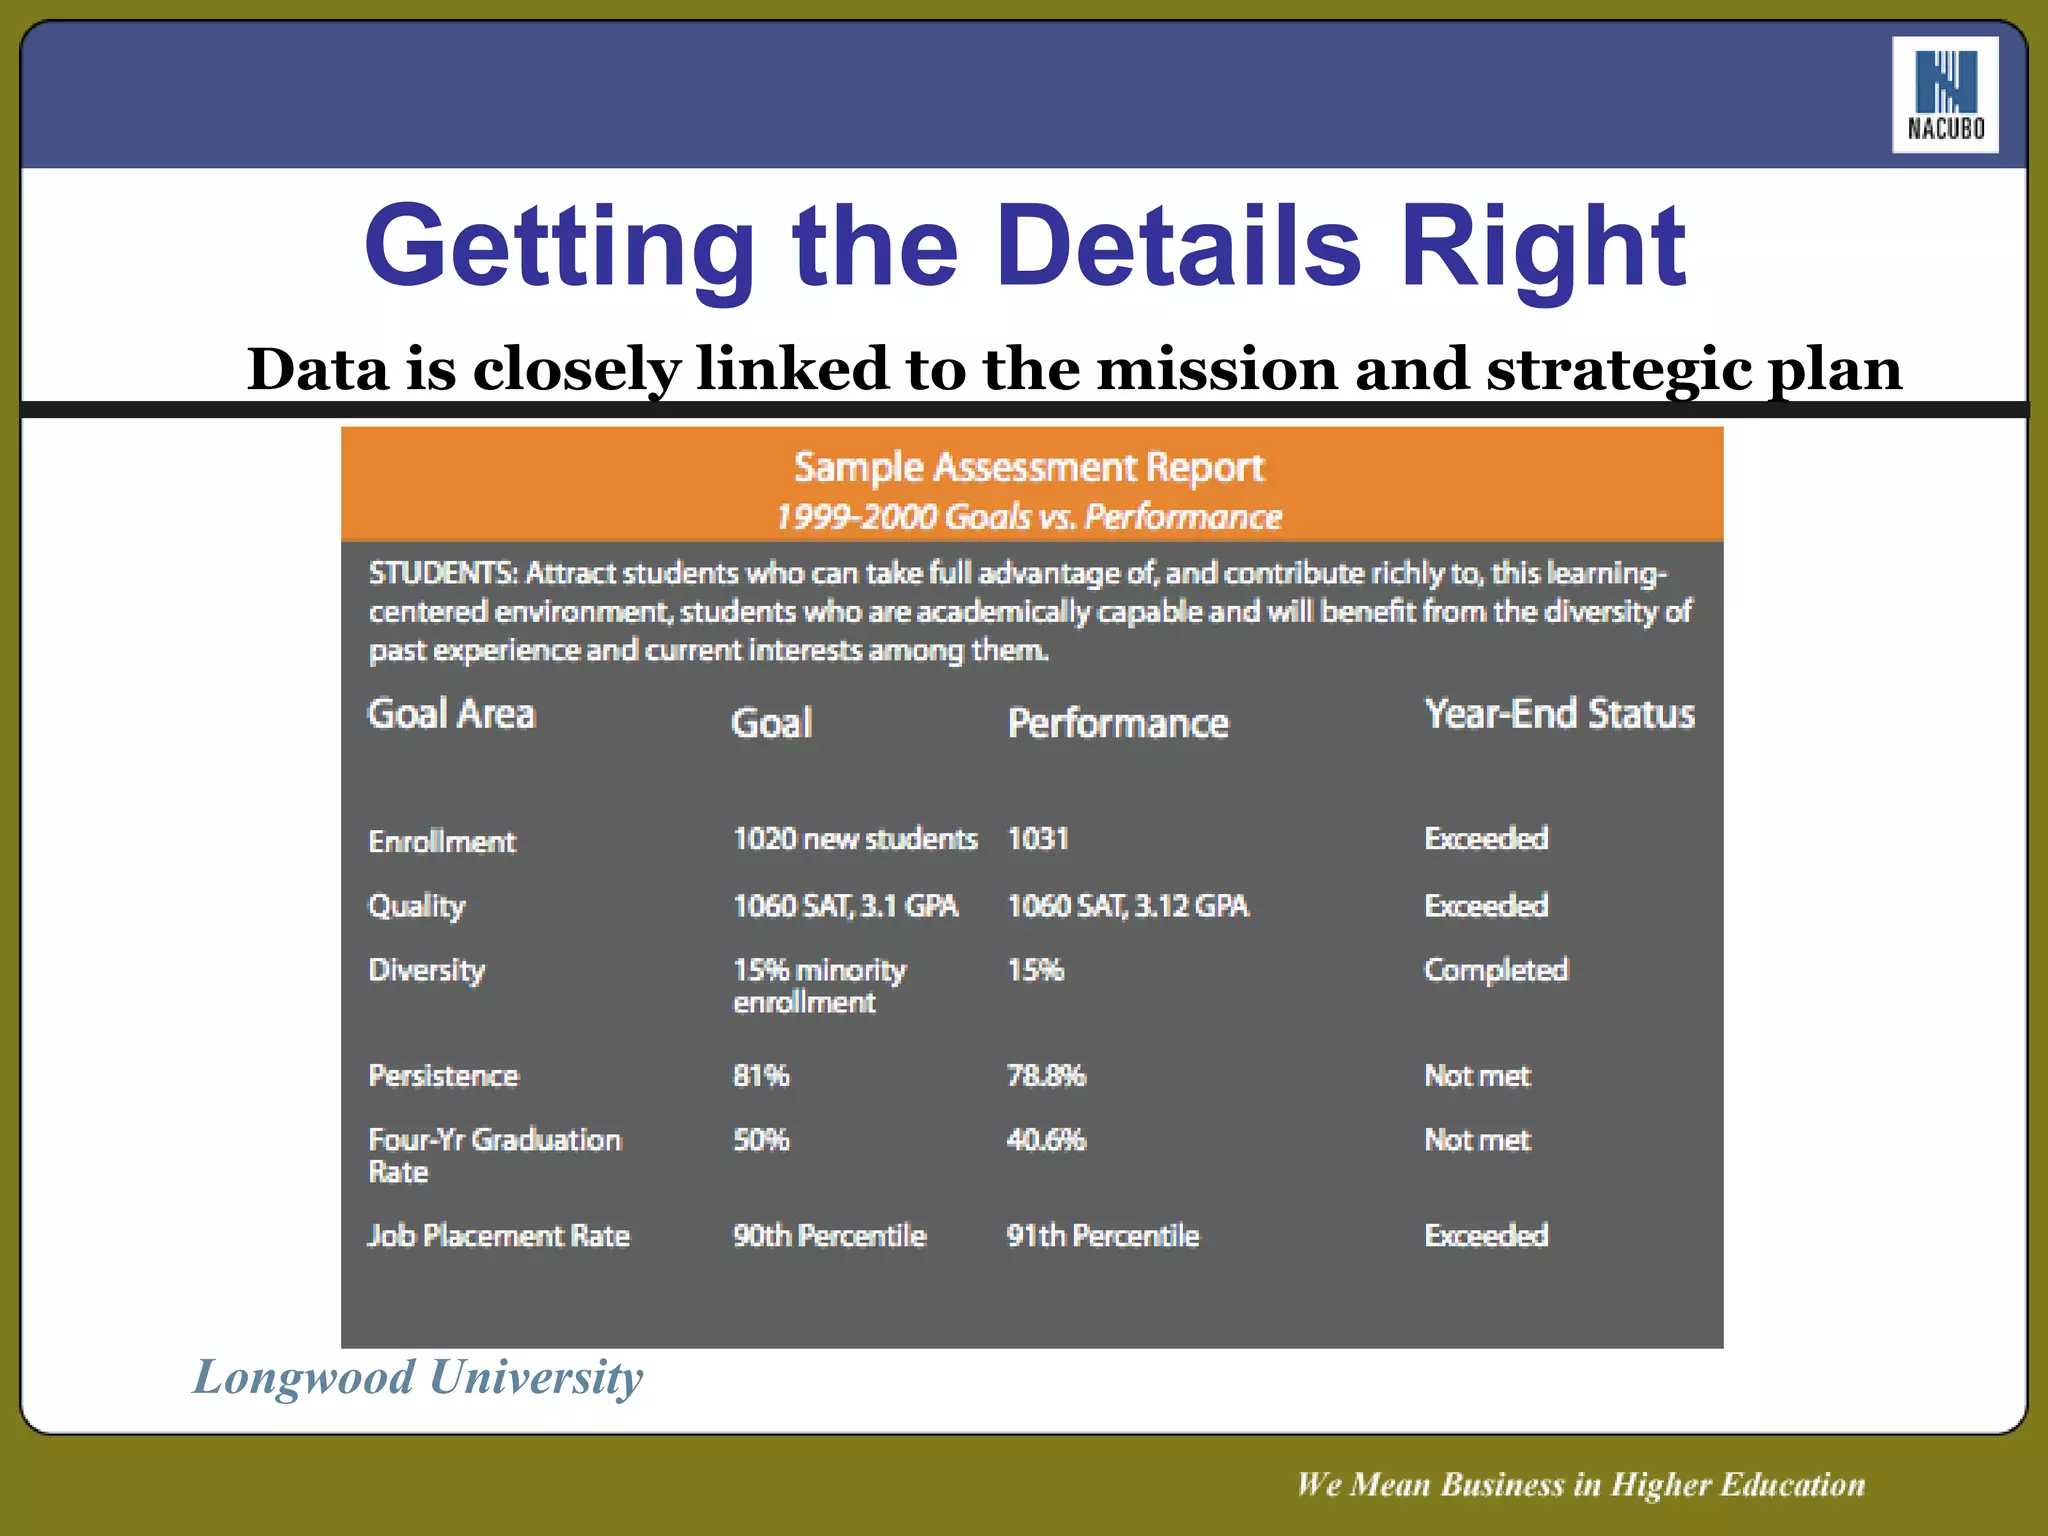
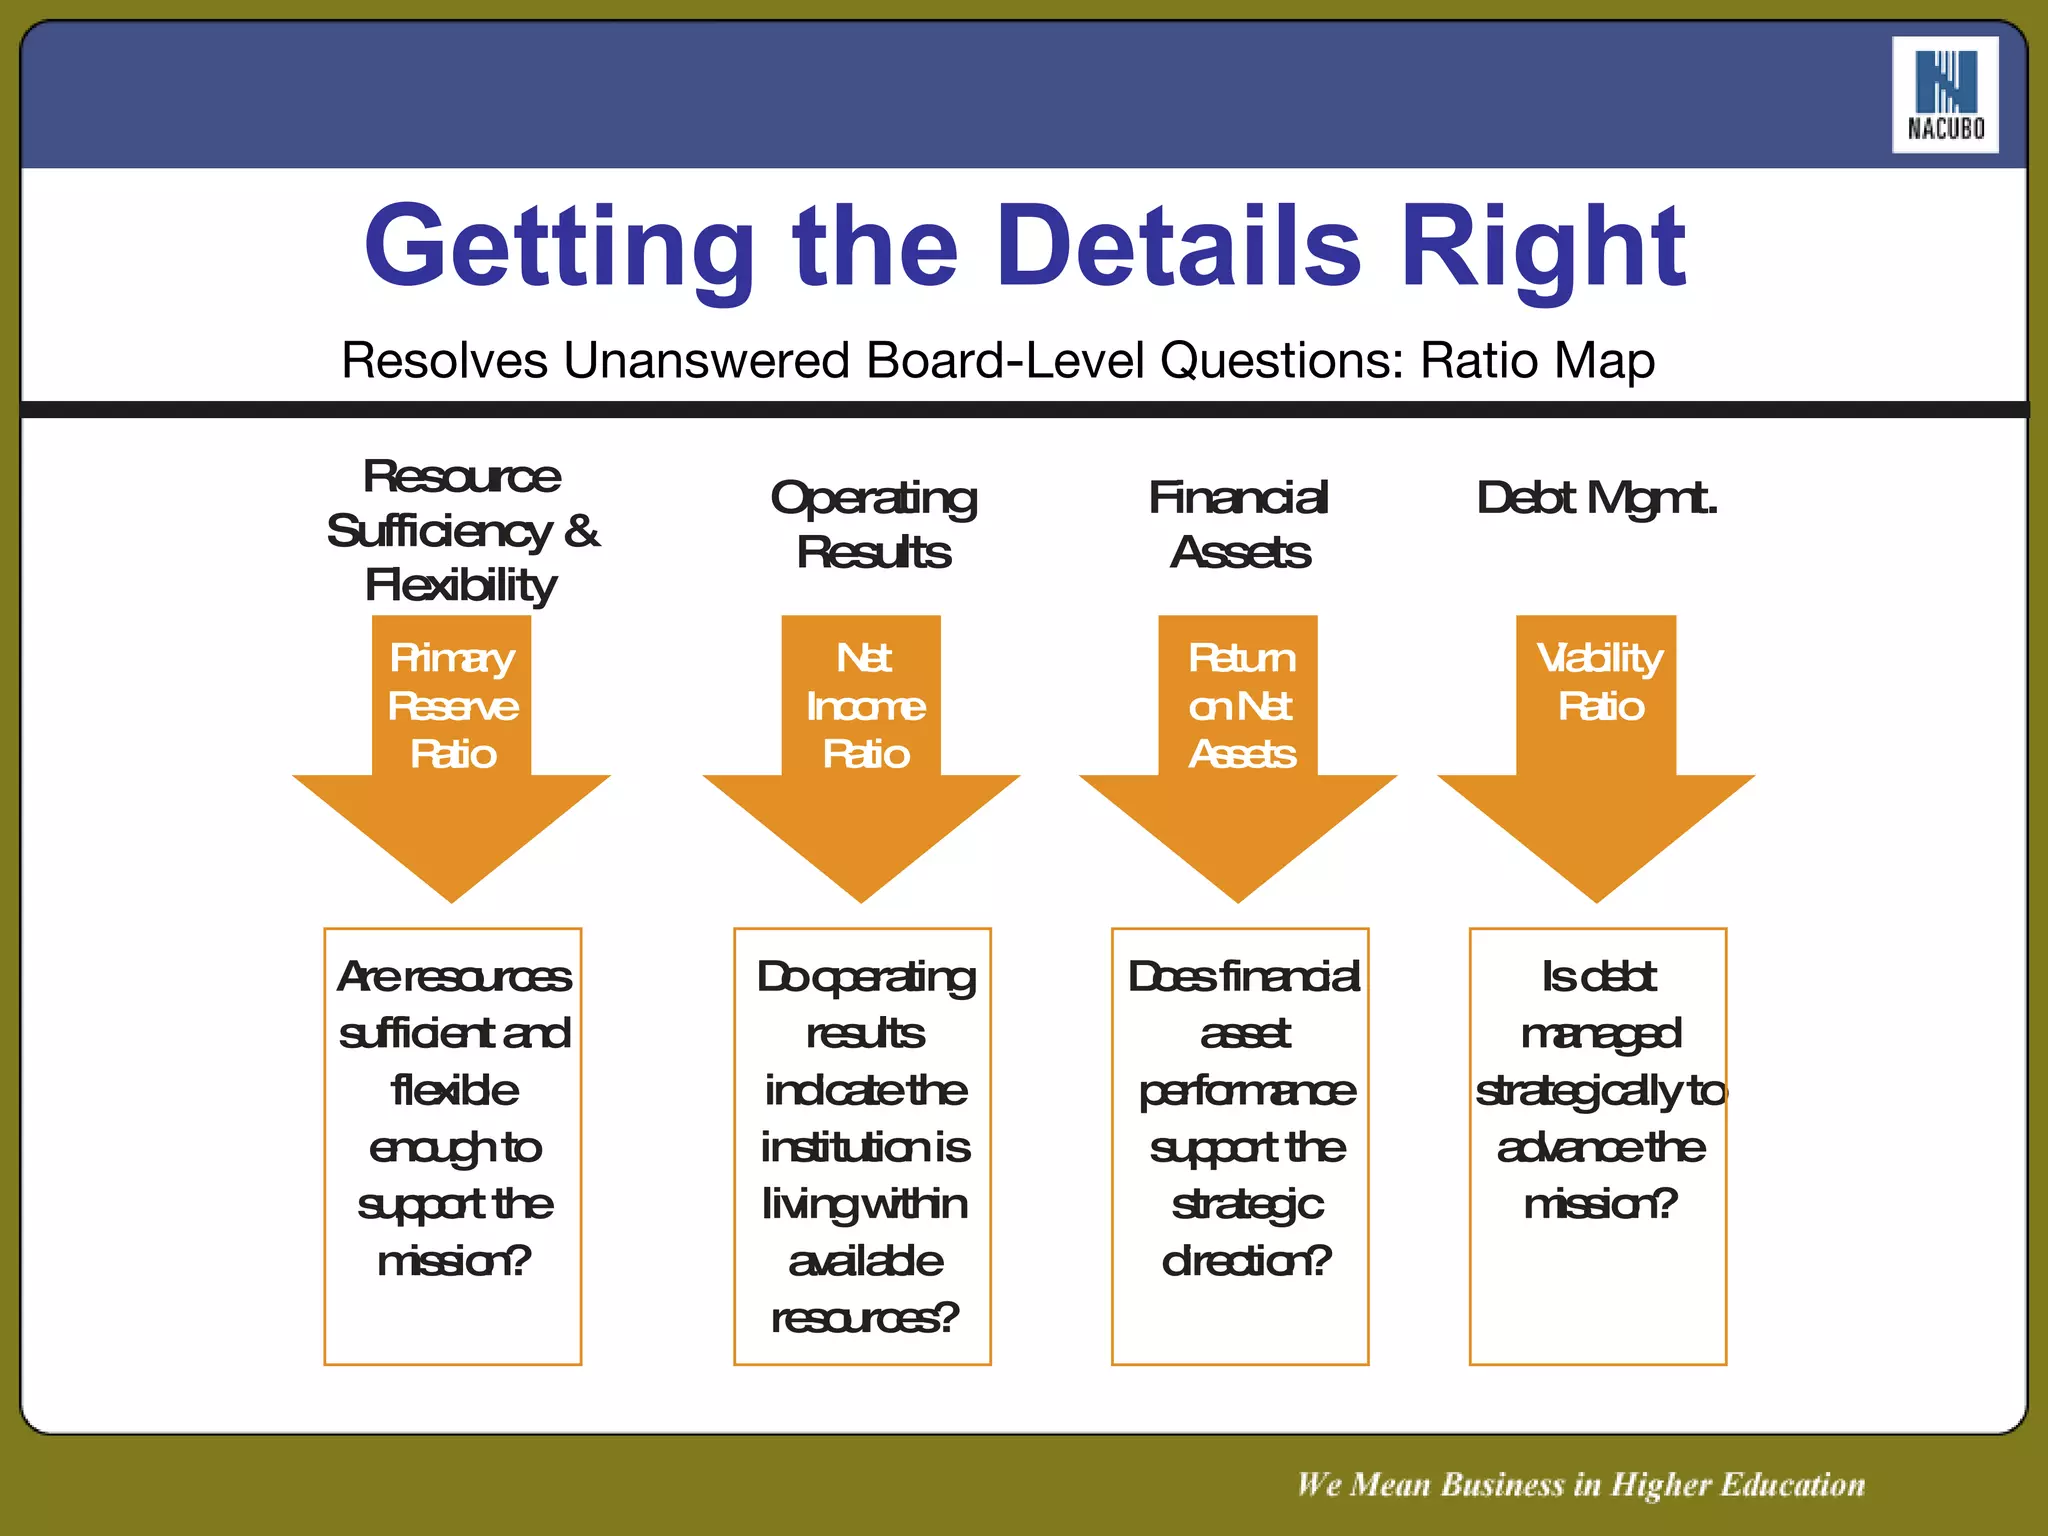
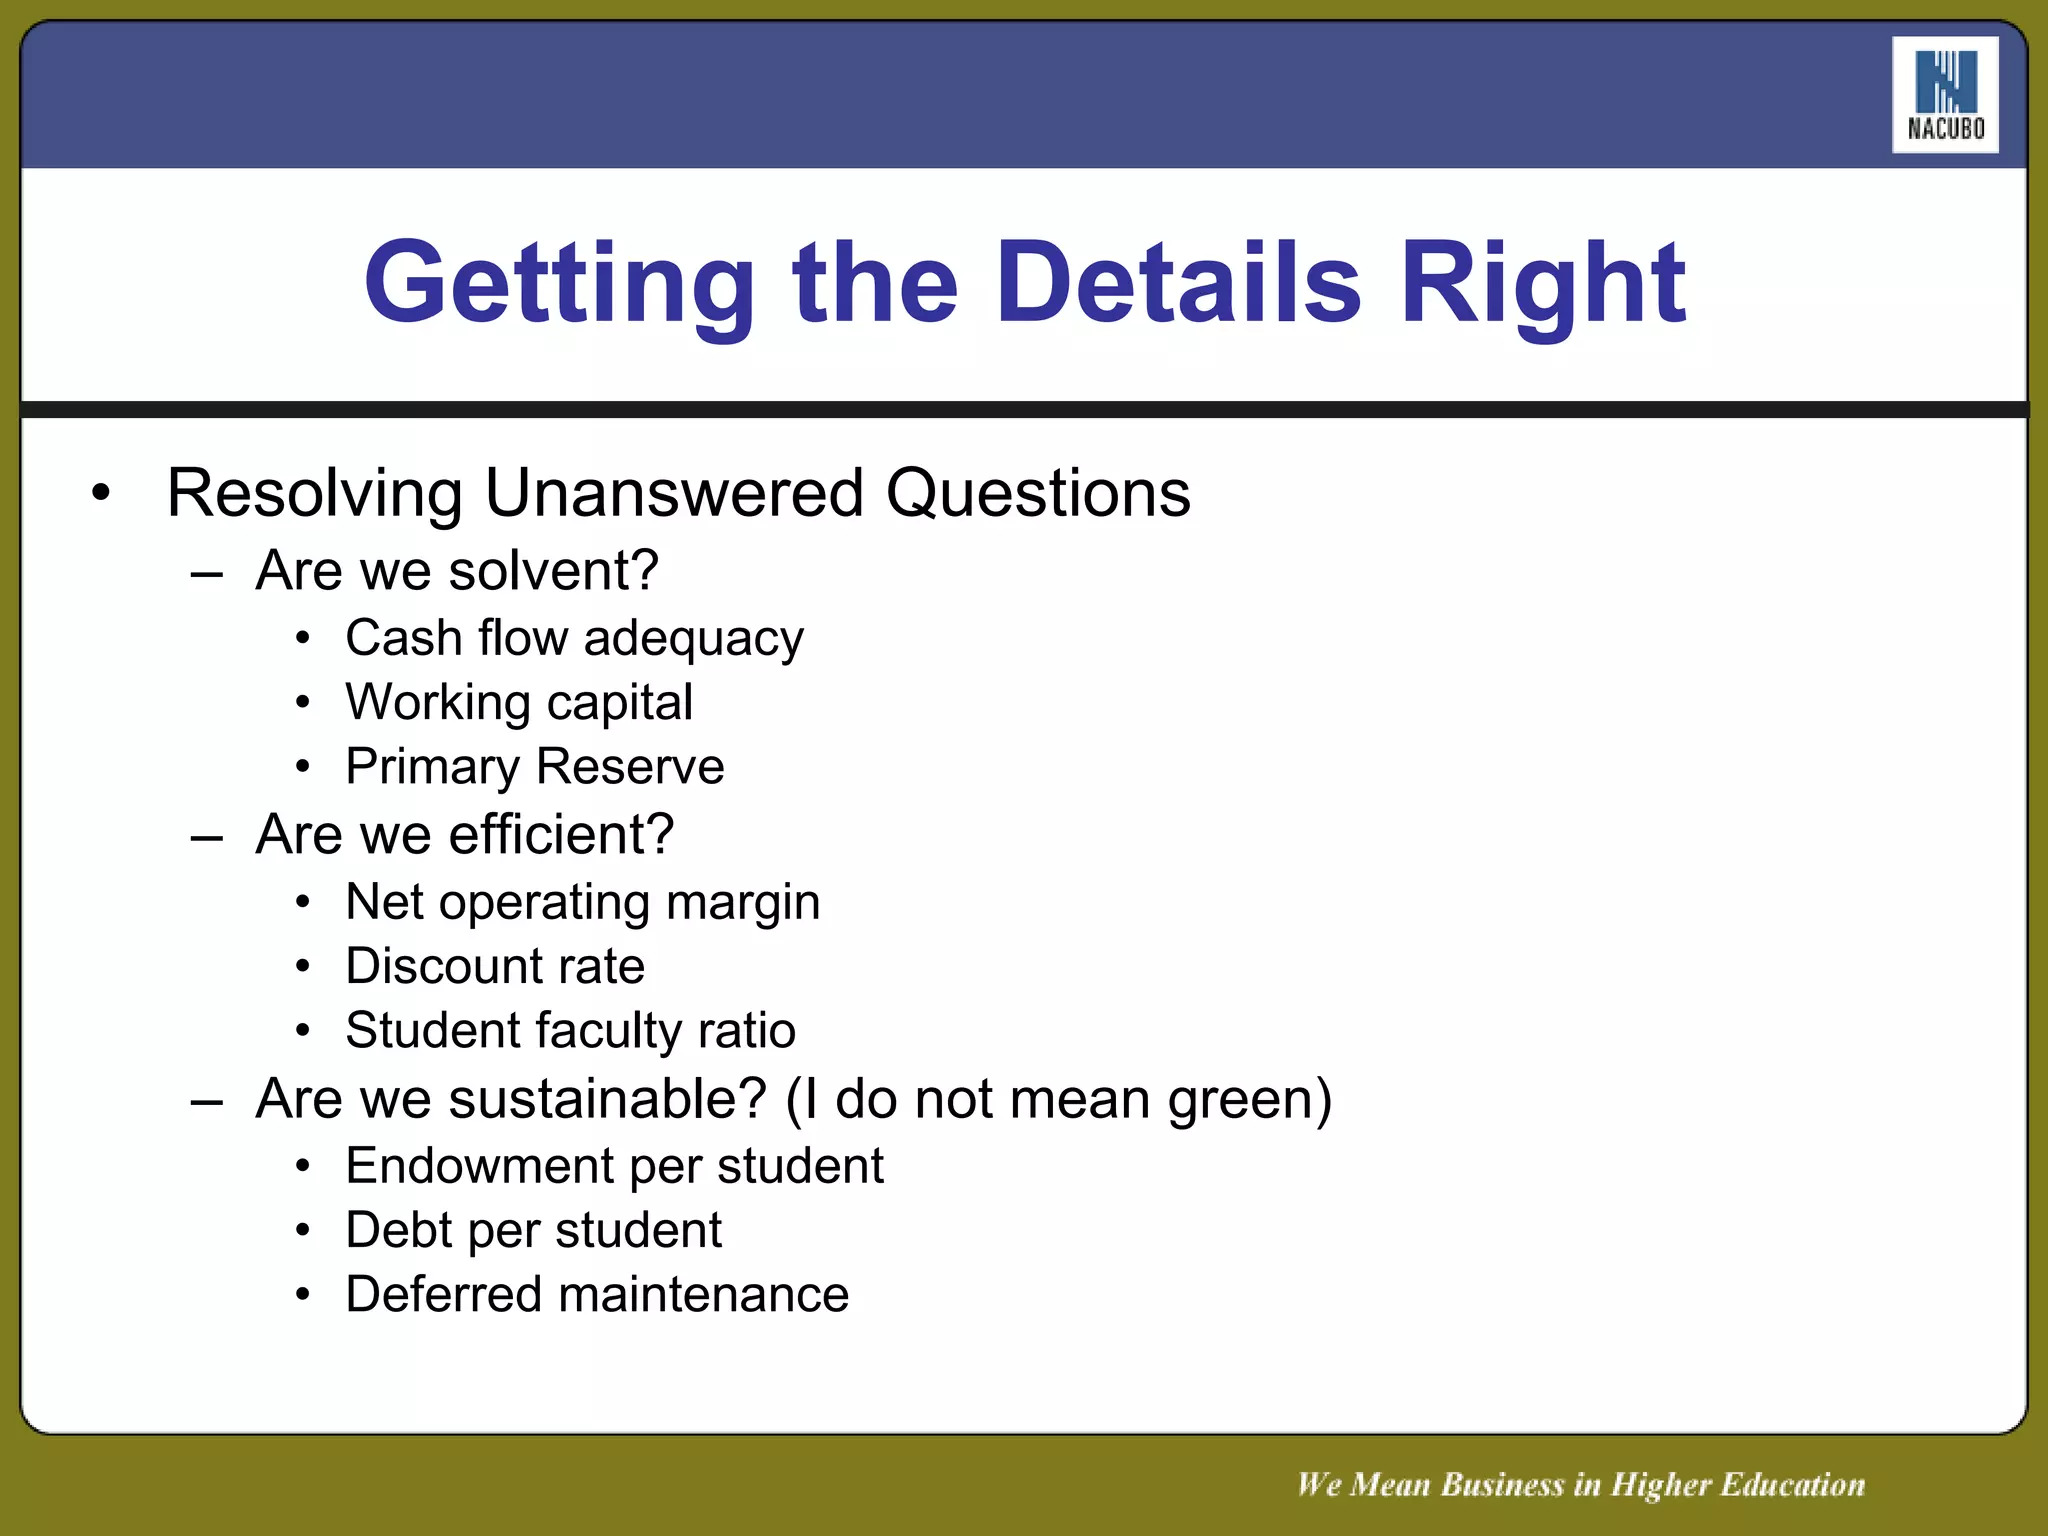
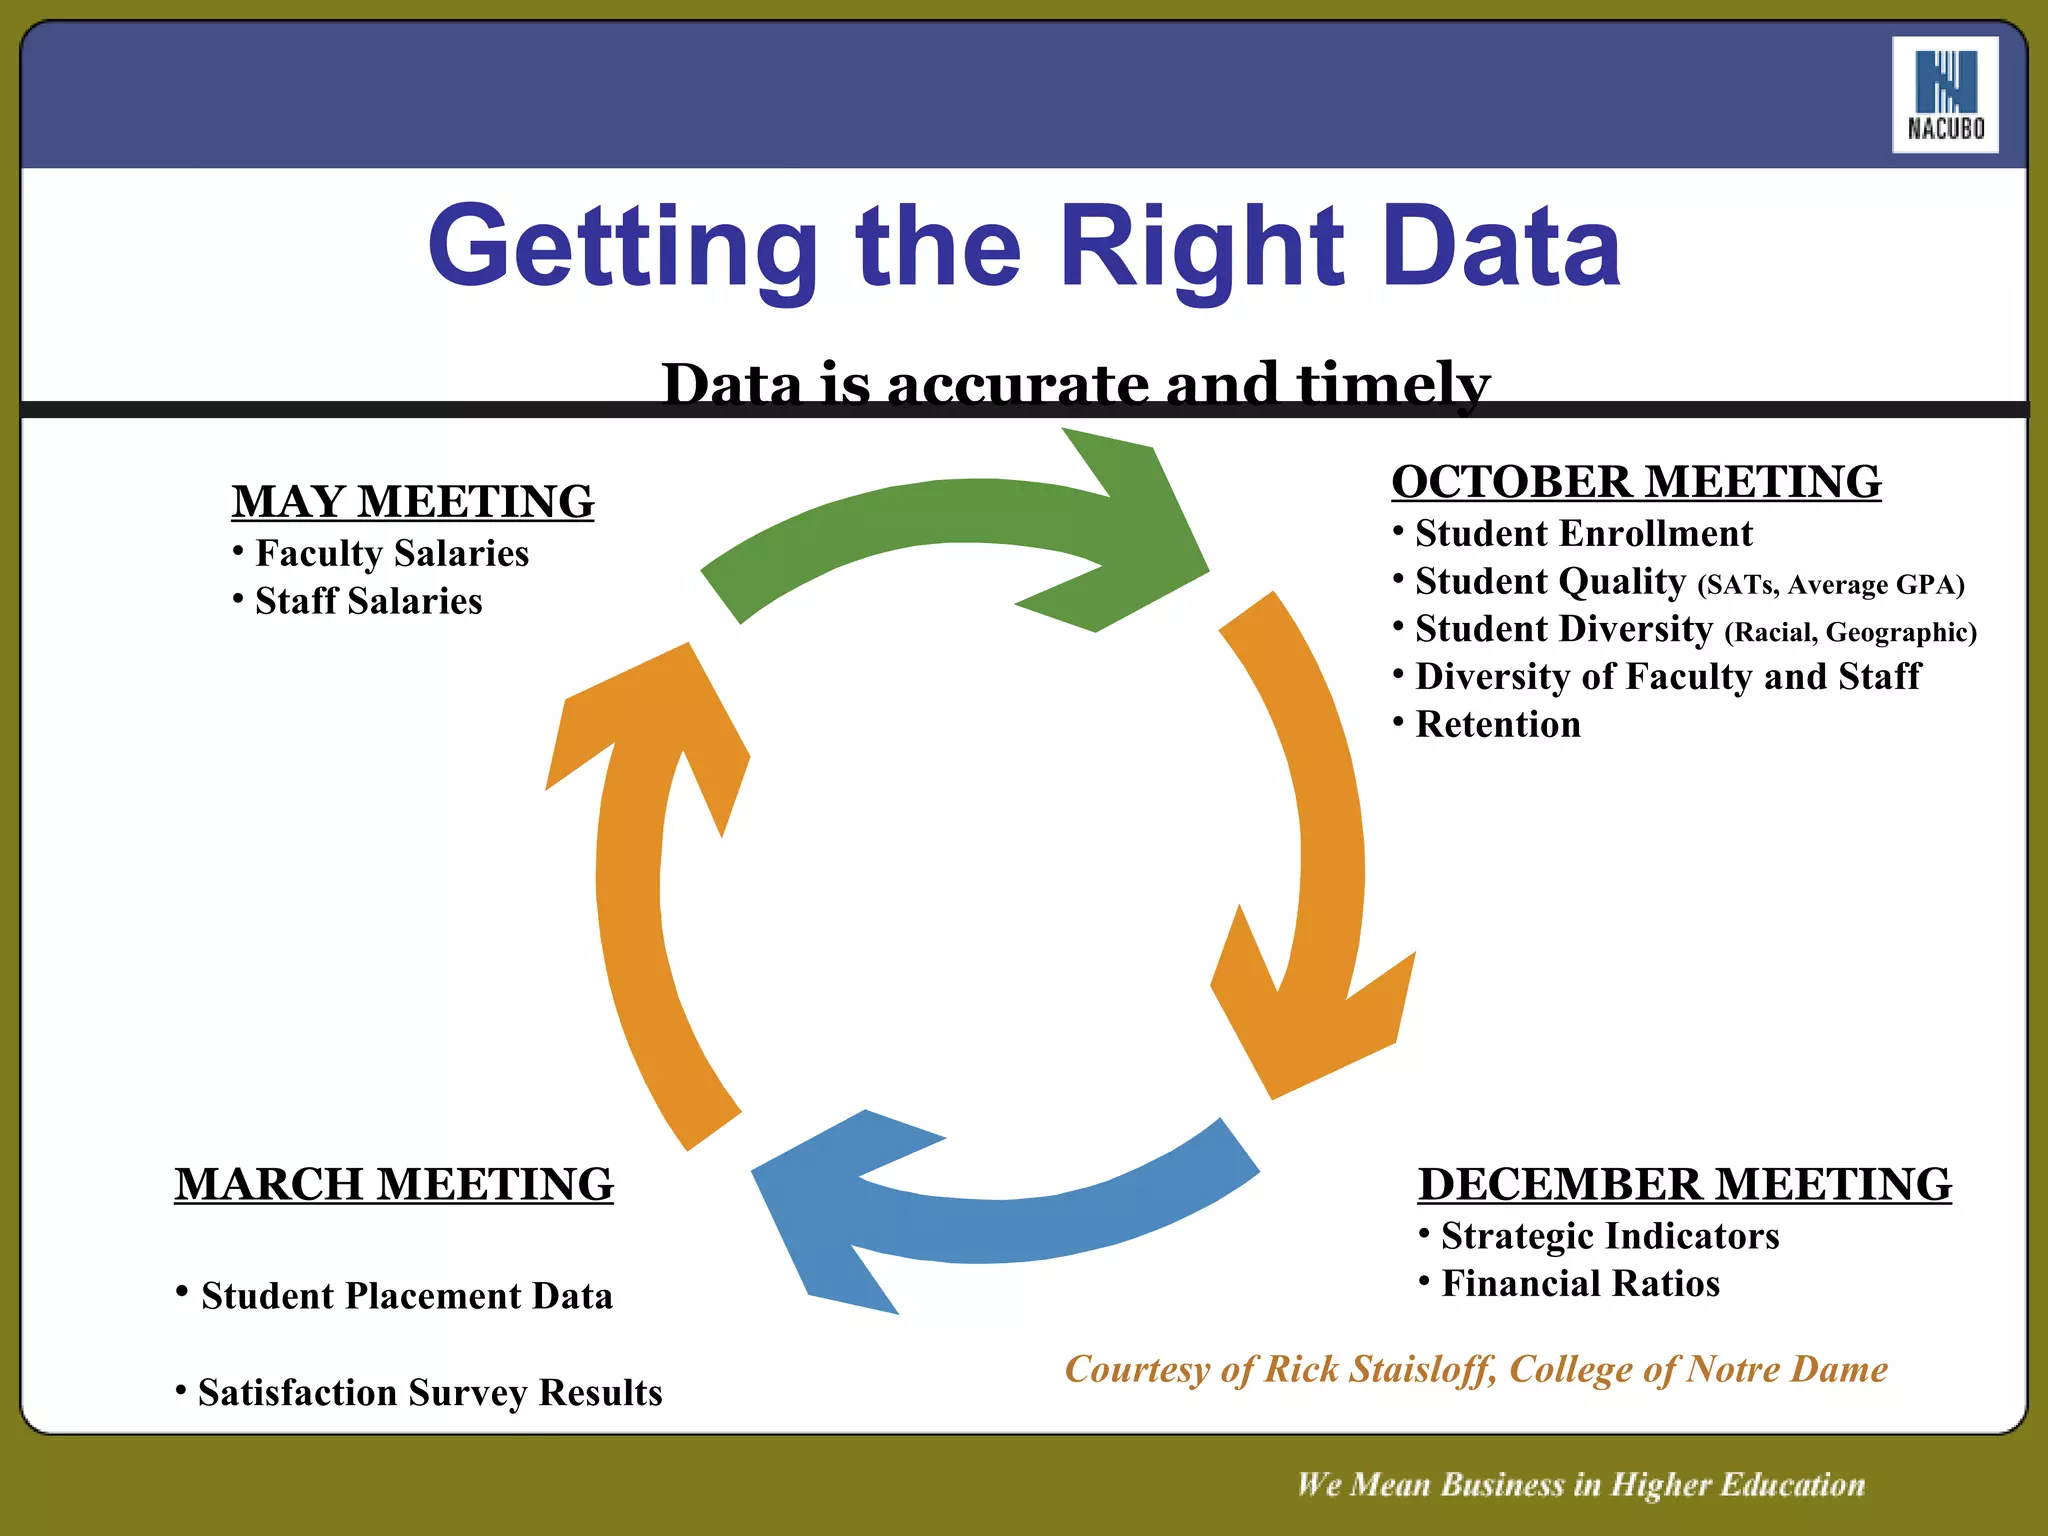
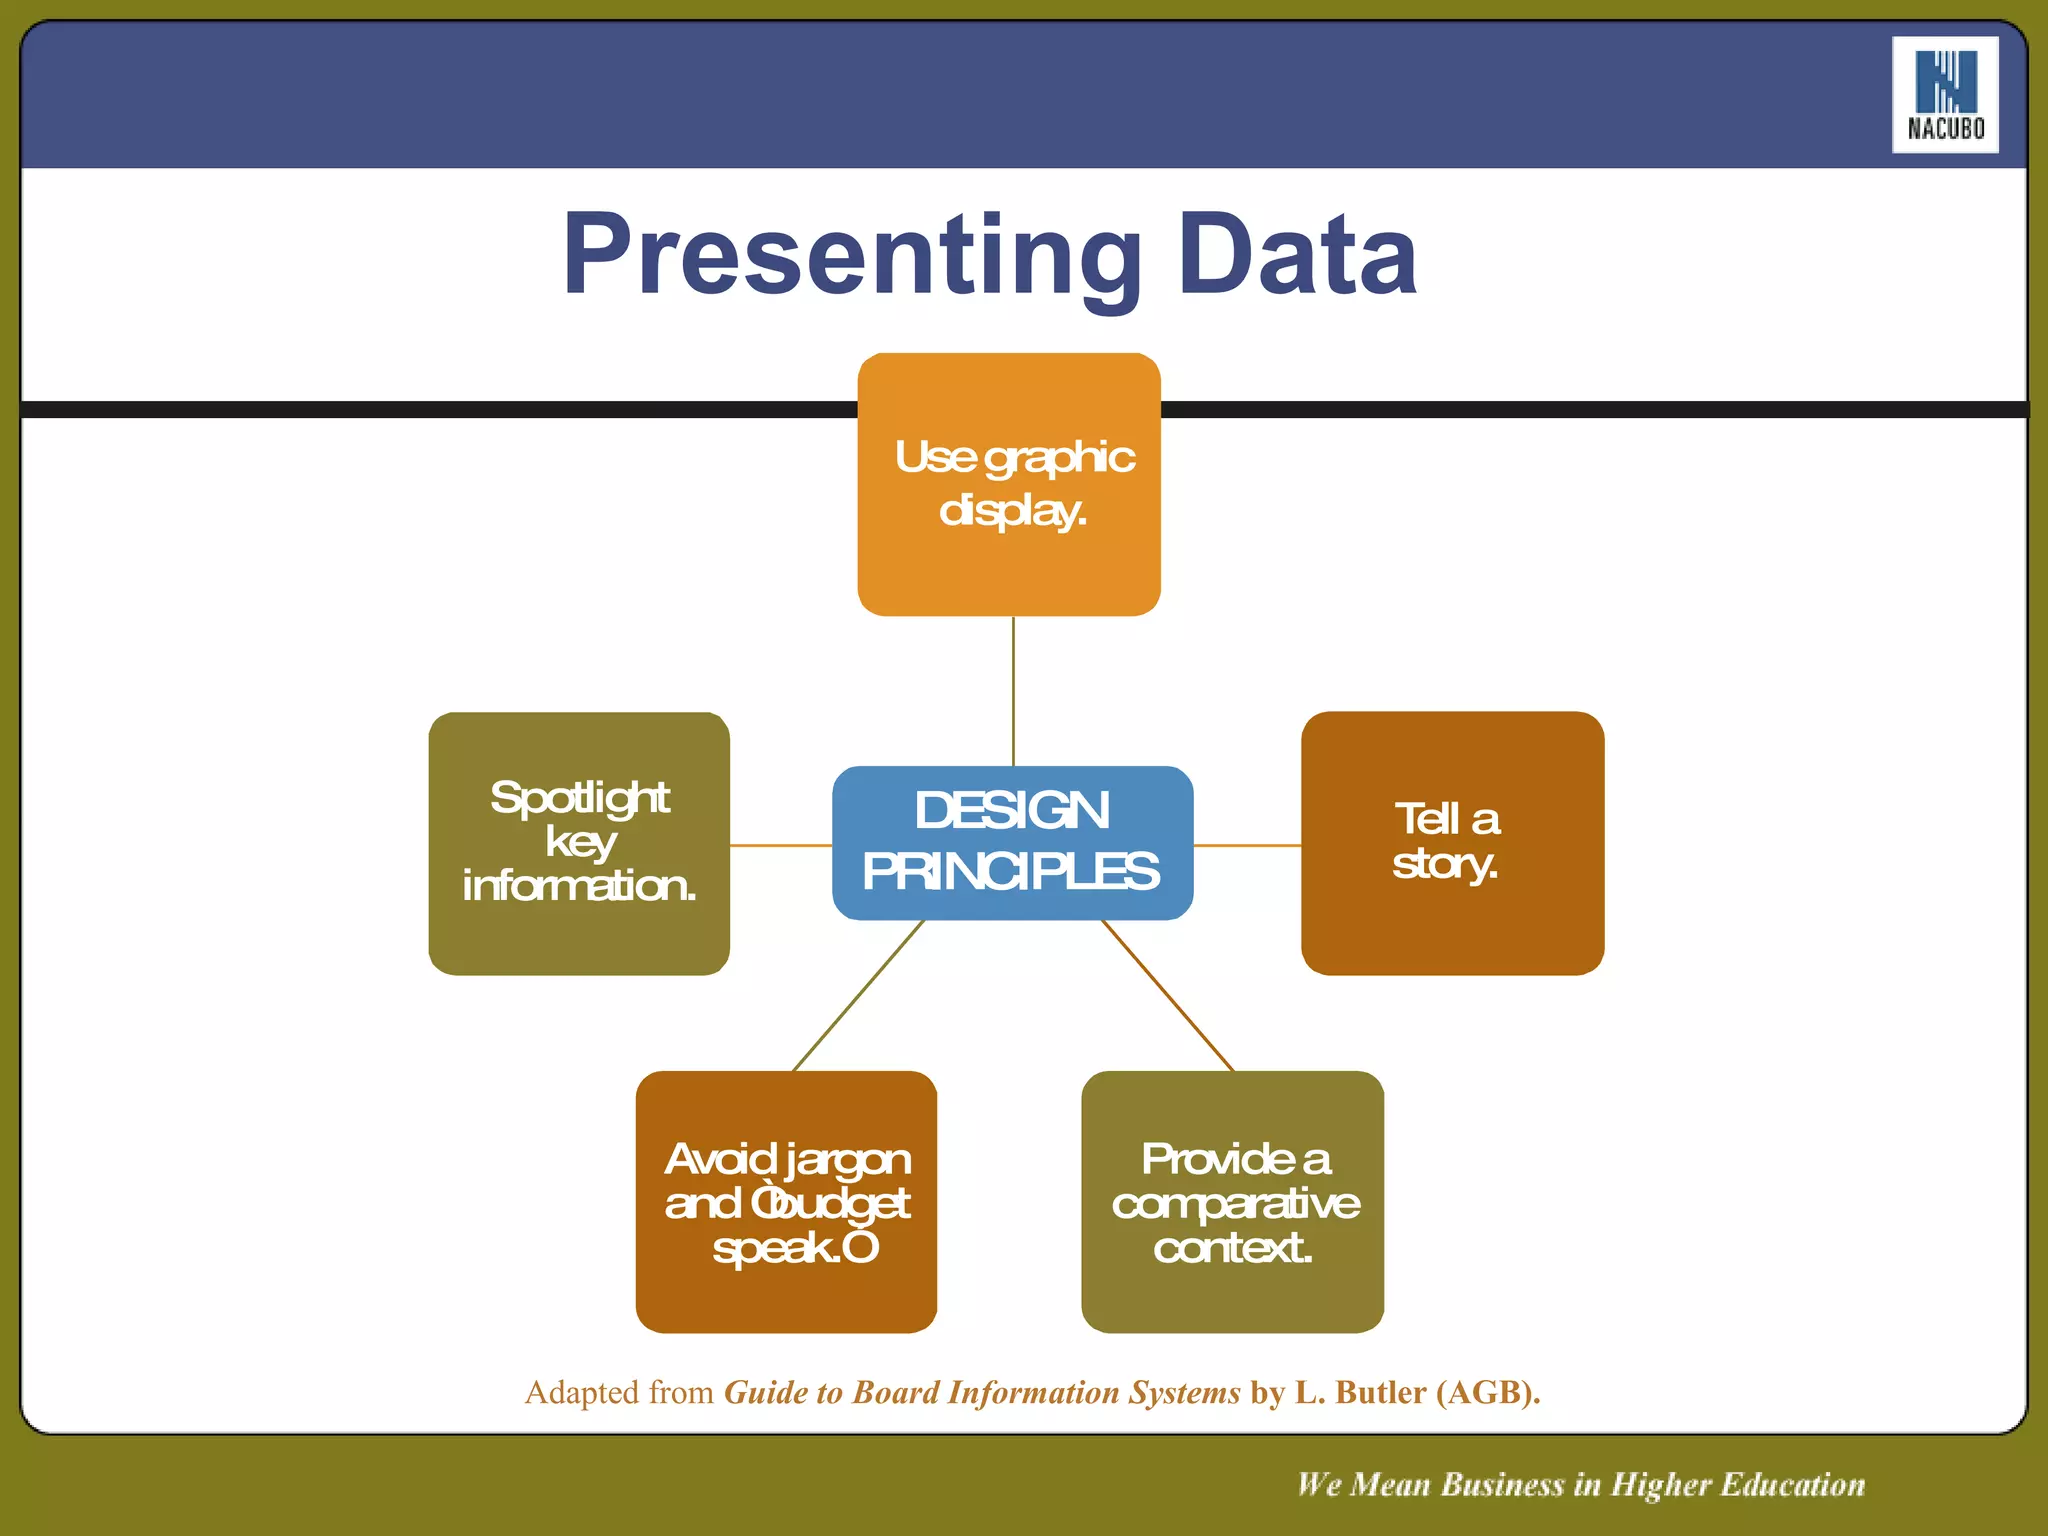
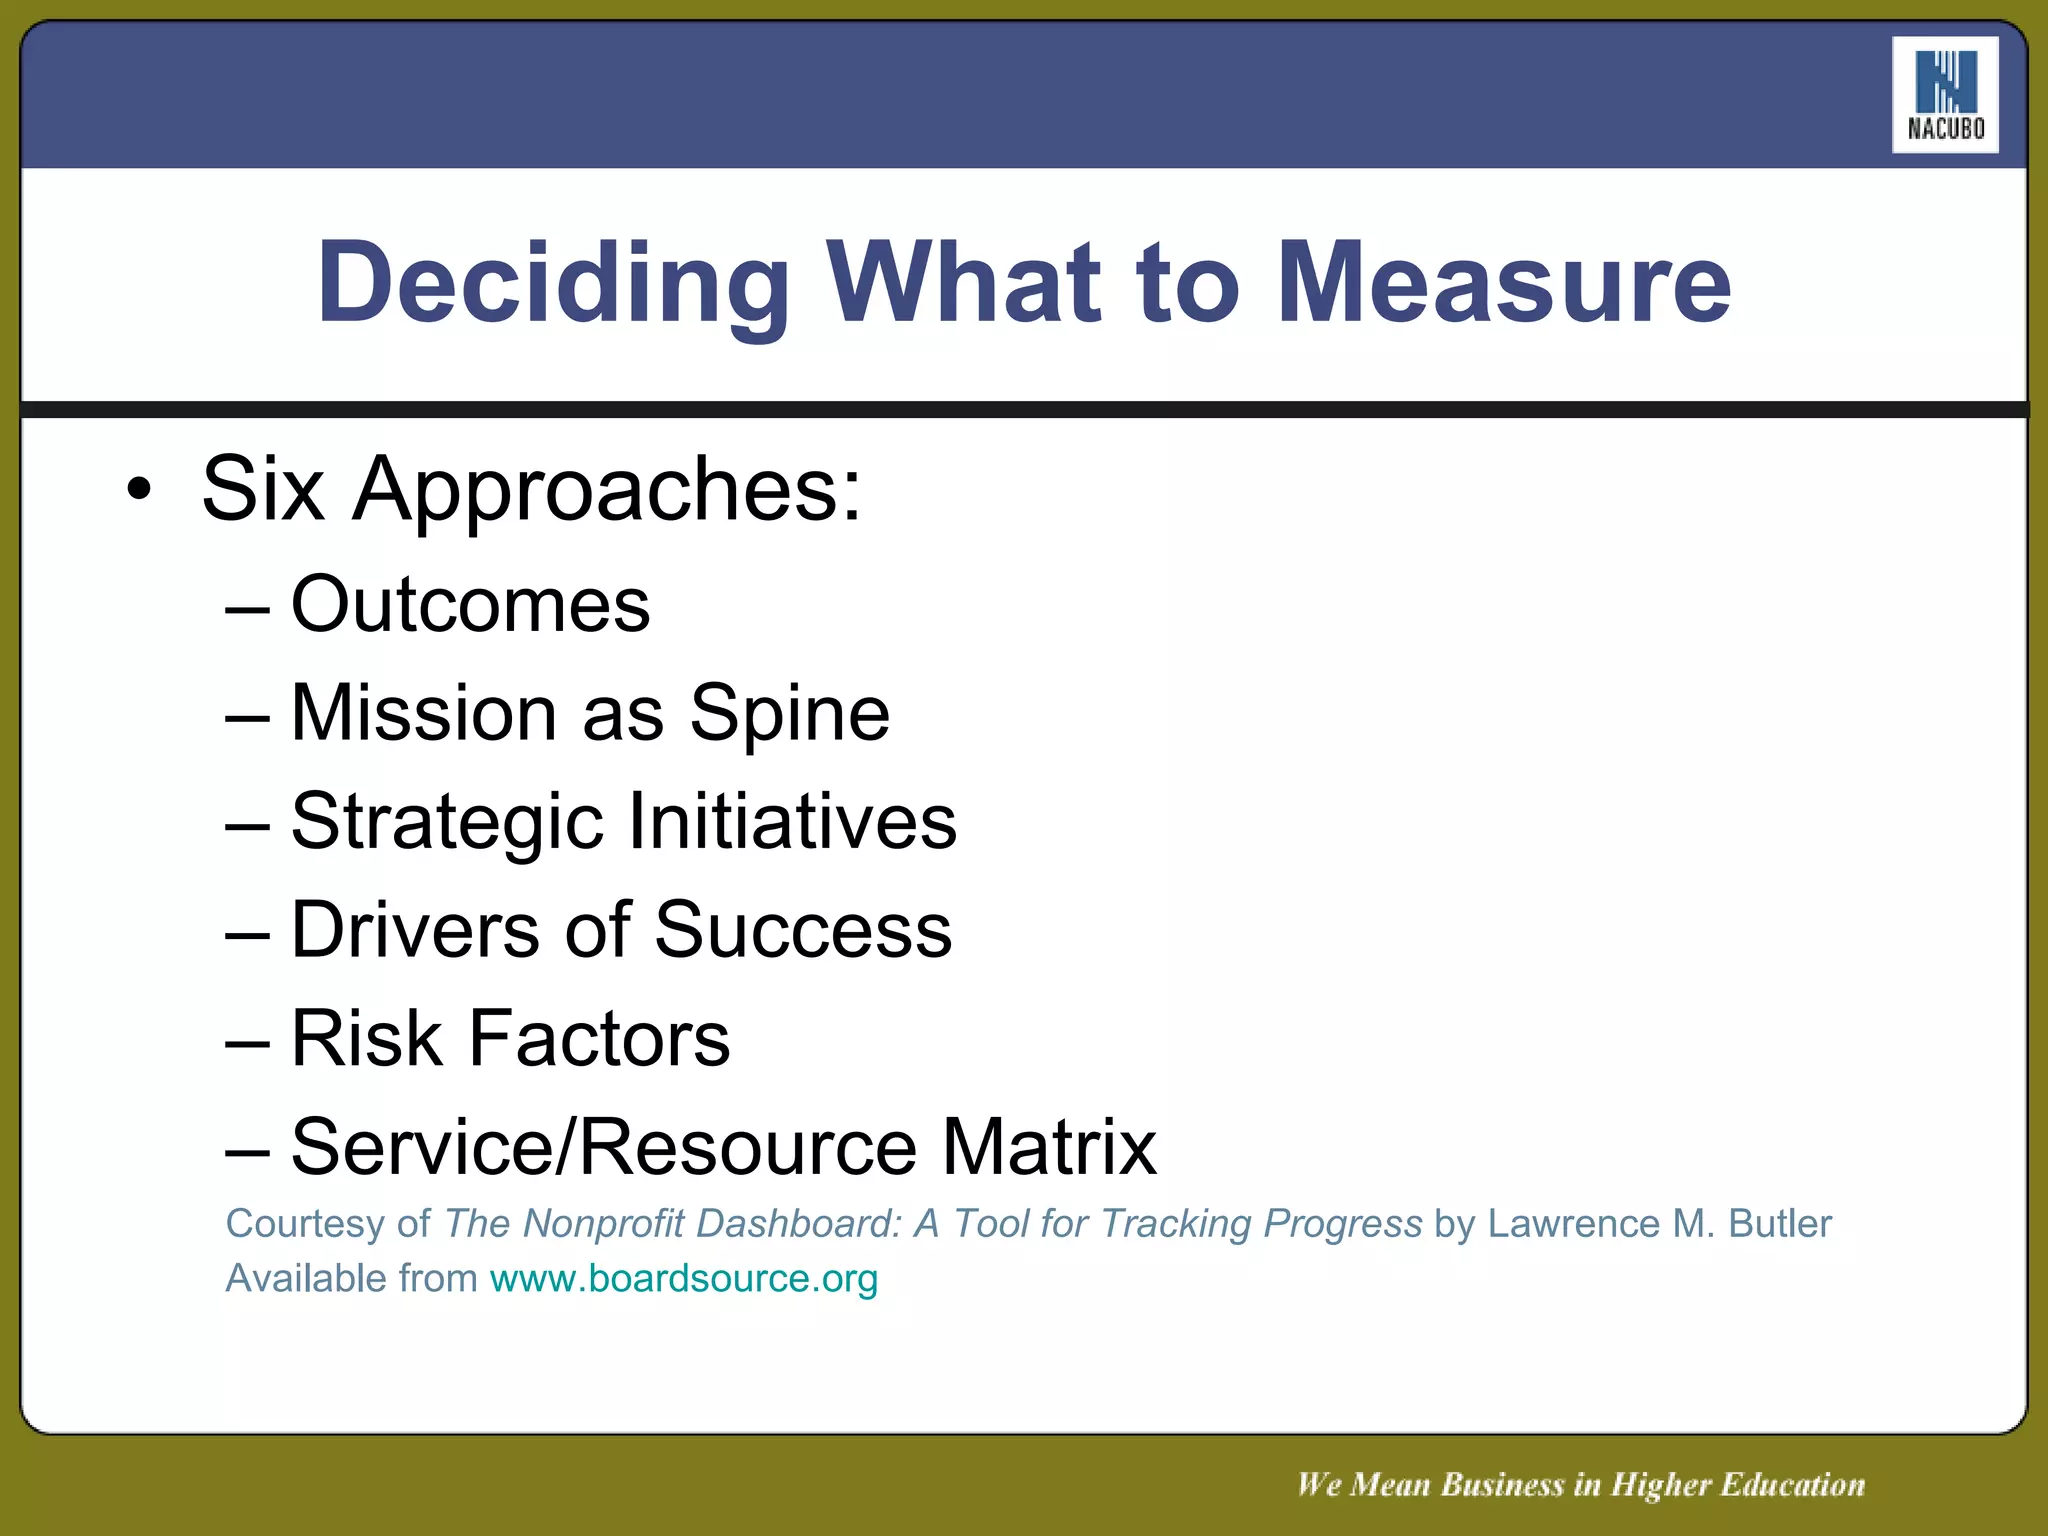
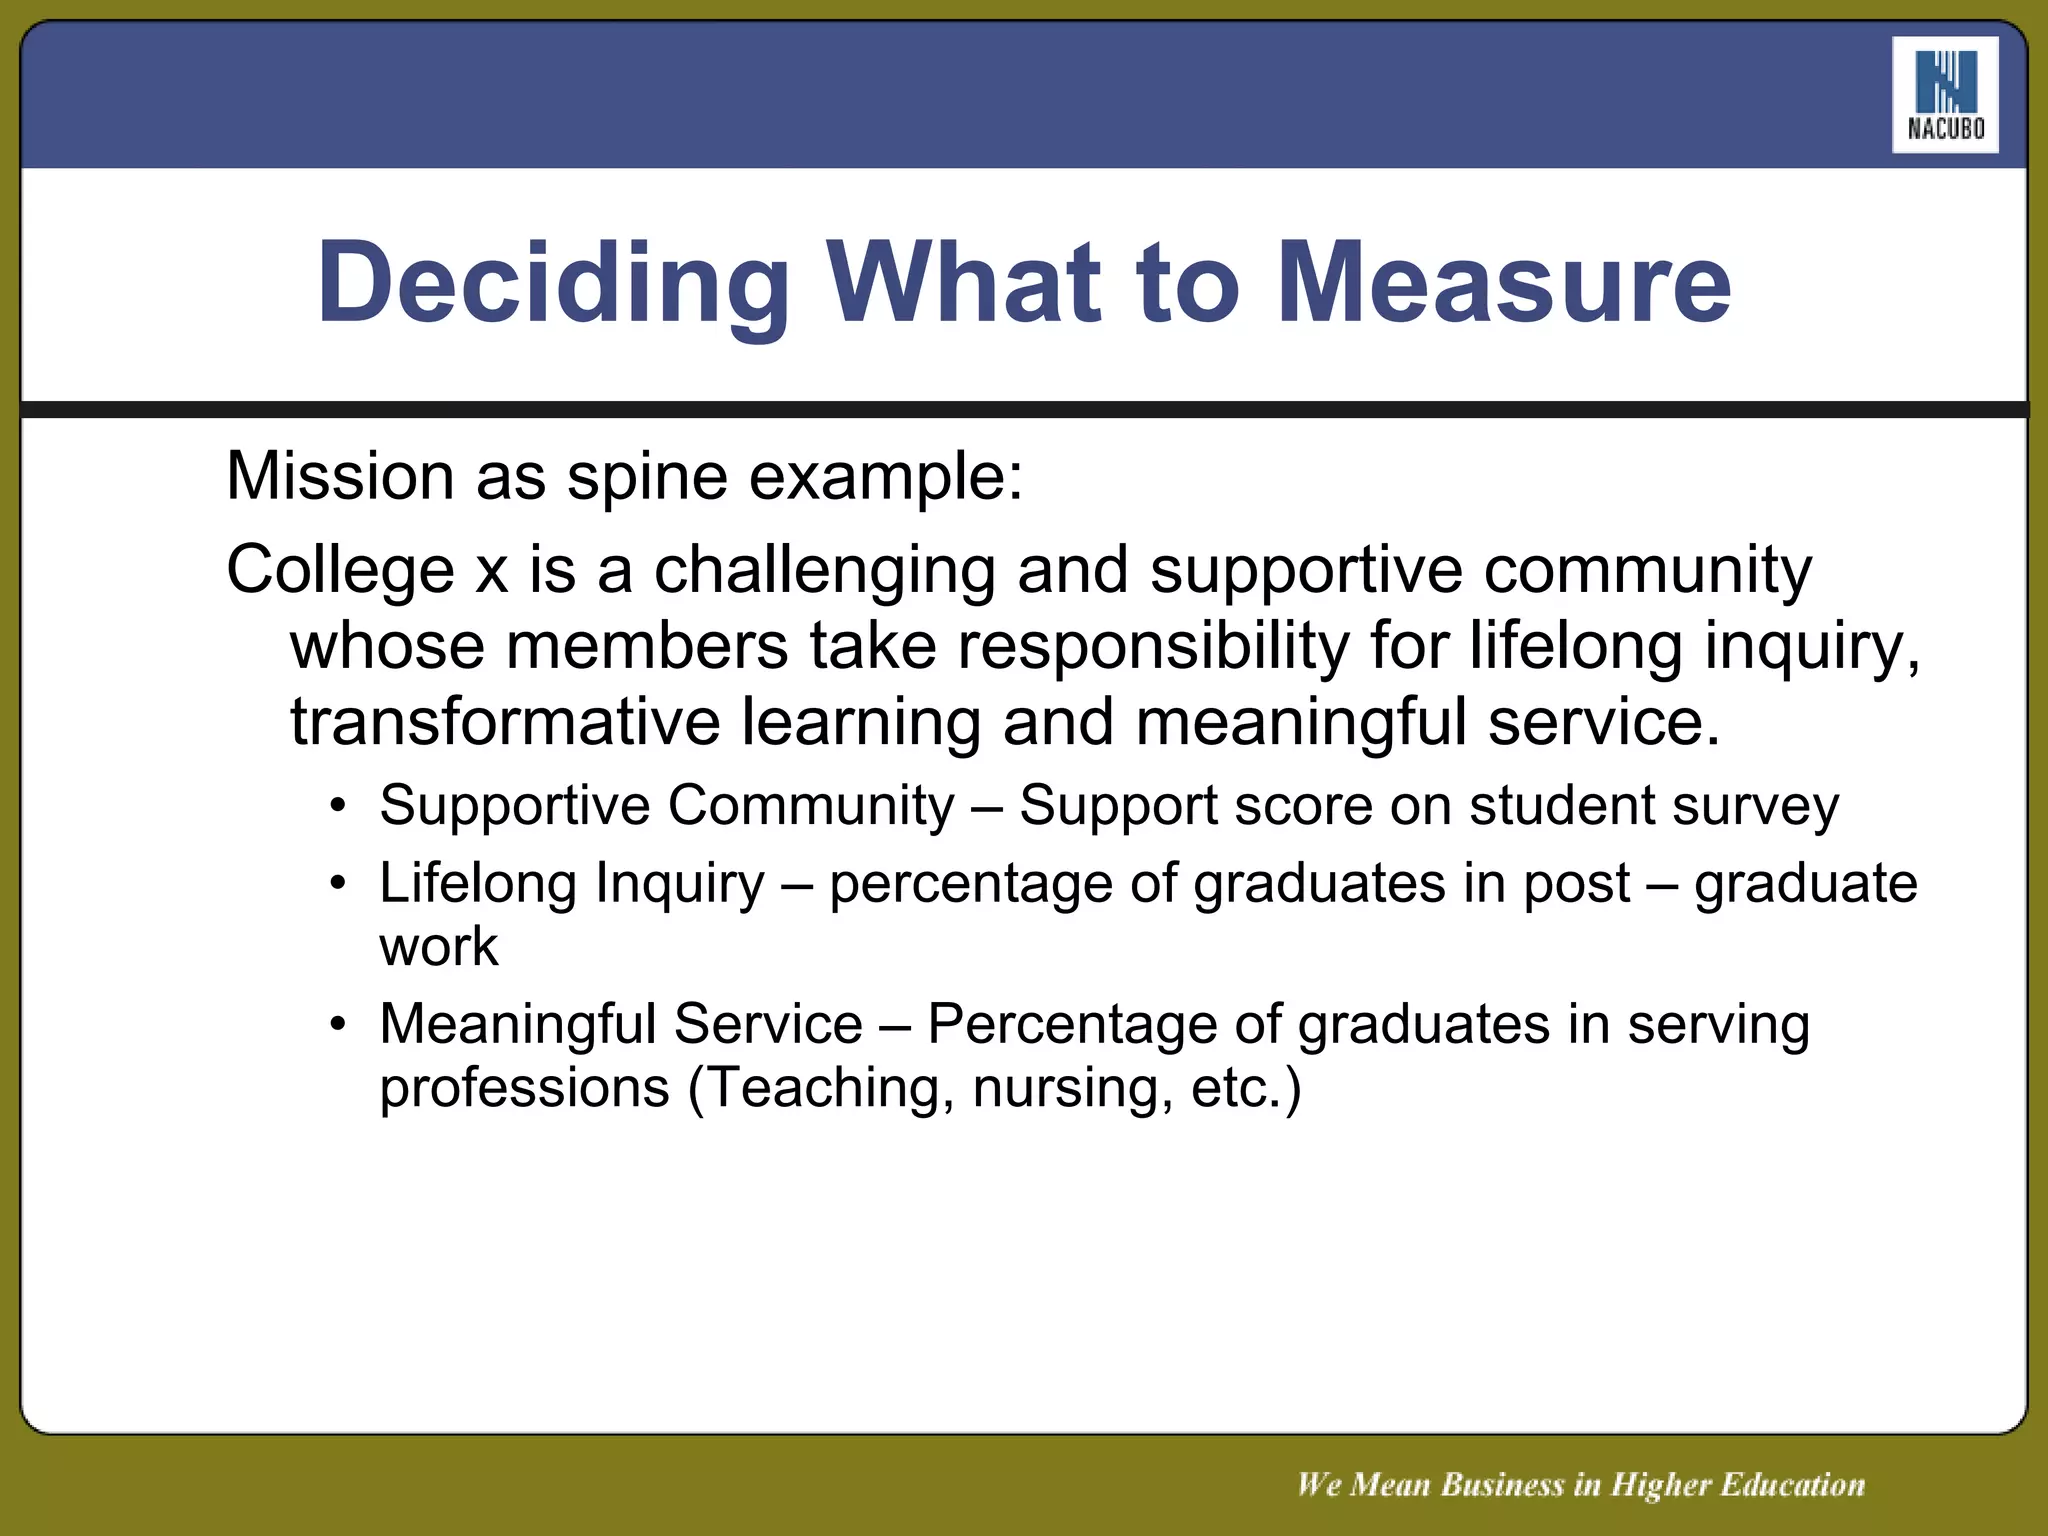
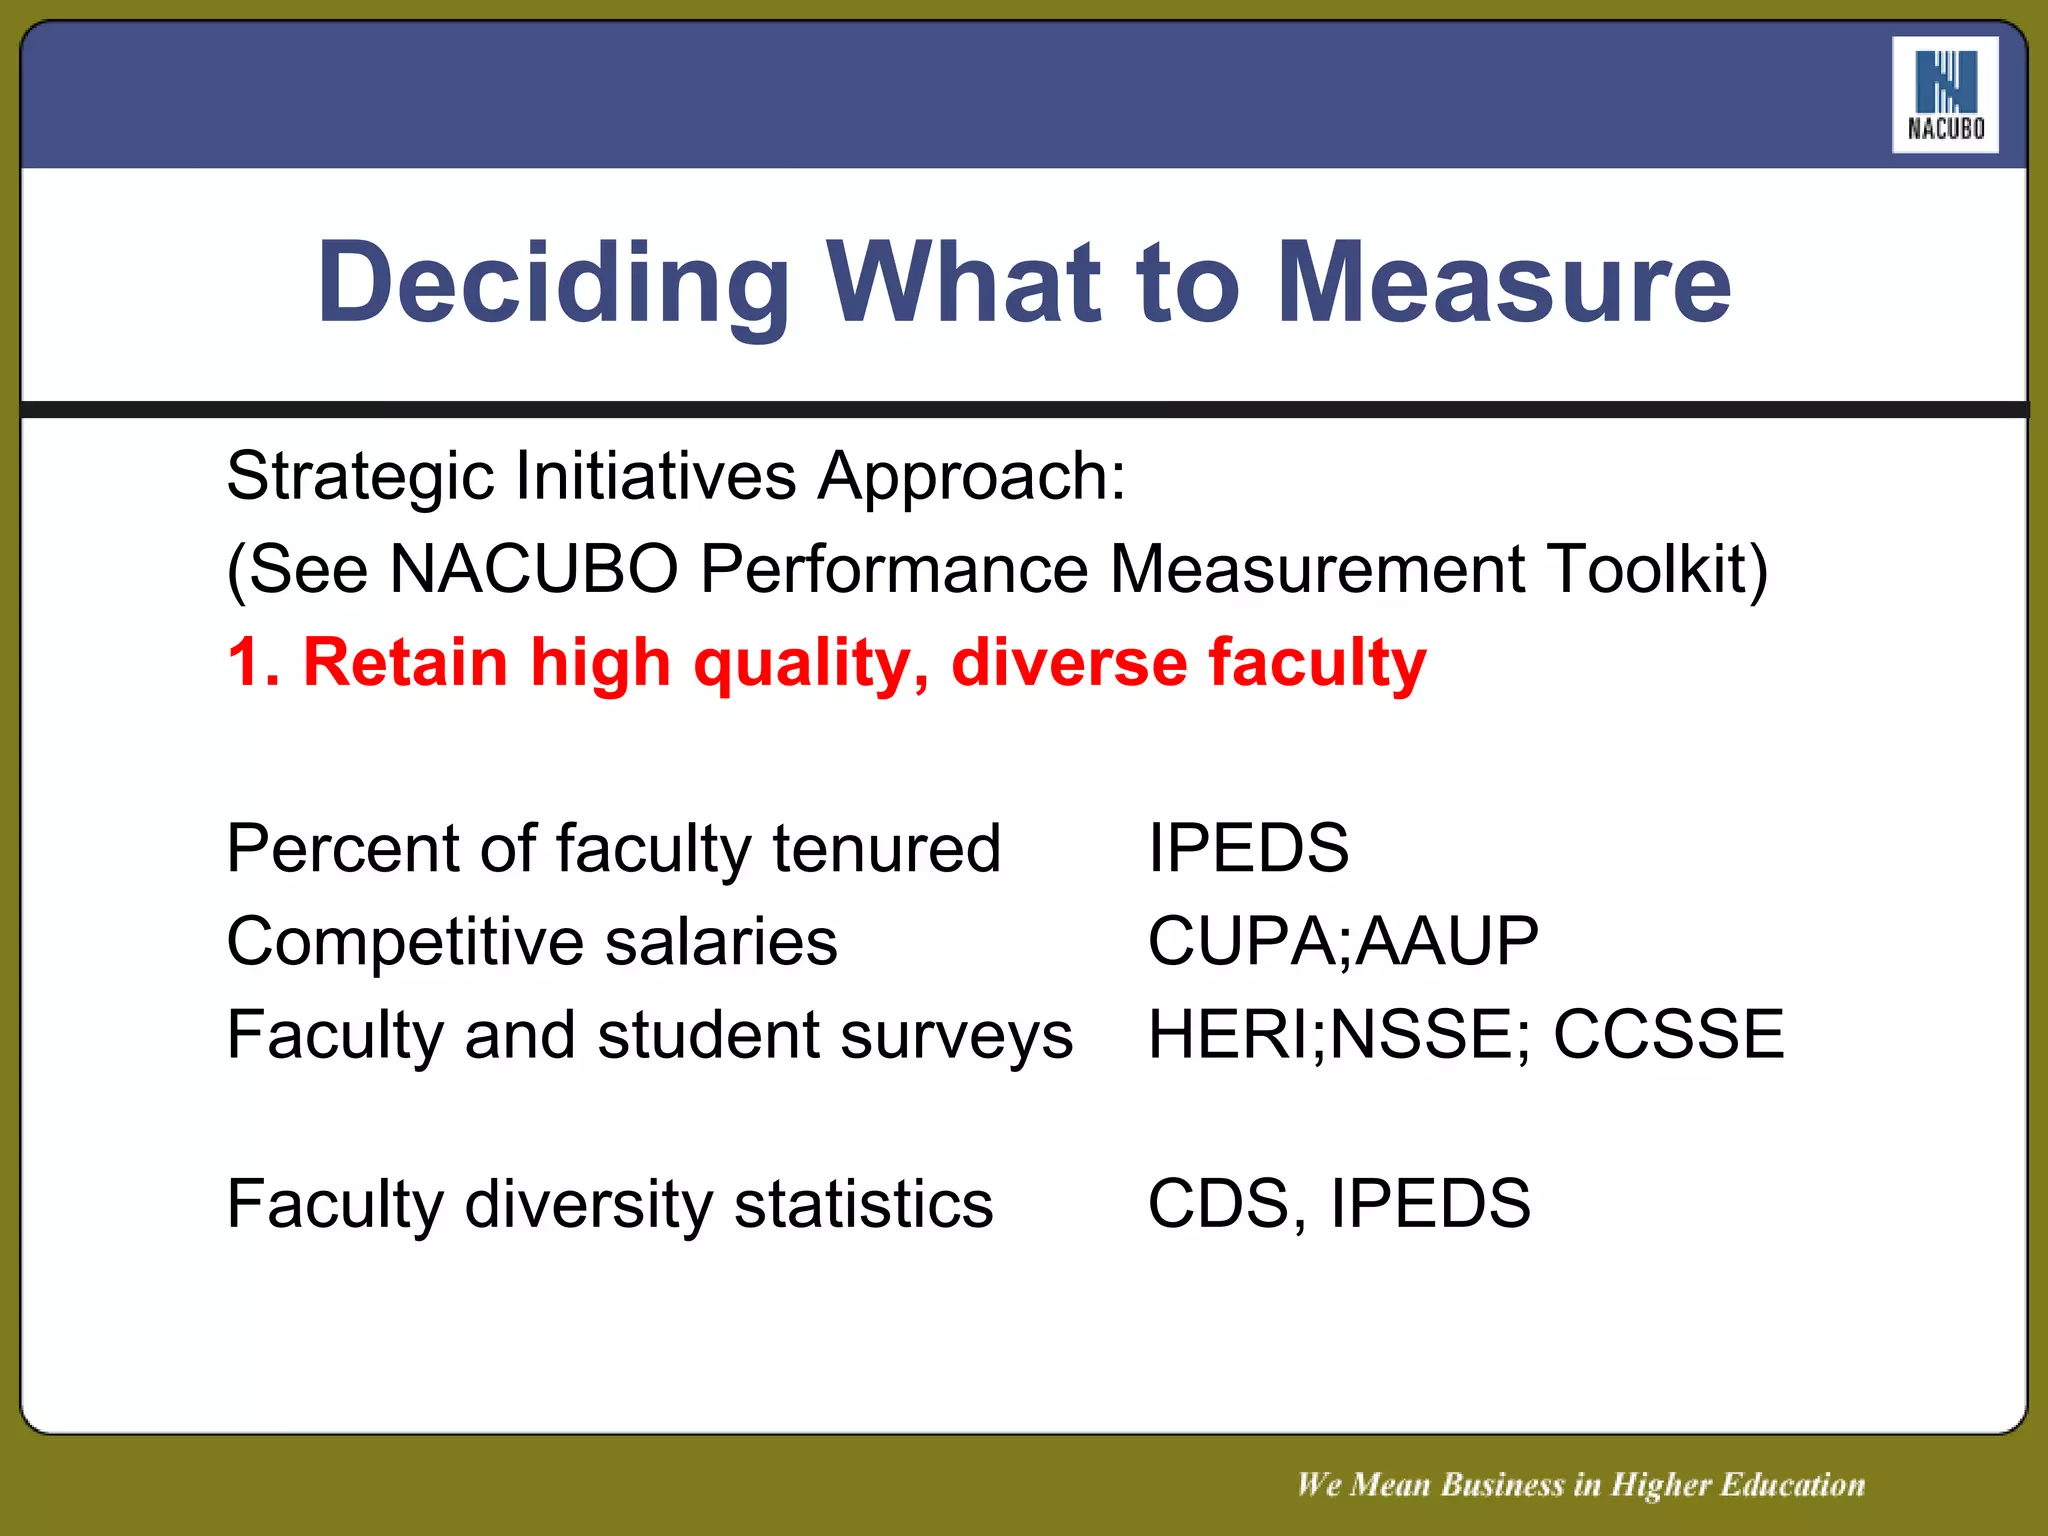
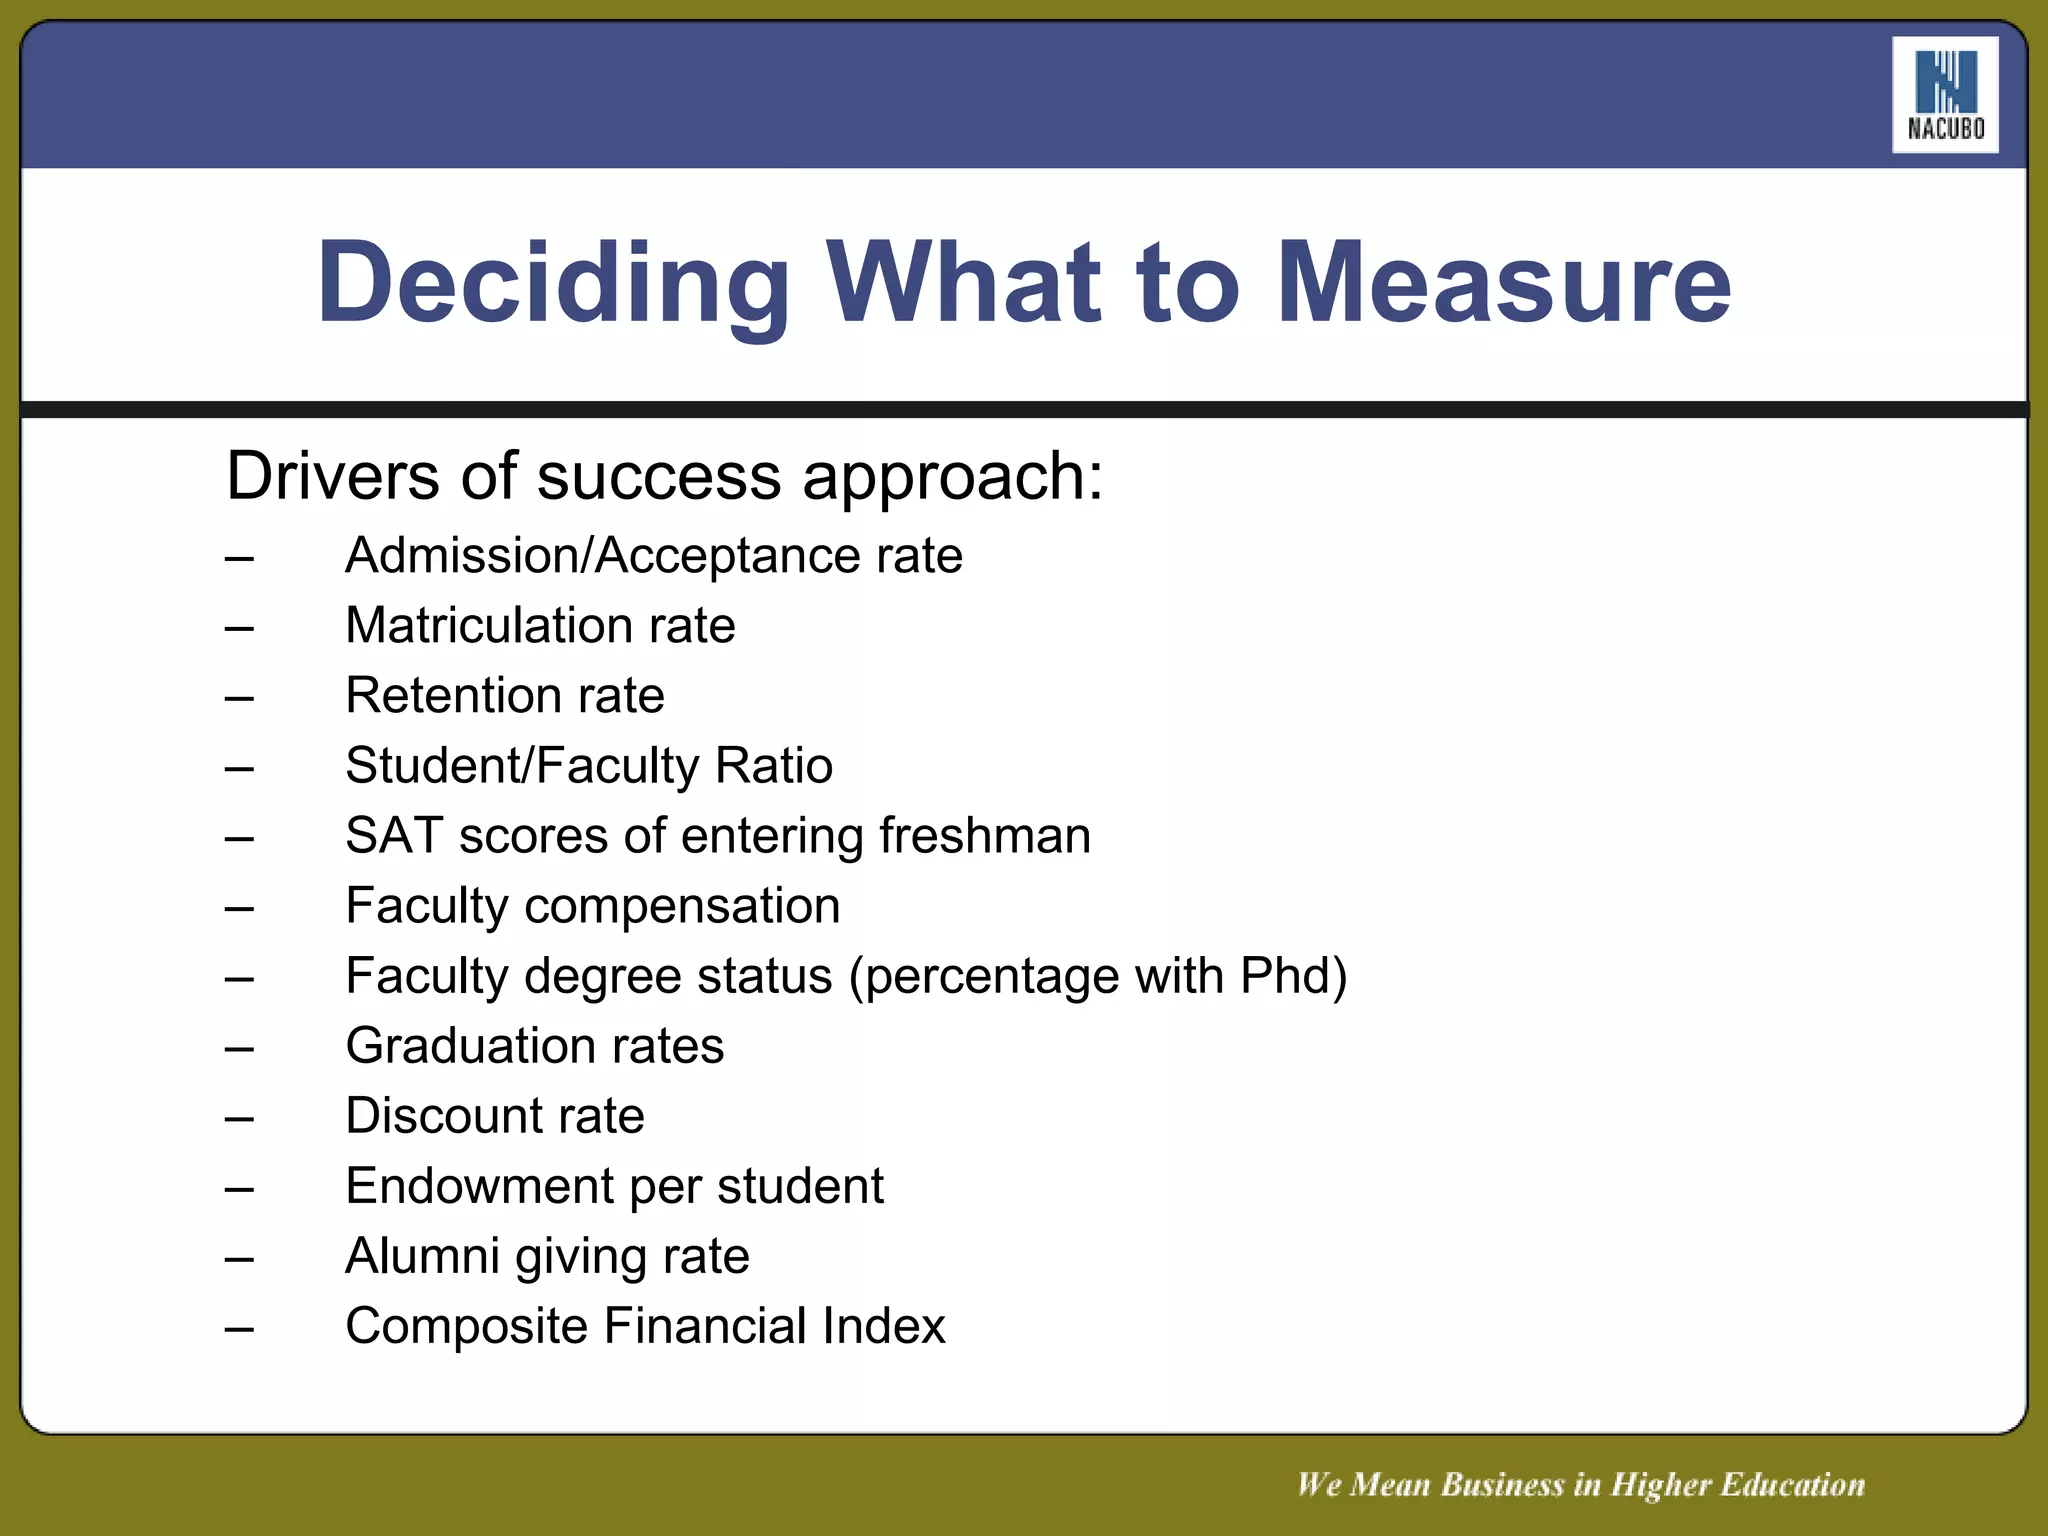
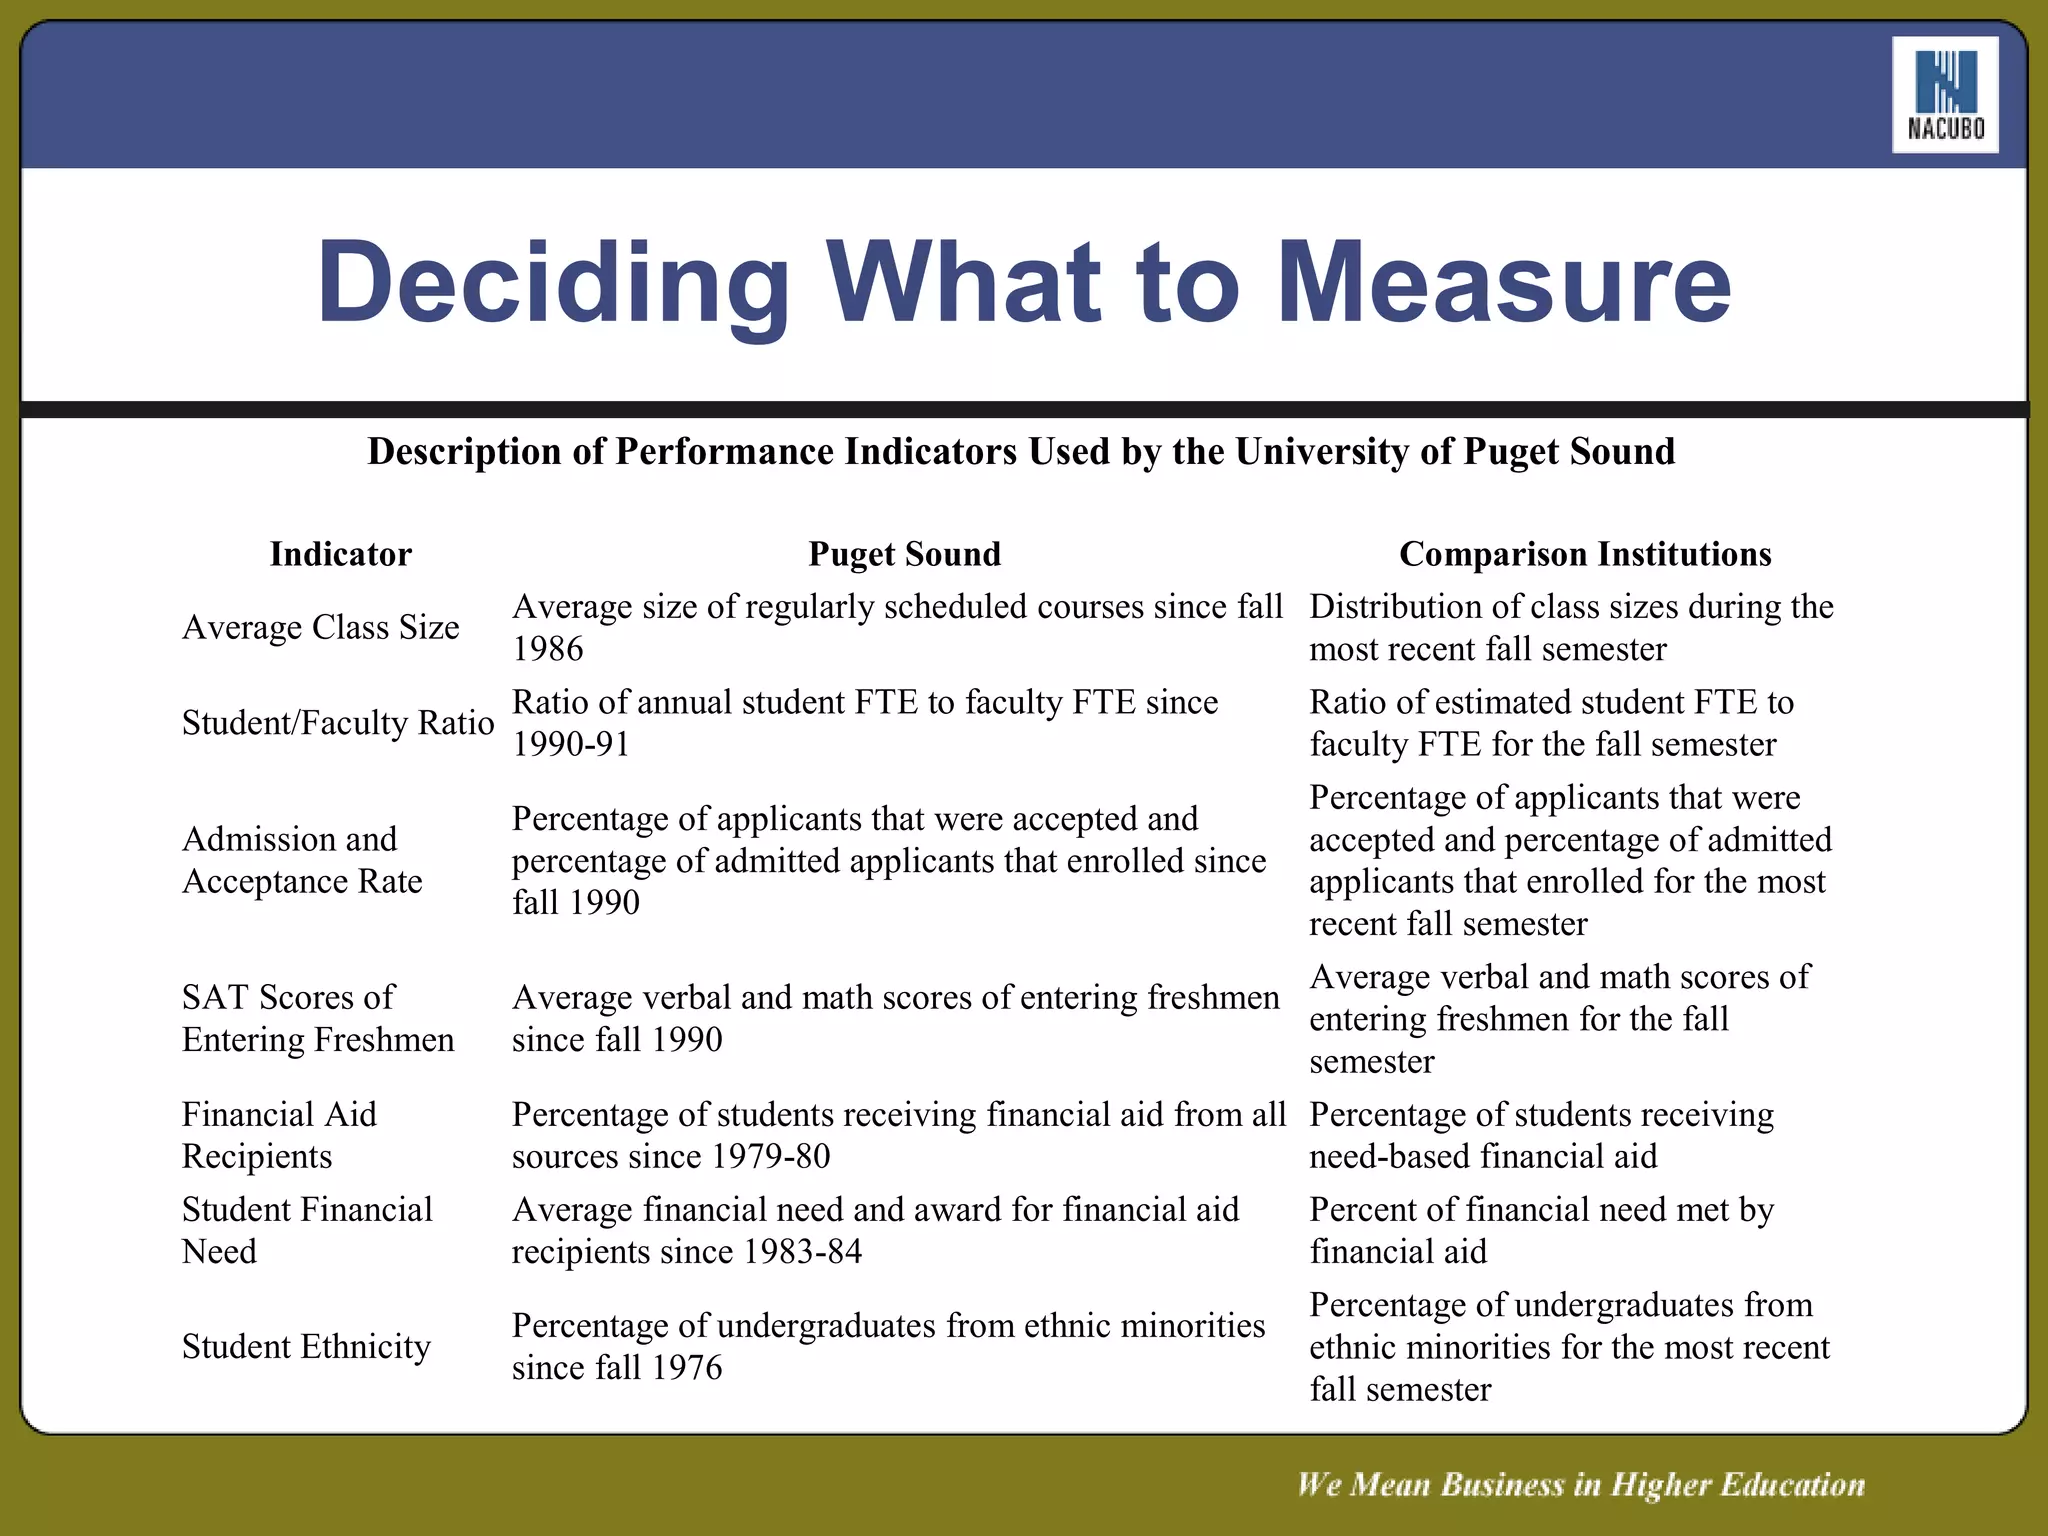
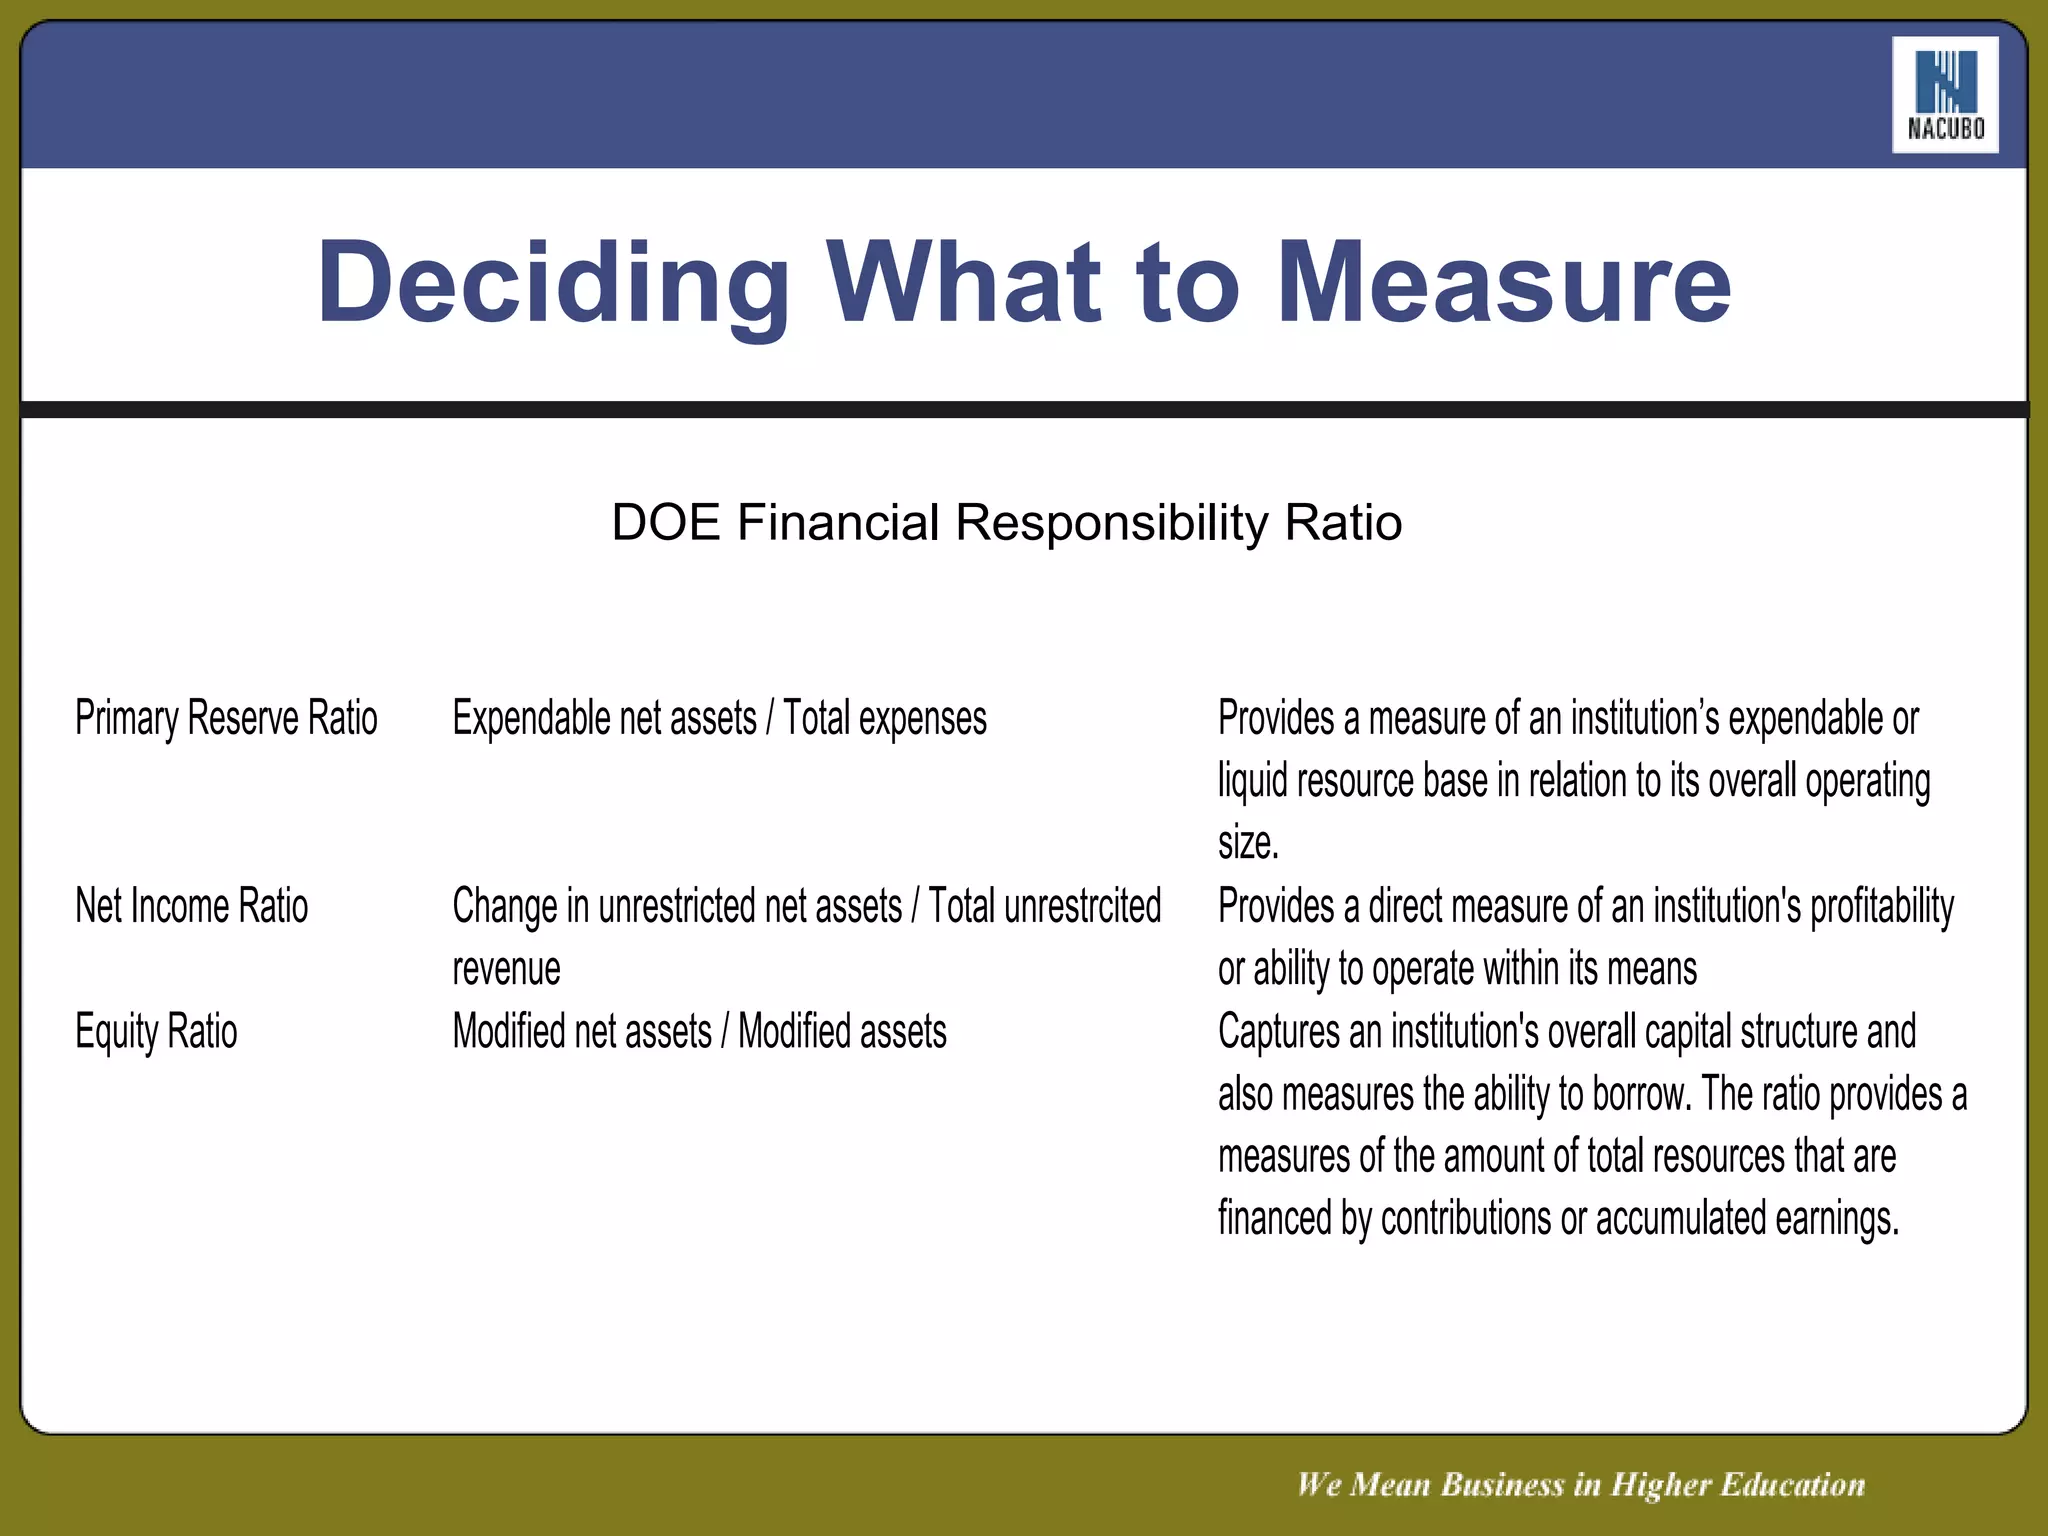
Measuring What Matters Key Performance Indicator Dashboards and Benchmarking for Higher Education Nicholas J. Wallace, CPA Capin Crouse LLP
AGENDA Introduction – The Case for Communication Principles of Effectiveness Dashboards Benchmarking
The Case For Good Communication " NEW TUITION CHALLENGES AT MANY U.S. PRIVATE UNIVERSITIES ” Moody’s Investors Service 2009 “ FINANCIAL CLIMATE CHANGE ” NACUBO Business Officer, January 2010
The Case For Good Communication " TIME TO REGROUP ” NACUBO Business Officer, January 2010 “ BUFFETED BY ECONOMIC HEADWINDS ”  NACUBO Business Officer, March 2010
The Case For Good Communication The Chronicle of Higher Education From the issue dated June 12, 2009 “ More Than 100 Colleges Fail Education Department's Test of Financial Strength” 5 schools have actually closed since that time
The Case For Good Communication “ 61% Have Less Than 3 Months of Cash Months of Cash Available”. “ Of the 61%, 12% have no cash available. What constitutes a healthy amount of ready cash varies depending upon an organization’s business model and then reliability of its revenue streams.” Source: Nonprofit Finance Fund Survey: America's Nonprofits Brace for Tough 2010
The Case For Good Communication “ WEATHERING TURBULENT TIMES ”  Michael Townsley, NACUBO  2009 “ Turnaraound, Leading Stressed Colleges and Universities to Excellence ”  Martin and Samels Johns Hopkins 2009
The Case For Good Communication “ These colleges reported rising debt loads, continuing deficits, shrinking net assets, falling enrollment, switching investments into fixed assets, and dwindling amounts of cash leading up to their demise.”
The Case For Good Communication “  These conditions are major factors in either the CFI scoring system or in other basic financial measures…If they had tracked their financial trends using these ratios, it would have been apparent that their financial and marketing strategies were failing miserably” WEATHERING TURBULENT TIMES ”  Michael Townsley, NACUBO  2009
Dashboards  What they are: Summarized management information Designed to highlight key performance indicators Arranged in a graphic (sometimes digital) format  Designed to highlight pending problems so that diving into operational details can be avoided — if there is a problem, it will be highlighted “ You see, but you do not observe.” - Sir Arthur Conan Doyle (1859 - 1930),  A Scandal in Bohemia  (Sherlock Holmes)
Dashboards What they are not: Comprehensive reports Indicative of qualitative measures Tools allowing broad conclusions on key issues “ They are ill discoverers that think there is no land, when they can  see nothing but sea.” -  Sir Francis Bacon (1561-1626)
Provide concise analysis derived from available data. Narrow the focus to important issues and key areas. Explain trends, benchmarks, and targets clearly. Demonstrate the impact on decision making. Stimulate questions that explore issues beyond the data alone. Ground Rules for Dashboards
Understanding the context Perceiving the data Making it understood Presenting the data Getting the right data Procuring the data Steps for Effective Dashboards
Understanding the Context Without sufficient context, more data does not equal more understanding. Three key questions to ask when collecting data: What are the high priority functions critical to the success of the success of the institution? What types of measurement (volume, timeliness, customer satisfaction) are most important?
Understanding the Context 3. Are there any measurements that in the past have produced some “surprises” and should be included?
Context Suggestion In front of each report, supply a narrative that explains: The significance of the data and the trends in the data How the data and related trends tie to strategic planning objectives Problems or opportunities the data is highlighting and actionable steps that are being considered or recommended.
Getting the Details Right Closely linked to mission and strategic plan Resolves unanswered questions Relevant to their  level of responsibility Accurate and timely
Data is closely linked to the mission and strategic plan Longwood University   Getting the Details Right
Resolves Unanswered Board-Level Questions: Ratio Map Getting the Details Right
Getting the Details Right Resolving Unanswered Questions Are we solvent? Cash flow adequacy Working capital Primary Reserve Are we efficient? Net operating margin Discount rate Student faculty ratio Are we sustainable? (I do not mean green) Endowment per student Debt per student Deferred maintenance
MARCH MEETING   Student Placement Data  Satisfaction Survey Results OCTOBER MEETING Student Enrollment  Student Quality  (SATs, Average GPA)   Student Diversity  (Racial, Geographic) Diversity of Faculty and Staff  Retention DECEMBER MEETING Strategic Indicators  Financial Ratios MAY MEETING Faculty Salaries  Staff Salaries  Courtesy of Rick Staisloff, College of Notre Dame Getting the Right Data Data is accurate and timely
Presenting   Data Adapted from  Guide to Board Information Systems  by L. Butler (AGB).
Deciding What to Measure Six Approaches: Outcomes Mission as Spine Strategic Initiatives Drivers of Success Risk Factors Service/Resource Matrix Courtesy of  The Nonprofit Dashboard: A Tool for Tracking Progress  by Lawrence M. Butler Available from  www.boardsource.org
Deciding What to Measure Mission as spine example: College x is a challenging and supportive community whose members take responsibility for lifelong inquiry, transformative learning and meaningful service. Supportive Community – Support score on student survey Lifelong Inquiry – percentage of graduates in post – graduate work Meaningful Service – Percentage of graduates in serving professions (Teaching, nursing, etc.)
Deciding What to Measure Strategic Initiatives Approach: (See NACUBO Performance Measurement Toolkit) 1. Retain high quality, diverse faculty  Metric  Potential Sources  Percent of faculty tenured  IPEDS  Competitive salaries  CUPA;AAUP  Faculty and student surveys  HERI;NSSE; CCSSE  Faculty diversity statistics  CDS, IPEDS
Deciding What to Measure Drivers of success approach: Admission/Acceptance rate Matriculation rate Retention rate Student/Faculty Ratio SAT scores of entering freshman Faculty compensation Faculty degree status (percentage with Phd) Graduation rates Discount rate Endowment per student Alumni giving rate Composite Financial Index
Deciding What to Measure
Deciding What to Measure DOE Financial Responsibility Ratio
Cool trumps useful – Be sure that the actual business use remains the primary focus. More is better – Fewer key performance indicators are better than more. Lack of relation between strategy and action – Keep the data focused on information users can actually act upon. Misunderstanding the difference between real changes in data and reporting anomalies like timing of data. Presenting Data:  Common Pitfalls
A purposeful comparison against an internal or external individual or group.  The comparison is qualitative, quantitative, or both. It is based on the desire to be “typical,” “better,” or “best.” What is Benchmarking?
Maintain financial viability Demonstrate accountability Operate strategically Plan realistically Allocate resources appropriately Support decision making Assess outcomes Participants in CIC/AIR/NCES Management Institute, 2002-2004 Key Challenges Facing Most NPOs: The Need for Benchmarking
Costs Time, money  Organizational friction   Benefits Mission focused Frame for reflection Fact-based function Comprehensive view Reinforces performance Reality based Historically valid Cost vs. Benefit
Competitive situation   Financial viability at risk  Money and donors scarce Sales and services competitive Complex environment Accountability Transparency Raised public expectations  of leadership Why Benchmark Now?
Audit your situation Select measures Form groups  Collect data Monitor outcomes  Use results Adjust process Steps in Benchmarking
Primary Factors Demographics Location/region Financial structure Relative size Secondary Factors Religious affiliation/ownership Program functions  Selecting a Comparison Group
Is there a proven track record of success for this benchmark? Are the results sustainable? Can the idea or practice be replicated in your context? Does it help you achieve your mission? From  Benchmarking for Nonprofits: How to Measure, Manage, and Improve Performance  by Jason Saul (Fieldstone Alliance Publishing Center) Guiding Principles for Best Practices
CIC (Council of Independent Colleges) Financial Indicators Tool (FIT) and Key Indicators Tool (KIT) Current Examples Used
Current Examples Used
Current Examples Used Institution Survey Most Critical Indicator Rankings Most frequently used measures from the APC project group's independent research how the category ranked (most critical to report) on the NACUBO performance measurement survey Selectivity Measures  Enrollment Statistics  Quality of Educational Experience
Current Examples Used
The Dark Side Measurement error Misinterpretation of data Incorrect definition of needs Make sure your report is designed for your  institution rather than an a copy of  someone else’s Over reliance on the numbers (you need  supplemental data when questions arise Over reacting to the numbers
Are You Ready? Quick reality check questions: Are your board and top management satisfied with the information they currently receive? Do the board and top managers feel they need more meaningful measures of performance or mission effectiveness? Do the board and top management know what these measures should be? What kind of data is currently being compiled, and could it be used to address these needs? How difficult would it be to provide the data to fuel the desired dashboard measures?
Resources The Nonprofit Dashboard: A Tool for Tracking Progress  by Lawrence M. Butler (Boardsource) Key Success Factors Track Health of the University of Miami, Mary M. Sapp, M. Lewis Temares and David Lieberman Performance Measurement Toolkit , NACUBO Using Performance Measurement to Improve Public and Nonprofit Programs: New Directions for Evaluation  by Kathryn E. Newcomer (Jossey-Bass) Financial Planning and Evaluation for the Nonprofit Organization  by Anthony J. Gambino and Thomas J. Reardon (National Association of Accountants) Benchmarking in Higher Education: Adapting Best Practices to Improve Quality  by Jeffrey W. Alstete (Association for the Study of Higher Education Report no.5)
“ Governance is decision-making, and decisions can be no better than the quality of information available to inform them.” Preface to  Strategic Indicators for Higher Education: Improving Performance  by Barbara E. Taylor and William F. Massy  Conclusion

Nacubo Heaf Speech On Dashboards

  • 1.
    Measuring What MattersKey Performance Indicator Dashboards and Benchmarking for Higher Education Nicholas J. Wallace, CPA Capin Crouse LLP
  • 2.
    AGENDA Introduction –The Case for Communication Principles of Effectiveness Dashboards Benchmarking
  • 3.
    The Case ForGood Communication " NEW TUITION CHALLENGES AT MANY U.S. PRIVATE UNIVERSITIES ” Moody’s Investors Service 2009 “ FINANCIAL CLIMATE CHANGE ” NACUBO Business Officer, January 2010
  • 4.
    The Case ForGood Communication " TIME TO REGROUP ” NACUBO Business Officer, January 2010 “ BUFFETED BY ECONOMIC HEADWINDS ” NACUBO Business Officer, March 2010
  • 5.
    The Case ForGood Communication The Chronicle of Higher Education From the issue dated June 12, 2009 “ More Than 100 Colleges Fail Education Department's Test of Financial Strength” 5 schools have actually closed since that time
  • 6.
    The Case ForGood Communication “ 61% Have Less Than 3 Months of Cash Months of Cash Available”. “ Of the 61%, 12% have no cash available. What constitutes a healthy amount of ready cash varies depending upon an organization’s business model and then reliability of its revenue streams.” Source: Nonprofit Finance Fund Survey: America's Nonprofits Brace for Tough 2010
  • 7.
    The Case ForGood Communication “ WEATHERING TURBULENT TIMES ” Michael Townsley, NACUBO 2009 “ Turnaraound, Leading Stressed Colleges and Universities to Excellence ” Martin and Samels Johns Hopkins 2009
  • 8.
    The Case ForGood Communication “ These colleges reported rising debt loads, continuing deficits, shrinking net assets, falling enrollment, switching investments into fixed assets, and dwindling amounts of cash leading up to their demise.”
  • 9.
    The Case ForGood Communication “ These conditions are major factors in either the CFI scoring system or in other basic financial measures…If they had tracked their financial trends using these ratios, it would have been apparent that their financial and marketing strategies were failing miserably” WEATHERING TURBULENT TIMES ” Michael Townsley, NACUBO 2009
  • 10.
    Dashboards Whatthey are: Summarized management information Designed to highlight key performance indicators Arranged in a graphic (sometimes digital) format Designed to highlight pending problems so that diving into operational details can be avoided — if there is a problem, it will be highlighted “ You see, but you do not observe.” - Sir Arthur Conan Doyle (1859 - 1930), A Scandal in Bohemia (Sherlock Holmes)
  • 11.
    Dashboards What theyare not: Comprehensive reports Indicative of qualitative measures Tools allowing broad conclusions on key issues “ They are ill discoverers that think there is no land, when they can see nothing but sea.” - Sir Francis Bacon (1561-1626)
  • 12.
    Provide concise analysisderived from available data. Narrow the focus to important issues and key areas. Explain trends, benchmarks, and targets clearly. Demonstrate the impact on decision making. Stimulate questions that explore issues beyond the data alone. Ground Rules for Dashboards
  • 13.
    Understanding the contextPerceiving the data Making it understood Presenting the data Getting the right data Procuring the data Steps for Effective Dashboards
  • 14.
    Understanding the ContextWithout sufficient context, more data does not equal more understanding. Three key questions to ask when collecting data: What are the high priority functions critical to the success of the success of the institution? What types of measurement (volume, timeliness, customer satisfaction) are most important?
  • 15.
    Understanding the Context3. Are there any measurements that in the past have produced some “surprises” and should be included?
  • 16.
    Context Suggestion Infront of each report, supply a narrative that explains: The significance of the data and the trends in the data How the data and related trends tie to strategic planning objectives Problems or opportunities the data is highlighting and actionable steps that are being considered or recommended.
  • 17.
    Getting the DetailsRight Closely linked to mission and strategic plan Resolves unanswered questions Relevant to their level of responsibility Accurate and timely
  • 18.
    Data is closelylinked to the mission and strategic plan Longwood University Getting the Details Right
  • 19.
    Resolves Unanswered Board-LevelQuestions: Ratio Map Getting the Details Right
  • 20.
    Getting the DetailsRight Resolving Unanswered Questions Are we solvent? Cash flow adequacy Working capital Primary Reserve Are we efficient? Net operating margin Discount rate Student faculty ratio Are we sustainable? (I do not mean green) Endowment per student Debt per student Deferred maintenance
  • 21.
    MARCH MEETING Student Placement Data Satisfaction Survey Results OCTOBER MEETING Student Enrollment Student Quality (SATs, Average GPA) Student Diversity (Racial, Geographic) Diversity of Faculty and Staff Retention DECEMBER MEETING Strategic Indicators Financial Ratios MAY MEETING Faculty Salaries Staff Salaries Courtesy of Rick Staisloff, College of Notre Dame Getting the Right Data Data is accurate and timely
  • 22.
    Presenting Data Adapted from Guide to Board Information Systems by L. Butler (AGB).
  • 23.
    Deciding What toMeasure Six Approaches: Outcomes Mission as Spine Strategic Initiatives Drivers of Success Risk Factors Service/Resource Matrix Courtesy of The Nonprofit Dashboard: A Tool for Tracking Progress by Lawrence M. Butler Available from www.boardsource.org
  • 24.
    Deciding What toMeasure Mission as spine example: College x is a challenging and supportive community whose members take responsibility for lifelong inquiry, transformative learning and meaningful service. Supportive Community – Support score on student survey Lifelong Inquiry – percentage of graduates in post – graduate work Meaningful Service – Percentage of graduates in serving professions (Teaching, nursing, etc.)
  • 25.
    Deciding What toMeasure Strategic Initiatives Approach: (See NACUBO Performance Measurement Toolkit) 1. Retain high quality, diverse faculty Metric Potential Sources Percent of faculty tenured IPEDS Competitive salaries CUPA;AAUP Faculty and student surveys HERI;NSSE; CCSSE Faculty diversity statistics CDS, IPEDS
  • 26.
    Deciding What toMeasure Drivers of success approach: Admission/Acceptance rate Matriculation rate Retention rate Student/Faculty Ratio SAT scores of entering freshman Faculty compensation Faculty degree status (percentage with Phd) Graduation rates Discount rate Endowment per student Alumni giving rate Composite Financial Index
  • 27.
  • 28.
    Deciding What toMeasure DOE Financial Responsibility Ratio
  • 29.
    Cool trumps useful– Be sure that the actual business use remains the primary focus. More is better – Fewer key performance indicators are better than more. Lack of relation between strategy and action – Keep the data focused on information users can actually act upon. Misunderstanding the difference between real changes in data and reporting anomalies like timing of data. Presenting Data: Common Pitfalls
  • 30.
    A purposeful comparisonagainst an internal or external individual or group. The comparison is qualitative, quantitative, or both. It is based on the desire to be “typical,” “better,” or “best.” What is Benchmarking?
  • 31.
    Maintain financial viabilityDemonstrate accountability Operate strategically Plan realistically Allocate resources appropriately Support decision making Assess outcomes Participants in CIC/AIR/NCES Management Institute, 2002-2004 Key Challenges Facing Most NPOs: The Need for Benchmarking
  • 32.
    Costs Time, money Organizational friction Benefits Mission focused Frame for reflection Fact-based function Comprehensive view Reinforces performance Reality based Historically valid Cost vs. Benefit
  • 33.
    Competitive situation Financial viability at risk Money and donors scarce Sales and services competitive Complex environment Accountability Transparency Raised public expectations of leadership Why Benchmark Now?
  • 34.
    Audit your situationSelect measures Form groups Collect data Monitor outcomes Use results Adjust process Steps in Benchmarking
  • 35.
    Primary Factors DemographicsLocation/region Financial structure Relative size Secondary Factors Religious affiliation/ownership Program functions Selecting a Comparison Group
  • 36.
    Is there aproven track record of success for this benchmark? Are the results sustainable? Can the idea or practice be replicated in your context? Does it help you achieve your mission? From Benchmarking for Nonprofits: How to Measure, Manage, and Improve Performance by Jason Saul (Fieldstone Alliance Publishing Center) Guiding Principles for Best Practices
  • 37.
    CIC (Council ofIndependent Colleges) Financial Indicators Tool (FIT) and Key Indicators Tool (KIT) Current Examples Used
  • 38.
  • 39.
    Current Examples UsedInstitution Survey Most Critical Indicator Rankings Most frequently used measures from the APC project group's independent research how the category ranked (most critical to report) on the NACUBO performance measurement survey Selectivity Measures Enrollment Statistics Quality of Educational Experience
  • 40.
  • 41.
    The Dark SideMeasurement error Misinterpretation of data Incorrect definition of needs Make sure your report is designed for your institution rather than an a copy of someone else’s Over reliance on the numbers (you need supplemental data when questions arise Over reacting to the numbers
  • 42.
    Are You Ready?Quick reality check questions: Are your board and top management satisfied with the information they currently receive? Do the board and top managers feel they need more meaningful measures of performance or mission effectiveness? Do the board and top management know what these measures should be? What kind of data is currently being compiled, and could it be used to address these needs? How difficult would it be to provide the data to fuel the desired dashboard measures?
  • 43.
    Resources The NonprofitDashboard: A Tool for Tracking Progress by Lawrence M. Butler (Boardsource) Key Success Factors Track Health of the University of Miami, Mary M. Sapp, M. Lewis Temares and David Lieberman Performance Measurement Toolkit , NACUBO Using Performance Measurement to Improve Public and Nonprofit Programs: New Directions for Evaluation by Kathryn E. Newcomer (Jossey-Bass) Financial Planning and Evaluation for the Nonprofit Organization by Anthony J. Gambino and Thomas J. Reardon (National Association of Accountants) Benchmarking in Higher Education: Adapting Best Practices to Improve Quality by Jeffrey W. Alstete (Association for the Study of Higher Education Report no.5)
  • 44.
    “ Governance isdecision-making, and decisions can be no better than the quality of information available to inform them.” Preface to Strategic Indicators for Higher Education: Improving Performance by Barbara E. Taylor and William F. Massy Conclusion

Editor's Notes

  • #23 Graphic Display: Use Two Graphic Display Techniques…Highlighting and Warning Light Systems Tell a Story: Depends on the urgency of the situation (Urgent = Short and to the point, Not Urgent = Encourages board exploration and questions to draw conclusions.) Comparative Context: Board asks…compared to what? Internal goals?, external benchmarks? Industry established norms? Trends?
  • #24 Outcomes: Regular tracking of the extent to which program participants experience the benefits or changes intended (Measuring Program Outcomes, A Practical Approach, United Way of America Different from Inputs (budgets spent, hours taught), Activities, (number of courses, number of majors), and Outputs (degrees awarded, faculty authored publications, etc.) Regulatory, crediting and funding agencies all expecting higher levels of discipline with regard to outcome definition and measurement Mission as spine just takes key phrases in the mission statement and breaks them down, then looks for relevant measures against them
  • #25 Outcomes: Regular tracking of the extent to which program participants experience the benefits or changes intended (Measuring Program Outcomes, A Practical Approach, United Way of America Different from Inputs (budgets spent, hours taught), Activities, (number of courses, number of majors), and Outputs (degrees awarded, faculty authored publications, etc.) Regulatory, crediting and funding agencies all expecting higher levels of discipline with regard to outcome definition and measurement Mission as spine just takes key phrases in the mission statement and breaks them down, then looks for relevant measures against them
  • #26 Outcomes: Regular tracking of the extent to which program participants experience the benefits or changes intended (Measuring Program Outcomes, A Practical Approach, United Way of America Different from Inputs (budgets spent, hours taught), Activities, (number of courses, number of majors), and Outputs (degrees awarded, faculty authored publications, etc.) Regulatory, crediting and funding agencies all expecting higher levels of discipline with regard to outcome definition and measurement Mission as spine just takes key phrases in the mission statement and breaks them down, then looks for relevant measures against them
  • #27 Outcomes: Regular tracking of the extent to which program participants experience the benefits or changes intended (Measuring Program Outcomes, A Practical Approach, United Way of America Different from Inputs (budgets spent, hours taught), Activities, (number of courses, number of majors), and Outputs (degrees awarded, faculty authored publications, etc.) Regulatory, crediting and funding agencies all expecting higher levels of discipline with regard to outcome definition and measurement Mission as spine just takes key phrases in the mission statement and breaks them down, then looks for relevant measures against them
  • #28 Outcomes: Regular tracking of the extent to which program participants experience the benefits or changes intended (Measuring Program Outcomes, A Practical Approach, United Way of America Different from Inputs (budgets spent, hours taught), Activities, (number of courses, number of majors), and Outputs (degrees awarded, faculty authored publications, etc.) Regulatory, crediting and funding agencies all expecting higher levels of discipline with regard to outcome definition and measurement Mission as spine just takes key phrases in the mission statement and breaks them down, then looks for relevant measures against them