Download as PDF, PPTX


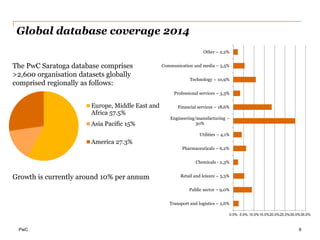


The document summarizes PwC Saratoga's approach to measuring HR effectiveness through benchmarking metrics. Some key points: - PwC Saratoga has over 30 years of experience benchmarking HR metrics for over 16,000 organizations globally. - They measure inputs like costs, outputs like productivity, and HR delivery metrics to evaluate functions like recruiting, learning & development, and retention. - Organizations use the benchmarks to improve strategy, identify best practices, set targets, and demonstrate their competitiveness to leadership. - PwC Saratoga proposes launching their benchmarking survey in Mongolia to provide the first HR metrics benchmarks for organizations there.


