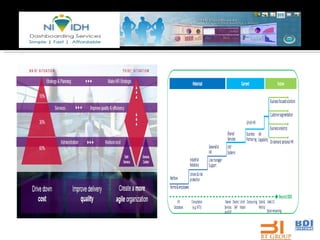
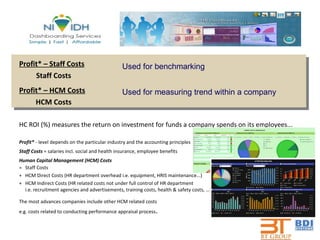
![MEASURES MONITOR PLAN OUTCOMES Completion, attendance ratios Program, certification expenses Activity profitability Performance outcome ratios Satisfaction ratings ... ROI per employee Headcount cost Headcount variance Requisition fulfillment cycle time Termination cost per employee Termination cost Turnover rate Absence rate Accident rate Exposure hours Accept ratio Agency effectiveness Cost to hire Vacation days balance Vacation days entitlement Performance review result Contribution factor Maintained qualification count Review result Scarcity level Succession percentage Training % of revenue … . Annual compensation Benefit plan enrollment Compensation % increase Increase Variance ]Customer service award variance Dependant count Employee, Employer contribution Employee opt out ratio Incentive award Hourly pay rate … . Absence days count Accident Severity Rate Accident Lost time Rate High Performance ratio Low Performance ratio Employee Development cost Development cost per employee High Performance turnover rate Incentive Pool variance Benefit cost per employee Merit Pool Variance increase variance count termination rate FTE count Human capital ROI Time to hire Turnover rate .... Headcount, Planning Compensation & Salary Planning Improve Growth and Profitability Headcount & Turnover Compensation, Incentive Performance, Succession Recruiting , Absence & Accident Analysis Learning Management Benefits Planning Restructuring planning Payroll & Reconciliation Analysis Payroll Liability Planning Recruitment Planning Trained, certified headcount Investment factors Training cost factors Revenue/expense ratios](https://image.slidesharecdn.com/nividhhcmbi-111102012532-phpapp02/85/Nividh-Hcm-BI-15-320.jpg)
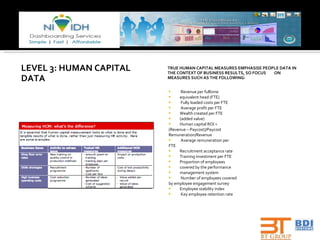
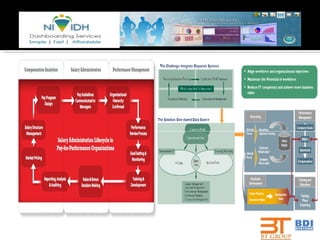
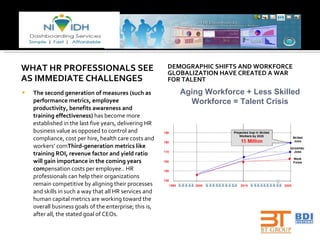
![“ Talent management of more senior workforce contributors to ensure organizations organically grow future workers with similar work ethics, values, morals, culture and passionate contribution. HR metrics tools must measure employee value and contribution towards the businesses success so future workers can be measured against such a standard of success.” “ I believe that as HR metrics become standardized, business intelligence models currently applied primarily in marketing, customer service and finance will begin to find their way into the HR department and the HRMS data repository. That information will then be pushed out to line managers in the form of dashboards and scorecards, which will assist in the overall health and development of the Organisation” Sales – Vipul Sharma +91-9483-265110 [email_address] , [email_address] [email_address] COST SAVINGS: Moving to a service center approach shows the strongest streamlining and cost savings Evaluate the potential for hosted services FUTURE: Specifically focus on talent management Educate yourselves on analytics Focus on improving the user experience](https://image.slidesharecdn.com/nividhhcmbi-111102012532-phpapp02/85/Nividh-Hcm-BI-25-320.jpg)

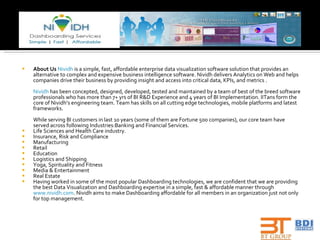
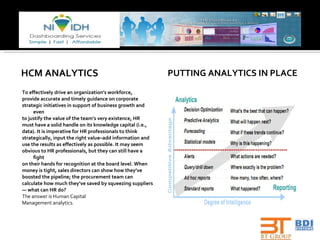
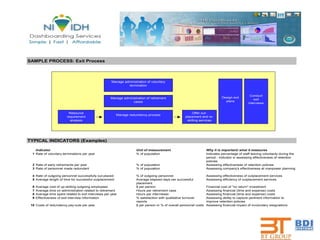
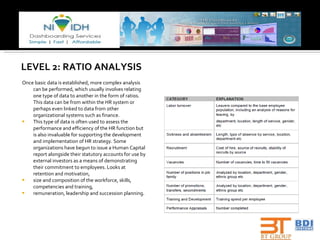
The document discusses human capital measurement and return on investment in human capital. It notes that human capital measurement can help demonstrate the value that employees contribute to an organization. The first step is to identify metrics that are linked to wider business objectives. It also discusses the importance of talent management and using analytics to effectively manage the workforce and drive organizational performance.


![HR Joins the Analytics Revolution [REPORT]](https://cdn.slidesharecdn.com/ss_thumbnails/visier-hbr-hr-joins-the-analytics-revolution-150301132749-conversion-gate01-thumbnail.jpg?width=640&height=640&fit=bounds)


