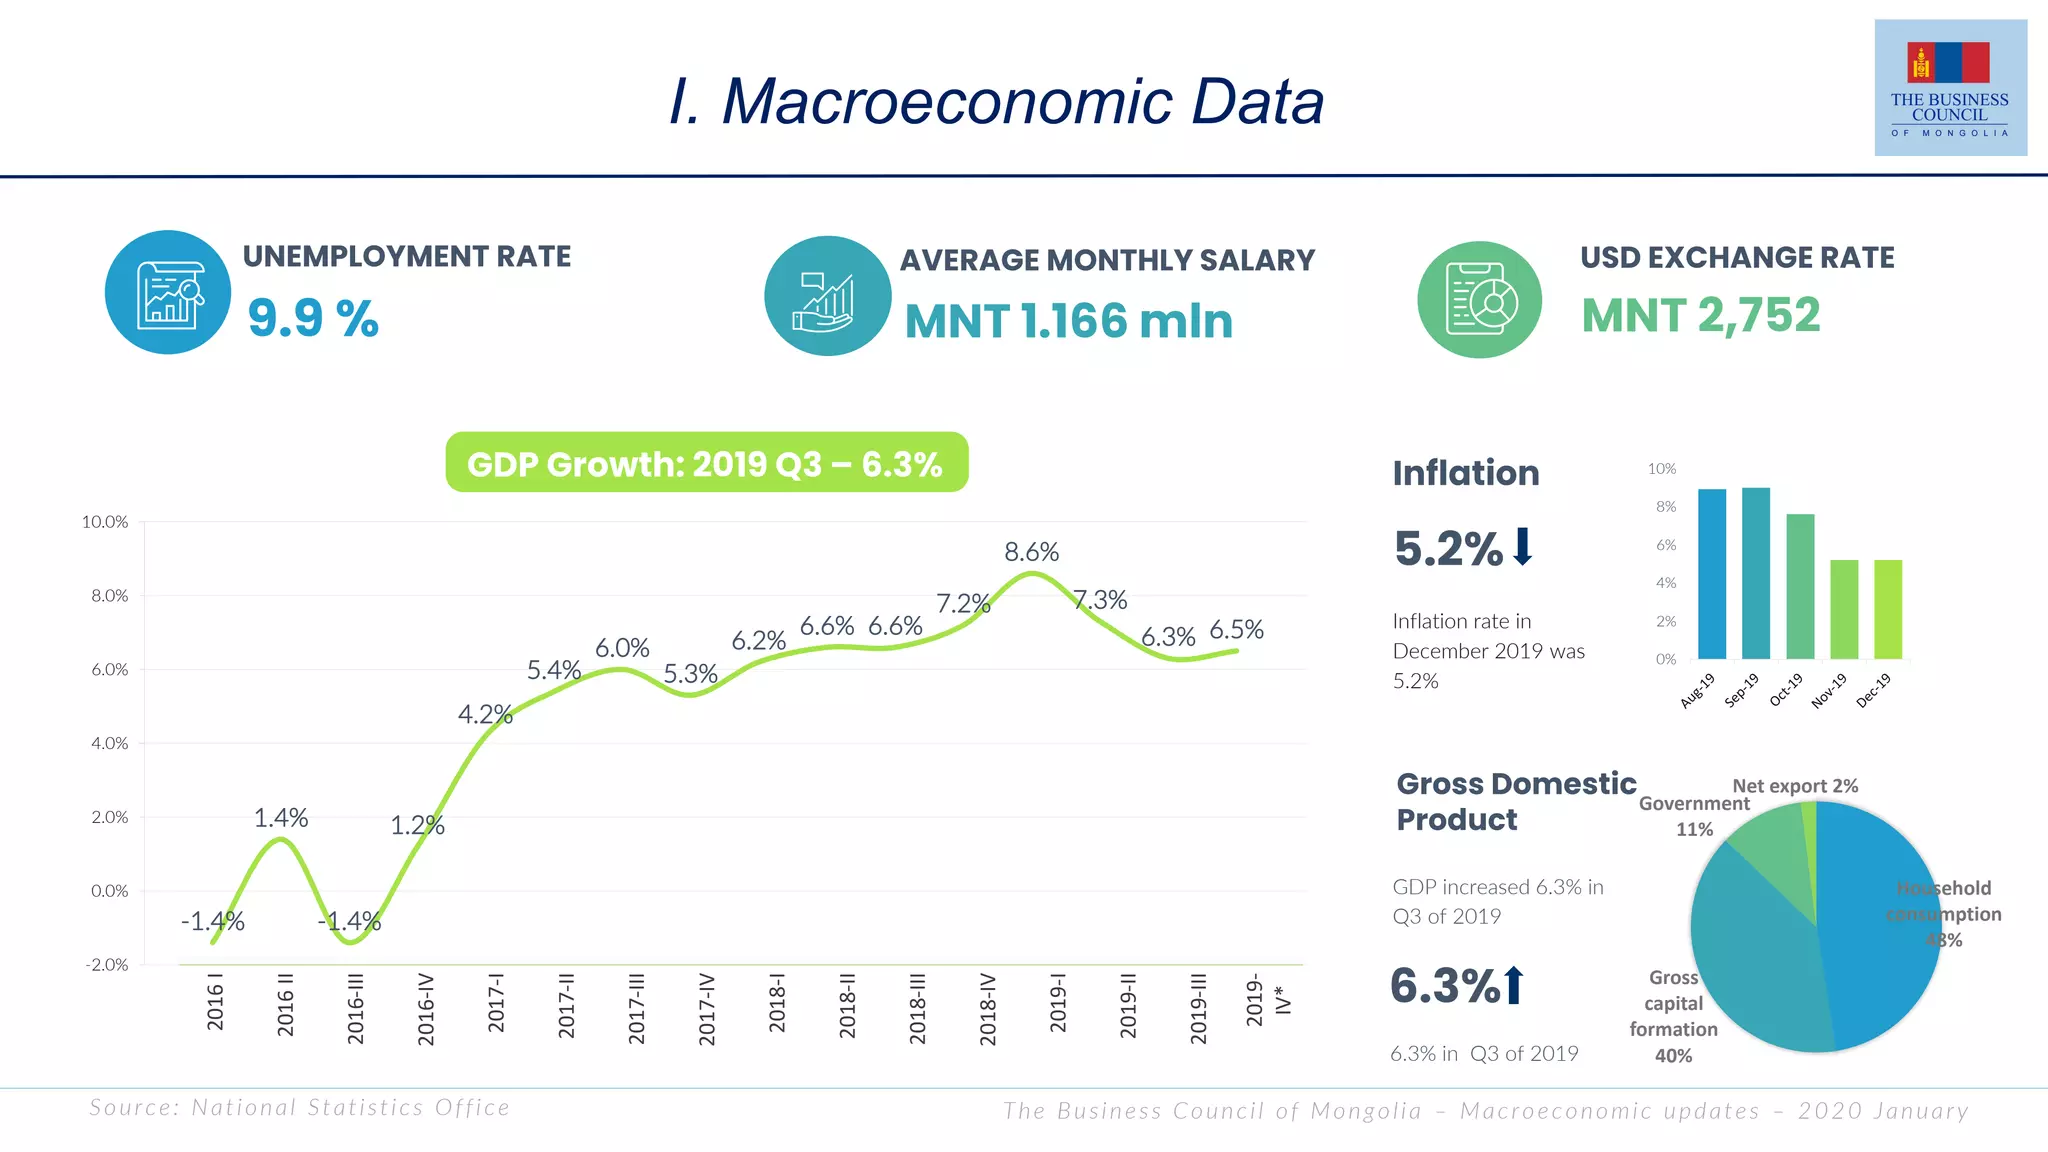
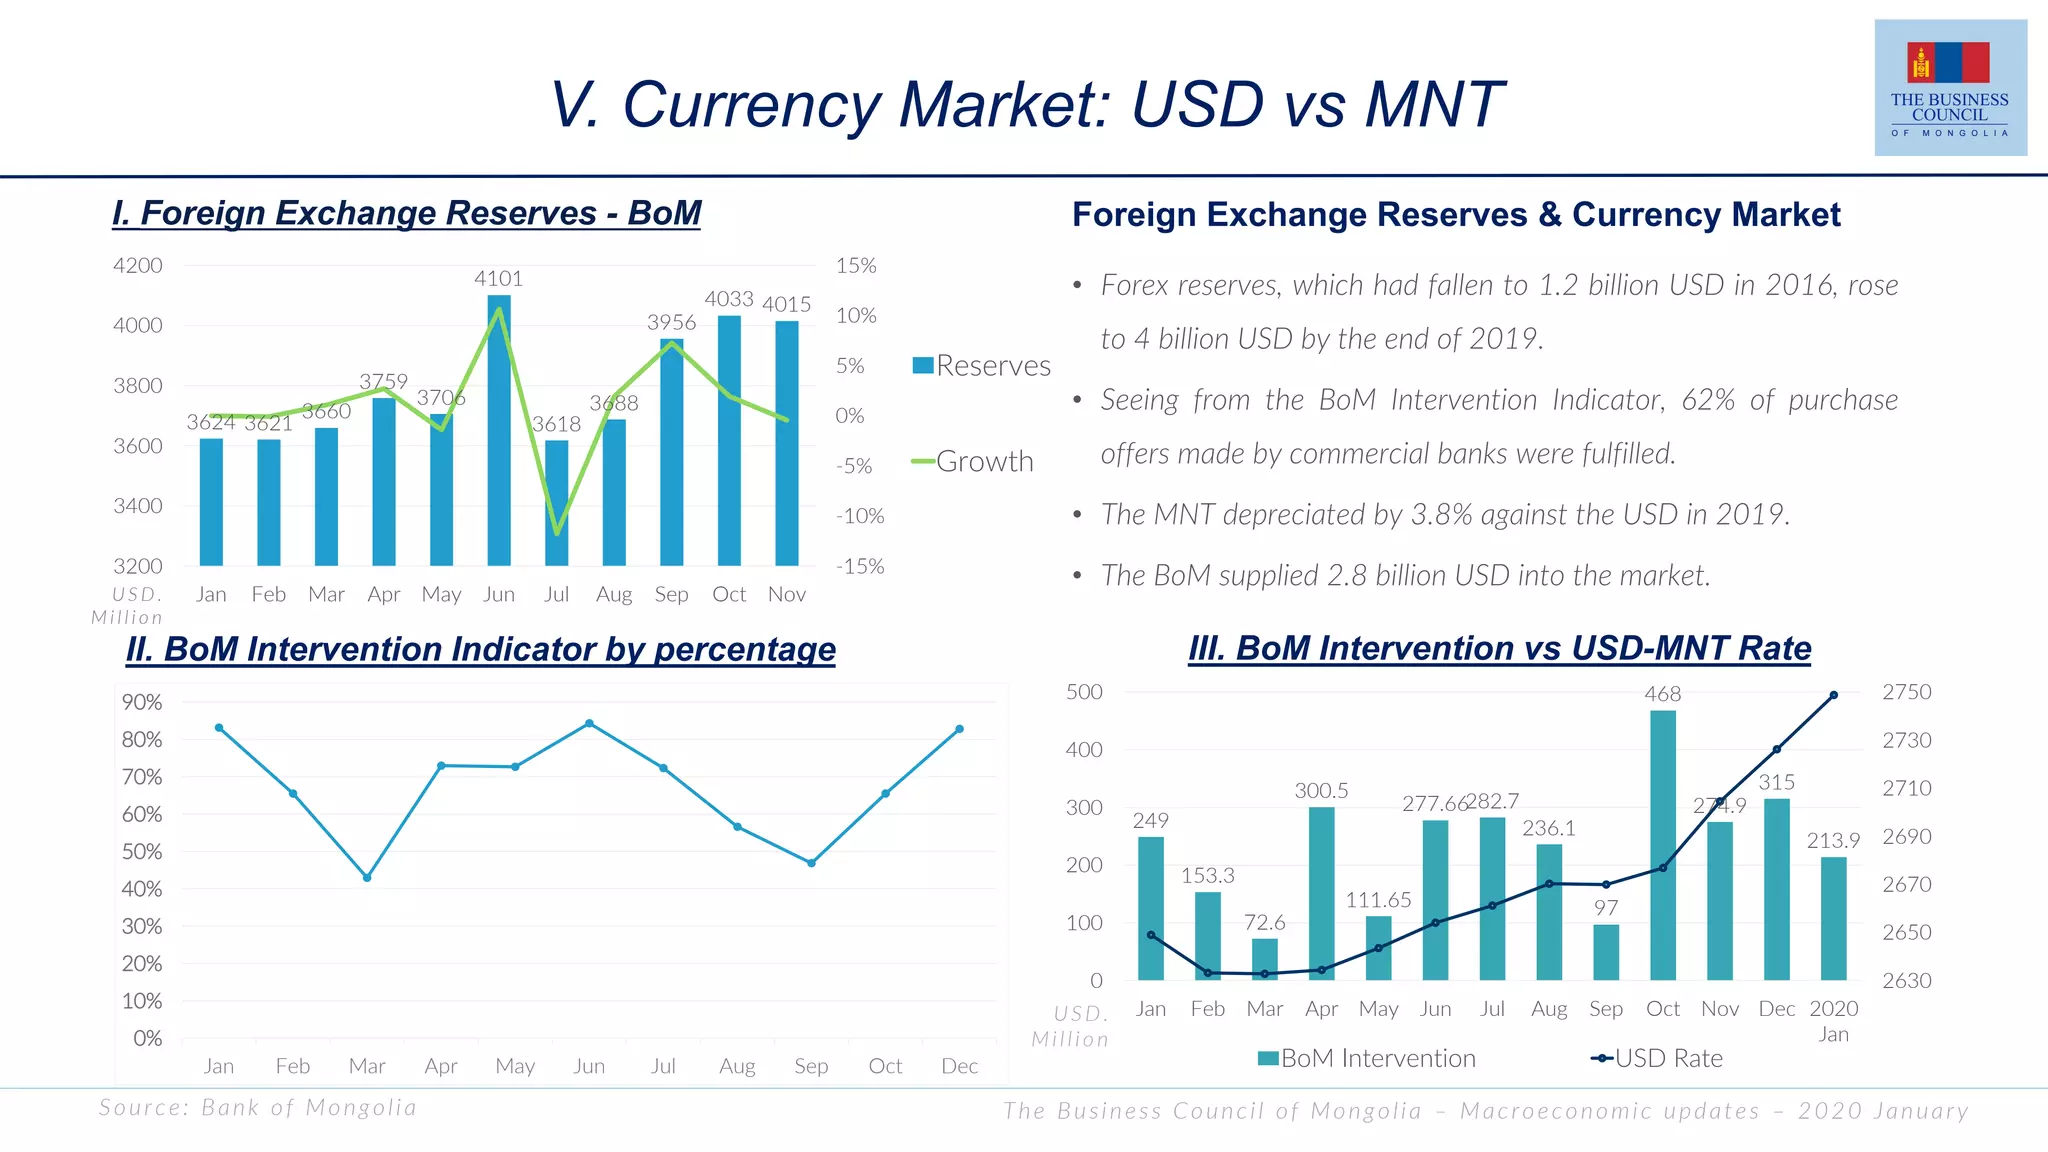
The Business Council of Mongolia published its January 2020 Macroeconomic Updates report which contained the following key points:
1) Mongolia's GDP grew 6.3% in Q3 2019 while inflation was at 5.2% in December 2019. Exports reached a historic high of $7.6 billion in 2019, driven by record coal exports.
2) Foreign direct investment in Mongolia totaled $21.5 billion as of 2019, with the majority from Canada, China, Singapore, and Luxembourg invested mainly in mining.
3) The Mongolian currency, the togrog, depreciated 3.8% against the US dollar in 2019 as the central bank supplied $2.
The saturday economist uk economic outlook march 2016John Ashcroft
The Saturday Economist : UK Economic Outlook March 2016, Drink with me to days gone by : Service Sector (Leisure Sector) continues to drive output in the UK economy, We expect GDP growth of 2.6% this year slowing to 2.5% in 2017.
The Saturday Economist UK Economic Outlook December 2015John Ashcroft
The Saturday Economist, UK Economic Outlook December 2015 is out now. We have lowered our forecasts for growth in 2015 and 2016. Check out over twenty pages of analysis
The Saturday Economist, UK Economic Outlook June 2016John Ashcroft
Growth in 2015 was 2.3% down from 2.9% in 2014. We now expect growth of 2.2% in 2016 … following the disappointing performance of manufacturing and construction in the first quarter.
The inflation outlook is still muted, with the fall in world oil, energy, food and commodity prices continuing to dominate headline inflation.
The UK economy grew by 2.0% in the first quarter, revisions to construction and manufacturing growth pulling total output lower. The service sector continues to drive growth.
In this June economics update we forecast world growth of 3.2% in 2016 up from 3.1% in 2015. UK Inflation will average just 0.3%, CPI basis, over the balance of the year 2016. Unemployment will continue to fall, government borrowing will also fall. The service sector will lead the recovery as manufacturing and construction output falls slightly.
We are forecasting a modest fall in manufacturing of around 0.2% in 2016 with a 0.9% fall in construction activity based on the latest data. The trade figures will continue to disappoint, offset by a further £2 billion oil dividend, despite a moderate oil price recovery. The challenge to the current account following the drop in overseas investment income continues and will present a significant problem to the outlook for sterling over the medium term.
Our forecast is based on a "remain" referendum outcome! .
Slide pack for the Ulster Bank Northern Ireland PMI for August 2015, including analysis of global, Eurozone, UK, UK regions, NI and Republic of Ireland performance by sector
A piaci konszenzusnál erősebben, az OTP Bank Elemzési Központjának előrejelzésénél gyengébben alakult az első negyedéves GDP. Az adat megerősítette az OTP elemzőinek az idei év egészére vonatkozó 4%-os növekedési várakozását, a kockázatok felfelé mutatnak.
2017 T. Rowe Price Global Economic OutlookT. Rowe Price
Our Chief U.S. Economist, Alan Levenson, discusses his perspective on the current global economic environment and what investors could expect to see in 2017.
Read and follow the top economic indicators for Vietnam, M&A activity, and major developments in finance, banking, and legal. Published Monthly with contribution from LNT & Partners Law Firm.
Wastra publications covers analysis of manufacturing ideas in garment industry including how to set up a garment factory, opportunities, insights and trends
Turin Startup Ecosystem 2024 - Ricerca sulle Startup e il Sistema dell'Innov...Quotidiano Piemontese
Turin Startup Ecosystem 2024
Una ricerca de il Club degli Investitori, in collaborazione con ToTeM Torino Tech Map e con il supporto della ESCP Business School e di Growth Capital
how can I sell pi coins after successfully completing KYCDOT TECH
Pi coins is not launched yet in any exchange 💱 this means it's not swappable, the current pi displaying on coin market cap is the iou version of pi. And you can learn all about that on my previous post.
RIGHT NOW THE ONLY WAY you can sell pi coins is through verified pi merchants. A pi merchant is someone who buys pi coins and resell them to exchanges and crypto whales. Looking forward to hold massive quantities of pi coins before the mainnet launch.
This is because pi network is not doing any pre-sale or ico offerings, the only way to get my coins is from buying from miners. So a merchant facilitates the transactions between the miners and these exchanges holding pi.
I and my friends has sold more than 6000 pi coins successfully with this method. I will be happy to share the contact of my personal pi merchant. The one i trade with, if you have your own merchant you can trade with them. For those who are new.
Message: @Pi_vendor_247 on telegram.
I wouldn't advise you selling all percentage of the pi coins. Leave at least a before so its a win win during open mainnet. Have a nice day pioneers ♥️
#kyc #mainnet #picoins #pi #sellpi #piwallet
#pinetwork
What price will pi network be listed on exchangesDOT TECH
The rate at which pi will be listed is practically unknown. But due to speculations surrounding it the predicted rate is tends to be from 30$ — 50$.
So if you are interested in selling your pi network coins at a high rate tho. Or you can't wait till the mainnet launch in 2026. You can easily trade your pi coins with a merchant.
A merchant is someone who buys pi coins from miners and resell them to Investors looking forward to hold massive quantities till mainnet launch.
I will leave the telegram contact of my personal pi vendor to trade with.
@Pi_vendor_247
Empowering the Unbanked: The Vital Role of NBFCs in Promoting Financial Inclu...Vighnesh Shashtri
In India, financial inclusion remains a critical challenge, with a significant portion of the population still unbanked. Non-Banking Financial Companies (NBFCs) have emerged as key players in bridging this gap by providing financial services to those often overlooked by traditional banking institutions. This article delves into how NBFCs are fostering financial inclusion and empowering the unbanked.
What website can I sell pi coins securely.DOT TECH
Currently there are no website or exchange that allow buying or selling of pi coins..
But you can still easily sell pi coins, by reselling it to exchanges/crypto whales interested in holding thousands of pi coins before the mainnet launch.
Who is a pi merchant?
A pi merchant is someone who buys pi coins from miners and resell to these crypto whales and holders of pi..
This is because pi network is not doing any pre-sale. The only way exchanges can get pi is by buying from miners and pi merchants stands in between the miners and the exchanges.
How can I sell my pi coins?
Selling pi coins is really easy, but first you need to migrate to mainnet wallet before you can do that. I will leave the telegram contact of my personal pi merchant to trade with.
Tele-gram.
@Pi_vendor_247
Latino Buying Power - May 2024 Presentation for Latino CaucusDanay Escanaverino
Unlock the potential of Latino Buying Power with this in-depth SlideShare presentation. Explore how the Latino consumer market is transforming the American economy, driven by their significant buying power, entrepreneurial contributions, and growing influence across various sectors.
**Key Sections Covered:**
1. **Economic Impact:** Understand the profound economic impact of Latino consumers on the U.S. economy. Discover how their increasing purchasing power is fueling growth in key industries and contributing to national economic prosperity.
2. **Buying Power:** Dive into detailed analyses of Latino buying power, including its growth trends, key drivers, and projections for the future. Learn how this influential group’s spending habits are shaping market dynamics and creating opportunities for businesses.
3. **Entrepreneurial Contributions:** Explore the entrepreneurial spirit within the Latino community. Examine how Latino-owned businesses are thriving and contributing to job creation, innovation, and economic diversification.
4. **Workforce Statistics:** Gain insights into the role of Latino workers in the American labor market. Review statistics on employment rates, occupational distribution, and the economic contributions of Latino professionals across various industries.
5. **Media Consumption:** Understand the media consumption habits of Latino audiences. Discover their preferences for digital platforms, television, radio, and social media. Learn how these consumption patterns are influencing advertising strategies and media content.
6. **Education:** Examine the educational achievements and challenges within the Latino community. Review statistics on enrollment, graduation rates, and fields of study. Understand the implications of education on economic mobility and workforce readiness.
7. **Home Ownership:** Explore trends in Latino home ownership. Understand the factors driving home buying decisions, the challenges faced by Latino homeowners, and the impact of home ownership on community stability and economic growth.
This SlideShare provides valuable insights for marketers, business owners, policymakers, and anyone interested in the economic influence of the Latino community. By understanding the various facets of Latino buying power, you can effectively engage with this dynamic and growing market segment.
Equip yourself with the knowledge to leverage Latino buying power, tap into their entrepreneurial spirit, and connect with their unique cultural and consumer preferences. Drive your business success by embracing the economic potential of Latino consumers.
**Keywords:** Latino buying power, economic impact, entrepreneurial contributions, workforce statistics, media consumption, education, home ownership, Latino market, Hispanic buying power, Latino purchasing power.
how to sell pi coins effectively (from 50 - 100k pi)DOT TECH
Anywhere in the world, including Africa, America, and Europe, you can sell Pi Network Coins online and receive cash through online payment options.
Pi has not yet been launched on any exchange because we are currently using the confined Mainnet. The planned launch date for Pi is June 28, 2026.
Reselling to investors who want to hold until the mainnet launch in 2026 is currently the sole way to sell.
Consequently, right now. All you need to do is select the right pi network provider.
Who is a pi merchant?
An individual who buys coins from miners on the pi network and resells them to investors hoping to hang onto them until the mainnet is launched is known as a pi merchant.
debuts.
I'll provide you the Telegram username
@Pi_vendor_247
how to swap pi coins to foreign currency withdrawable.DOT TECH
As of my last update, Pi is still in the testing phase and is not tradable on any exchanges.
However, Pi Network has announced plans to launch its Testnet and Mainnet in the future, which may include listing Pi on exchanges.
The current method for selling pi coins involves exchanging them with a pi vendor who purchases pi coins for investment reasons.
If you want to sell your pi coins, reach out to a pi vendor and sell them to anyone looking to sell pi coins from any country around the globe.
Below is the contact information for my personal pi vendor.
Telegram: @Pi_vendor_247
US Economic Outlook - Being Decided - M Capital Group August 2021.pdfpchutichetpong
The U.S. economy is continuing its impressive recovery from the COVID-19 pandemic and not slowing down despite re-occurring bumps. The U.S. savings rate reached its highest ever recorded level at 34% in April 2020 and Americans seem ready to spend. The sectors that had been hurt the most by the pandemic specifically reduced consumer spending, like retail, leisure, hospitality, and travel, are now experiencing massive growth in revenue and job openings.
Could this growth lead to a “Roaring Twenties”? As quickly as the U.S. economy contracted, experiencing a 9.1% drop in economic output relative to the business cycle in Q2 2020, the largest in recorded history, it has rebounded beyond expectations. This surprising growth seems to be fueled by the U.S. government’s aggressive fiscal and monetary policies, and an increase in consumer spending as mobility restrictions are lifted. Unemployment rates between June 2020 and June 2021 decreased by 5.2%, while the demand for labor is increasing, coupled with increasing wages to incentivize Americans to rejoin the labor force. Schools and businesses are expected to fully reopen soon. In parallel, vaccination rates across the country and the world continue to rise, with full vaccination rates of 50% and 14.8% respectively.
However, it is not completely smooth sailing from here. According to M Capital Group, the main risks that threaten the continued growth of the U.S. economy are inflation, unsettled trade relations, and another wave of Covid-19 mutations that could shut down the world again. Have we learned from the past year of COVID-19 and adapted our economy accordingly?
“In order for the U.S. economy to continue growing, whether there is another wave or not, the U.S. needs to focus on diversifying supply chains, supporting business investment, and maintaining consumer spending,” says Grace Feeley, a research analyst at M Capital Group.
While the economic indicators are positive, the risks are coming closer to manifesting and threatening such growth. The new variants spreading throughout the world, Delta, Lambda, and Gamma, are vaccine-resistant and muddy the predictions made about the economy and health of the country. These variants bring back the feeling of uncertainty that has wreaked havoc not only on the stock market but the mindset of people around the world. MCG provides unique insight on how to mitigate these risks to possibly ensure a bright economic future.
what is the future of Pi Network currency.DOT TECH
The future of the Pi cryptocurrency is uncertain, and its success will depend on several factors. Pi is a relatively new cryptocurrency that aims to be user-friendly and accessible to a wide audience. Here are a few key considerations for its future:
Message: @Pi_vendor_247 on telegram if u want to sell PI COINS.
1. Mainnet Launch: As of my last knowledge update in January 2022, Pi was still in the testnet phase. Its success will depend on a successful transition to a mainnet, where actual transactions can take place.
2. User Adoption: Pi's success will be closely tied to user adoption. The more users who join the network and actively participate, the stronger the ecosystem can become.
3. Utility and Use Cases: For a cryptocurrency to thrive, it must offer utility and practical use cases. The Pi team has talked about various applications, including peer-to-peer transactions, smart contracts, and more. The development and implementation of these features will be essential.
4. Regulatory Environment: The regulatory environment for cryptocurrencies is evolving globally. How Pi navigates and complies with regulations in various jurisdictions will significantly impact its future.
5. Technology Development: The Pi network must continue to develop and improve its technology, security, and scalability to compete with established cryptocurrencies.
6. Community Engagement: The Pi community plays a critical role in its future. Engaged users can help build trust and grow the network.
7. Monetization and Sustainability: The Pi team's monetization strategy, such as fees, partnerships, or other revenue sources, will affect its long-term sustainability.
It's essential to approach Pi or any new cryptocurrency with caution and conduct due diligence. Cryptocurrency investments involve risks, and potential rewards can be uncertain. The success and future of Pi will depend on the collective efforts of its team, community, and the broader cryptocurrency market dynamics. It's advisable to stay updated on Pi's development and follow any updates from the official Pi Network website or announcements from the team.
Introduction to Indian Financial System ()Avanish Goel
The financial system of a country is an important tool for economic development of the country, as it helps in creation of wealth by linking savings with investments.
It facilitates the flow of funds form the households (savers) to business firms (investors) to aid in wealth creation and development of both the parties
1. Macroeconomic Updates
January 2020
The Business Council of
Mongolia
The Business Council of Mongolia
Express Tower, 11 Floor
Peace Avenue, Chingeltei District 1
Ulaanbaatar 15160, Mongolia
Office: +976-11-317-027
www.bcmongolia.org
2. I. Macroeconomic Data
-1.4%
1.4%
-1.4%
1.2%
4.2%
5.4%
6.0%
5.3%
6.2%
6.6% 6.6%
7.2%
8.6%
7.3%
6.3% 6.5%
-2.0%
0.0%
2.0%
4.0%
6.0%
8.0%
10.0%
2016I
2016II
2016-III
2016-IV
2017-I
2017-II
2017-III
2017-IV
2018-I
2018-II
2018-III
2018-IV
2019-I
2019-II
2019-III
2019-
IV*
0%
2%
4%
6%
8%
10%
Inflation rate in
December 2019 was
5.2%
Household
consumption
48%
Gross
capital
formation
40%
Government
11%
Net export 2%
GDP increased 6.3% in
Q3 of 2019
6.3% in Q3 of 2019
Source: National Statistics Office The Business Council of Mongolia – Macroeconomic updates – 2020 January
3. -2.0
-1.0
0.0
1.0
2.0
3.0
4.0
5.0
6.0
7.0
8.0
2008 2009 2010 2011 2012 2013 2014 2015 2016 2017 2018 2019
Annual Statistics: 2008 - 2019
Export Import Balance
Monthly Export & Import Statistics: Jan-Dec 2019
Foreign Trade: 2008 - 2019
Trade turnover in 2019 reached a historic high, 13.7 billion USD as of
December. Exports amounted to 7.6 billion USD, and imports 6.1 billion
USD, resulting in a trade surplus of almost 1.5 billion USD.
300
400
500
600
700
800
Jan Feb Mar Apr May Jun Jul Aug Sep Oct Nov Dec
Monthly Export and Import Statistics: 2019 Jan-Dec
EXPORT IMPORT
II. Foreign Trade: Export, Import and Balance
Source: National Statistics Office
The highest revenue earned from exports in one month was in August, and
the least in February. As for imports, it gradually rose beginning in February
up until July, after which it falls until October before rising again.
The Business Council of Mongolia – Macroeconomic updates – 2020 January
U S D .
B i l l ion
U S D
M i l l io n
4. KEY COMMODITIES EXPORT REVENUE: 2010-2019
KEY COMMODITIES EXPORT VOLUME: JAN – DEC 2019
0
500
1000
1500
2000
2500
3000
3500
2010 2011 2012 2013 2014 2015 2016 2017 2018 2019
Coal Copper Iron Ore Gold
0
50
100
150
200
250
300
350
400
Jan Feb Mar Apr May Jun Jul Aug Sep Oct Nov Dec
Coal Copper Iron Ore Gold
Source: National Statistics Office The Business Council of Mongolia – Macroeconomic updates – 2020 January
U S D .
M i l l io n
• The vast majority of export revenue comes from mining
products, namely coal, copper, iron ore, and gold.
• These 4 commodities comprise 77% of total exports.
• Coal exports, which had been falling since 2011, reached a
historic high in 2019.
• 2019 export revenues by commodity: Coal – 3.1 billion USD;
Copper – 1.1 billion USD; Iron ore 576 million USD; Gold – 418
million USD.
• Export volume by commodity: 36 mln tons coal; 1.4 mln tons
copper concentrate; 8.4 mln tons iron ore; 9.1 tons gold.
• Export revenue rose between March and August.
III. Key Commodity Exports: Jan-Dec 2019
5. 2163.8 1912.1
3728.3 3654.2 3685.9
2974.7 2784.6
4125.5
3714.7 3709.8
2453.2
1697.3
0
1250
2500
3750
5000
Jan Feb Mar Apr May Jun Jul Aug Sep Oct Nov Dec
117.4 112
132 127.7 135.2 124.9 118.5 114.2
84.4
107.9 118.5 110.9
0
40
80
120
160
Jan Feb Mar Apr May Jun Jul Aug Sep Oct Nov Dec
III. Key Commodity Exports: Jan-Dec 2019
608.6 572.8
890.4
770.3
647.1 625.9
719.6 719.3
580.3 565.2
880.4 868.9
0
300
600
900
1200
Jan Feb Mar Apr May Jun Jul Aug Sep Oct Nov Dec
7%
31%
10%
52%
Gold Copper Iron Ore Coal
KEY COMMODITIES
EXPORT- 2019
Source: National Statistics Office The Business Council of Mongolia – Macroeconomic updates – 2020 January
U S D . M i l l ion
U S D .
M i l l io n
U S D . M i l l ion
6. Most Invested Countries in Mongolia
1. Canada
2. China
CANADA
7.1 billion
USD
.
Most invested Economic sector
Mining &
Exploration, 81%
Wholesale and
retail trade;
maintenance of
cars and
motorcycles, 9%
Finance &
Insurance
Service, 5%
Construction, 5%
IV. Foreign Direct Investment in Mongolia
4. Luxembourg
3. Singapore
-25%
-10%
5%
20%
35%
50%
0.
5,000.
10,000.
15,000.
20,000.
25,000.
2010 2011 2012 2013 2014 2015 2016 2017 2018 2019
Q3
FDI stock FDI Growth
Source: Bank of Mongolia The Business Council of Mongolia – Macroeconomic updates – 2020 January
63% of foreign investment come from 4 countries: Canada, China, Singapore, and
Luxembourg.
CHINA
4.8 billion
USD
.
SINGAPORE
1.6 billion
USD
.
LUXEMBOURG
1.4 billion
USD
.
Since 2010, 21.5 billion USD has been invested in
Mongolia. The vast majority of investment is in
mining, which acounts for 81%, or 15.5 billion
USD. Next is Wholesale and Retail trade, and
maintenance of cars and motorcycles at 9%, or 1.6
billion USD. Third is finance & insurance at 5%, or
1 billion USD. Fourth is construction at 4%, or 0.9
billion USD.
USD .
Millio n
7. I. Foreign Exchange Reserves - BoM
249
153.3
72.6
300.5
111.65
277.66282.7
236.1
97
468
274.9
315
213.9
2630
2650
2670
2690
2710
2730
2750
0
100
200
300
400
500
Jan Feb Mar Apr May Jun Jul Aug Sep Oct Nov Dec 2020
Jan
BoM Intervention USD Rate
3624 3621
3660
3759
3706
4101
3618
3688
3956
4033 4015
-15%
-10%
-5%
0%
5%
10%
15%
3200
3400
3600
3800
4000
4200
Jan Feb Mar Apr May Jun Jul Aug Sep Oct Nov
Reserves
Growth
V. Currency Market: USD vs MNT
0%
10%
20%
30%
40%
50%
60%
70%
80%
90%
Jan Feb Mar Apr May Jun Jul Aug Sep Oct Dec
• Forex reserves, which had fallen to 1.2 billion USD in 2016, rose
to 4 billion USD by the end of 2019.
• Seeing from the BoM Intervention Indicator, 62% of purchase
offers made by commercial banks were fulfilled.
• The MNT depreciated by 3.8% against the USD in 2019.
• The BoM supplied 2.8 billion USD into the market.
Source: Bank of Mongolia The Business Council of Mongolia – Macroeconomic updates – 2020 January
II. BoM Intervention Indicator by percentage
Foreign Exchange Reserves & Currency Market
USD .
Millio n
U S D .
M i l l i o n
III. BoM Intervention vs USD-MNT Rate
8. VI. Financial Market Indicators
15,964.1
16,123.9
16,032.9
16,238.4
16,503.5
16,124.9
16,506.516,540.6
16,628.5
16,289.4
16,483.8
16,929.6
Jan Feb Mar Apr May Jun Jul Aug Sep Oct Nov Dec
15,400
15,600
15,800
16,000
16,200
16,400
16,600
16,800
17,000
17,200
Total Savings
19,642 19,582
19,700
19,909
20,300
20,229 20,290
20,476 20,433 20,470 20,479
20,834
10,000
10,500
11,000
11,500
4,500
5,000
5,500
6,000
Jan
Feb
Mar
Apr
May
Jun
Jul
Aug
Sep
Oct
Nov
Dec
By USD By MNT
Citizen's MNT
Savings
Organization's MNT
Savings
For. Currency
Savings
For. Currency
Checking
Foreign
Currency
Savings &
Checking
Money Supply – M2 Total Savings Gross Savings GrowthSaving in MNT Saving in Foreign Currency
Source: Bank of Mongolia The Business Council of Mongolia – Macroeconomic updates – 2020 January
M2
• MNT savings comprise 66%, or 11.1 trillion MNT, of total savings, with the remaining 34%, or
5.8 trillion MNT, in Foreign Currency Savings & Checking.
• Individuals savings account for 9,35 trillion MNT savings, and organizations savings account
for 1,73 trillion MNT.
• M2 money supply rose by 6.9% year-on-year, while total savings rose by 9.62%.
M N T
B i l l i o n
Saving in Foreign
Currency.
Saving in Local
Currency.
10.2%
55.4%
20.5%
13.7%
9. 10.8%
11.2%
11.6%
12.0%
12.4%
16.7%
16.9%
17.1%
17.3%
17.5%
Jan Feb Mar Apr May Jun Jul Aug Sep Oct Nov Dec
MNT Loan Rate MNT Savings Rate
LOAN & SAVINGS RATE: MNT
CAPITAL MARKET: TOP-2O INDEX & TRANSACTIONLOAN VS SAVINGS RATE: USD
4.4%
4.6%
4.8%
5.0%
5.2%
5.4%
8.0%
8.5%
9.0%
9.5%
10.0%
10.5%
11.0%
11.5%
Jan Feb Mar Apr May Jun Jul Aug Sep Oct Nov Dec
USD Loan Rate USD Savings Rate
18,000
18,500
19,000
19,500
20,000
20,500
21,000
21,500
22,000
0
5,000
10,000
15,000
20,000
25,000
30,000
35,000
Jan Feb Mar Apr May Jun Jul Aug Sep Oct Nov Dec
Transaction volume Top-20 Index
VII. Loan & Savings market rates: Jan – Dec 2019
Source: Bank of Mongolia & Mongolian Stock Exchange The Business Council of Mongolia – Macroeconomic updates – 2020 January
I. LOAN & SAVINGS MARKET RATES
• The average interest rate on MNT loans was 17.2% at the beginning of the year, and 16.9% at
year’s end. Average savings rate fell from 12.1% to 11.5% in 2019.
• Interest on USD loans was 10.6%, while the weighted average interest rate on USD savings was
4.8%.
II. CAPITAL MARKET: TOP 20 INDEX & MARKET TRANSACTION
• The MSE Top-20 fell by 13% in 2019 to 19,973. The value of transactions amounted to 158.4
billion MNT in 2019, which was a significant decline from the previous year, when it was 244.1
billion MNT.
KEY HIGHLIGHTS
10. bcmongolia.org @bcmongolia @bcmongolia
Contact
S.Ganzorig
Director of Policy and Planning
Address: Floors 11,
Express Tower, Peace Avenue,
Khoroo 1, Chingeltei District, Ulaanbaatar
Phone: 976-11-317027
Email: ganzorig.s@bcmongolia.org
THE BUSINESS COUNCIL OF MONGOLIA