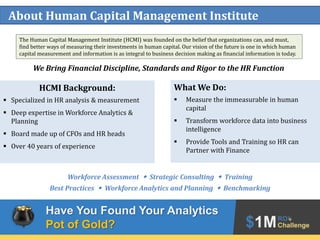
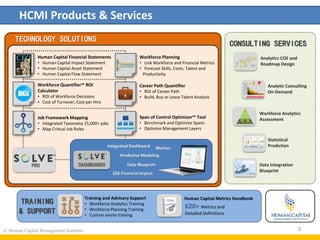
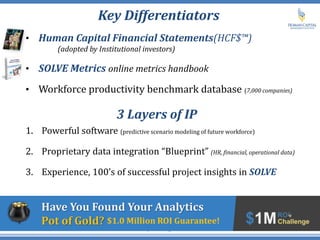
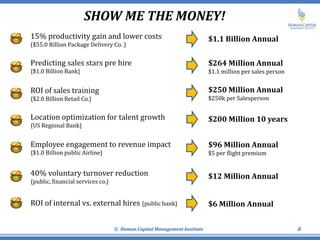
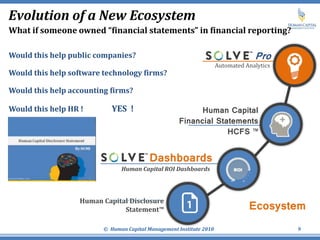
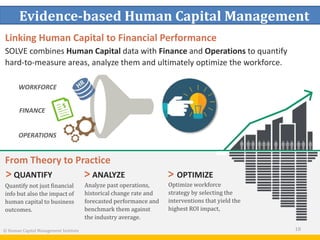
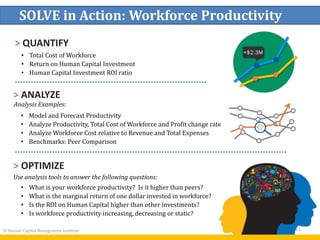
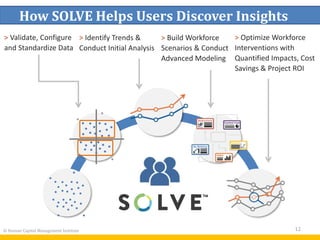
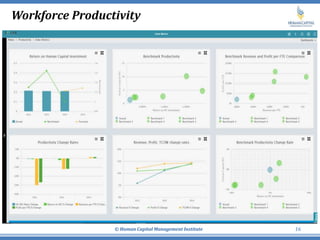
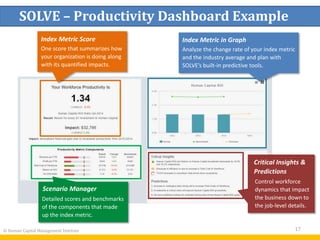
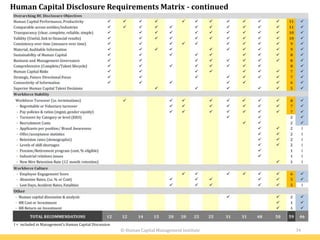
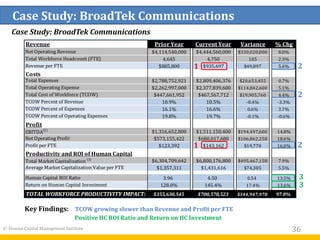
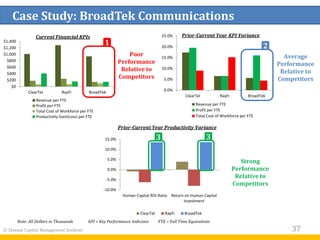
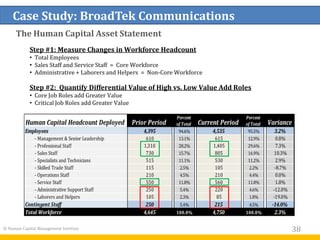
1
HCMI Introduction and Demo -
Aug, 2016
2
About Human Capital Management Institute
HCMI Background:
 Specialized in HR analysis & measurement
 Deep expertise in Workforce Analytics &
Planning
 Board made up of CFOs and HR heads
 Over 40 years of experience
What We Do:
 Measure the immeasurable in human
capital
 Transform workforce data into business
intelligence
 Provide Tools and Training so HR can
Partner with Finance
Workforce Assessment w Strategic Consulting w Training
Best Practices w Workforce Analytics and Planning w Benchmarking
The Human Capital Management Institute (HCMI) was founded on the belief that organizations can, and must,
find better ways of measuring their investments in human capital. Our vision of the future is one in which human
capital measurement and information is as integral to business decision making as financial information is today.
We Bring Financial Discipline, Standards and Rigor to the HR Function
Have You Found Your Analytics
Pot of Gold?
Human Capital Metrics HandbookTraining and Advisory Support
• Workforce Analytics Training
• Workforce Planning Training
• Custom onsite training
HCMI Products & Services
© Human Capital Management Institute 3
620+ Metrics and
Detailed Definitions
Data Integration
Blueprint
Workforce Analytics
Assessment
Analytic Consulting
On-Demand
Analytics COE and
Roadmap Design
Statistical
Prediction
Correlation Coefficient ( 0-1)
Factors Leading to Increased Turnover
Job Title or Position
Dissatisfaction With Compensation
High vs. Low Turnover Manager
Commute Distance
Driver #3
Driver #2
Driver #1
.50
.33
.27
.02
Low
Turnover
Impact
High
Turnover
Impact
Some
Turnover
Impact
.11
Work Location
Number of Jobs in Last 3 Years .70
Hired Through Employee Referral .19
Initial Reports &
Analysis
Data Gathering
First Good
Metrics
HR Data Warehouse
Drill-down,standard reports
ScenarioAnalysis
External
Benchmarking
Context fordecisions
Data
Driven Decision
Making!
Turnover,
Headcount,Hiring
HRISsystem data
COE Formation
Data Errors
HR Analytics
Mandate
HR Standards
EstablishedLost HR
Credibility
HR data/systems
Assessed
HR Data Cleansed
historicaldata scrubbed
Bus. Units
Reject
Analysis
Data Errors
Historical data
still bad
1st Analytics Study
Advanced
Analytic
Studies
HR Analysis
Validated
Integrated HR
Databases
COE Launches
Training
Courses
Bus. Units
Demand
more
Analytics journey steps
Setbacks along the way
Journey path and goal
CONSULTING SERVICES
Integrated Dashboard
DASHBOARDSPRO
TECHNOLOGY SOLUTIONS
Human Capital Financial Statements
• Human Capital Impact Statement
• Human Capital Asset Statement
• Human Capital Flow Statement
Workforce Quantifier™ ROI
Calculator
• ROI of Workforce Decisions
• Cost of Turnover, Cost per Hire
Workforce Planning
• Link Workforce and Financial Metrics
• Forecast Skills, Costs, Talent and
Productivity
Job Framework Mapping
• Integrated Taxonomy 15,000+ jobs
• Map Critical Job Roles
Span of Control Optimizer™ Tool
• Benchmark and Optimize Spans
• Optimize Management Layers
Career Path Quantifier
• ROI of Career Path
• Build, Buy or Lease Talent Analysis
$$$ Financial Impact
Metrics
Data Blueprint
Predictive Modeling
TRAINING
& SUPPORT
Clients Include…
CONFIDENTIAL, DO NOT COPY OR REDISTRIBUTE
Asking the Right Questions
© Human Capital Management Institute 5
What If you could answer the following?
1. What is our workforce productivity? Is it improving? How do we rank?
2. Where do our stars come from in Sales? In Operations? In leaders?
3. Is it better to build, buy or rent talent? What is the right workforce cost?
4. What is the ROI of our training investment in the workforce?
5. Which are the strategic critical roles (game winners) vs. operational critical
roles (keep us in the game)?
6. Do we know drivers of employee turnover? What about employee
engagement and retention drivers?
7. Are leaders effectively managing human capital? Do leaders correlate to
employee engagement, retention and performance?
1. Is our workforce headcount the optimal size and shape?
What about our workforce Cost?
2. What percent of our workforce is customer-facing or
revenue-generating? What is the trend?
3. Is the organization building, buying or renting its’ critical
and core talent?
4. What is our workforce productivity?
5. Is workforce productivity increasing, decreasing or static?
How are we performing versus peers?
6. What is the marginal return of a dollar invested in the
workforce?
7. Is the ROI on Human Capital higher than other investments?
8 Are leaders effectively managing human capital? Do
leaders link to engagement, retention, performance?
9 Where does our best talent come from? Which managers
are the best talent scouts and coaches?
10.What percent of our workforce is highly engaged? Is it
increasing or decreasing?
11.Is there a link between engagement, performance and
productivity?
12.What is our leadership and critical role bench strength?
13.Can we forecast our workforce to optimize cost, profit and
productivity?
25 Key Human Capital Questions
14. What business areas/positions/leaders have the highest
turnover? How do we compare to peers?
15.Are we losing the right people(low performers) or the
wrong people(high performers or critical roles/skills)?
16. What is our regrettable turnover rate? Why is talent
leaving? Is by design or accident?
17. Is the quality and cultural fit of new hires improving? Can
we measure it?
18. Is attracting/recruiting talent impacting growth? What
recruiting source yields the best cultural fit?
19. What is the size and cost of our contingent workforce? Is it
by accident or by design?
20. What part of our workforce costs are increasing the most?
Can we control it better?
21. What is our Total Cost of Workforce as a percent of
revenue? Of expenses? How do we compare to peers?
22. Are we investing the right amount in training? Could
training improve productivity & profitability?
23. If talent is critical is the training investment adqaute to
support the business strategy?
24.Is internal mobility a source of value or not? What percent
of the workforce moves internally each year?
25.What percent of open positions are filled internally? What
percent of management roles?
© Human Capital Management Institute
6
Key Differentiators
© Human Capital Management Institute 7
• Human Capital Financial Statements(HCF$™)
(adopted by Institutional investors)
• SOLVE Metrics online metrics handbook
• Workforce productivity benchmark database (7,000 companies)
3 Layers of IP
1. Powerful software (predictive scenario modeling of future workforce)
2. Proprietary data integration “Blueprint” (HR, financial, operational data)
3. Experience, 100’s of successful project insights in SOLVE
Have You Found Your Analytics
Pot of Gold? $1.0 Million ROI Guarantee!
SHOW ME THE MONEY!
© Human Capital Management Institute 8
• 15% productivity gain and lower costs
($55.0 Billion Package Delivery Co. )
• Predicting sales stars pre hire
{$1.0 Billion Bank}
• ROI of sales training
{$2.0 Billion Retail Co.}
• Location optimization for talent growth
{US Regional Bank}
• Employee engagement to revenue impact
{$1.0 Billion public Airline}
• 40% voluntary turnover reduction
{public, financial services co.}
• ROI of internal vs. external hires {public bank}
$1.1 Billion Annual
$264 Million Annual
$1.1 million per sales person
$250 Million Annual
$250k per Salesperson
$200 Million 10 years
$96 Million Annual
$5 per flight premium
$12 Million Annual
$6 Million Annual
Evolution of a New Ecosystem
© Human Capital Management Institute 2010 9
What if someone owned “financial statements” in financial reporting?
Would this help public companies?
Would this help software technology firms?
Would this help accounting firms?
Would this help HR ! YES !
Human Capital Disclosure
Statement™
Dashboards
Human Capital ROI Dashboards
Human Capital
Financial Statements
HCFS ™
Pro
Automated Analytics
Ecosystem
© Human Capital Management Institute 10
Evidence-based Human Capital Management
> QUANTIFY > ANALYZE > OPTIMIZE
Quantify not just financial
info but also the impact of
human capital to business
outcomes.
Analyze past operations,
historical change rate and
forecasted performance and
benchmark them against
the industry average.
Optimize workforce
strategy by selecting the
interventions that yield the
highest ROI impact,
Linking Human Capital to Financial Performance
From Theory to Practice
SOLVE combines Human Capital data with Finance and Operations to quantify
hard-to-measure areas, analyze them and ultimately optimize the workforce.
OPERATIONS
FINANCE
WORKFORCE
© Human Capital Management Institute 11
SOLVE in Action: Workforce Productivity
> QUANTIFY
> ANALYZE
> OPTIMIZE
• Model and Forecast Productivity
• Analyze Productivity, Total Cost of Workforce and Profit change rate
• Analyze Workforce Cost relative to Revenue and Total Expenses
• Benchmarks: Peer Comparison
Use analysis tools to answer the following questions:
• What is your workforce productivity? Is it higher than peers?
• What is the marginal return of one dollar invested in workforce?
• Is the ROI on Human Capital higher than other investments?
• Is workforce productivity increasing, decreasing or static?
Analysis Examples:
• Total Cost of Workforce
• Return on Human Capital Investment
• Human Capital Investment ROI ratio
© Human Capital Management Institute 12
How SOLVE Helps Users Discover Insights
> Validate, Configure
and Standardize Data
> Identify Trends &
Conduct Initial Analysis
> Build Workforce
Scenarios & Conduct
Advanced Modeling
> Optimize Workforce
Interventions with
Quantified Impacts, Cost
Savings & Project ROI
$-
$200
$400
$600
$800
$1,000
$1,200
$1,400
$1,600
$1,800
$2,000
2015 2016 2017 2018 2019 2020
Millions
TCOW* Calculated vs Strategic Plan
Calculated Strategic Plan
22.0%
10.0%
0%
5%
10%
15%
20%
25%
2016 2017 2018 2019 2020
TCOW* % Change
Calculated Strategic Plan
Variables Status Quo Controlled Growth
Workforce Headcount 12%
Average Employee Salary 8%
Bonus & Incentive Pay (Average) 5%
Total HR Costs 11%
$X,XXX,XXX below
calculated data
$627M GAP v
Calculated Data
© Human Capital Management Institute 13
Example: Forecast Total Cost of Workforce
Status quo
GAP=Labor Cost
growth 22% v
10% Planned
* TCOW= Total Cost of Workforce, aka Total Labor Cost
$-
$200
$400
$600
$800
$1,000
$1,200
$1,400
2015 2016 2017 2018 2019 2020
Millions
TCOW Calculated vs Strategic Plan
Calculated Strategic Plan
10.0%
10.5%
0%
2%
4%
6%
8%
10%
12%
2016 2017 2018 2019 2020
TCOW % Change
Strategic Plan Calculated
Variables Status Quo Controlled Growth
Workforce Headcount 12% 5%
Average Employee Salary 8% 4%
Bonus & Incentive Pay (Average) 5% 2%
Total HR Costs 11% 5%
GAP closed
Strategic Plan
Bottoms up fit
© Human Capital Management Institute 14
Example: Forecast Total Cost of Workforce
Controlled Growth
=Labor Cost
growing at Plan
10% Rate
Changes
SOLVE Demo
© Human Capital Management Institute
Workforce Productivity
© Human Capital Management Institute 16
© Human Capital Management Institute 17
SOLVE – Productivity Dashboard Example
Index Metric Score
One score that summarizes how
your organization is doing along
with its quantified impacts.
Index Metric in Graph
Analyze the change rate of your index metric
and the industry average and plan with
SOLVE’s built-in predictive tools.
Scenario Manager
Detailed scores and benchmarks
of the components that made
up the index metric.
Critical Insights &
Predictions
Control workforce
dynamics that impact
the business down to
the job-level details.
Benefits of Using SOLVE Pro – Functional/Financial
1. Dedicated HCMI analyst for analytics and planning (1 FTE)
2. External benchmarks for Productivity, Recruiting, Learning, Turnover + more
3. Unlimited “What-If” Scenario Modeling capability for “Forecast” metrics
4. Easily Quantify $1.0M+ future “ROI” impacts (i.e. business case)
5. Link HR and Workforce metrics and data to financial results
6. Low Total Cost of ownership with SaaS (1/2 or lower vs. on-premise solutions)
7. Online version of HCMI’s Human Capital Metrics Handbook;
8. Powerful drill down across multiple dimensions for root cause analysis/ reporting
9. Automated preparation of Human Capital Financial Statements
10. On-demand workforce planning for rapid completion of workforce planning
11. Guaranteed pricing at contract rates
© Human Capital Management Institute 18
The Human Capital Disclosure Statement
© Human Capital Management Institute 20
HCMI Background
Jeff Higgins, Founder & CEO Human Capital Management Institute
Jeff is a driving force in Workforce analytics at leading companies who
transform workforce data into a source of value creation via planning and
predictive modeling.
With his unique combination of experience as both a senior HR executive and
former CFO, Jeff helps organizations around the world rapidly advance their
analytics & workforce planning journey.
He is a regular speaker at HR events, a member of the Human Capital
Institute National Advisory Council on Talent Leadership and a founding
member of the PwC Saratoga Institute advisory council on metrics.
• HCMI has been focused on workforce productivity since 2009. In 2010 a client asked if
human capital data could be presented in reports like financial statements. Thus began
a journey to Human Capital Financial Statements (HCFS™).
• After 5 years, working with over 100 organizations, and creating the world’s largest
workforce productivity database, we have distilled the complexity of human capital
reporting into a single document called a “Human Capital Disclosure Statement.”
Why Should we Bother with Workforce Productivity
© Human Capital Management Institute
21
• Institutional Investors are demanding it
• Being utilized by a growing number of
forward looking S&P 500 organizations
• Dow Jones Sustainability Index adopted
Human Capital ROI Ratio in 2014
(over 900 companies submitted for 2014)
Dow Jones Sustainability
Index (DJSI)
22
Introduction to Productivity
© Human Capital Management Institute
…and Human
Capital ROI ratio is
downright awful.
+21.8%
(19.0%)
REVENUE
Great Revenue
per FTE growth!
Do you know your
workforce
productivity?
But Return on
Human Capital
Investment is bad…
(29.2%)
1
2
Example: Investment Banking Sector, 1996-2012
The Workforce Productivity Paradox
3
Metrics
Profit per FTE
Revenue per FTE
Human Capital ROI Ratio
Return on Human Capital
Investment
Total Cost of Workforce
Percent of Operating
Expense
Total Cost of Workforce
Percent of Revenue
Human Capital Metrics Drive Stock Price
© Human Capital Management Institute 24
The top 25% of companies improved HC metrics by
51%, driving 4.0% average annual stock price
gains (CAGR) and 66.0% overall
-7.0%
0.4%
9.8%
-2.7%
5.7%
25.4%
10.9%
12.9%
26.2%
14.8%
19.9%
28.0%
-10%
-5%
0%
5%
10%
15%
20%
25%
30%
Low-Performers Mid-Performers Top Performers
Human Capital ROI Ratio Return on Human Capital Investment
Stock Price Market Value (Capitalization)
Human Capital Metrics and Market Performance
© Human Capital Management Institute 25
Top quartile companies improved workforce productivity 9.8% & 25.4% annually,
seeing 26.2% annual stock price gains, double the market average improvement
Top QuartileBottom Quartile 25th to 75th
Percentile
Human Capital and Market Capitalization, Financial Services, October, 2015
Financial Services Industry
Change Rates (CAGR) 2012-2014
26
What is in the Human Capital Disclosure Statement
© Human Capital Management Institute
1. Human Capital Impact
1. Income Statement
2. Cash Flow Statement
3. Balance Sheet
Traditional Financial
Statements
Human Capital Disclosure Statement
3. Human Capital Cost
2. Human Capital Flow
Examples:
• Total Cost of Workforce (TCOW)
• Productivity Impact
• Human Capital ROI Ratio
Examples: Inflows, Outflows, number of
Contingent Staff, Transfers and Promotions
Examples: Employee Salary Cost,
Contingent Workforce Cost, Recruiting
Cost
Data
#3
#2
#1
26
#4
4. Management Discussion
Examples: Overall workforce growth,
critical and non-critical job roles, etc.
Key Step: Align Human Capital to Finance
27
Human Capital Disclosure Statement
© Human Capital Management Institute
A B
C
A. Human Capital Impact
• Integrates Financial and People Metrics
• Shows Return on People & workforce productivity
B. Human Capital Flow
• Employee + contingent workforce (hires, terms, internal hires)
C. Human Capital Cost
• Breakdown Total cost of workforce (TCOW)
• Breakdown of HR & training investments
D. Management Discussion
• Explanation of significant workforce changes and talent strategy
Stories of changes in talent performance metrics and strategic direction
D
Prior Year Current Year % Chg
Revenue
Net Operating Revenue 1,400,000,000$ 1,540,000,000$ 10.0%
Total Headcount (FTE) 15,000 16,400 9.3%
Revenue per FTE 93,333$ 93,902$ 0.6%
Costs
Total Operating Expenses* 1,170,000,000$ 1,285,000,000$ 9.8%
Total Cost of Workforce (TCOW) 779,950,000$ 861,000,000$ 10.4%
TCOW per FTE 51,997$ 52,500$ 1.0%
TCOW % of Revenue 55.7% 55.9% 0.4%
Profit
Net Operating Profit 143,750,000$ 159,375,000$ 10.9%
Profit per FTE 9,583$ 9,718$ 1.4%
Workforce Productivity
Hunan Capital ROI Ratio 1.29 1.30 0.1%
Return on Human Capital Investment 18.4% 18.5% 0.4%
Human Capital ROI per FTE 15,333$ 15,549$ % 1.4%
Total Cost of Workforce (TCOW)
increasing more than Revenue
TCOW was up year-over-year 10.4%
above the 10.0% Revenue increase,
negatively affecting workforce
productivity.
Workforce Productivity
Both workforce productivity metrics
improved, however the rate of growth
is minimal and well below the 3%
productivity gains of competitors.
Profit per FTE
Operating Profit increased 10.9%, and
profit per FTE 1.4%, partly offsetting
the negative impact of higher TCOW.
Further profit gains vs. peers seem
unsustainable without further
productivity gains.
Revenue per FTE is up
Revenue increased 10.0% while
headcount increased 9.3%, resulting in
a revenue per FTE increase of .6%
25© Human Capital Management Institute
A. Human Capital Impact
29
B. Human Capital Flow
© Human Capital Management Institute
Increases in Support Staff
What is driving increased support
staff? Is this why TCOW is
increasing faster than revenue?
Contingent Workforce Is contingent workforce a feeder group for critical
roles? A low cost workforce strategy or a gap filler? How does contingent
workforce fit in the strategic company direction?
Management Internal Hire Rate
75 Internal Staff were promoted into mgmt however 115 were hired externally or only
39% of internal staff was considered ready for management
Critical Job Roles - Sales
While 860 sales people were
hired, (450) departed. Why? Are
they high or low performers, new
hires or veterans? Co. Growth and
success is heavily reliant on this
group.
Buy Build
Rent
30
C. Human Capital Cost
© Human Capital Management Institute
Absence Lost Days and Cost
These costs are increasing rapidly, was this due
to one time events or longer term trends?
Benefit Costs The largest rapidly rising cost is
benefit costs for employees. What is the plan to
better manage these costs? How does the
organization compare to peers in this area?
Are Training & Development costs aligned
with the company growth strategy? Is the
organization “Building, Buying or Renting” its
best current and future talent?
Total Cost of Workforce is increasing as a
higher rate than revenue, a long term predictor
of declining workforce productivity. How will
the company better manage these costs as they
execute on their growth plans?
Research on Human Capital Reporting
32
What To Include in Human Capital Reporting
© Human Capital Management Institute
Source: http://ww2.cfo.com/people/2012/04/proposed-standard-calls-for-human-capital-disclosure/ by David McCann
HR Reporting Standards Recommended by American National Standards Institute (ANSI)
© Human Capital Management Institute 33
Human Capital Disclosure Requirements MatrixI = Included in Management's Human Capital Discussion
InternationalIntegrated
ReportingCouncil
OMERSOntario
MunicipalEmployees
RetirementSystem
SustainableAccounting
StandardsBoard,SASB
IRRCInstitute-HBS,
MaterialityofHuman
CapitaltoFin.Perf.
GRI–GlobalReporting
Initiative
AccountingforPeople
TaskForce2003
SmarterAnnualReport
2015,Creelman,Bassi
DowJonesSustainability
Index2014-2015
ANSI-SHRMInvestor
GuidelinesforReporting
HC2012
CIPDValuingYour
Talent2014-2015
NAPF–National
AssociationofPension
Funds
ISO:NWIPN-141,HC
ReportingforInt.&Ext.
stakeholders
TOTAL
HCDisclosure
Statement
Workforce Composition
Workforce Headcount           10 
Workforce Cost          9 
Workforce Productivity          9 
Return on Workforce or People          9 
Workforce Composition-Breakdown          9 
- Contingent Labor Cost       6 
- Contingent Labor Force Size       6 
- Benefits (i.e. full-time v part-time)       6 
- Geographic-Global Workforce Distribution      5 
- Revenue per Employee or FTE     4 
- Demographics, Diversity (i.e. Age, Gender)    3 I
- EBITDA per employee or FTE    3 
- Full-time v part-time    3 
- Job Level    3 
- Talent Efficiency/Effectiveness   2 
- Proportion Professional qualified employees   2 
- Work Hours  1 
Workforce Skills and Capabilities
- Total Training Investment          9 
- Leadership Depth/Career devpmt/Succession         8 
- Talent Management       6 
- Competencies and Skills       6 
- Internal Hire Rate       6 
- Average training hours per employee    3 
- Leadership Quality/ Effectiveness    3 
- Training Types (formal/informal, technical, apprentice)   2 I
- Training by Job Group   2 I
- Number of Courses Taken  1 I
- Number of PhD's (or total # of Patents)  1 I
Overarching HC Disclosure Objectives
Human Capital Performance, Productivity            11 
Comparable across entities/industries            11 
Category, Element, Metric or Dimension
Human Capital Disclosure Requirements Matrix
I = included in Management’s Human Capital Discussion
© Human Capital Management Institute 34
Human Capital Disclosure Requirements Matrix - continued
I = included in Management’s Human Capital Discussion
Case Studies
36© Human Capital Management Institute
Case Study: BroadTek Communications
Revenue Prior Year Current Year Variance % Chg
Net Operating Revenue $4,114,540,000 $4,444,560,000 $330,020,000 8.0%
Total Workforce Headcount (FTE) 4,645 4,750 105 2.3%
Revenue per FTE $885,800 $935,697 $49,897 5.6%
Costs
Total Expenses $2,788,752,921 $2,809,406,376 $20,653,455 0.7%
Total Operating Expense $2,262,997,000 $2,377,839,600 $114,842,600 5.1%
Total Cost of Workforce (TCOW) $447,661,952 $467,567,712 $19,905,760 4.4%
TCOW Percent of Revenue 10.9% 10.5% -0.4% -3.3%
TCOW Percent of Expenses 16.1% 16.6% 0.6% 3.7%
TCOW Percent of Operating Expenses 19.8% 19.7% -0.1% -0.6%
Profit
EBITDA(1)
$1,316,652,800 $1,511,150,400 $194,497,600 14.8%
Net Operating Profit $573,155,422 $680,017,680 $106,862,258 18.6%
Profit per FTE $123,392 $143,162 $19,770 16.0%
Productivity and ROI of Human Capital
Total Market Capitalization (2)
$6,304,709,642 $6,800,176,800 $495,467,158 7.9%
Average Market Capitalization Value per FTE $1,357,311 $1,431,616 $74,305 5.5%
Human Capital ROI Ratio 3.96 4.50 0.54 13.5%
Return on Human Capital Investment 128.0% 145.4% 17.4% 13.6%
TOTAL WORKFORCE PRODUCTIVITY IMPACT: $355,630,545 $700,578,523 $344,947,978 97.0%
1
1
2
2
2
3
3
Key Findings: TCOW growing slower than Revenue and Profit per FTE
Positive HC ROI Ratio and Return on HC Investment
Case Study: BroadTek Communications
37
$0
$200
$400
$600
$800
$1,000
$1,200
$1,400
ClearTel RayFi BroadTek
Revenue per FTE
Profit per FTE
Total Cost of Workforce per FTE
Productivity Gain(Loss) per FTE
Note: All Dollars in Thousands KPI = Key Performance Indicator FTE = Full Time Equivalents
0.0%
5.0%
10.0%
15.0%
20.0%
25.0%
ClearTel RayFi BroadTek
Revenue per FTE
Profit per FTE
Total Cost of Workforce per FTE
-10.0%
-5.0%
0.0%
5.0%
10.0%
15.0%
Human Capital ROI Ratio Return on Human Capital
Investment
ClearTel RayFi BroadTek
Current Financial KPIs Prior-Current Year KPI Variance
Prior-Current Year Productivity Variance
1
Poor
Performance
Relative to
Competitors
Average
Performance
Relative to
Competitors
Strong
Performance
Relative to
Competitors
2
3 3
© Human Capital Management Institute
Case Study: BroadTek Communications
© Human Capital Management Institute 38
The Human Capital Asset Statement
Human Capital Headcount Deployed Prior Period
Percent
of Total Current Period
Percent
of Total Variance
Employees 4,395 94.6% 4,535 95.5% 3.2%
- Management & Senior Leadership 610 13.1% 615 12.9% 0.8%
- Professional Staff 1,310 28.2% 1,405 29.6% 7.3%
- Sales Staff 730 15.7% 805 16.9% 10.3%
- Specialists and Technicians 515 11.1% 530 11.2% 2.9%
- Skilled Trade Staff 115 2.5% 105 2.2% -8.7%
- Operations Staff 210 4.5% 210 4.4% 0.0%
- Service Staff 550 11.8% 560 11.8% 1.8%
- Administrative Support Staff 250 5.4% 220 4.6% -12.0%
- Laborers and Helpers 105 2.3% 85 1.8% -19.0%
Contingent Staff 250 5.4% 215 4.5% -14.0%
Total Workforce 4,645 100.0% 4,750 100.0% 2.3%
Step #1: Measure Changes in Workforce Headcount
• Total Employees
• Sales Staff and Service Staff = Core Workforce
• Administrative + Laborers and Helpers = Non-Core Workforce
Step #2: Quantify Differential Value of High vs. Low Value Add Roles
• Core Job Roles add Greater Value
• Critical Job Roles add Greater Value
39
Case Study: BroadTek Communications
© Human Capital Management Institute
Optimizing The Workforce by Measuring Job Roles
Talent Management Impact Findings
40
$ ROI from Change in Average
Days to Start
Scofield reduced Average Days to
Start by (-5) for critical revenue
generating roles, with savings of
$1.5 million due to 1,250 productive
days saved at $1,200 in lost
productivity per day.
Internal vs. External Cost per Hire
Differential
Scofield saves $4,500 in recruiting costs on
positions filled internally. NOTE: professional
or manager positions filled may have larger
savings while low level positions may lower or
$0. (see Asset Statement for details)
Internal vs. External Hire
Compensation Cost Impact Scofield
saves $1,000 in total compensation,
a part of Total Cost of Workforce
(TCOW), on average, for every role
filled internally.
NOTE: Professional or mgmt
positions filled may have larger
savings while low level positions may
have $0 or negative savings (see Asset
Statement for details)
Span of Control Impact
Scofield increased overall management
span of control from 12 to 12.6, saving
the need to hire over 100 new
managers, a Total Cost of Workforce
productivity savings of $10.06 million.
41
HCMI Analytics and Planning Vision
© Human Capital Management Institute
• Allow organizations to measure
workforce value creation
• Link metrics to business results
& drive company business
strategies
• Create a bridge between the
Workforce and Traditional
Financial Measures

HCMI Intro SOLVEPro Demo Deck Aug 2016e

  • 1.
    1 HCMI Introduction andDemo - Aug, 2016
  • 2.
    2 About Human CapitalManagement Institute HCMI Background:  Specialized in HR analysis & measurement  Deep expertise in Workforce Analytics & Planning  Board made up of CFOs and HR heads  Over 40 years of experience What We Do:  Measure the immeasurable in human capital  Transform workforce data into business intelligence  Provide Tools and Training so HR can Partner with Finance Workforce Assessment w Strategic Consulting w Training Best Practices w Workforce Analytics and Planning w Benchmarking The Human Capital Management Institute (HCMI) was founded on the belief that organizations can, and must, find better ways of measuring their investments in human capital. Our vision of the future is one in which human capital measurement and information is as integral to business decision making as financial information is today. We Bring Financial Discipline, Standards and Rigor to the HR Function Have You Found Your Analytics Pot of Gold?
  • 3.
    Human Capital MetricsHandbookTraining and Advisory Support • Workforce Analytics Training • Workforce Planning Training • Custom onsite training HCMI Products & Services © Human Capital Management Institute 3 620+ Metrics and Detailed Definitions Data Integration Blueprint Workforce Analytics Assessment Analytic Consulting On-Demand Analytics COE and Roadmap Design Statistical Prediction Correlation Coefficient ( 0-1) Factors Leading to Increased Turnover Job Title or Position Dissatisfaction With Compensation High vs. Low Turnover Manager Commute Distance Driver #3 Driver #2 Driver #1 .50 .33 .27 .02 Low Turnover Impact High Turnover Impact Some Turnover Impact .11 Work Location Number of Jobs in Last 3 Years .70 Hired Through Employee Referral .19 Initial Reports & Analysis Data Gathering First Good Metrics HR Data Warehouse Drill-down,standard reports ScenarioAnalysis External Benchmarking Context fordecisions Data Driven Decision Making! Turnover, Headcount,Hiring HRISsystem data COE Formation Data Errors HR Analytics Mandate HR Standards EstablishedLost HR Credibility HR data/systems Assessed HR Data Cleansed historicaldata scrubbed Bus. Units Reject Analysis Data Errors Historical data still bad 1st Analytics Study Advanced Analytic Studies HR Analysis Validated Integrated HR Databases COE Launches Training Courses Bus. Units Demand more Analytics journey steps Setbacks along the way Journey path and goal CONSULTING SERVICES Integrated Dashboard DASHBOARDSPRO TECHNOLOGY SOLUTIONS Human Capital Financial Statements • Human Capital Impact Statement • Human Capital Asset Statement • Human Capital Flow Statement Workforce Quantifier™ ROI Calculator • ROI of Workforce Decisions • Cost of Turnover, Cost per Hire Workforce Planning • Link Workforce and Financial Metrics • Forecast Skills, Costs, Talent and Productivity Job Framework Mapping • Integrated Taxonomy 15,000+ jobs • Map Critical Job Roles Span of Control Optimizer™ Tool • Benchmark and Optimize Spans • Optimize Management Layers Career Path Quantifier • ROI of Career Path • Build, Buy or Lease Talent Analysis $$$ Financial Impact Metrics Data Blueprint Predictive Modeling TRAINING & SUPPORT
  • 4.
    Clients Include… CONFIDENTIAL, DONOT COPY OR REDISTRIBUTE
  • 5.
    Asking the RightQuestions © Human Capital Management Institute 5 What If you could answer the following? 1. What is our workforce productivity? Is it improving? How do we rank? 2. Where do our stars come from in Sales? In Operations? In leaders? 3. Is it better to build, buy or rent talent? What is the right workforce cost? 4. What is the ROI of our training investment in the workforce? 5. Which are the strategic critical roles (game winners) vs. operational critical roles (keep us in the game)? 6. Do we know drivers of employee turnover? What about employee engagement and retention drivers? 7. Are leaders effectively managing human capital? Do leaders correlate to employee engagement, retention and performance?
  • 6.
    1. Is ourworkforce headcount the optimal size and shape? What about our workforce Cost? 2. What percent of our workforce is customer-facing or revenue-generating? What is the trend? 3. Is the organization building, buying or renting its’ critical and core talent? 4. What is our workforce productivity? 5. Is workforce productivity increasing, decreasing or static? How are we performing versus peers? 6. What is the marginal return of a dollar invested in the workforce? 7. Is the ROI on Human Capital higher than other investments? 8 Are leaders effectively managing human capital? Do leaders link to engagement, retention, performance? 9 Where does our best talent come from? Which managers are the best talent scouts and coaches? 10.What percent of our workforce is highly engaged? Is it increasing or decreasing? 11.Is there a link between engagement, performance and productivity? 12.What is our leadership and critical role bench strength? 13.Can we forecast our workforce to optimize cost, profit and productivity? 25 Key Human Capital Questions 14. What business areas/positions/leaders have the highest turnover? How do we compare to peers? 15.Are we losing the right people(low performers) or the wrong people(high performers or critical roles/skills)? 16. What is our regrettable turnover rate? Why is talent leaving? Is by design or accident? 17. Is the quality and cultural fit of new hires improving? Can we measure it? 18. Is attracting/recruiting talent impacting growth? What recruiting source yields the best cultural fit? 19. What is the size and cost of our contingent workforce? Is it by accident or by design? 20. What part of our workforce costs are increasing the most? Can we control it better? 21. What is our Total Cost of Workforce as a percent of revenue? Of expenses? How do we compare to peers? 22. Are we investing the right amount in training? Could training improve productivity & profitability? 23. If talent is critical is the training investment adqaute to support the business strategy? 24.Is internal mobility a source of value or not? What percent of the workforce moves internally each year? 25.What percent of open positions are filled internally? What percent of management roles? © Human Capital Management Institute 6
  • 7.
    Key Differentiators © HumanCapital Management Institute 7 • Human Capital Financial Statements(HCF$™) (adopted by Institutional investors) • SOLVE Metrics online metrics handbook • Workforce productivity benchmark database (7,000 companies) 3 Layers of IP 1. Powerful software (predictive scenario modeling of future workforce) 2. Proprietary data integration “Blueprint” (HR, financial, operational data) 3. Experience, 100’s of successful project insights in SOLVE Have You Found Your Analytics Pot of Gold? $1.0 Million ROI Guarantee!
  • 8.
    SHOW ME THEMONEY! © Human Capital Management Institute 8 • 15% productivity gain and lower costs ($55.0 Billion Package Delivery Co. ) • Predicting sales stars pre hire {$1.0 Billion Bank} • ROI of sales training {$2.0 Billion Retail Co.} • Location optimization for talent growth {US Regional Bank} • Employee engagement to revenue impact {$1.0 Billion public Airline} • 40% voluntary turnover reduction {public, financial services co.} • ROI of internal vs. external hires {public bank} $1.1 Billion Annual $264 Million Annual $1.1 million per sales person $250 Million Annual $250k per Salesperson $200 Million 10 years $96 Million Annual $5 per flight premium $12 Million Annual $6 Million Annual
  • 9.
    Evolution of aNew Ecosystem © Human Capital Management Institute 2010 9 What if someone owned “financial statements” in financial reporting? Would this help public companies? Would this help software technology firms? Would this help accounting firms? Would this help HR ! YES ! Human Capital Disclosure Statement™ Dashboards Human Capital ROI Dashboards Human Capital Financial Statements HCFS ™ Pro Automated Analytics Ecosystem
  • 10.
    © Human CapitalManagement Institute 10 Evidence-based Human Capital Management > QUANTIFY > ANALYZE > OPTIMIZE Quantify not just financial info but also the impact of human capital to business outcomes. Analyze past operations, historical change rate and forecasted performance and benchmark them against the industry average. Optimize workforce strategy by selecting the interventions that yield the highest ROI impact, Linking Human Capital to Financial Performance From Theory to Practice SOLVE combines Human Capital data with Finance and Operations to quantify hard-to-measure areas, analyze them and ultimately optimize the workforce. OPERATIONS FINANCE WORKFORCE
  • 11.
    © Human CapitalManagement Institute 11 SOLVE in Action: Workforce Productivity > QUANTIFY > ANALYZE > OPTIMIZE • Model and Forecast Productivity • Analyze Productivity, Total Cost of Workforce and Profit change rate • Analyze Workforce Cost relative to Revenue and Total Expenses • Benchmarks: Peer Comparison Use analysis tools to answer the following questions: • What is your workforce productivity? Is it higher than peers? • What is the marginal return of one dollar invested in workforce? • Is the ROI on Human Capital higher than other investments? • Is workforce productivity increasing, decreasing or static? Analysis Examples: • Total Cost of Workforce • Return on Human Capital Investment • Human Capital Investment ROI ratio
  • 12.
    © Human CapitalManagement Institute 12 How SOLVE Helps Users Discover Insights > Validate, Configure and Standardize Data > Identify Trends & Conduct Initial Analysis > Build Workforce Scenarios & Conduct Advanced Modeling > Optimize Workforce Interventions with Quantified Impacts, Cost Savings & Project ROI
  • 13.
    $- $200 $400 $600 $800 $1,000 $1,200 $1,400 $1,600 $1,800 $2,000 2015 2016 20172018 2019 2020 Millions TCOW* Calculated vs Strategic Plan Calculated Strategic Plan 22.0% 10.0% 0% 5% 10% 15% 20% 25% 2016 2017 2018 2019 2020 TCOW* % Change Calculated Strategic Plan Variables Status Quo Controlled Growth Workforce Headcount 12% Average Employee Salary 8% Bonus & Incentive Pay (Average) 5% Total HR Costs 11% $X,XXX,XXX below calculated data $627M GAP v Calculated Data © Human Capital Management Institute 13 Example: Forecast Total Cost of Workforce Status quo GAP=Labor Cost growth 22% v 10% Planned * TCOW= Total Cost of Workforce, aka Total Labor Cost
  • 14.
    $- $200 $400 $600 $800 $1,000 $1,200 $1,400 2015 2016 20172018 2019 2020 Millions TCOW Calculated vs Strategic Plan Calculated Strategic Plan 10.0% 10.5% 0% 2% 4% 6% 8% 10% 12% 2016 2017 2018 2019 2020 TCOW % Change Strategic Plan Calculated Variables Status Quo Controlled Growth Workforce Headcount 12% 5% Average Employee Salary 8% 4% Bonus & Incentive Pay (Average) 5% 2% Total HR Costs 11% 5% GAP closed Strategic Plan Bottoms up fit © Human Capital Management Institute 14 Example: Forecast Total Cost of Workforce Controlled Growth =Labor Cost growing at Plan 10% Rate Changes
  • 15.
    SOLVE Demo © HumanCapital Management Institute
  • 16.
    Workforce Productivity © HumanCapital Management Institute 16
  • 17.
    © Human CapitalManagement Institute 17 SOLVE – Productivity Dashboard Example Index Metric Score One score that summarizes how your organization is doing along with its quantified impacts. Index Metric in Graph Analyze the change rate of your index metric and the industry average and plan with SOLVE’s built-in predictive tools. Scenario Manager Detailed scores and benchmarks of the components that made up the index metric. Critical Insights & Predictions Control workforce dynamics that impact the business down to the job-level details.
  • 18.
    Benefits of UsingSOLVE Pro – Functional/Financial 1. Dedicated HCMI analyst for analytics and planning (1 FTE) 2. External benchmarks for Productivity, Recruiting, Learning, Turnover + more 3. Unlimited “What-If” Scenario Modeling capability for “Forecast” metrics 4. Easily Quantify $1.0M+ future “ROI” impacts (i.e. business case) 5. Link HR and Workforce metrics and data to financial results 6. Low Total Cost of ownership with SaaS (1/2 or lower vs. on-premise solutions) 7. Online version of HCMI’s Human Capital Metrics Handbook; 8. Powerful drill down across multiple dimensions for root cause analysis/ reporting 9. Automated preparation of Human Capital Financial Statements 10. On-demand workforce planning for rapid completion of workforce planning 11. Guaranteed pricing at contract rates © Human Capital Management Institute 18
  • 19.
    The Human CapitalDisclosure Statement
  • 20.
    © Human CapitalManagement Institute 20 HCMI Background Jeff Higgins, Founder & CEO Human Capital Management Institute Jeff is a driving force in Workforce analytics at leading companies who transform workforce data into a source of value creation via planning and predictive modeling. With his unique combination of experience as both a senior HR executive and former CFO, Jeff helps organizations around the world rapidly advance their analytics & workforce planning journey. He is a regular speaker at HR events, a member of the Human Capital Institute National Advisory Council on Talent Leadership and a founding member of the PwC Saratoga Institute advisory council on metrics. • HCMI has been focused on workforce productivity since 2009. In 2010 a client asked if human capital data could be presented in reports like financial statements. Thus began a journey to Human Capital Financial Statements (HCFS™). • After 5 years, working with over 100 organizations, and creating the world’s largest workforce productivity database, we have distilled the complexity of human capital reporting into a single document called a “Human Capital Disclosure Statement.”
  • 21.
    Why Should weBother with Workforce Productivity © Human Capital Management Institute 21 • Institutional Investors are demanding it • Being utilized by a growing number of forward looking S&P 500 organizations • Dow Jones Sustainability Index adopted Human Capital ROI Ratio in 2014 (over 900 companies submitted for 2014) Dow Jones Sustainability Index (DJSI)
  • 22.
    22 Introduction to Productivity ©Human Capital Management Institute
  • 23.
    …and Human Capital ROIratio is downright awful. +21.8% (19.0%) REVENUE Great Revenue per FTE growth! Do you know your workforce productivity? But Return on Human Capital Investment is bad… (29.2%) 1 2 Example: Investment Banking Sector, 1996-2012 The Workforce Productivity Paradox 3
  • 24.
    Metrics Profit per FTE Revenueper FTE Human Capital ROI Ratio Return on Human Capital Investment Total Cost of Workforce Percent of Operating Expense Total Cost of Workforce Percent of Revenue Human Capital Metrics Drive Stock Price © Human Capital Management Institute 24 The top 25% of companies improved HC metrics by 51%, driving 4.0% average annual stock price gains (CAGR) and 66.0% overall
  • 25.
    -7.0% 0.4% 9.8% -2.7% 5.7% 25.4% 10.9% 12.9% 26.2% 14.8% 19.9% 28.0% -10% -5% 0% 5% 10% 15% 20% 25% 30% Low-Performers Mid-Performers TopPerformers Human Capital ROI Ratio Return on Human Capital Investment Stock Price Market Value (Capitalization) Human Capital Metrics and Market Performance © Human Capital Management Institute 25 Top quartile companies improved workforce productivity 9.8% & 25.4% annually, seeing 26.2% annual stock price gains, double the market average improvement Top QuartileBottom Quartile 25th to 75th Percentile Human Capital and Market Capitalization, Financial Services, October, 2015 Financial Services Industry Change Rates (CAGR) 2012-2014
  • 26.
    26 What is inthe Human Capital Disclosure Statement © Human Capital Management Institute 1. Human Capital Impact 1. Income Statement 2. Cash Flow Statement 3. Balance Sheet Traditional Financial Statements Human Capital Disclosure Statement 3. Human Capital Cost 2. Human Capital Flow Examples: • Total Cost of Workforce (TCOW) • Productivity Impact • Human Capital ROI Ratio Examples: Inflows, Outflows, number of Contingent Staff, Transfers and Promotions Examples: Employee Salary Cost, Contingent Workforce Cost, Recruiting Cost Data #3 #2 #1 26 #4 4. Management Discussion Examples: Overall workforce growth, critical and non-critical job roles, etc. Key Step: Align Human Capital to Finance
  • 27.
    27 Human Capital DisclosureStatement © Human Capital Management Institute A B C A. Human Capital Impact • Integrates Financial and People Metrics • Shows Return on People & workforce productivity B. Human Capital Flow • Employee + contingent workforce (hires, terms, internal hires) C. Human Capital Cost • Breakdown Total cost of workforce (TCOW) • Breakdown of HR & training investments D. Management Discussion • Explanation of significant workforce changes and talent strategy Stories of changes in talent performance metrics and strategic direction D
  • 28.
    Prior Year CurrentYear % Chg Revenue Net Operating Revenue 1,400,000,000$ 1,540,000,000$ 10.0% Total Headcount (FTE) 15,000 16,400 9.3% Revenue per FTE 93,333$ 93,902$ 0.6% Costs Total Operating Expenses* 1,170,000,000$ 1,285,000,000$ 9.8% Total Cost of Workforce (TCOW) 779,950,000$ 861,000,000$ 10.4% TCOW per FTE 51,997$ 52,500$ 1.0% TCOW % of Revenue 55.7% 55.9% 0.4% Profit Net Operating Profit 143,750,000$ 159,375,000$ 10.9% Profit per FTE 9,583$ 9,718$ 1.4% Workforce Productivity Hunan Capital ROI Ratio 1.29 1.30 0.1% Return on Human Capital Investment 18.4% 18.5% 0.4% Human Capital ROI per FTE 15,333$ 15,549$ % 1.4% Total Cost of Workforce (TCOW) increasing more than Revenue TCOW was up year-over-year 10.4% above the 10.0% Revenue increase, negatively affecting workforce productivity. Workforce Productivity Both workforce productivity metrics improved, however the rate of growth is minimal and well below the 3% productivity gains of competitors. Profit per FTE Operating Profit increased 10.9%, and profit per FTE 1.4%, partly offsetting the negative impact of higher TCOW. Further profit gains vs. peers seem unsustainable without further productivity gains. Revenue per FTE is up Revenue increased 10.0% while headcount increased 9.3%, resulting in a revenue per FTE increase of .6% 25© Human Capital Management Institute A. Human Capital Impact
  • 29.
    29 B. Human CapitalFlow © Human Capital Management Institute Increases in Support Staff What is driving increased support staff? Is this why TCOW is increasing faster than revenue? Contingent Workforce Is contingent workforce a feeder group for critical roles? A low cost workforce strategy or a gap filler? How does contingent workforce fit in the strategic company direction? Management Internal Hire Rate 75 Internal Staff were promoted into mgmt however 115 were hired externally or only 39% of internal staff was considered ready for management Critical Job Roles - Sales While 860 sales people were hired, (450) departed. Why? Are they high or low performers, new hires or veterans? Co. Growth and success is heavily reliant on this group. Buy Build Rent
  • 30.
    30 C. Human CapitalCost © Human Capital Management Institute Absence Lost Days and Cost These costs are increasing rapidly, was this due to one time events or longer term trends? Benefit Costs The largest rapidly rising cost is benefit costs for employees. What is the plan to better manage these costs? How does the organization compare to peers in this area? Are Training & Development costs aligned with the company growth strategy? Is the organization “Building, Buying or Renting” its best current and future talent? Total Cost of Workforce is increasing as a higher rate than revenue, a long term predictor of declining workforce productivity. How will the company better manage these costs as they execute on their growth plans?
  • 31.
    Research on HumanCapital Reporting
  • 32.
    32 What To Includein Human Capital Reporting © Human Capital Management Institute Source: http://ww2.cfo.com/people/2012/04/proposed-standard-calls-for-human-capital-disclosure/ by David McCann HR Reporting Standards Recommended by American National Standards Institute (ANSI)
  • 33.
    © Human CapitalManagement Institute 33 Human Capital Disclosure Requirements MatrixI = Included in Management's Human Capital Discussion InternationalIntegrated ReportingCouncil OMERSOntario MunicipalEmployees RetirementSystem SustainableAccounting StandardsBoard,SASB IRRCInstitute-HBS, MaterialityofHuman CapitaltoFin.Perf. GRI–GlobalReporting Initiative AccountingforPeople TaskForce2003 SmarterAnnualReport 2015,Creelman,Bassi DowJonesSustainability Index2014-2015 ANSI-SHRMInvestor GuidelinesforReporting HC2012 CIPDValuingYour Talent2014-2015 NAPF–National AssociationofPension Funds ISO:NWIPN-141,HC ReportingforInt.&Ext. stakeholders TOTAL HCDisclosure Statement Workforce Composition Workforce Headcount           10  Workforce Cost          9  Workforce Productivity          9  Return on Workforce or People          9  Workforce Composition-Breakdown          9  - Contingent Labor Cost       6  - Contingent Labor Force Size       6  - Benefits (i.e. full-time v part-time)       6  - Geographic-Global Workforce Distribution      5  - Revenue per Employee or FTE     4  - Demographics, Diversity (i.e. Age, Gender)    3 I - EBITDA per employee or FTE    3  - Full-time v part-time    3  - Job Level    3  - Talent Efficiency/Effectiveness   2  - Proportion Professional qualified employees   2  - Work Hours  1  Workforce Skills and Capabilities - Total Training Investment          9  - Leadership Depth/Career devpmt/Succession         8  - Talent Management       6  - Competencies and Skills       6  - Internal Hire Rate       6  - Average training hours per employee    3  - Leadership Quality/ Effectiveness    3  - Training Types (formal/informal, technical, apprentice)   2 I - Training by Job Group   2 I - Number of Courses Taken  1 I - Number of PhD's (or total # of Patents)  1 I Overarching HC Disclosure Objectives Human Capital Performance, Productivity            11  Comparable across entities/industries            11  Category, Element, Metric or Dimension Human Capital Disclosure Requirements Matrix I = included in Management’s Human Capital Discussion
  • 34.
    © Human CapitalManagement Institute 34 Human Capital Disclosure Requirements Matrix - continued I = included in Management’s Human Capital Discussion
  • 35.
  • 36.
    36© Human CapitalManagement Institute Case Study: BroadTek Communications Revenue Prior Year Current Year Variance % Chg Net Operating Revenue $4,114,540,000 $4,444,560,000 $330,020,000 8.0% Total Workforce Headcount (FTE) 4,645 4,750 105 2.3% Revenue per FTE $885,800 $935,697 $49,897 5.6% Costs Total Expenses $2,788,752,921 $2,809,406,376 $20,653,455 0.7% Total Operating Expense $2,262,997,000 $2,377,839,600 $114,842,600 5.1% Total Cost of Workforce (TCOW) $447,661,952 $467,567,712 $19,905,760 4.4% TCOW Percent of Revenue 10.9% 10.5% -0.4% -3.3% TCOW Percent of Expenses 16.1% 16.6% 0.6% 3.7% TCOW Percent of Operating Expenses 19.8% 19.7% -0.1% -0.6% Profit EBITDA(1) $1,316,652,800 $1,511,150,400 $194,497,600 14.8% Net Operating Profit $573,155,422 $680,017,680 $106,862,258 18.6% Profit per FTE $123,392 $143,162 $19,770 16.0% Productivity and ROI of Human Capital Total Market Capitalization (2) $6,304,709,642 $6,800,176,800 $495,467,158 7.9% Average Market Capitalization Value per FTE $1,357,311 $1,431,616 $74,305 5.5% Human Capital ROI Ratio 3.96 4.50 0.54 13.5% Return on Human Capital Investment 128.0% 145.4% 17.4% 13.6% TOTAL WORKFORCE PRODUCTIVITY IMPACT: $355,630,545 $700,578,523 $344,947,978 97.0% 1 1 2 2 2 3 3 Key Findings: TCOW growing slower than Revenue and Profit per FTE Positive HC ROI Ratio and Return on HC Investment Case Study: BroadTek Communications
  • 37.
    Case Study: BroadTekCommunications 37 $0 $200 $400 $600 $800 $1,000 $1,200 $1,400 ClearTel RayFi BroadTek Revenue per FTE Profit per FTE Total Cost of Workforce per FTE Productivity Gain(Loss) per FTE Note: All Dollars in Thousands KPI = Key Performance Indicator FTE = Full Time Equivalents 0.0% 5.0% 10.0% 15.0% 20.0% 25.0% ClearTel RayFi BroadTek Revenue per FTE Profit per FTE Total Cost of Workforce per FTE -10.0% -5.0% 0.0% 5.0% 10.0% 15.0% Human Capital ROI Ratio Return on Human Capital Investment ClearTel RayFi BroadTek Current Financial KPIs Prior-Current Year KPI Variance Prior-Current Year Productivity Variance 1 Poor Performance Relative to Competitors Average Performance Relative to Competitors Strong Performance Relative to Competitors 2 3 3 © Human Capital Management Institute
  • 38.
    Case Study: BroadTekCommunications © Human Capital Management Institute 38 The Human Capital Asset Statement Human Capital Headcount Deployed Prior Period Percent of Total Current Period Percent of Total Variance Employees 4,395 94.6% 4,535 95.5% 3.2% - Management & Senior Leadership 610 13.1% 615 12.9% 0.8% - Professional Staff 1,310 28.2% 1,405 29.6% 7.3% - Sales Staff 730 15.7% 805 16.9% 10.3% - Specialists and Technicians 515 11.1% 530 11.2% 2.9% - Skilled Trade Staff 115 2.5% 105 2.2% -8.7% - Operations Staff 210 4.5% 210 4.4% 0.0% - Service Staff 550 11.8% 560 11.8% 1.8% - Administrative Support Staff 250 5.4% 220 4.6% -12.0% - Laborers and Helpers 105 2.3% 85 1.8% -19.0% Contingent Staff 250 5.4% 215 4.5% -14.0% Total Workforce 4,645 100.0% 4,750 100.0% 2.3% Step #1: Measure Changes in Workforce Headcount • Total Employees • Sales Staff and Service Staff = Core Workforce • Administrative + Laborers and Helpers = Non-Core Workforce Step #2: Quantify Differential Value of High vs. Low Value Add Roles • Core Job Roles add Greater Value • Critical Job Roles add Greater Value
  • 39.
    39 Case Study: BroadTekCommunications © Human Capital Management Institute Optimizing The Workforce by Measuring Job Roles
  • 40.
    Talent Management ImpactFindings 40 $ ROI from Change in Average Days to Start Scofield reduced Average Days to Start by (-5) for critical revenue generating roles, with savings of $1.5 million due to 1,250 productive days saved at $1,200 in lost productivity per day. Internal vs. External Cost per Hire Differential Scofield saves $4,500 in recruiting costs on positions filled internally. NOTE: professional or manager positions filled may have larger savings while low level positions may lower or $0. (see Asset Statement for details) Internal vs. External Hire Compensation Cost Impact Scofield saves $1,000 in total compensation, a part of Total Cost of Workforce (TCOW), on average, for every role filled internally. NOTE: Professional or mgmt positions filled may have larger savings while low level positions may have $0 or negative savings (see Asset Statement for details) Span of Control Impact Scofield increased overall management span of control from 12 to 12.6, saving the need to hire over 100 new managers, a Total Cost of Workforce productivity savings of $10.06 million.
  • 41.
    41 HCMI Analytics andPlanning Vision © Human Capital Management Institute • Allow organizations to measure workforce value creation • Link metrics to business results & drive company business strategies • Create a bridge between the Workforce and Traditional Financial Measures

Editor's Notes

  • #2 Theme HCFS: the journey to workforce productivity Elements to include/ embed into the slides They value it more if they work to derive the idea Ikea effect More for less Add Productivity metrics linkage to stock price
  • #3 Pro
  • #7 -This is a list of key questions companies should be aiming to answer. -helps to build a story around your analytics- brings numbers alive (no longer just numbers but people) -Can help to identify low hanging fruit. -If you don’t have the data to answer them, start laying the groundwork to get it -Today will be focusing on a few of these key questions. ( I encourage to download this from our website)
  • #10 Human Capital Disclosure Statement Human Capital ROI Dashboards Human Capital Financial Statements Automated Reporting, Benchmarks, Analytics
  • #11 SOLVE differentiator
  • #12 Data Processor Connecting Data from multiple sources Trending them Build Scenario Assess Scenarios with Impacts & ROI Select & Thrive Evidence based talent managmeent
  • #13 How does SOLVE handle this
  • #18 Data Processor Connecting Data from multiple sources Trending them Build Scenario Assess Scenarios with Impacts & ROI Select & Thrive Evidence based talent managmeent
  • #20 Add Productivity metrics linkage to stock price
  • #22 Featured on CFO.com Being used by X Y Z Human Capital ROI -> Dow Jones Sustainability Index
  • #24 Stage by stage by stage Unfolding the story slowly Dramatize but not too dramatic Points: The most recognized business-related productivity metric shows a great long-term trend in a pretty profitable industry However, two key human capital productivity metrics reveal a divergence of results. This shows that human capital investments have been inefficient over that time, actually driving down the profitability of businesses that are otherwise growing. For a company like [prospect firm name], that equates to [x] billion dollars over a five year period!
  • #25 Not only does this show up in the financial statements, if affects market value, which directly affects shareholders and the company’s ability to invest in growth, innovation for competitive advantage, etc. Check this out: in our study, the top 25% of companies improved Human Capital metrics by 51%, seeing 4.0% average annual stock price gains and 66.0% overall overall during that time, vs. an average decline. Measuring, and managing from advanced human capital metrics creates a huge competitive advantage! Profit per FTE Revenue per FTE Human Capital ROI Ratio (HC ROI Ratio) Return on Human Capital Investment (Return on HCI) Total Cost of Workforce Percent of Operating Expenses (TCOW % of Operating Expenses) Total Cost of Workforce Percent of Revenue (TCOW % of Revenue
  • #31 Advanced metrics year by year are interesting in and of themselves, but require context to truly provide real insights Trends and Forecasting productivity changes into the future- indicate whether you’re going in the right direction or going down a dangerous path Benchmarking creates contest both for where you are and where you are going- how will you compare in 5 years at the current rates? Digging deeper Segment by workforce category (See “Optimizing Workforce Analytics through Workforce Segmentation” Less time on this and next One example: organization which was behind competitors, but rapidly growing and projected to catch up to competitors
  • #32 Add Productivity metrics linkage to stock price
  • #36 Cheryl
  • #37 Advanced metrics year by year are interesting in and of themselves, but require context to truly provide real insights Trends and Forecasting productivity changes into the future- indicate whether you’re going in the right direction or going down a dangerous path Benchmarking creates contest both for where you are and where you are going- how will you compare in 5 years at the current rates? Digging deeper Segment by workforce category (See “Optimizing Workforce Analytics through Workforce Segmentation” Less time on this and next One example: organization which was behind competitors, but rapidly growing and projected to catch up to competitors
  • #38 -BroadTek compared company performance to its competitors using traditional metrics such as Revenue and Profit per FTE. -Its workforce productivity seemed relatively low, leading the board of directors to propose reductions in workforce to improve efficiency and financial performance. ----- -Management asked HCMI to further analyze BroadTek’s productivity to see if this was necessary. -BroadTek was improving productivity by investing in the growth of core, revenue generating job categories such as sales and service staff while reducing costs in administrative and support staff.