Download to read offline

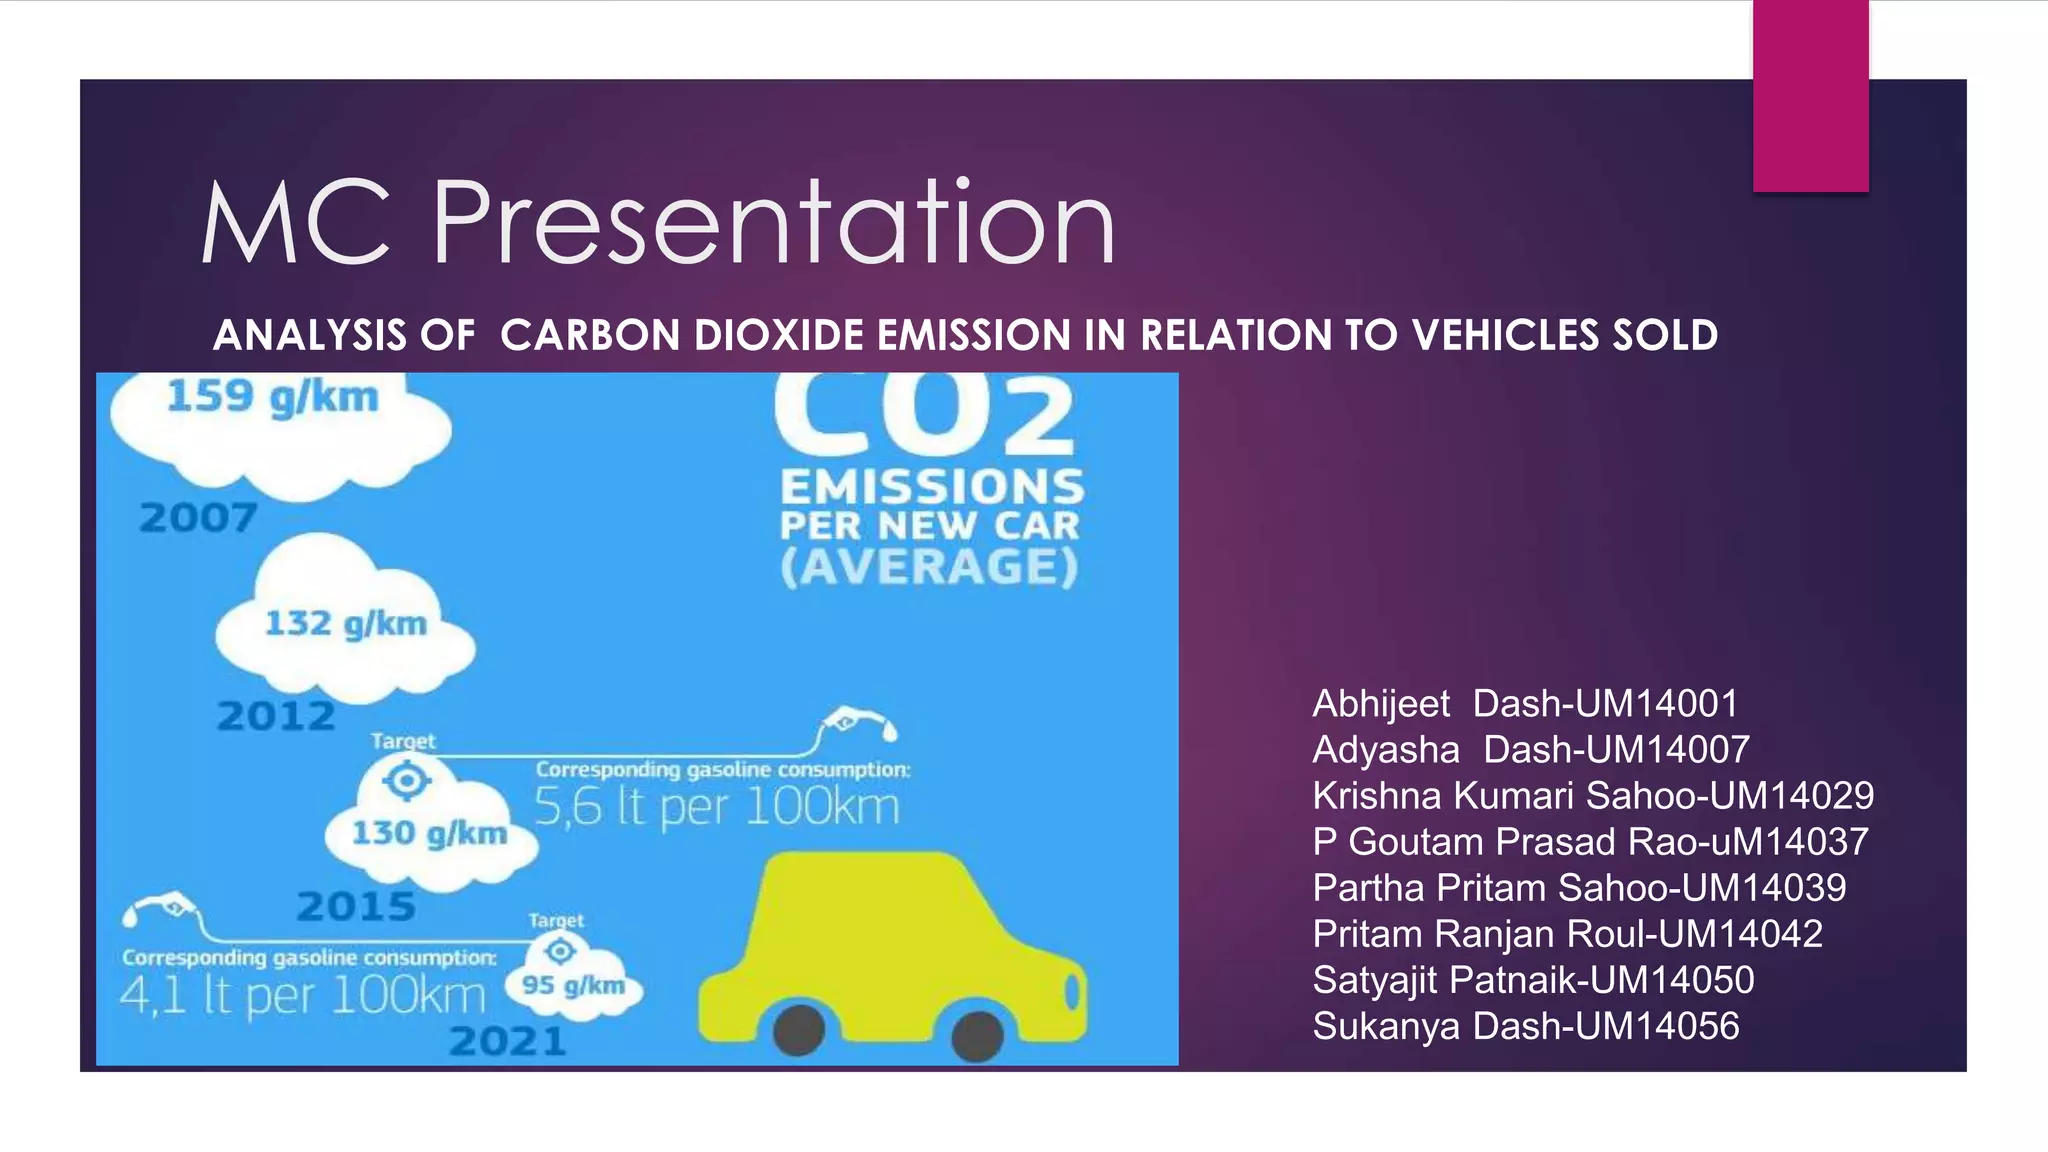
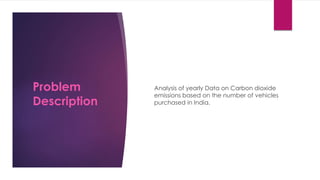

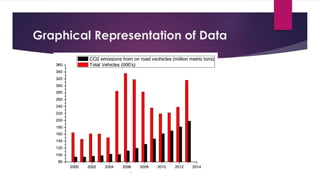
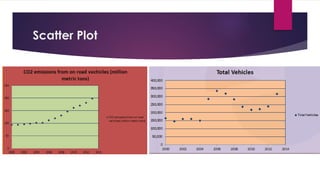
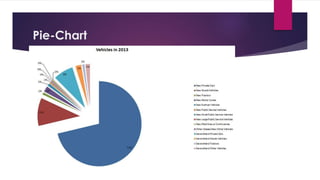
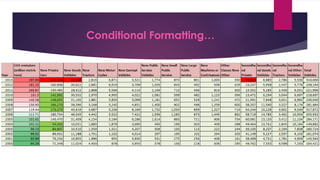
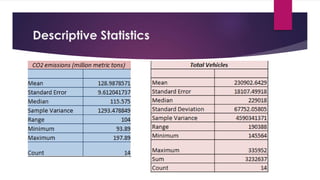
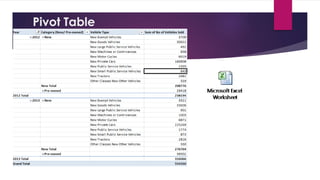
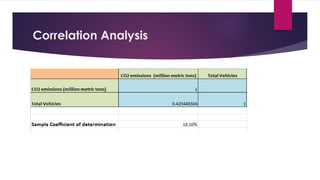
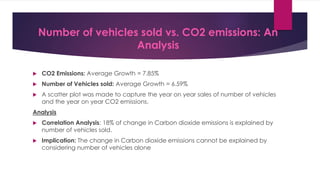


This document analyzes the relationship between carbon dioxide emissions and vehicles sold in India from 2003-2013. It finds that while CO2 emissions and vehicle sales both increased substantially over this period, the number of vehicles sold only explains 18% of the change in emissions. Other factors must also influence India's transportation CO2 output. Graphs, statistics, and a pivot table were used to explore trends in vehicle types purchased and emissions levels each year.