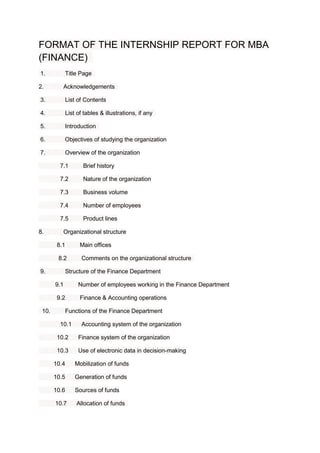
The document outlines the standard format for an internship report submitted for an MBA degree in various specializations such as finance, marketing, MIS, and HRM. The report format includes sections for the title page, acknowledgements, contents list, introduction, objectives, organization overview, department structures, theoretical analysis, weaknesses, conclusions and recommendations, references, and annexes. The document also provides formatting guidelines regarding paper size, margins, binding, and contact details to be included.
BUDGET & BUDGETARY CONTROL SYSTEM is essential tools of management of any organization
reflect the plan of action for different levels of management useful to monitor various activities and initiate mid-course corrective actions.
A SUMMER INTERNSHIP PROJECT REPORT ON “CONSUMER BEHAVIOR” AT IDBI FEDERAL LIF...Gaurav Mehta
A
SUMMER INTERNSHIP PROJECT REPORT
ON
“CONSUMER BEHAVIOR”
AT
IDBI FEDERAL LIFE INSURANCE CO. LTD.
ATMIYA INSTITUTE OF TECHNOLOGY & SCIENCE
DEPARTMENT OF MANAGEMENT
MBA Internship Report on "Market Study of the Lighting Industry in Bangladesh & Marketing Strategy for New Nation Lighting Ltd."
This report is solely prepared by Md. Abdur Rakib that is me. It was prepared on the purpose of MBA Internship Program under MBA Program for the Marketing 14th Batch, University of Dhaka.
1
ACC ACF 2400 – Semester 2, 2017
Individual Assignment 1:
Building a Business Dashboard
Overview
A business dashboard is ‘a style of reporting that depicts KPIs, operational or strategic information with
intuitive and interactive displays’ (Turban et al., 2015 p. 380). It is a single screen snapshot of how a
business, department, or process is performing. The design varies considerably from one application
to another, and even between businesses, but a common feature of a dashboard is that it uses graphs,
coloured text, and symbols to show the viewer, at a glance, the current status. A dashboard should
only contain information that actually influences performance. Many dashboards are interactive
because it can be difficult to show every important detail at once.
You are an employee at Australian Electronics Pty Ltd. You have been assigned the task of designing
a report that will be used by managers involved in purchasing, sales, and inventory management.
Your boss, Mary Smith, suggest including at least four (4) ratios. Regarding the ratios, Mary thinks
that Inventory Turnover and Sales Growth are a must.
This is an individual assignment. There is no fixed answer, so be creative!! The spreadsheet must
perform ratio analysis to show the current status of the inventory holdings and sales. Marks are
awarded according to how well the dashboard meets the requirements specified in the rubric.
A data set is supplied with this guide in Moodle (ACC ACF 2400_s2 2017_Inventory Statistics.xlsx). The
Inventory Statistics data set contains four sheets: sales value, sales quantity, the quantity of inventory
on hand, and the quantity purchased. You should use all sheets in your calculations, but may need to
restructure some data on a separate calculation sheet to ensure data is in the format you need.
Instructions on how to build a complex interactive scorecard have been published in different journals
such as the Journal of Accountancy
(http://www.journalofaccountancy.com/issues/2011/feb/20092427.html), but you do not have to
build such a complex system if your spreadsheeting skills are not well developed.
The table below contrasts two different approaches. The example on the left shows 7 ratios in a non-
interactive dashboard, with three graphs and one table of numbers. It is clearly not an inventory
management dashboard, but if the design features included were tailored to the inventory
management context, it would likely earn a pass (providing instructions, the input sheet, and the
calculations sheet are acceptable).
The example on the right, however, is from the Dashboard your Scorecard article. It is also not an
inventory management dashboard and does not show ratios, and so is not acceptable, but illustrates
elements that will earn higher marks:
• It is interactive (note the drop-down box in the bottom right graph to select the person shown);
• It uses conditional for ...
2Jubail University CollegeDepartment of Business Adm.docxlorainedeserre
2
Jubail University College
Department of Business Administration
Semester 392
Assignment No.: 2
Section No.: 201
Course Code: MIS 305
Course Name: Intelligent Support Systems in Business
Student Name
Student ID
1. Nejood Alshehri
36120067
2. Ghaida Alasman
36120311
3. Dhai Alotaibi
36120355
4. Fetoon Alhulais
36120019
Project Based Assignment
The Assignment Objective:
This is a project-based assignment divided into two deliverables: theoretical and practical part. Each with 10% of your final grade. It aims to familiarize and expose students to the business intelligence tools and the four phases of the decision making process as well as improving students’ effective communication and team working skills. In addition, it helps expose students to tools and techniques that aid them in practically developing a DSS to solve a problem or take advantage of an opportunity based on the four phases of decision making process.
Topic- A Business Case:
Each group should identify particular opportunity or problem to be solved by any managerial level in Business. You need to follow the 4 phases of decision making process. Use any tool in M.S. Excel to help automate this decision. Your DSS should provide a correct answer to be given to managers or staff. Examples that could help you:
· DSS to help HR answer Employees questions.
· DSS to help Marketing and development department to increase customer satisfaction.
Each group (of 3-4 members) create their own scenarios in relevance to their business case. Note that you need to consider the various users and existing operations as well as any new operations and functions for proper utilization of data and accurate decision making process.
Practical Part (Submission on week 13):(10 %)
This part focuses on the implementation phase of your DSS for the problem (opportunity) that you have identified in assignment 1.
DSS Criteria:
· You should use analytical tool and functions.
· The design and format should be attractive yet clear.
· Use visualization to easily analyze the results.
· Develop two dashboards. Please ensure that you adhere to the dashboard design principles and guidelines.
· Keep intended users of your DSS in mind and ensure that you consider all the possible factors.
· Identify the routine business functions and the management activities supported by your DSS.
· Assume the business rules for the DSS users to follow and make sure to incorporate them.
The required materials: (100 marks = 10%)
A) CD containing the following: (60 marks)
1- Documentation:
a. Assignment cover page and Tables of content
b. Introduction: Brief introduction about the decision you will assist in. (2 mark)
c. Content
· This part shoud Breifly and consizly address all the work that you have done and assubsions you followed in preparing your DSS Implementation phase such as:
· How the solution is implemented.(10 mark)
· Explain the tools that you developed (10 mark)
· The functions you used with ...
Holmes College in Australia is a well-known educational institute that teaches a large number of educational courses to students around the globe. Holmes College is among the top-notch learning institute providing a wide range of courses for the scholars in Australia and caters to a huge number of students from Australia and overseas. Holmes College is having its campus in different big cities such as Sydney, Brisbane, Gold Coast, Melbourne & Cairns etc.
Website link: https://www.assignmentworkhelp.com/assignment-of-holmes-institute-australia/
ANNUAL REPORT PROJECTCurricular IssuesThis course needs to .docxrossskuddershamus
ANNUAL REPORT PROJECT
Curricular Issues:
This course needs to articulate (transfer) to a four-year college or university. For that reason we work hard to meet university requirements in our courses. Courses in the 200 level (BUS221) have writing across the curriculum requirements. Therefore we do require a paper in this course. I will do my best to make it as easy for you as possible. Also the universities require our business and accounting courses take a hard look at interpreting financial statements. For this reason I have assigned problems or exercises throughout the semester that deal with this. In Chapter 13 you will learn all about Financial Statement Analysis and the homework for that chapter will be to prepare a financial analysis on Research in Motion. It is important to note that at the very end of each chapter, and before the Demonstration Problem for the chapter, you will find a Decision Analysis section. This will help you a great deal in understanding how to complete your Annual Report’s financial analysis.
I strongly advise that you print out the files and information found in the Annual Report section under Assignments in your Angel Course. Then, as you work through the individual chapters you can complete the activities in the final project rather than waiting until the end of the course. The information will be more meaningful then. There is no reason to hold off on starting this project.
Appendix A, beginning on page A-1 in the back of the text, contains financial statements for four companies: Research in Motion, Apple, Palm, and Nokia. This semester you are required to report on Research in Motion. I choose this because the text has included an entire copy of their Financial Report rather than just the financial statements as the other three companies have. You can start the report now and also the financial statement ratio analysis. The Common-size Comparative financial statement analysis will come at the end of the semester as a Chapter 13 assignment. As we work through each chapter and learn to calculate and analyze the ratios that particular chapter teaches you can complete the ratio calculations for Research in Motion. The work sheet for this can be found in this Annual Report folder. I am giving you all the necessary tools for the final project early on so there is no reason to procrastinate.
As I mentioned in the Announcement Section of the course, you will find a Decision Analysis section at the end of each chapter just before the demonstration problem. Here you will find how to calculate the ratios and a discussion of the ratios that pertain to that chapter (how to analyze the ratio.) If you complete this ratio analysis as you move throughout the text rather than waiting for the end of the course, it will have more meaning to you.
For the report itself you will need to research three current periodicals on your company besides the company’s annual report found here in the text. “.
Prepared by: Ms. Dalal Bamufleh Page 1 of 10
2014/15, Semester 141
GROUP PROJECT
PROJECT INSTRUCTION:
DUE DATE
Week 14
03 May 2015 (Sunday).
WARNING:
Late submission will incur the following mark deduction:-
10% from overall mark obtained - PER DAY of late submission
REPORTS WILL NOT BE ACCEPTED AFTER 05 MAY 2015.
PROJECT FORMAT
The cover page should carry the
following: –
- Name of the University College
- Program title
- Subject code and title
- Name of lecturer
- Name and ID of every member
of your group
- Date of submission
The assignment must be: –
- Type written
- Include all Headings
- Edited for typo and
grammatical errors
- Left and right alignment of 2 cm
- 1.5 spacing
- Font size - 11
- Lettering – Times New Roman
- Paragraphing – 2 spaces
PROJECT MODE Group work (5-6 students)
DUTIES
1) Each member of the group will be responsible for a portion of the
report and all group members should involve in the presentation
2) The report MUST contain a workload table indicating the workload of
each member.
3) Grading will vary depending on workload allocation. Group leader is
to ensure that work is divided equally.
4) This project carries 20% of your total mark.
MANAGEMENT SCIENCE DEPARTMENT
MGT214 OPERATIONS MANAGEMENT
Prepared by: Ms. Dalal Bamufleh Page 2 of 10
Project Objectives:
The objective of the group project is to analyze an international company’s operations management
and recommend solutions and suggestions for any problem that this company is facing based on OM
concepts.
The project aims to achieve the following:
To analyze the production process and the operations functions of the selected company
To establish proper research understanding and proper referencing style.
To develop students’ analytical, and presentation skills
Project Description:
Working in groups of 5-6 students, select any international company. First, you have to read about the
selected company and analyze their operations management. As an operations manager, you are
requested to propose and suggest how could they solve problems (if they have) and improve the
process.
Your report should include the following sections:
1. COVER PAGE (Please refer to page 5)
2. TABLE OF CONTENTS
3. EXECUTIVE SUMMARY
o The executive summary is an abstract that gives a broad picture of the contents of the
report.
o It should not start off by “In this report you are going to….” It should summarize the
report to the extent that if this is the only page the reader reads, he/she will know what
is in the full report.
o This summary shouldn’t be more than ONE page.
4. COMPANY & PRODUCT DESCRIPTION
o Give a back.
English 225 bp2 Part- Course ProjectREAD ALL OF THE INST.docxSALU18
English 225 bp
2 Part- Course Project
READ ALL OF THE INSTRUCTIONSCAREFULLY AND COMPLETELY
A Written report and Power Point Presentation are required for this assignment.
The written report is due by Saturday 12/24
The power point presentation is due by FRIDAY 12/30
Semi-Formal Business Report. 6-10 pages (double spaced—introduction to conclusion) Topic suggestions are provided Other criteria are as follows:
A Power Point Presentation of the information in the report using (MS PowerPoint) is also required
**TURINTIN WILL BE USED TO CHECK FOR ORIGINALITY.**
· The audience for this report is an industry decision-maker, such as your supervisor or CEO, or a public policymaker, such as a politician or bureaucrat, who could act upon your Recommendations.
· Your report must feature at least one technical illustration, such as a chart, graph, or image that you have created.
· Your research must consist of a variety of electronic (Web sites, databases, media) and traditional sources (books, journals, magazines). All sources must be cited CORRECTLY in the report using The Modern Language Association (MLA) formatting. The MLA choice is for documentation of sources. TURNITIN WILL BE USED TO CHECK FOR ORIGINALITY
· You will submit a 6-10page written report in MLA format in MS Word. You must have at least four sources. DUE DATE IS SATURDAY 12/24
· You will also CREATE A POWER POINT presentation of the report using PPT (MS PowerPoint). DUE DATE IS FRIDAY 12/30
Directions:You many choose any of the topics below for your Project Report. The goal here is for you to choose a topic that genuinely interests you. This topic can be related to your current job or community, or that of your career goals. It is realistic, even if the report scenario is simulated for the purposes of THIS ASSIGNMENT.
1. It is important to understand what organizations are looking for in cover letters and resumes. It is also important to understand the differences between a hard-copy resume and a resume from the Internet. What strategies have proven most successful in getting the writer an interview? Research these questions and present your findings and conclusions.
2. Today’s employee turn-over rate is high for many organizations. Research has shown that the key to hiring qualified individuals is to first promote the company to current employees. By implementing strategies within the organization that promote respect and cooperation between co-workers and managers, awarding fair compensation, and providing various awards, organizations are better able to retain good employees. Research what other organizations are doing to hire and retain good employees in order to combat the high employee turnover rate. Use this research to make recommendations to the management of your organization.
3. Your company needs to update its Code of Ethics. Because of the immense diversity in today’s ever-changing workforce, you need to research other organizations’ codes ...
Running head COMPANY NAME - OPERATIONS .docxhealdkathaleen
Running head: COMPANY NAME - OPERATIONS 1
COMPANY NAME - OPERATIONS
3
Operations, Technology, and Management Plan
First Name Last Name
University
BUS 599
Professor
Date
Length: The assignment should be 4 to 8 full pages, excluding title page and reference page. I will be deducting points if the pages are not completely full!!!
You must use the appropriate information from the NAB Company Portfolio to complete this section!!!
1. Submit Assignment 3 before the deadline. Do a section or two every day and check in Grammarly before submitting. Use the attached template (video tutorial included). You must have headings for each section and subheadings as indicated.
2. Remember, you have to also attach the revised entire Excel document with Assignment 3.
3. Make a plan and stick to it. I expect this assignment to be submitted on time!!
Notes:
· Please remove the text in red throughout the paper and replace with your information.
· Leave the text in black as it is. You are required to have a heading for each of the sections in your paper.
· Use APA format. Your will respond to each question using indented paragraphs in font Times New Roman, size 12.
· The references must be on a separate page at the end of the paper.
Operations, Technology, Management, and Ethics Plan
Operations Plan
Note: Remember to assign a dollar amount to each operational cost you find, as you will need these figures for financials document.
Operations Plan Detailed
· Create the operations plan for your company using the template on page 214 as a guide (Operations Plan Preparation form).
· You must use information from the NAB Company Portfolio where applicable, completing the rest with your preferences.
· Per the template, you will discuss: key aspects of your operations, Cost and Time Efficiencies, Competitive Advantages, Problems Addressed and Overcome.
· Use the hints provided in the description of the assignment.
Research and Development
· Describe your research and development activities and explain how they will contribute to your company.
Hint: How will you stay abreast of new developments in your industry? What new products do you have in development now, in addition to your flagship product?
Technology Plan
Create a technology plan for your NAB Company using the template in the text as a guide (p. 227 | Technology Plan Preparation Form). Extract appropriate information from the NAB Company portfolio, where applicable. Other required items in the template should be filled in using your personal preferences.
Per the template, you will discuss (use these subheadings):
Software needs
Hardware Needs
Telecommunication Needs
Personnel Needs (for technology)
Hints: Consider the type of technology your company will use to conduct the following activities: manage personnel; take, fulfill, and track orders; manage inventory; communicate with customers and provide customer servi ...
COM 3135 Proposal AssignmentMANAGERIAL PROPOSAL INSTRUCTI.docxmccormicknadine86
COM 3135: Proposal Assignment
MANAGERIAL PROPOSAL INSTRUCTIONS
Learning outcomes
- Employ Toulmin's CDW model to craft a persuasive message to internal
stakeholders
- Construct a clear, convincing and impactful written managerial message
Deliverables
1. A written proposal: Write a persuasive proposal to the school dean and top
management, as an email message or an email attachment. You need to convince
the readership that a problem exists and that your solution will work.
2. An analysis of the argumentation: Write an explanation of how you have utilized
Toulmin’s CDW model (Roger’s article: ‘Building a case and arguing with
sophistication’)
Situation
- FIU has been undergoing huge changes recently and management is keen to receive
feedback from all stakeholders - faculty, staff, students - on how operations at the
FIU could be further improved.
- You are part of a student working group that has been formed to assess the present
situation in the school and propose ways in which FIU processes could be
enhanced.
- In other words, you need to identify an operational problem and develop a
workable solution to the problem. You can select a pressing issue that you would
like to have addressed.
- Examples of areas in which you might develop proposals:
1. FIU branding study abroad
2. Food services
3. Registration procedures
4. Library services
5. Sports facilities
6. Cooperation with businesses
7. Organization of studies
8. Housing
�1
https://owl.purdue.edu/owl/general_writing/academic_writing/historical_perspectives_on_argumentation/toulmin_argument.html
COM 3135: Proposal Assignment
Plan and write a proposal for action/change.
You will need to:
1. state (and summarize) the problem
2. identify explicitly the outcomes and benefits of your proposal
3. provide a convincing recommendation with supporting evidence which shows that
your recommendation is feasible
Request action
- Use Toulmin’s Claim-Data-Warrant communication model and the persuasive writing
guidelines.
- You will also need to pay attention to effective managerial writing.
- Properly format your proposal. Include a cover page.
�2
https://owl.purdue.edu/owl/subject_specific_writing/writing_in_engineering/indot_workshop_resources_for_engineers/documents/20080628094326_727.pdf
InstructionsExcel Skills | Exercises | Pivot Tableswww.excel-skills.comInstructionsVersions: Excel 2010 & Excel 2007Our practical Excel exercises are much more than just exercises! We design our exercises in such a way that they provide the user with a mapping of the Excel features that can be used in order to complete the appropriate task in the most efficient manner possible. We also reference each step in each exercise to the appropriate tutorial that needs to be studied in order to be able to complete the step.The solutions to our comprehensive exercises are only available to customers who have purchased either a full or training ...
GDG Cloud Southlake #33: Boule & Rebala: Effective AppSec in SDLC using Deplo...James Anderson
Effective Application Security in Software Delivery lifecycle using Deployment Firewall and DBOM
The modern software delivery process (or the CI/CD process) includes many tools, distributed teams, open-source code, and cloud platforms. Constant focus on speed to release software to market, along with the traditional slow and manual security checks has caused gaps in continuous security as an important piece in the software supply chain. Today organizations feel more susceptible to external and internal cyber threats due to the vast attack surface in their applications supply chain and the lack of end-to-end governance and risk management.
The software team must secure its software delivery process to avoid vulnerability and security breaches. This needs to be achieved with existing tool chains and without extensive rework of the delivery processes. This talk will present strategies and techniques for providing visibility into the true risk of the existing vulnerabilities, preventing the introduction of security issues in the software, resolving vulnerabilities in production environments quickly, and capturing the deployment bill of materials (DBOM).
Speakers:
Bob Boule
Robert Boule is a technology enthusiast with PASSION for technology and making things work along with a knack for helping others understand how things work. He comes with around 20 years of solution engineering experience in application security, software continuous delivery, and SaaS platforms. He is known for his dynamic presentations in CI/CD and application security integrated in software delivery lifecycle.
Gopinath Rebala
Gopinath Rebala is the CTO of OpsMx, where he has overall responsibility for the machine learning and data processing architectures for Secure Software Delivery. Gopi also has a strong connection with our customers, leading design and architecture for strategic implementations. Gopi is a frequent speaker and well-known leader in continuous delivery and integrating security into software delivery.
DevOps and Testing slides at DASA ConnectKari Kakkonen
My and Rik Marselis slides at 30.5.2024 DASA Connect conference. We discuss about what is testing, then what is agile testing and finally what is Testing in DevOps. Finally we had lovely workshop with the participants trying to find out different ways to think about quality and testing in different parts of the DevOps infinity loop.
The Art of the Pitch: WordPress Relationships and SalesLaura Byrne
Clients don’t know what they don’t know. What web solutions are right for them? How does WordPress come into the picture? How do you make sure you understand scope and timeline? What do you do if sometime changes?
All these questions and more will be explored as we talk about matching clients’ needs with what your agency offers without pulling teeth or pulling your hair out. Practical tips, and strategies for successful relationship building that leads to closing the deal.
Neuro-symbolic is not enough, we need neuro-*semantic*Frank van Harmelen
Neuro-symbolic (NeSy) AI is on the rise. However, simply machine learning on just any symbolic structure is not sufficient to really harvest the gains of NeSy. These will only be gained when the symbolic structures have an actual semantics. I give an operational definition of semantics as “predictable inference”.
All of this illustrated with link prediction over knowledge graphs, but the argument is general.
JMeter webinar - integration with InfluxDB and GrafanaRTTS
Watch this recorded webinar about real-time monitoring of application performance. See how to integrate Apache JMeter, the open-source leader in performance testing, with InfluxDB, the open-source time-series database, and Grafana, the open-source analytics and visualization application.
In this webinar, we will review the benefits of leveraging InfluxDB and Grafana when executing load tests and demonstrate how these tools are used to visualize performance metrics.
Length: 30 minutes
Session Overview
-------------------------------------------
During this webinar, we will cover the following topics while demonstrating the integrations of JMeter, InfluxDB and Grafana:
- What out-of-the-box solutions are available for real-time monitoring JMeter tests?
- What are the benefits of integrating InfluxDB and Grafana into the load testing stack?
- Which features are provided by Grafana?
- Demonstration of InfluxDB and Grafana using a practice web application
To view the webinar recording, go to:
https://www.rttsweb.com/jmeter-integration-webinar
LF Energy Webinar: Electrical Grid Modelling and Simulation Through PowSyBl -...DanBrown980551
Do you want to learn how to model and simulate an electrical network from scratch in under an hour?
Then welcome to this PowSyBl workshop, hosted by Rte, the French Transmission System Operator (TSO)!
During the webinar, you will discover the PowSyBl ecosystem as well as handle and study an electrical network through an interactive Python notebook.
PowSyBl is an open source project hosted by LF Energy, which offers a comprehensive set of features for electrical grid modelling and simulation. Among other advanced features, PowSyBl provides:
- A fully editable and extendable library for grid component modelling;
- Visualization tools to display your network;
- Grid simulation tools, such as power flows, security analyses (with or without remedial actions) and sensitivity analyses;
The framework is mostly written in Java, with a Python binding so that Python developers can access PowSyBl functionalities as well.
What you will learn during the webinar:
- For beginners: discover PowSyBl's functionalities through a quick general presentation and the notebook, without needing any expert coding skills;
- For advanced developers: master the skills to efficiently apply PowSyBl functionalities to your real-world scenarios.
Builder.ai Founder Sachin Dev Duggal's Strategic Approach to Create an Innova...Ramesh Iyer
In today's fast-changing business world, Companies that adapt and embrace new ideas often need help to keep up with the competition. However, fostering a culture of innovation takes much work. It takes vision, leadership and willingness to take risks in the right proportion. Sachin Dev Duggal, co-founder of Builder.ai, has perfected the art of this balance, creating a company culture where creativity and growth are nurtured at each stage.
Generating a custom Ruby SDK for your web service or Rails API using Smithyg2nightmarescribd
Have you ever wanted a Ruby client API to communicate with your web service? Smithy is a protocol-agnostic language for defining services and SDKs. Smithy Ruby is an implementation of Smithy that generates a Ruby SDK using a Smithy model. In this talk, we will explore Smithy and Smithy Ruby to learn how to generate custom feature-rich SDKs that can communicate with any web service, such as a Rails JSON API.
Essentials of Automations: Optimizing FME Workflows with ParametersSafe Software
Are you looking to streamline your workflows and boost your projects’ efficiency? Do you find yourself searching for ways to add flexibility and control over your FME workflows? If so, you’re in the right place.
Join us for an insightful dive into the world of FME parameters, a critical element in optimizing workflow efficiency. This webinar marks the beginning of our three-part “Essentials of Automation” series. This first webinar is designed to equip you with the knowledge and skills to utilize parameters effectively: enhancing the flexibility, maintainability, and user control of your FME projects.
Here’s what you’ll gain:
- Essentials of FME Parameters: Understand the pivotal role of parameters, including Reader/Writer, Transformer, User, and FME Flow categories. Discover how they are the key to unlocking automation and optimization within your workflows.
- Practical Applications in FME Form: Delve into key user parameter types including choice, connections, and file URLs. Allow users to control how a workflow runs, making your workflows more reusable. Learn to import values and deliver the best user experience for your workflows while enhancing accuracy.
- Optimization Strategies in FME Flow: Explore the creation and strategic deployment of parameters in FME Flow, including the use of deployment and geometry parameters, to maximize workflow efficiency.
- Pro Tips for Success: Gain insights on parameterizing connections and leveraging new features like Conditional Visibility for clarity and simplicity.
We’ll wrap up with a glimpse into future webinars, followed by a Q&A session to address your specific questions surrounding this topic.
Don’t miss this opportunity to elevate your FME expertise and drive your projects to new heights of efficiency.
Accelerate your Kubernetes clusters with Varnish CachingThijs Feryn
A presentation about the usage and availability of Varnish on Kubernetes. This talk explores the capabilities of Varnish caching and shows how to use the Varnish Helm chart to deploy it to Kubernetes.
This presentation was delivered at K8SUG Singapore. See https://feryn.eu/presentations/accelerate-your-kubernetes-clusters-with-varnish-caching-k8sug-singapore-28-2024 for more details.
Accelerate your Kubernetes clusters with Varnish Caching
Mba internship formats
1. FORMAT OF THE INTERNSHIP REPORT FOR MBA
(FINANCE)
1. Title Page
2. Acknowledgements
3. List of Contents
4. List of tables & illustrations, if any
5. Introduction
6. Objectives of studying the organization
7. Overview of the organization
7.1 Brief history
7.2 Nature of the organization
7.3 Business volume
7.4 Number of employees
7.5 Product lines
8. Organizational structure
8.1 Main offices
8.2 Comments on the organizational structure
9. Structure of the Finance Department
9.1 Number of employees working in the Finance Department
9.2 Finance & Accounting operations
10. Functions of the Finance Department
10.1 Accounting system of the organization
10.2 Finance system of the organization
10.3 Use of electronic data in decision-making
10.4 Mobilization of funds
10.5 Generation of funds
10.6 Sources of funds
10.7 Allocation of funds
2. 11. Critical analysis of the theoretical concepts relating to practical experiences i.e.
relate the theoretical concepts with your practical experience during your Internship with the
Finance Department
11.1 Financial analysis (ratio analysis, horizontal & vertical analysis of the
organization for the last five years)
11.2 Organization analysis with reference to the industries listed on the
stock exchange
11.3 Behavior of the studied organization in allocation of various funds to
different assets
11.4 Future prospects of the organization
12. Short-falls/weaknesses of the Finance Department
12.1 Critical analysis of the management patterns of the organization with
reference to financial operations, weak areas that need to be improved.
13. Conclusions & recommendations for improvement
14. References & Sources used
15. Annexes
Note: The report should be double space typed on A4 size, 75 gram paper, with bold
headings & sub-headings, with margins set as top, bottom & right 1 inch whereas left 1.5
inch. These typed pages should be hard board binding in black colour consisting of 25 to 30
pages. Latest Mailing Address, Roll Number, Registration Number & Telephone Number
should be clearly mentioned in the report.
3. FORMAT OF THE INTERNSHIP REPORT FOR MBA
(MARKETING)
1. Title Page
2. Acknowledgements
3. List of Contents
4. List of tables & illustrations, if any
5. Introduction
6. Objectives of studying the organization
7. Overview of the organization
7.1 Brief history
7.2 Nature of the organization
7.3 Business volume
7.4 Profile of employees
7.5 Product lines
8. Organizational structure
8.1 Main offices
8.2 Marketing operations
9. Structure of the Marketing Department
9.1 Number of employees working in the Marketing Department
9.2 Marketing operations
10. Functions of the Marketing Department
10.1 Marketing strategy
10.2 Product planning, development & management
10.3 Pricing strategy
10.4 Distribution strategy
10.5 Promotional strategy
4. 11. Critical analysis of the theoretical concepts relating to practical experiences i.e.
relate the theoretical concepts with your practical experience during your Internship with the
Marketing Department
11.1 Success and failure of different products of the organization in the market along with
reasons
11.2 Major competitors of the organization
11.3 Future prospects of the organization
12. Short-falls/weaknesses of the Marketing Department
12.1 Critical analysis of the management patterns of the organization with reference to
marketing operations, weak areas which need to be improved.
13. Conclusions & recommendations for improvement
14. References & Sources used
15. Annexes
Note: The report should be double space typed on A4 size, 75 gram paper, with bold
headings & sub-headings, with margins set as top, bottom & right 1 inch whereas left 1.5
inch. These typed pages should be hard board binding in black colour consisting of 25 to 30
pages. Latest Mailing Address, Roll Number, Registration Number & Telephone Number
should be clearly mentioned in the report.
5. FORMAT OF THE INTERNSHIP REPORT FOR MBA
(MIS)
1. Title Page
2. Acknowledgements
3. List of Contents
4. List of tables & illustrations, if any
5. Introduction
6. Objectives of studying the organization
7. Overview of the organization
7.1 Brief history
7.2 Nature of the organization
7.3 Business volume
7.4 Profile of employees
7.5 Product lines
8. Organizational structure
8.1 Main offices
8.2 MIS operations
9. Structure of the MIS Department
9.1 Number of employees working in the MIS Department
10. Functions of the MIS Department
10.1 Major Functions
10.2 Support to other departments
11. Critical analysis of the theoretical concepts relating to practical experiences i.e.
relate the theoretical concepts with your practical experience during your Internship with the
MIS Department
11.1 Requirement analysis
11.2 Data gathering
11.3 System Design
11.4 Implementation
6. 12. Short-falls/weaknesses of the MIS Department
13. Conclusions & recommendations for improvement
14. References & Sources used
15. Annexes
Note: The report should be double space typed on A4 size, 75 gram paper, with bold
headings & sub-headings, with margins set as top, bottom & right 1 inch whereas left 1.5
inch. These typed pages should be hard board binding in black colour consisting of 25 to 30
pages. Latest Mailing Address, Roll Number, Registration Number & Telephone Number
should be clearly mentioned in the report.
7. FORMAT OF THE INTERNSHIP REPORT FOR MBA
(HRM)
1. Title Page
2. Acknowledgements
3. List of Contents
4. List of tables & illustrations, if any
5. Introduction
6. Objectives of studying the organization
7. Overview of the organization
7.1 Brief history
7.2 Nature of the organization
7.3 Business volume
7.4 Profile of employees
7.5 Product lines
8. Organizational structure
8.1 Main offices
8.2 HRM operations
9. Structure of the HRM Department
9.1 Number of employees working in the HRM Department
10. Functions of the HRM Department
10.1 Major Functions
10.2 Support to other departments
11. Critical analysis of the theoretical concepts relating to practical experiences i.e.
relate the theoretical concepts with your practical experience during your Internship with the
HRM Department
11.1 Requirement analysis
11.2 Data gathering
11.3 System Design
8. 11.4 Implementation
12. Short-falls/weaknesses of the HRM Department
13. Conclusions & recommendations for improvement
14. References & Sources used
15. Annexes
Note: The report should be double space typed on A4 size, 75 gram paper, with bold
headings & sub-headings, with margins set as top, bottom & right 1 inch whereas left 1.5
inch. These typed pages should be hard board binding in black colour consisting of 25 to 30
pages. Latest Mailing Address, Roll Number, Registration Number & Telephone Number
should be clearly mentioned in the report.