
Recommended
Recommended
More Related Content
Similar to 1 ACC ACF 2400 – Semester 2, 2017 Individual Assignm.docx
Similar to 1 ACC ACF 2400 – Semester 2, 2017 Individual Assignm.docx (20)
More from honey725342
More from honey725342 (20)
Recently uploaded
Recently uploaded (20)
1 ACC ACF 2400 – Semester 2, 2017 Individual Assignm.docx
- 1. 1 ACC ACF 2400 – Semester 2, 2017 Individual Assignment 1: Building a Business Dashboard Overview A business dashboard is ‘a style of reporting that depicts KPIs, operational or strategic information with intuitive and interactive displays’ (Turban et al., 2015 p. 380). It is a single screen snapshot of how a business, department, or process is performing. The design varies considerably from one application to another, and even between businesses, but a common feature of a dashboard is that it uses graphs, coloured text, and symbols to show the viewer, at a glance, the current status. A dashboard should only contain information that actually influences performance. Many dashboards are interactive because it can be difficult to show every important detail at once.
- 2. You are an employee at Australian Electronics Pty Ltd. You have been assigned the task of designing a report that will be used by managers involved in purchasing, sales, and inventory management. Your boss, Mary Smith, suggest including at least four (4) ratios. Regarding the ratios, Mary thinks that Inventory Turnover and Sales Growth are a must. This is an individual assignment. There is no fixed answer, so be creative!! The spreadsheet must perform ratio analysis to show the current status of the inventory holdings and sales. Marks are awarded according to how well the dashboard meets the requirements specified in the rubric. A data set is supplied with this guide in Moodle (ACC ACF 2400_s2 2017_Inventory Statistics.xlsx). The Inventory Statistics data set contains four sheets: sales value, sales quantity, the quantity of inventory on hand, and the quantity purchased. You should use all sheets in your calculations, but may need to restructure some data on a separate calculation sheet to ensure data is in the format you need. Instructions on how to build a complex interactive scorecard have been published in different journals such as the Journal of Accountancy
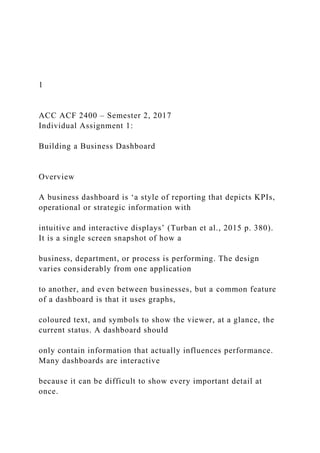
- 3. (http://www.journalofaccountancy.com/issues/2011/feb/2009242 7.html), but you do not have to build such a complex system if your spreadsheeting skills are not well developed. The table below contrasts two different approaches. The example on the left shows 7 ratios in a non- interactive dashboard, with three graphs and one table of numbers. It is clearly not an inventory management dashboard, but if the design features included were tailored to the inventory management context, it would likely earn a pass (providing instructions, the input sheet, and the calculations sheet are acceptable). The example on the right, however, is from the Dashboard your Scorecard article. It is also not an inventory management dashboard and does not show ratios, and so is not acceptable, but illustrates elements that will earn higher marks: • It is interactive (note the drop-down box in the bottom right graph to select the person shown); • It uses conditional formatting icons (arrows) in the top right table to indicate the direction of change and so makes the data easier to digest at a glance;
- 4. • It uses spark lines (within cell graphs) in the top right table to show historical changes. http://www.journalofaccountancy.com/issues/2011/feb/2009242 7.html 2 Pass High distinction Learning objectives assessed: The purpose of this assignment is to give you practice in designing and developing a reporting system using good spreadsheet design practice. Some independent research will be required to find out how to construct the elements of the report, particularly if you are attempting the high distinction requirements. In terms of the learning outcomes shown in the unit guide, this assessment task tests your achievement of objective 4, synthesise design principles to develop financial
- 5. models that assist in decision making, and objective 5, apply critical thinking, problem solving and communication skills to analyse, evaluate and interpret business processes and the accounting data that is generated. In terms of the unit content, this assignment is based on a set of practice guidelines that are used widely, usually referred to as the COSO ERM framework, and shown below. This assignment focuses on the bottom two elements: Information and communication: What information is needed, and how should it be communicated? Monitoring: How will you monitor what is happening? Representative Prior Year Units
- 6. Current Year Units Percent Change Year-to-Date Dollar Sales Allen Pearson 924 942 2% Janet Sellers 1,053 1,015 -4% Mark Stevens 481 522 8% Mary Daniel 521 464 -12% Scott Edwards 452 466 3% Analysis of Sales TrendsAllen Pearson 28% Janet Sellers 30% Mark Stevens
- 7. 15% Mary Daniel 13% Scott Edwards 14% - 500 1,000 1,500 Allen Pearson Janet Sellers Mark Stevens Mary Daniel Scott Edwards Unit Sales (000s) Commercial Government Residential New England Red Classic River Magic
- 8. Southern Charm Waverly White Pine - 50 100 150 200 250 300 350 Brick Styles Unit Sales (000s) 3 Marks Criteria for marking: This assignment is worth 15% of your
- 9. total marks. You will be assessed for the quality of your instructions on how to use the spreadsheet, the amount of analysis performed, and the usefulness and attractiveness of the output. Mark breakdown per task Task Marks A (instruction sheets) 3 B (data input sheet) 3 C (calculations) 2 D (report) 7 Total 15 Required a) Prepare an instruction sheet that explains how to use your spreadsheet. Instructions should be brief. Aim for no more than 500 words. The instruction sheet should include this information: • Your name • Purpose of spreadsheet • Description of layout
- 10. • Where to enter data • Which ratios are shown and how they are calculated • A description of the information shown on the report b) Assume that the data input sheets are imported from an Enterprise System database, and so no manual data entry is required. Sometimes, however, the import process fails, and incorrect data is assigned to each cell (e.g. numbers where product codes should be). To obtain a credit or above for this part of the task, format the data input sheets (the ACC ACF 2400_s2 2017_Inventory Statistics.xlsx file available on Moodle) to highlight invalid values. c) Construct the data processing (calculation) sheet or sheets (see marking rubric for more details). d) Construct an attractive report sheet (see marking rubric for more details) Submission: Submission is via Moodle on Sunday 10 September 11.59pm Submission format: .xls or .xlsx spreadsheet file. Assume that your tutor only has access to Microsoft Excel. You may develop
- 11. your solution using another program, such as Open Office Calc, Google Sheets, Numbers, and so on, but must save and submit your work as an Excel sheet. Word limit: Instruction sheet: No more than 500 words. 4 Resources: The assignment is designed to be completed using Microsoft Excel, which is available in the computer laboratories. It can potentially also be completed using other spreadsheet platforms, such as Google Sheets or Open Office Calc; however, most of the teaching staff are only familiar with Excel and so may not be able to provide any meaningful assistance if you choose to attempt the assignment using a competing product. A considerable amount of information about each command you are asked to use is available on the
- 12. unit Moodle site and the Internet. For example, a simple Google search generated these results: • Conditional formatting: 514,000 results for Excel, 64,900 results for Google sheets • Conditional formatting icons: 50,800 results for Excel, feature not supported in Google Sheets and so has to be implemented via nested IFs or category-based lookup functions (e.g. LOOKUP, VLOOKUP, MATCH) • Conditional formatting colour scales: 127,000 results for Excel, 2,210 results for Google Sheets • Slicer: 408,000 results for Excel, feature not available in Google Sheets • Excel Form controls/Active X controls: 160,000,000 results (a very popular topic) Note: Excel’s form controls are available on the Developer tab, which is hidden until you right click on the top menu, select Customize the Ribbon, and the check the Developer option. • Google sheets form controls/drop down lists: 79,000 results (limited functionality, but can be implemented with some effort) • Spark lines: 307,000 results for Excel, 13,400 results for Google Sheets
- 13. This is a major assignment in which you are expected to put in a substantial amount of work to obtain higher grades. However, you could ask your tutor or one of the lecturers for some guidance about these commands. Although we recognise that some commands can be a little bit difficult to implement, you have access to plenty of resources such as learning materials and other web sources (as indicated above). Conditional formatting icons, in particular, are not easy to customise. Do not expect teaching staff to give you the answer directly, but we will try to help you to work out why your model is not working properly. Teaching staff will not be impressed if you ask a basic question, such as “What is conditional formatting?” or “Where can I find form controls in the menu?”. That type of question suggests a lazy intellectual approach that is not consistent with university-level study. 5
- 14. Marking Rubric for Spreadsheet High Distinction Distinction Credit Pass Unsatisfactory (Fail) Instructions Basic requirements: Shows • Author • Purpose of spreadsheet • Description of layout • Where/how to enter data • Formula for each ratio used • Examples of special features in report (e.g. conditional formatting) High Distinction • Professional quality. • Concise, but well- explained.
- 15. • Error free (e.g. grammatical mistakes). • Structure of the spreadsheet is very clear. • Clear examples of special features, such as slicers, provided. All basic requirements, but few errors. Instructions mostly clear, and suitable for distribution to a professional audience. Examples provided for all features, but few problems to understand. All basic requirements but
- 16. some errors. Instructions could be clearer, but the instructions are usable. Examples provided for some, but not all, special features (e.g. conditional formatting) Meets basic requirements, but some elements were not explained well. Should not be distributed without editing. E.g. some poor grammar, structure of workbook or some variable definitions not explained
- 17. well. Does not meet basic requirements. Instructions missing or hard to understand. Document contains many errors. Cannot be distributed to a professional audience. 6 High Distinction Distinction Credit Pass Unsatisfactory (Fail) Input • 3 different rules to highlight invalid data on all four input sheets.
- 18. • Each rule must apply to multiple cells, and overall, all data cells must be tested (e.g. you could test whether cells contain the correct data type or that numbers are not too high or low. • In Excel, this can be done via the Data Validation command with the circle invalid data option enabled, or via conditional formatting. • Google Sheets does not have a circle invalid data option, so you have to use conditional
- 19. formatting. • Note that this is a challenging task that may require a formula-based rule to highlight cells that contain numbers instead of text. • 2 different rules to highlight invalid data on all four input sheets, OR • 3 rules but not all input sheets or not all data cells are covered. • One rule to highlight invalid data, OR • 2 rules, but not all input sheets or not all data
- 20. cells are covered. • This is an advanced task for students attempting to obtain an overall grade of more than pass. • Input sheets are essentially the same as sheets downloaded. 7 High Distinction Distinction Credit Pass Unsatisfactory (Fail) Calculations • Separate calculation sheet(s) • Values are from formulas or pivot tables, not hard-
- 21. coded including full use of absolute and relative references (whenever necessary). • Compulsory ratios (2) are calculated correctly. • Separate calculation sheet(s) • Values are from formulas or pivot tables, not hard-coded including full use of absolute and relative references (whenever necessary). • One of the compulsory ratios is calculated correctly.
- 22. • Separate calculation sheet(s) • Values are from formulas or pivot tables, not hard-coded including some use of absolute and relative references (whenever necessary). • Some data on calculations sheet is hard-coded (not from formulas or pivot tables). • No calculation sheets added.
- 23. 8 High Distinction Distinction Credit Pass Unsatisfactory (Fail) Report • Meets Pass requirements • Creative and attractive dashboard design that is also functional (e.g. don’t use exotic and hard-to- interpret designs, such as 3D charts unless you have a reason). Plus the following 3 requirements: • One graph or table is interactive. Use a slicer, a form control, an Active-X control, or similar. A pivot table on its own is not sufficiently interactive. • Spark lines in a table • Icons or a colour scale from conditional formatting used in a table. The icons or colours must be explained within the
- 24. dashboard. • Meets Pass requirements • Creative and attractive dashboard design • Plus 2 of the 3 High Distinction requirements (interactive, spark lines, conditional formatting). • Meets Pass requirements. • Creative and attractive dashboard design. • Plus 1 of the 3 High Distinction requirements (interactive pivot table, spark lines, conditional formatting) • Dashboard fits within a widescreen display with a 1440 x 900 resolution • Four (4) or more ratios including sales growth
- 25. ratio and inventory turnover ratio (these two ratios are compulsory). You have to choose the other 2 (or more) additional ratios • 1-3 graphs and 1-2 tables, but no more than 4 graphs/tables • Reports based on calculations, not hard coded numbers. • Your name and date that updates automatically appear in the footer section of the page when printed • Does not meet basic (Pass) requirements (e.g. less than 3 ratios shown, too large, not enough graphs/tables, or report based on hard coded numbers. Qty inventory on handNameTypeUnit cost (Jan-Jul 2017)Jan-
- 26. 17Feb-17Mar-17Apr-17May-17Jun-17Jul-17Square D WL 500 VACLimit switch385073712414712010210Square D WLM 115 VACLimit switch1575123333614252915Square D D4V 250 VACLimit switch2800821105135153655Square D D4A-2N 480 VACLimit switch210016128440681956188Square D HL-5000 250 VACLimit switch700649451744520351Square D D4A-4N 125VACLimit switch3150491148111872Omron WL 500 VACLimit switch3855350585676803706833963Omron WLM 115 VACLimit switch1581333285500595402463607Omron D4V 250 VACLimit switch2796196182333381399415513Omron D4A-2N 480 VACLimit switch2105180300447370343336350Omron HL-5000 250 VACLimit switch7098998912834113Omron D4A-4N 125VACLimit switch3148939682244320230/115 kV 1-3 Phase, 420 MVACircuit breaker100002911401349147144770kV 4-1 Phase (4X 60 MVA)Circuit breaker1300012153816711144970kV 1-3 Phase (200 MVA)Circuit breaker90002341951912613115/60V 4-1 Phase (4X 30)Circuit breaker1000087533633026115/60V 1-3 Phase (200 MVA)Circuit breaker800035102152733564576586Double Circuit, Strung on both sides, Lattice Tower 1kmTransmission line23305101215453137127Double Circuit, Strung on one side, Lattice Tower 1kmTransmission line1830140412226435345Single Circuit, Lattice Tower 1kmTransmission line14505019644611338104Double Circuit, Strung on both sides, Tubular Steel Pole 1kmTransmission line2620188183471113Double Circuit, Strung on one side, Tubular Steel Pole 1kmTransmission line21604139363842194Single Circuit, Tubular Steel Pole 1kmTransmission line16104032851173126185http://www.windservers.com/domai ns.php?domain=brefkhttp://www.windservers.com/domains.php ?domain=brefohttp://www.windservers.com/domains.php?domai n=brekkhttp://www.windservers.com/domains.php?domain=brel k Purchase qtyNameTypeUnit cost (Jan-Jul 2017)Jan-17Feb-
- 27. 17Mar-17Apr-17May-17Jun-17Jul-17Square D WL 500 VACLimit switch38507003720315282339Square D WLM 115 VACLimit switch1575120147313713810156Square D D4V 250 VACLimit switch280080186114198211120Square D D4A-2N 480 VACLimit switch21001603014879185212323Square D HL- 5000 250 VACLimit switch70060093315223000Square D D4A- 4N 125VACLimit switch31505092892532052580Omron WL 500 VACLimit switch3855300290280270280290300Omron WLM 115 VACLimit switch1581330310290270250230210Omron D4V 250 VACLimit switch2796200180180170160150140Omron D4A-2N 480 VACLimit switch2105200190175180165150135Omron HL-5000 250 VACLimit switch7099021623410914383191Omron D4A-4N 125VACLimit switch31489010711733111452230/115 kV 1-3 Phase, 420 MVACircuit breaker10000290169169202191170070kV 4-1 Phase (4X 60 MVA)Circuit breaker13000102268322271754070kV 1-3 Phase (200 MVA)Circuit breaker90002017215528591748115/60V 4-1 Phase (4X 30)Circuit breaker100001014163206112162115/60V 1-3 Phase (200 MVA)Circuit breaker800040170170710170170170Double Circuit, Strung on both sides, Lattice Tower 1kmTransmission line23301016772308204233142Double Circuit, Strung on one side, Lattice Tower 1kmTransmission line183014040840842419023191Single Circuit, Lattice Tower 1kmTransmission line1450501520213217016175Double Circuit, Strung on both sides, Tubular Steel Pole 1kmTransmission line262020160105109175194Double Circuit, Strung on one side, Tubular Steel Pole 1kmTransmission line2160092239151207230306Single Circuit, Tubular Steel Pole 1kmTransmission line161040701679965142254http://www.windservers.com/doma ins.php?domain=brefkhttp://www.windservers.com/domains.php ?domain=brefohttp://www.windservers.com/domains.php?domai n=brekkhttp://www.windservers.com/domains.php?domain=brel k
- 28. Sales valueNameTypeUnit cost (Jan-Jul 2017)Jan-17Feb-17Mar- 17Apr-17May-17Jun-17Jul-17Square D WL 500 VACLimit switch38506334977681329913314771754750744526539282Squ are D WLM 115 VACLimit switch1575315955174164118285257623207065158782120577S quare D D4V 250 VACLimit switch2800196996472173623163205082578694285238175093S quare D D4A-2N 480 VACLimit switch2100360745375619653331111627539076389970433576S quare D HL-5000 250 VACLimit switch700619474164843271142041111564100628114650Square D D4A-4N 125VACLimit switch3150199144418828305091588809864375626643266079O mron WL 500 VACLimit switch38555089822232777421985966371446936661860651980 Omron WLM 115 VACLimit switch1581339645583593118172275677763208293488113466O mron D4V 250 VACLimit switch279661060353825683710359253431284375614119954O mron D4A-2N 480 VACLimit switch210538307716160963793574399417536354115255175O mron HL-5000 250 VACLimit switch7091271682201561200231419111091104055287244Omro n D4A-4N 125VACLimit switch31482028306165381896172189509537231007606858230/ 115 kV 1-3 Phase, 420 MVACircuit breaker1000018242213368302310785116804619561221773520 145199970kV 4-1 Phase (4X 60 MVA)Circuit breaker1300022429612145872143629328983243295718269391 38348170kV 1-3 Phase (200 MVA)Circuit breaker9000557174139661392749395162965273511618866186 82115/60V 4-1 Phase (4X 30)Circuit breaker1000017827561573941282864386400960949981588669 109115/60V 1-3 Phase (200 MVA)Circuit breaker8000146299285246638053511076802892974135393013 93891Double Circuit, Strung on both sides, Lattice Tower
- 29. 1kmTransmission line2330199817407853164699402845722770367679388268Dou ble Circuit, Strung on one side, Lattice Tower 1kmTransmission line18302949731004174824802350083880483332772193272Sin gle Circuit, Lattice Tower 1kmTransmission line145020423969940228962226620160949131399156743Doub le Circuit, Strung on both sides, Tubular Steel Pole 1kmTransmission line262040522128936137642315896183833563750530178Doub le Circuit, Strung on one side, Tubular Steel Pole 1kmTransmission line2160248681184955351419414515433981710652244872Sing le Circuit, Tubular Steel Pole 1kmTransmission line1610130857130206185853115677262609245332152200http: //www.windservers.com/domains.php?domain=brefkhttp://www. windservers.com/domains.php?domain=brefohttp://www.windse rvers.com/domains.php?domain=brekkhttp://www.windservers.c om/domains.php?domain=brelk Sales qty (amount shipped)NameTypeUnit cost (Jan-Jul 2017)Jan-17Feb-17Mar-17Apr-17May-17Jun-17Jul-17Square D WL 500 VACLimit switch385015928480179192139Square D WLM 115 VACLimit switch1575183104701591279770Square D D4V 250 VACLimit switch2800651582196819310060Square D D4A-2N 480 VACLimit switch210016417829251234175191Square D HL-5000 250 VACLimit switch700895557186151142152Square D D4A-4N 125VACLimit switch3150621309617627518285Omron WL 500 VACLimit switch385512855189143377163170Omron WLM 115 VACLimit switch15811993587517544316966Omron D4V 250 VACLimit switch27961991942912214213442Omron D4A-2N 480 VACLimit switch21051717028257192157121Omron HL- 5000 250 VACLimit switch70916529615418614757112Omron D4A-4N 125VACLimit switch3148591915869369176230/115 kV 1-3 Phase, 420 MVACircuit breaker100001813202961669317313770kV 4-1 Phase (4X 60 MVA)Circuit breaker1300016851532417213210570kV 1-3
- 30. Phase (200 MVA)Circuit breaker9000581541011046612566115/60V 4-1 Phase (4X 30)Circuit breaker100001751511737949466115/60V 1-3 Phase (200 MVA)Circuit breaker8000180103120129339158160Double Circuit, Strung on both sides, Lattice Tower 1kmTransmission line23308116270166305149152Double Circuit, Strung on one side, Lattice Tower 1kmTransmission line183016150742718245118199Single Circuit, Lattice Tower 1kmTransmission line14501344615715010391109Double Circuit, Strung on both sides, Tubular Steel Pole 1kmTransmission line2620149115012065211192Double Circuit, Strung on one side, Tubular Steel Pole 1kmTransmission line216010783159181186312114Single Circuit, Tubular Steel Pole 1kmTransmission line161081781146715114795http://www.windservers.com/doma ins.php?domain=brefkhttp://www.windservers.com/domains.php ?domain=brefohttp://www.windservers.com/domains.php?domai n=brekkhttp://www.windservers.com/domains.php?domain=brel k