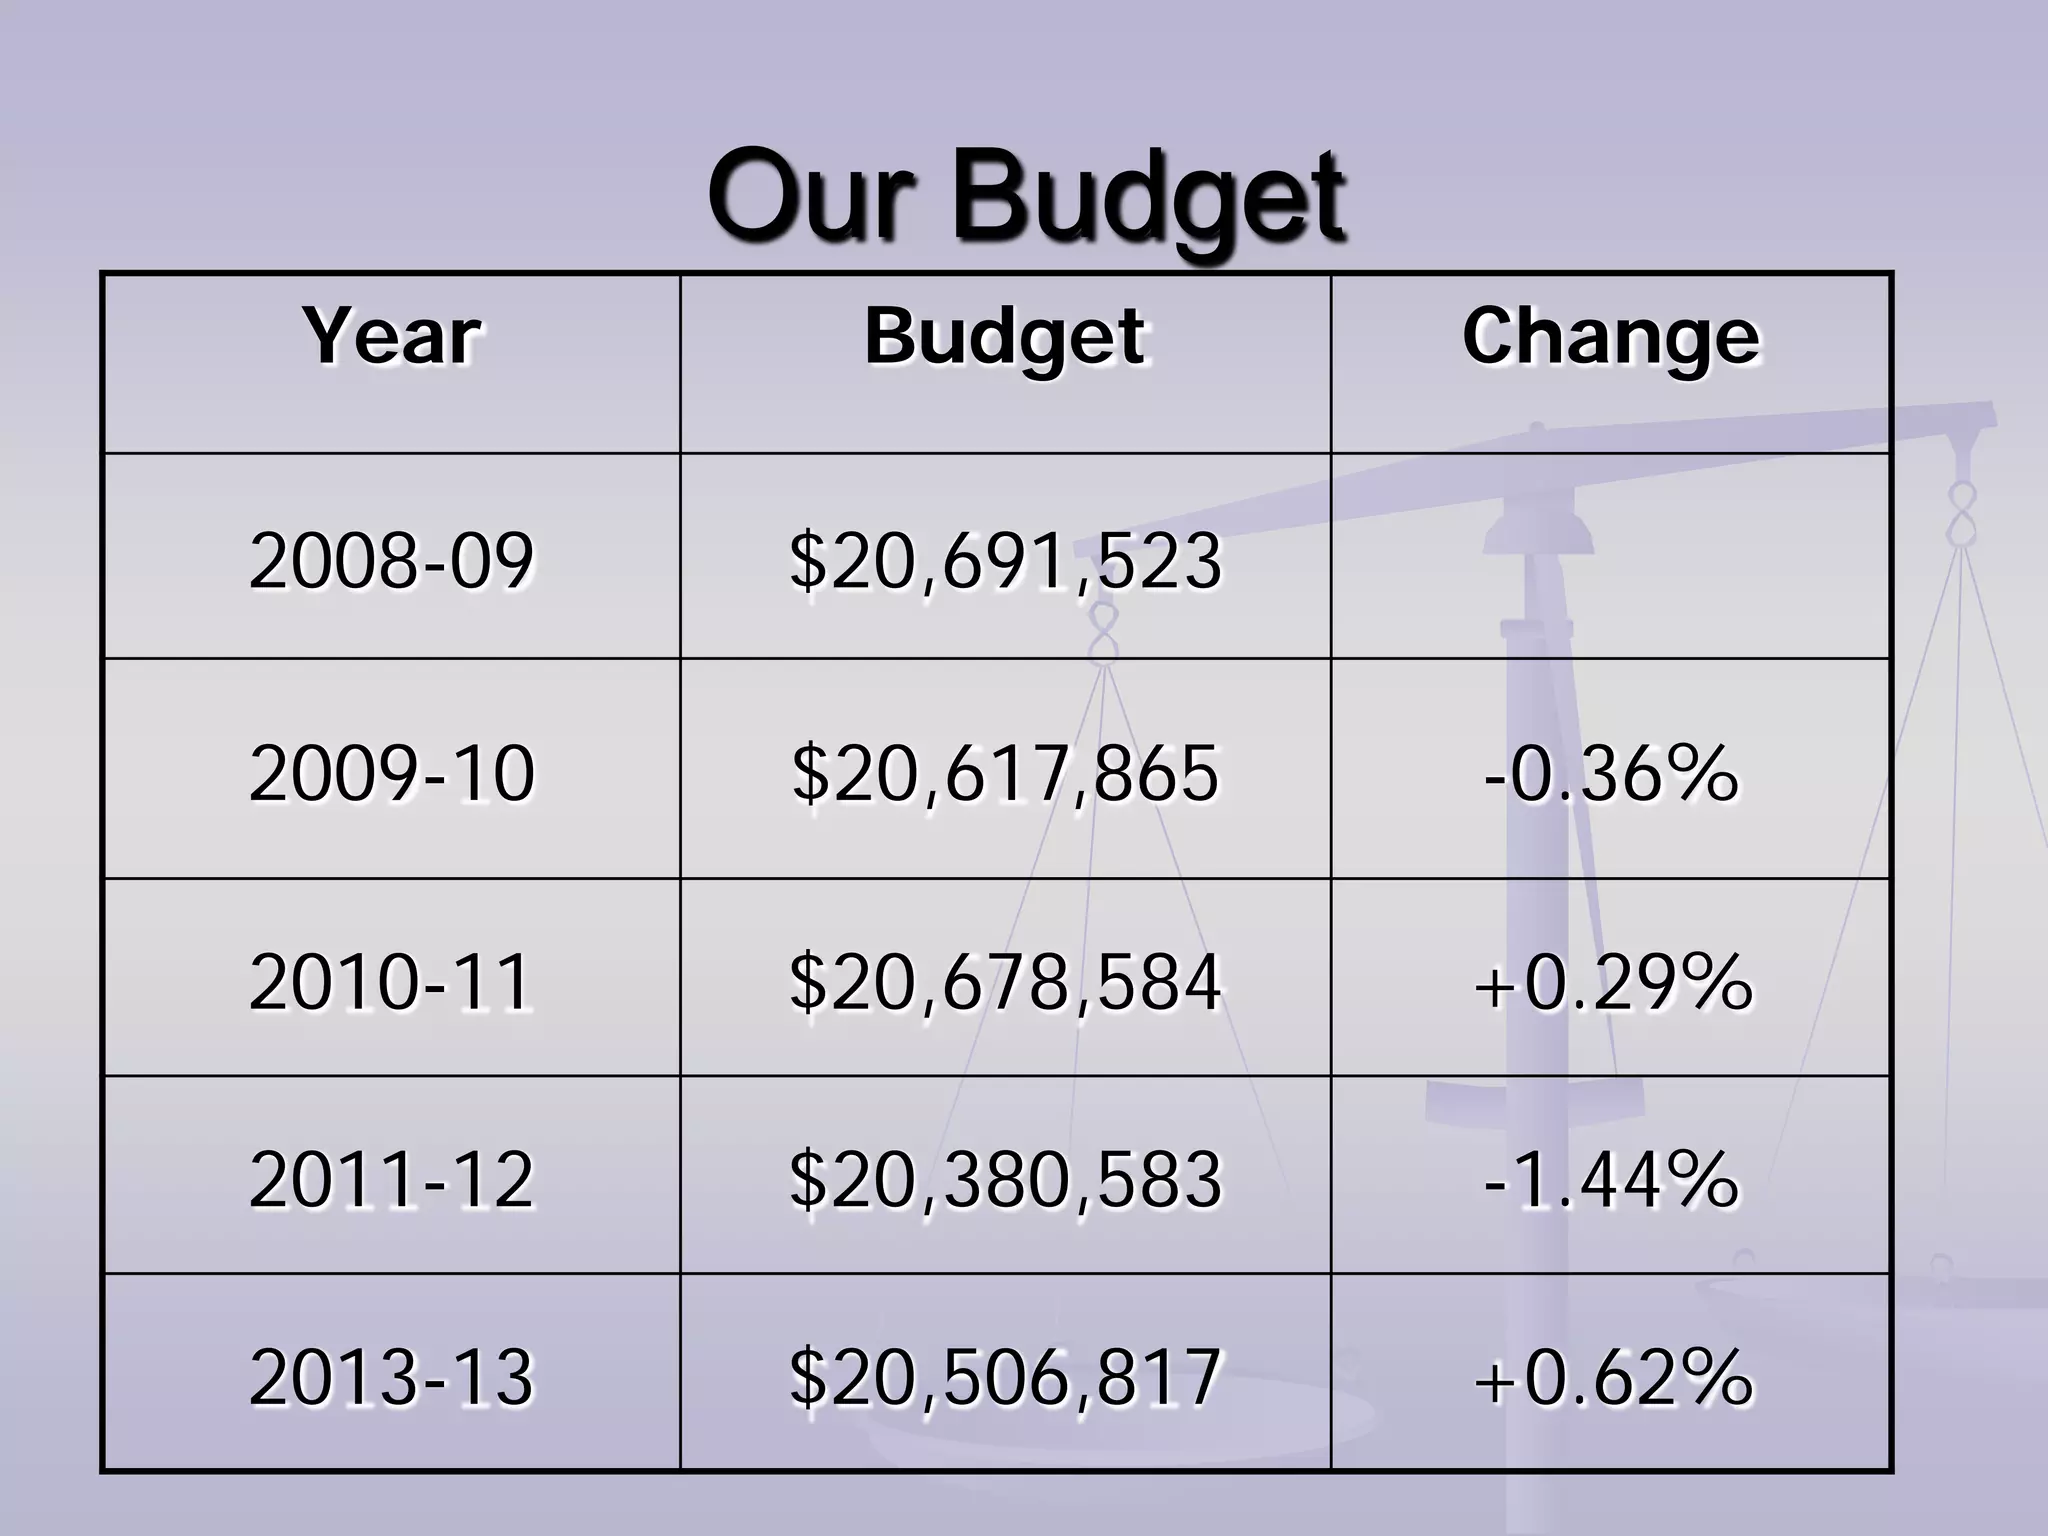
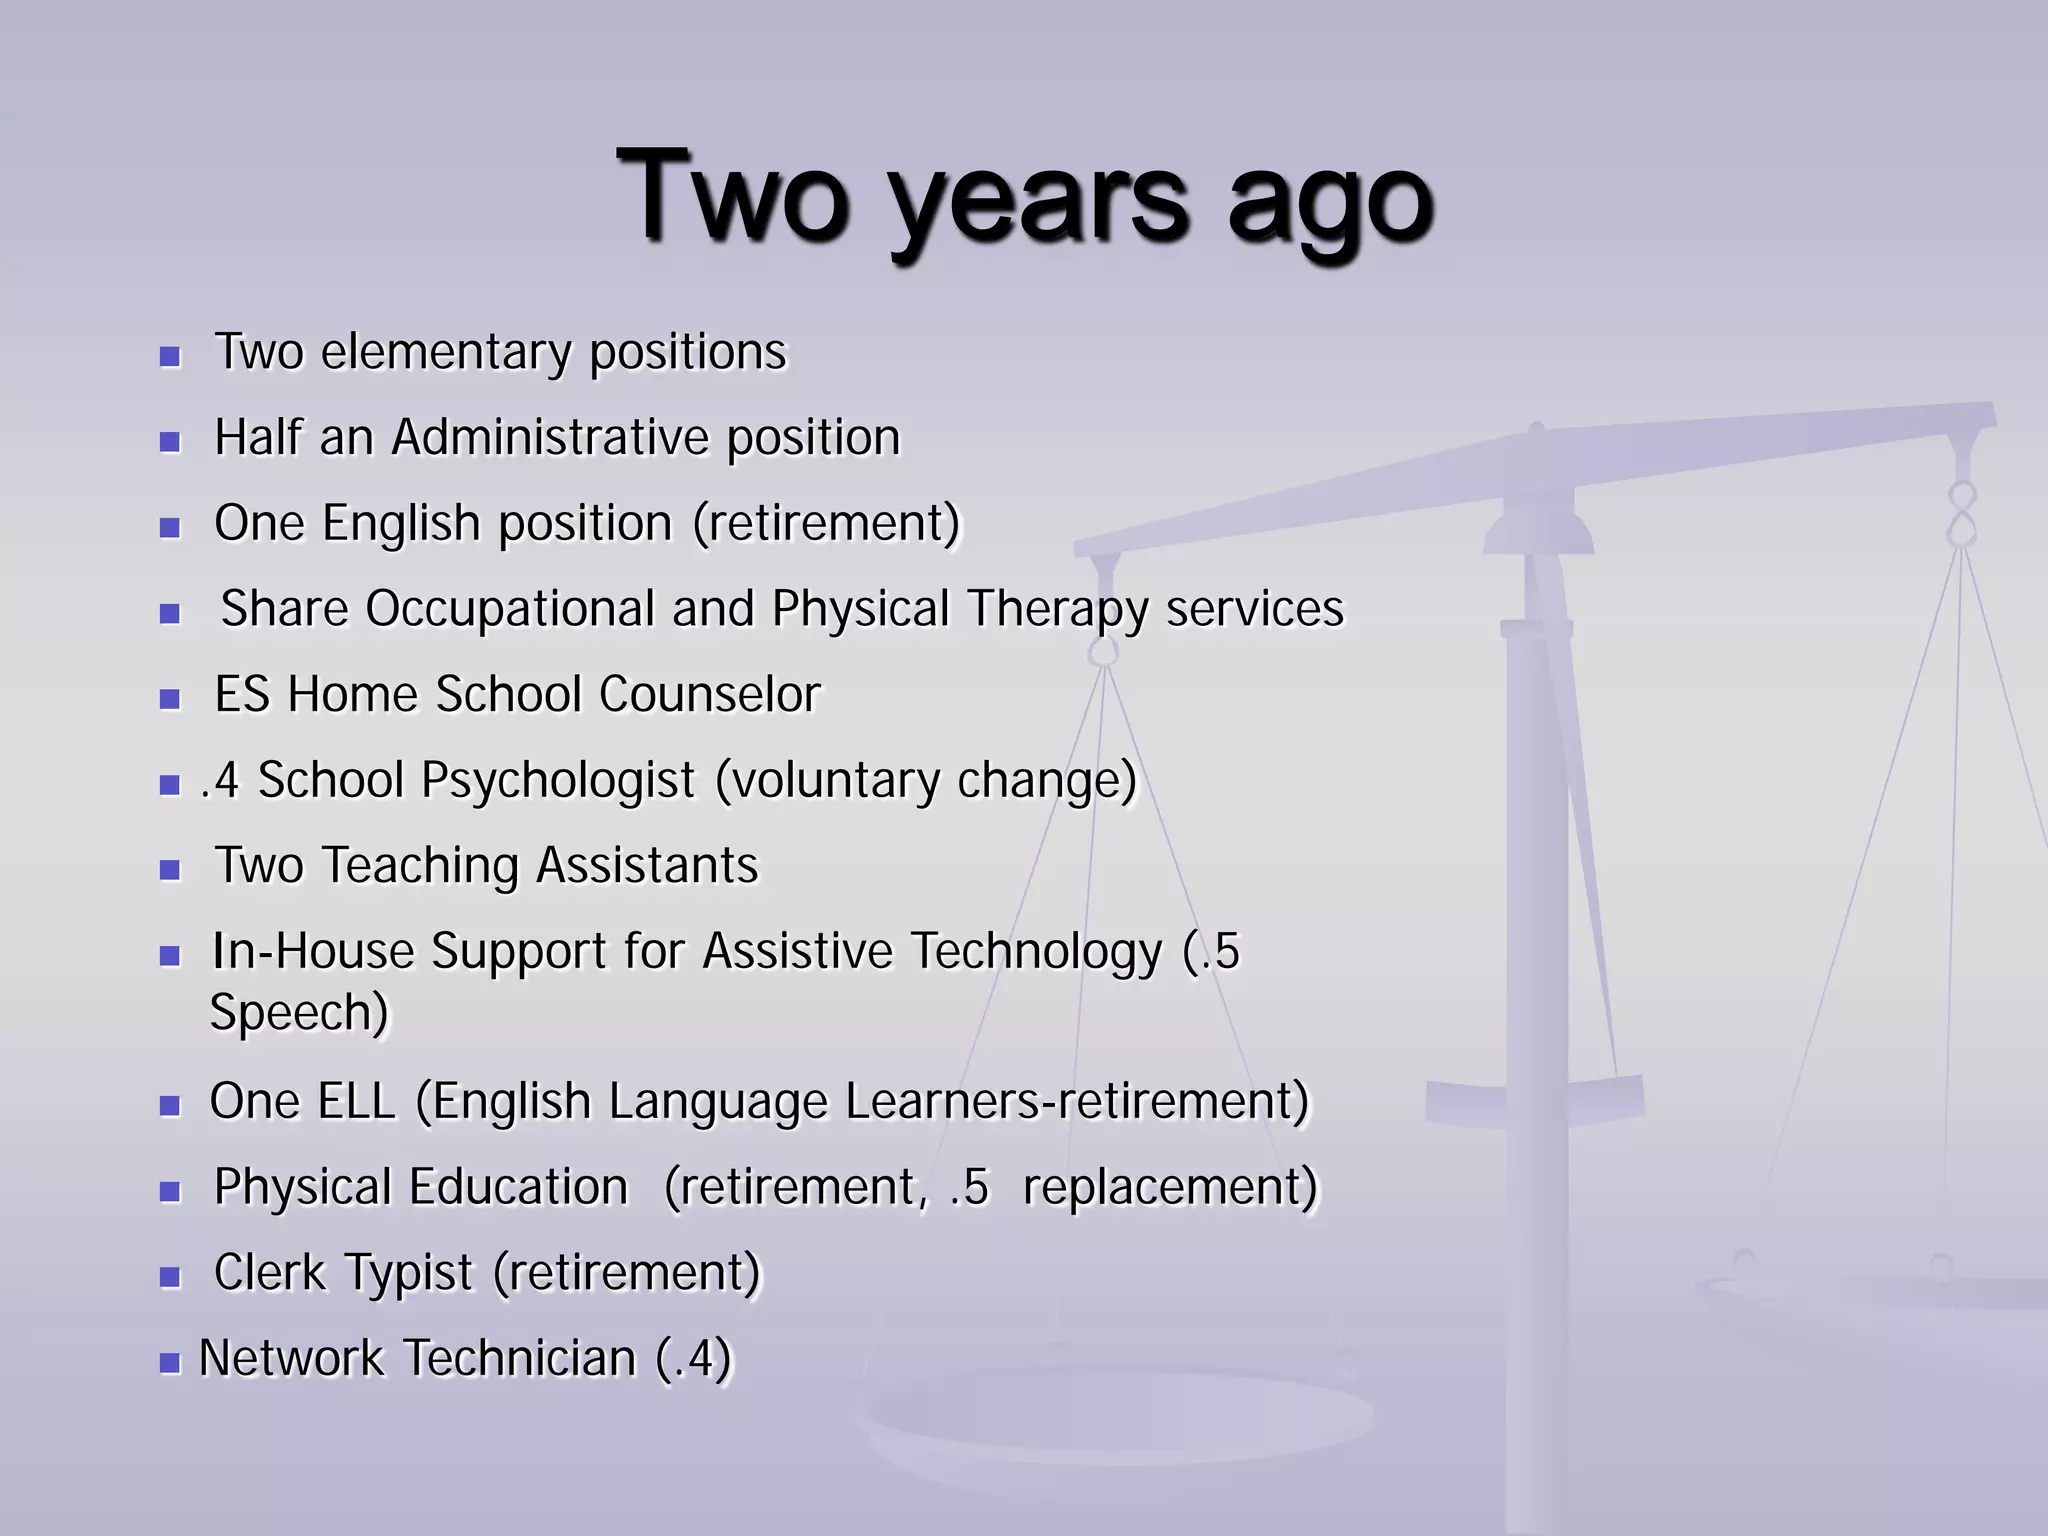
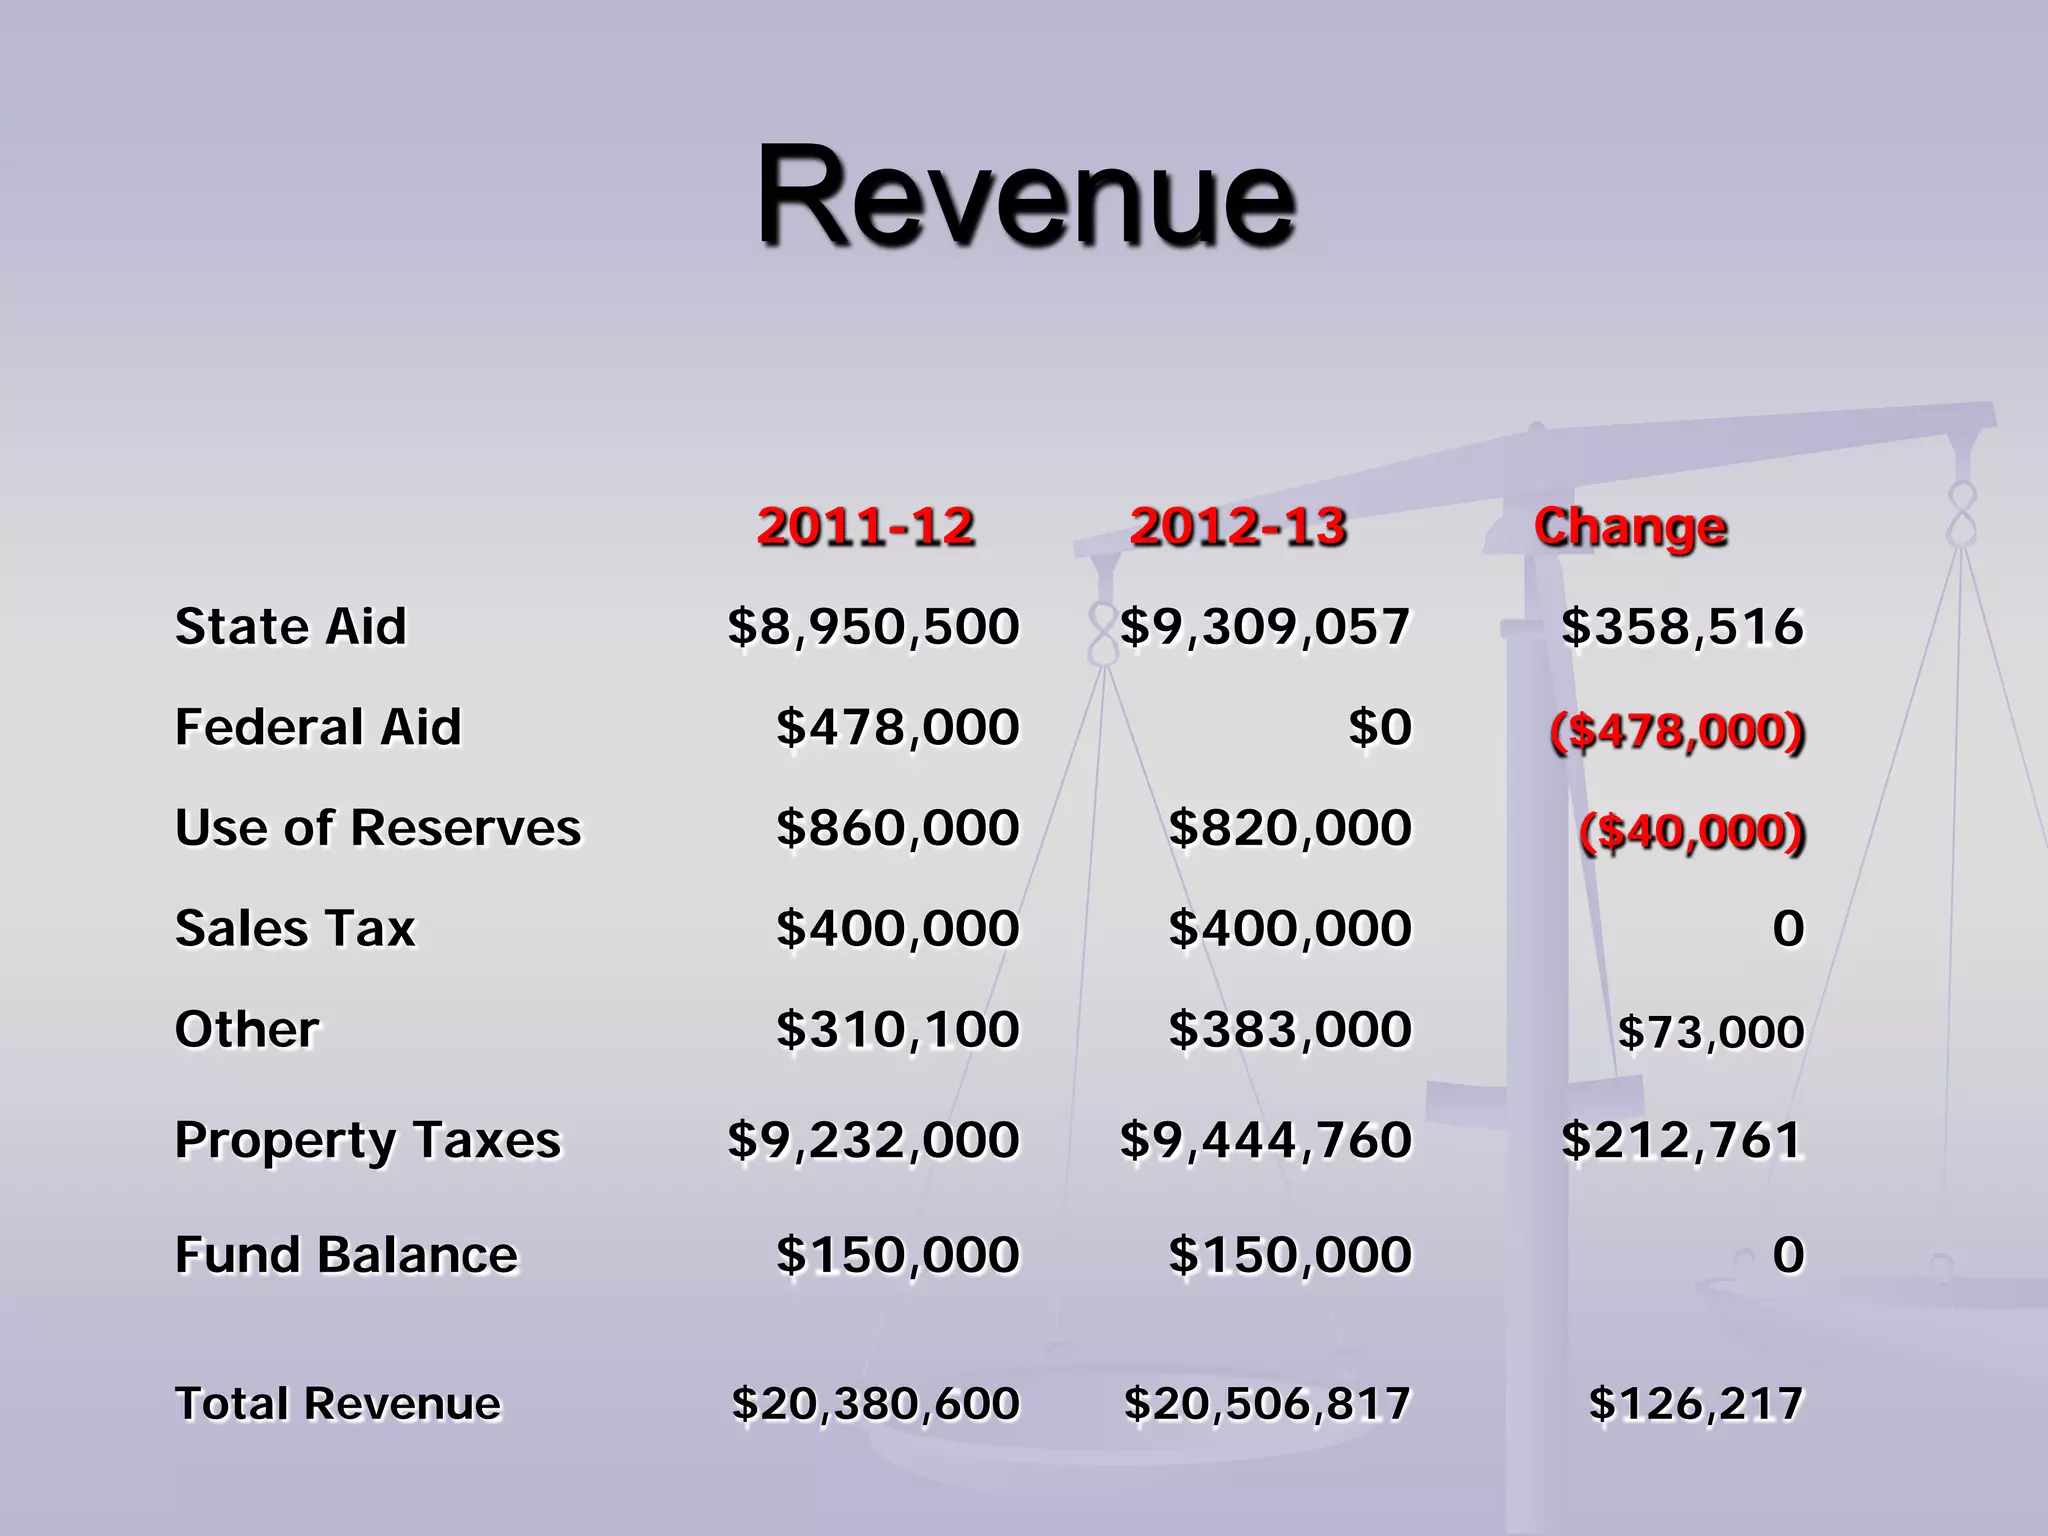
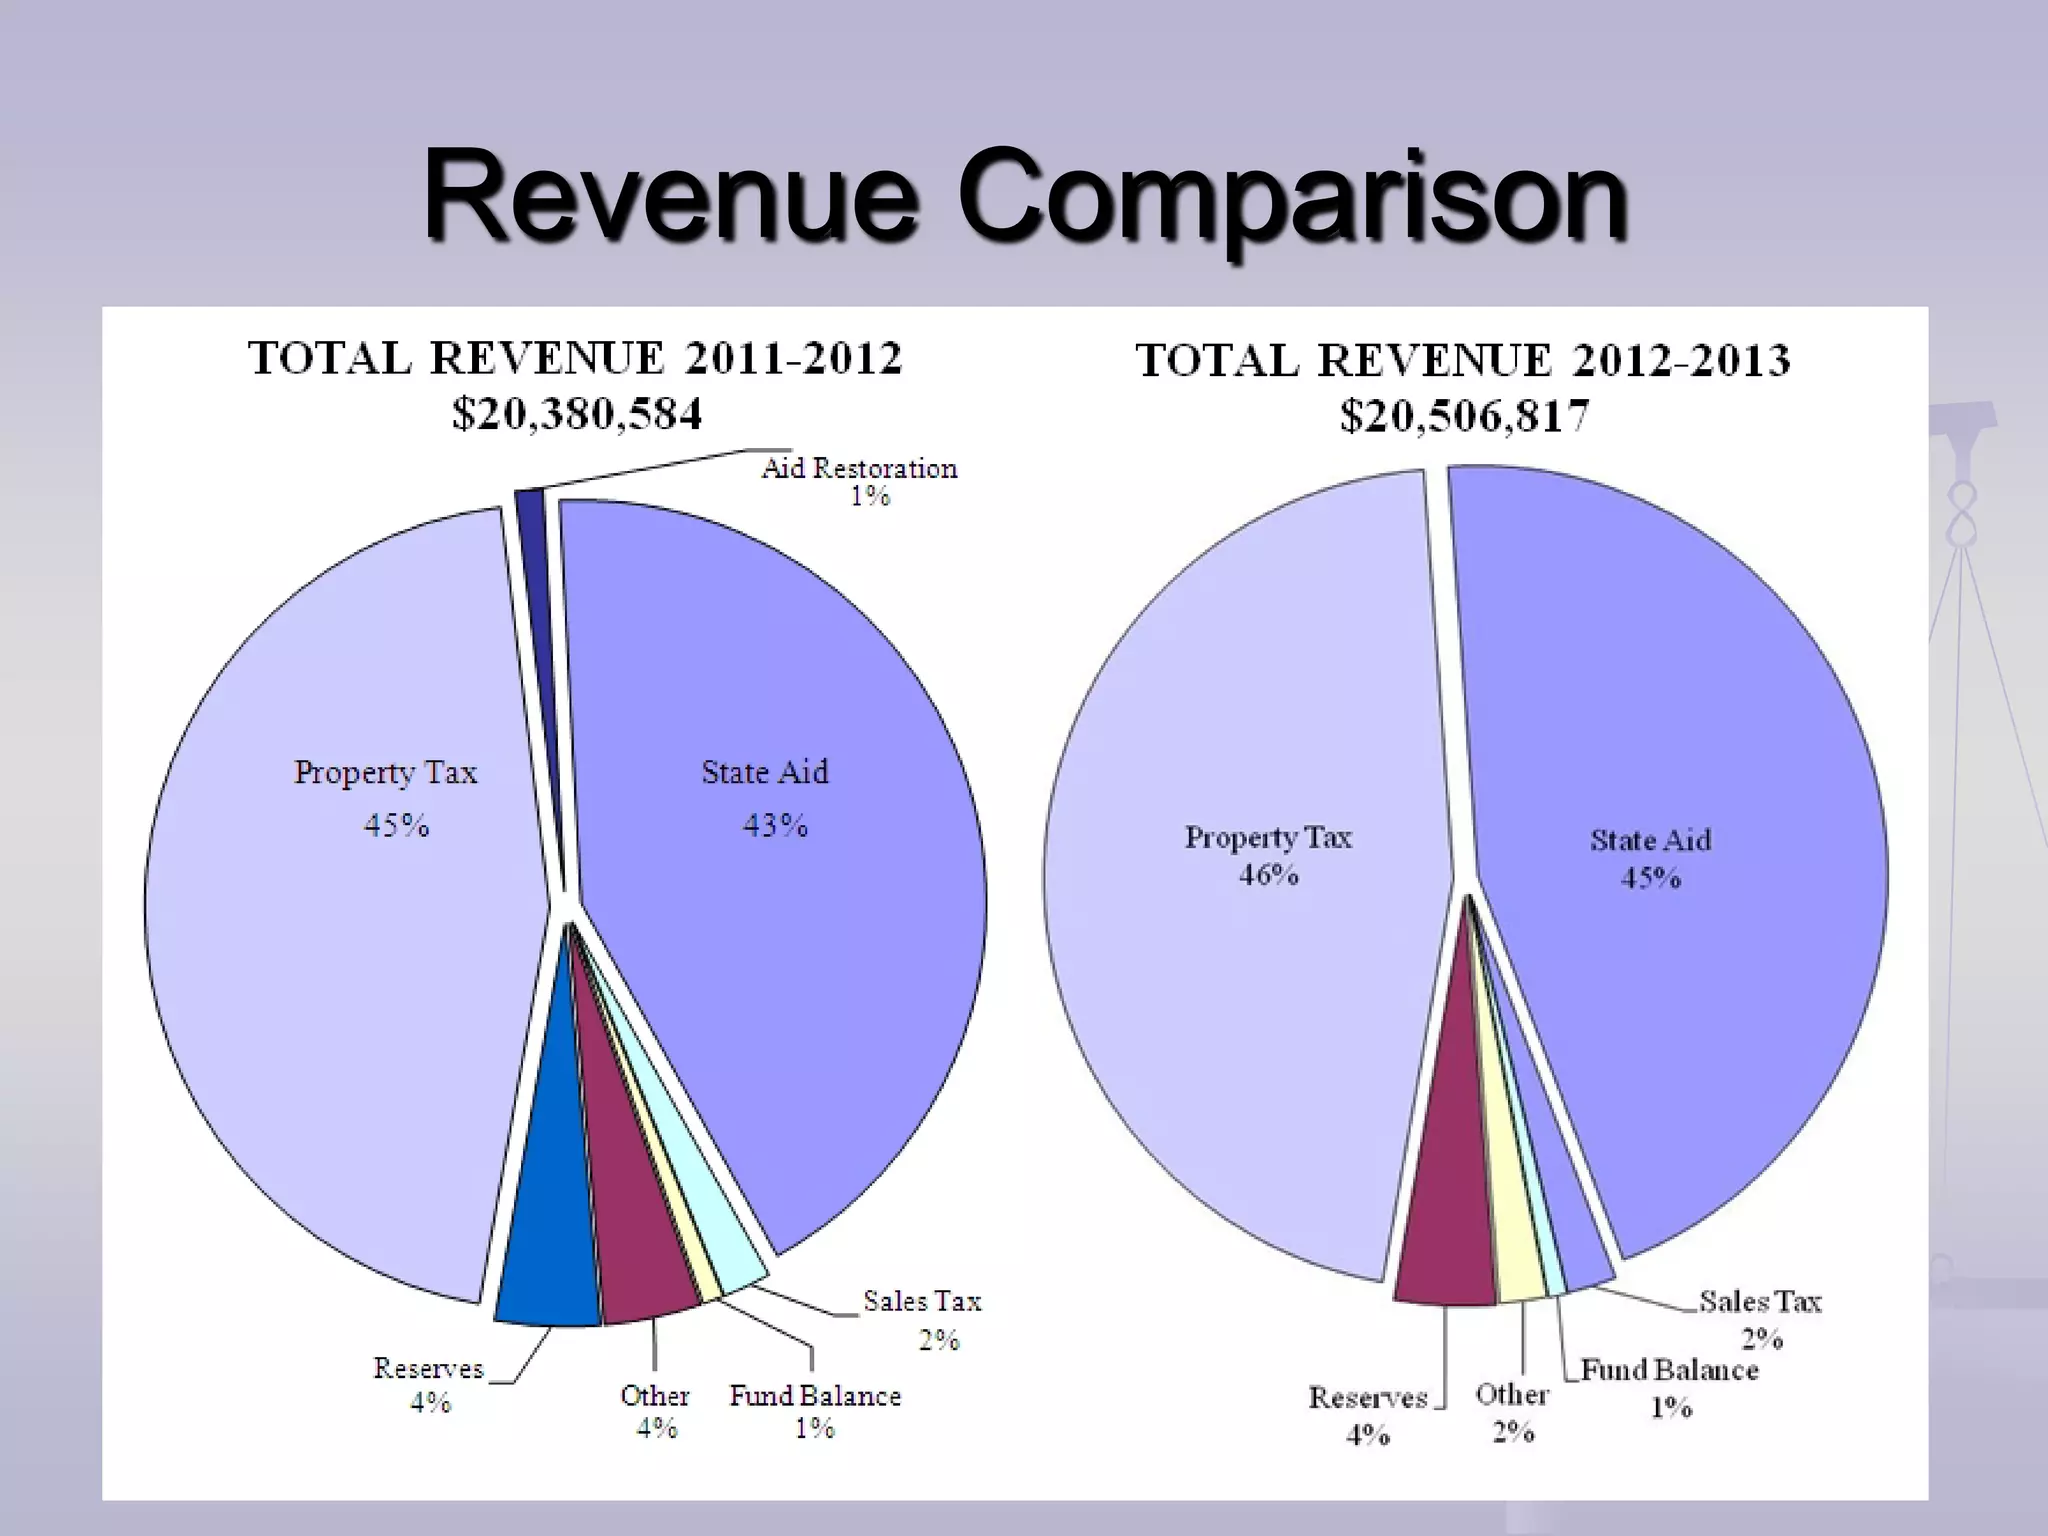
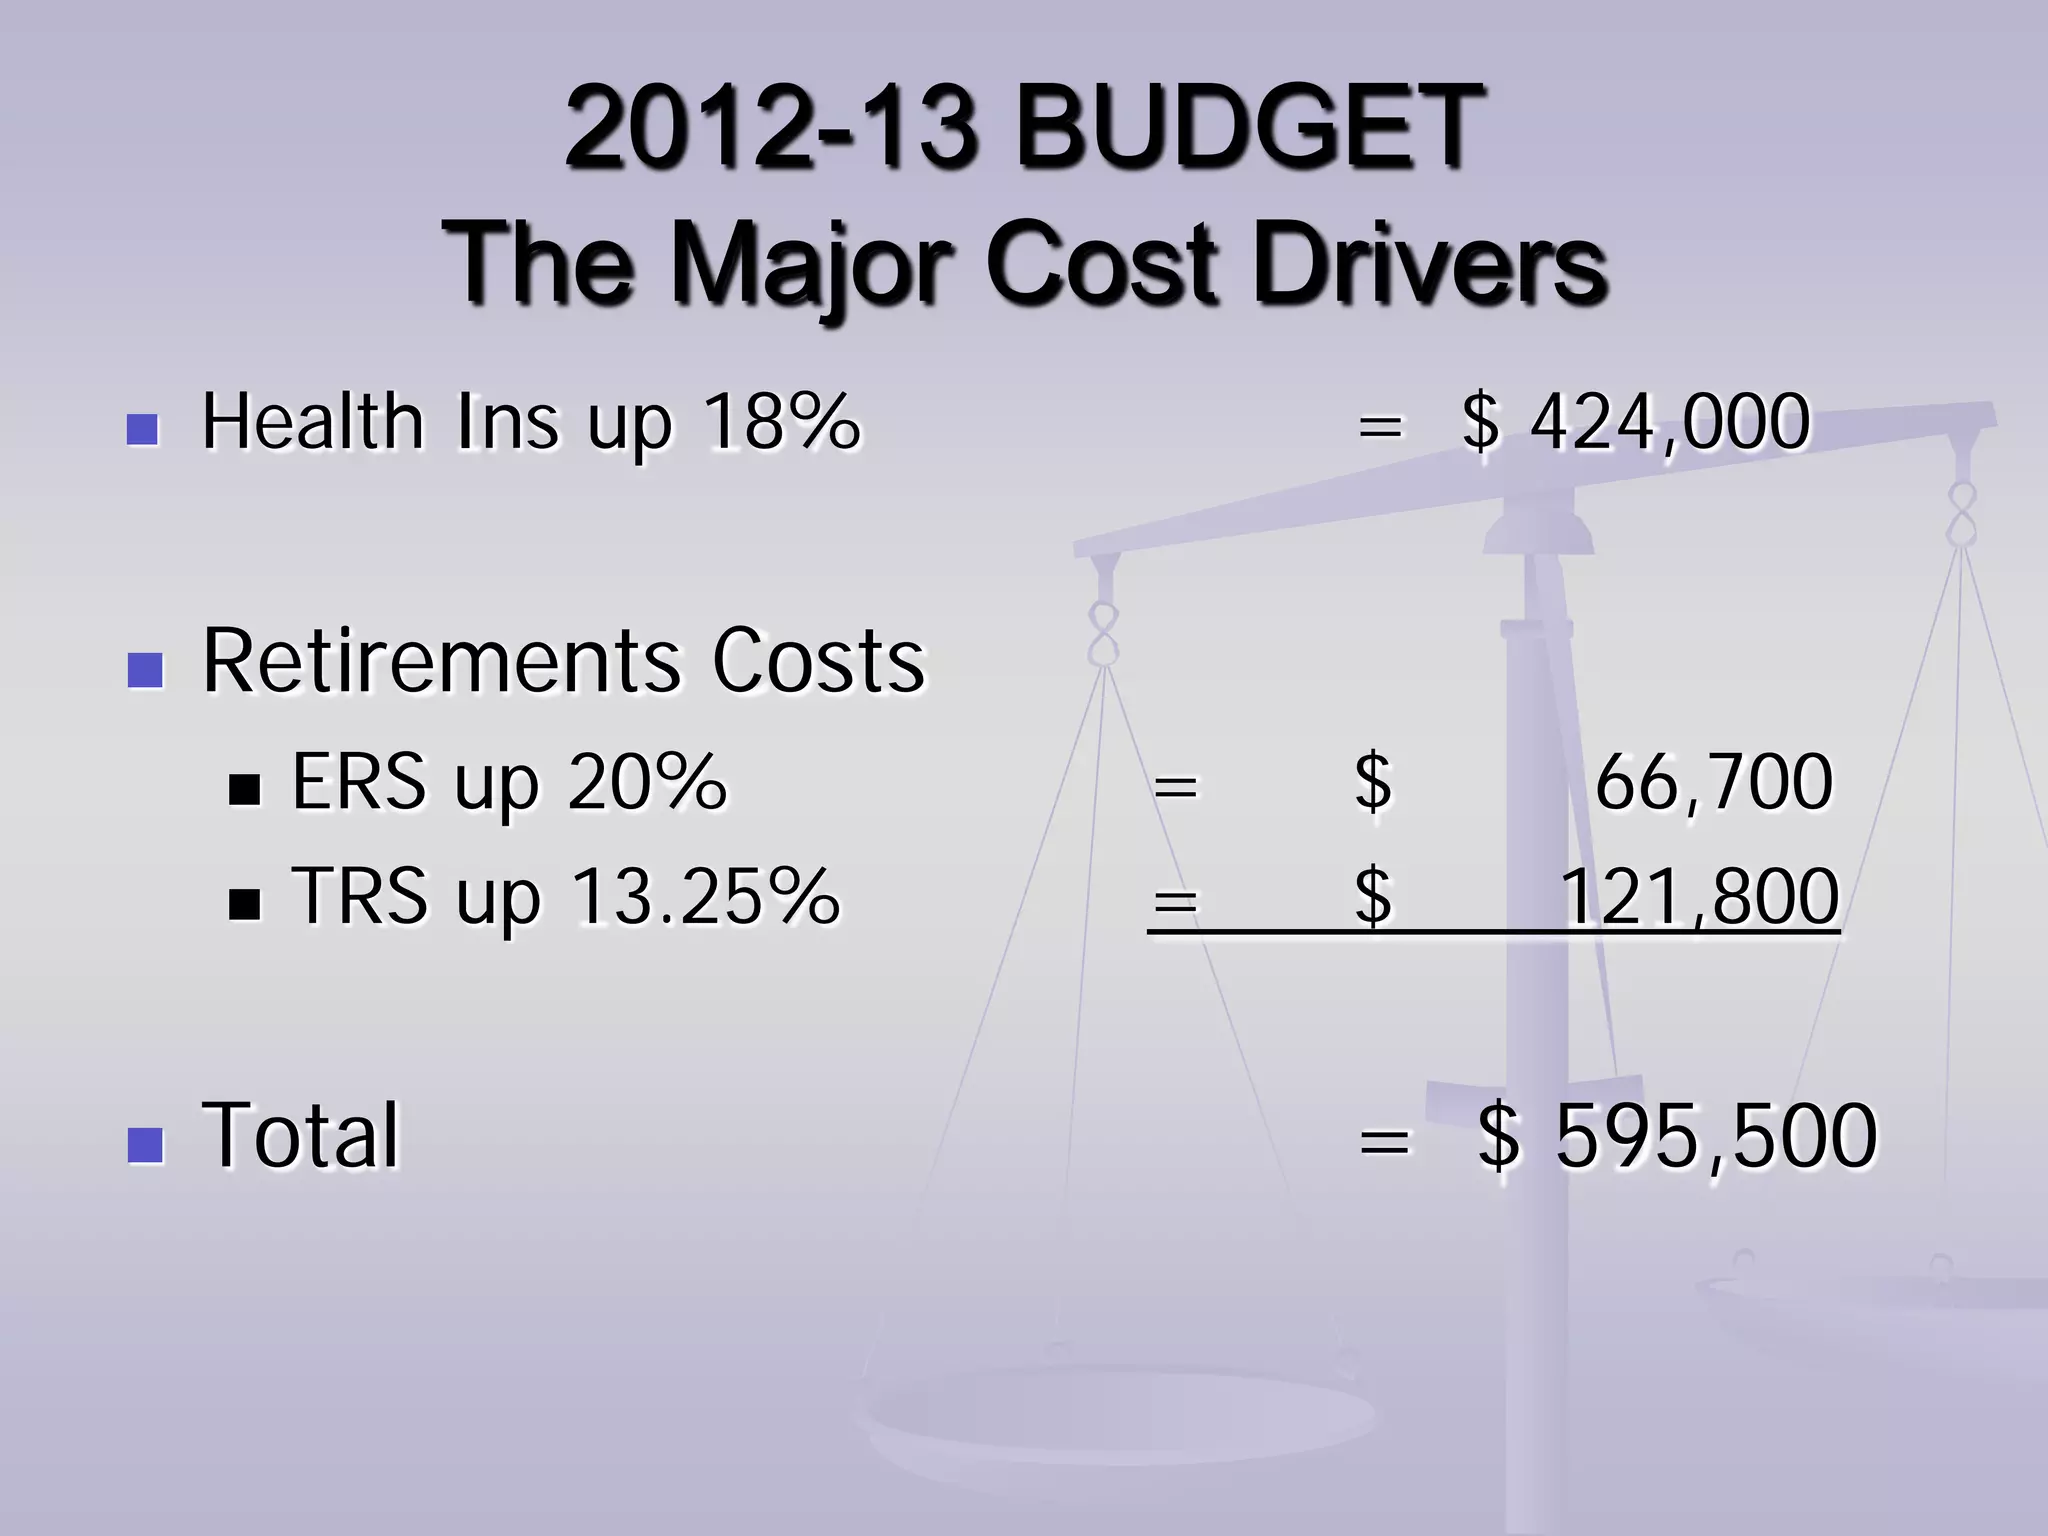
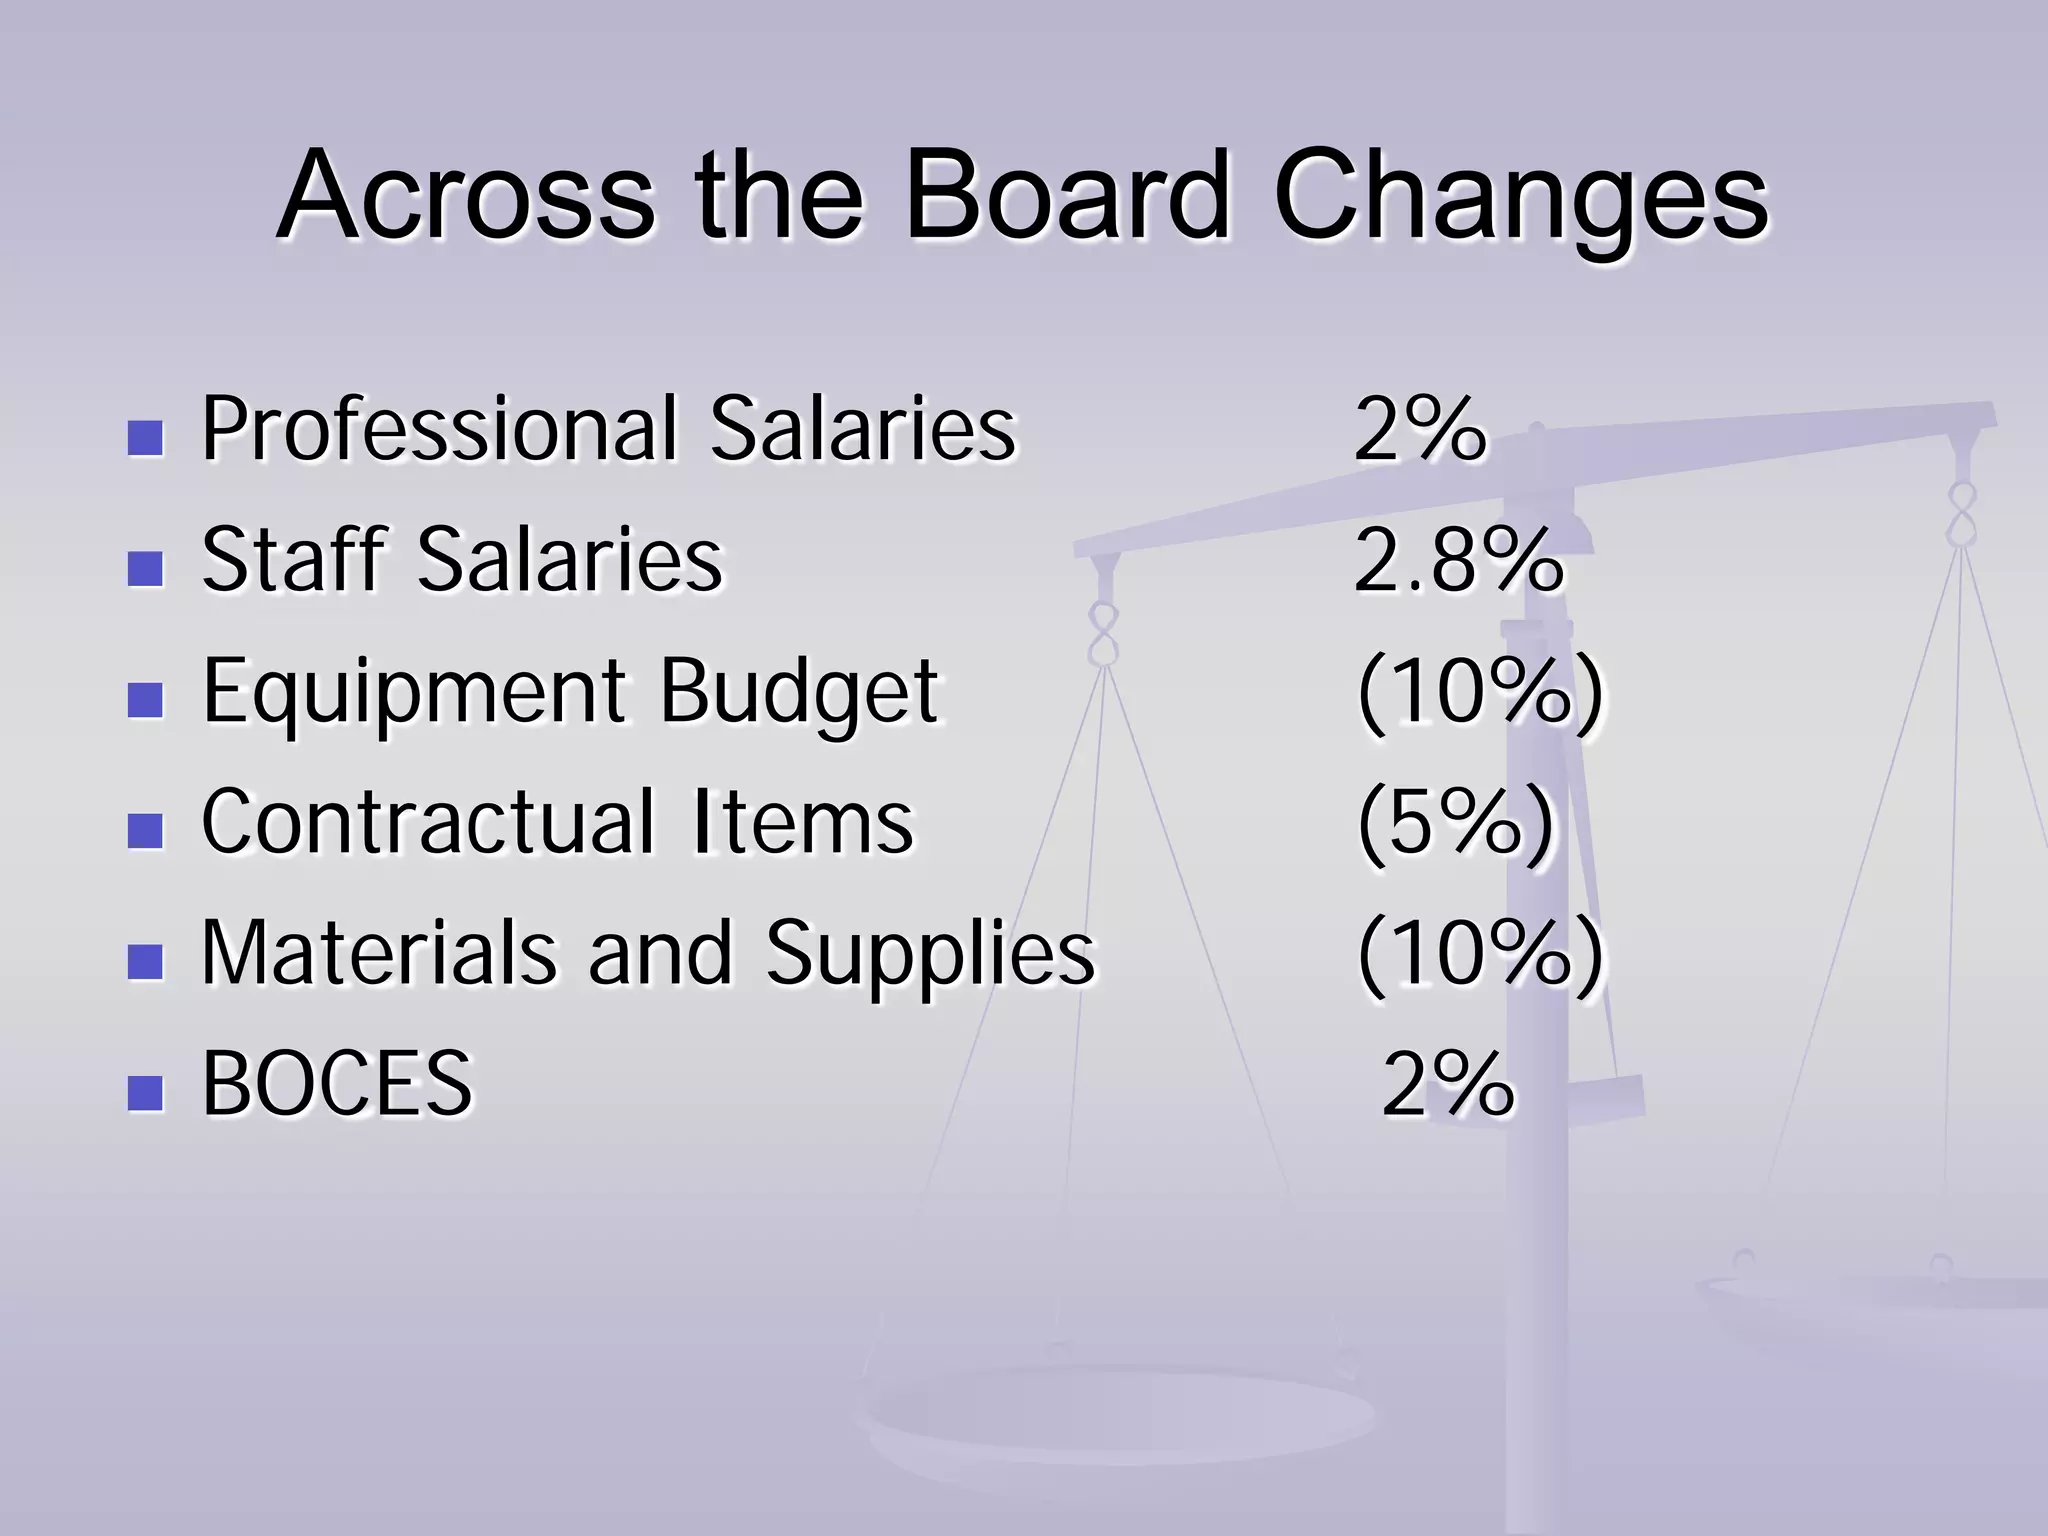
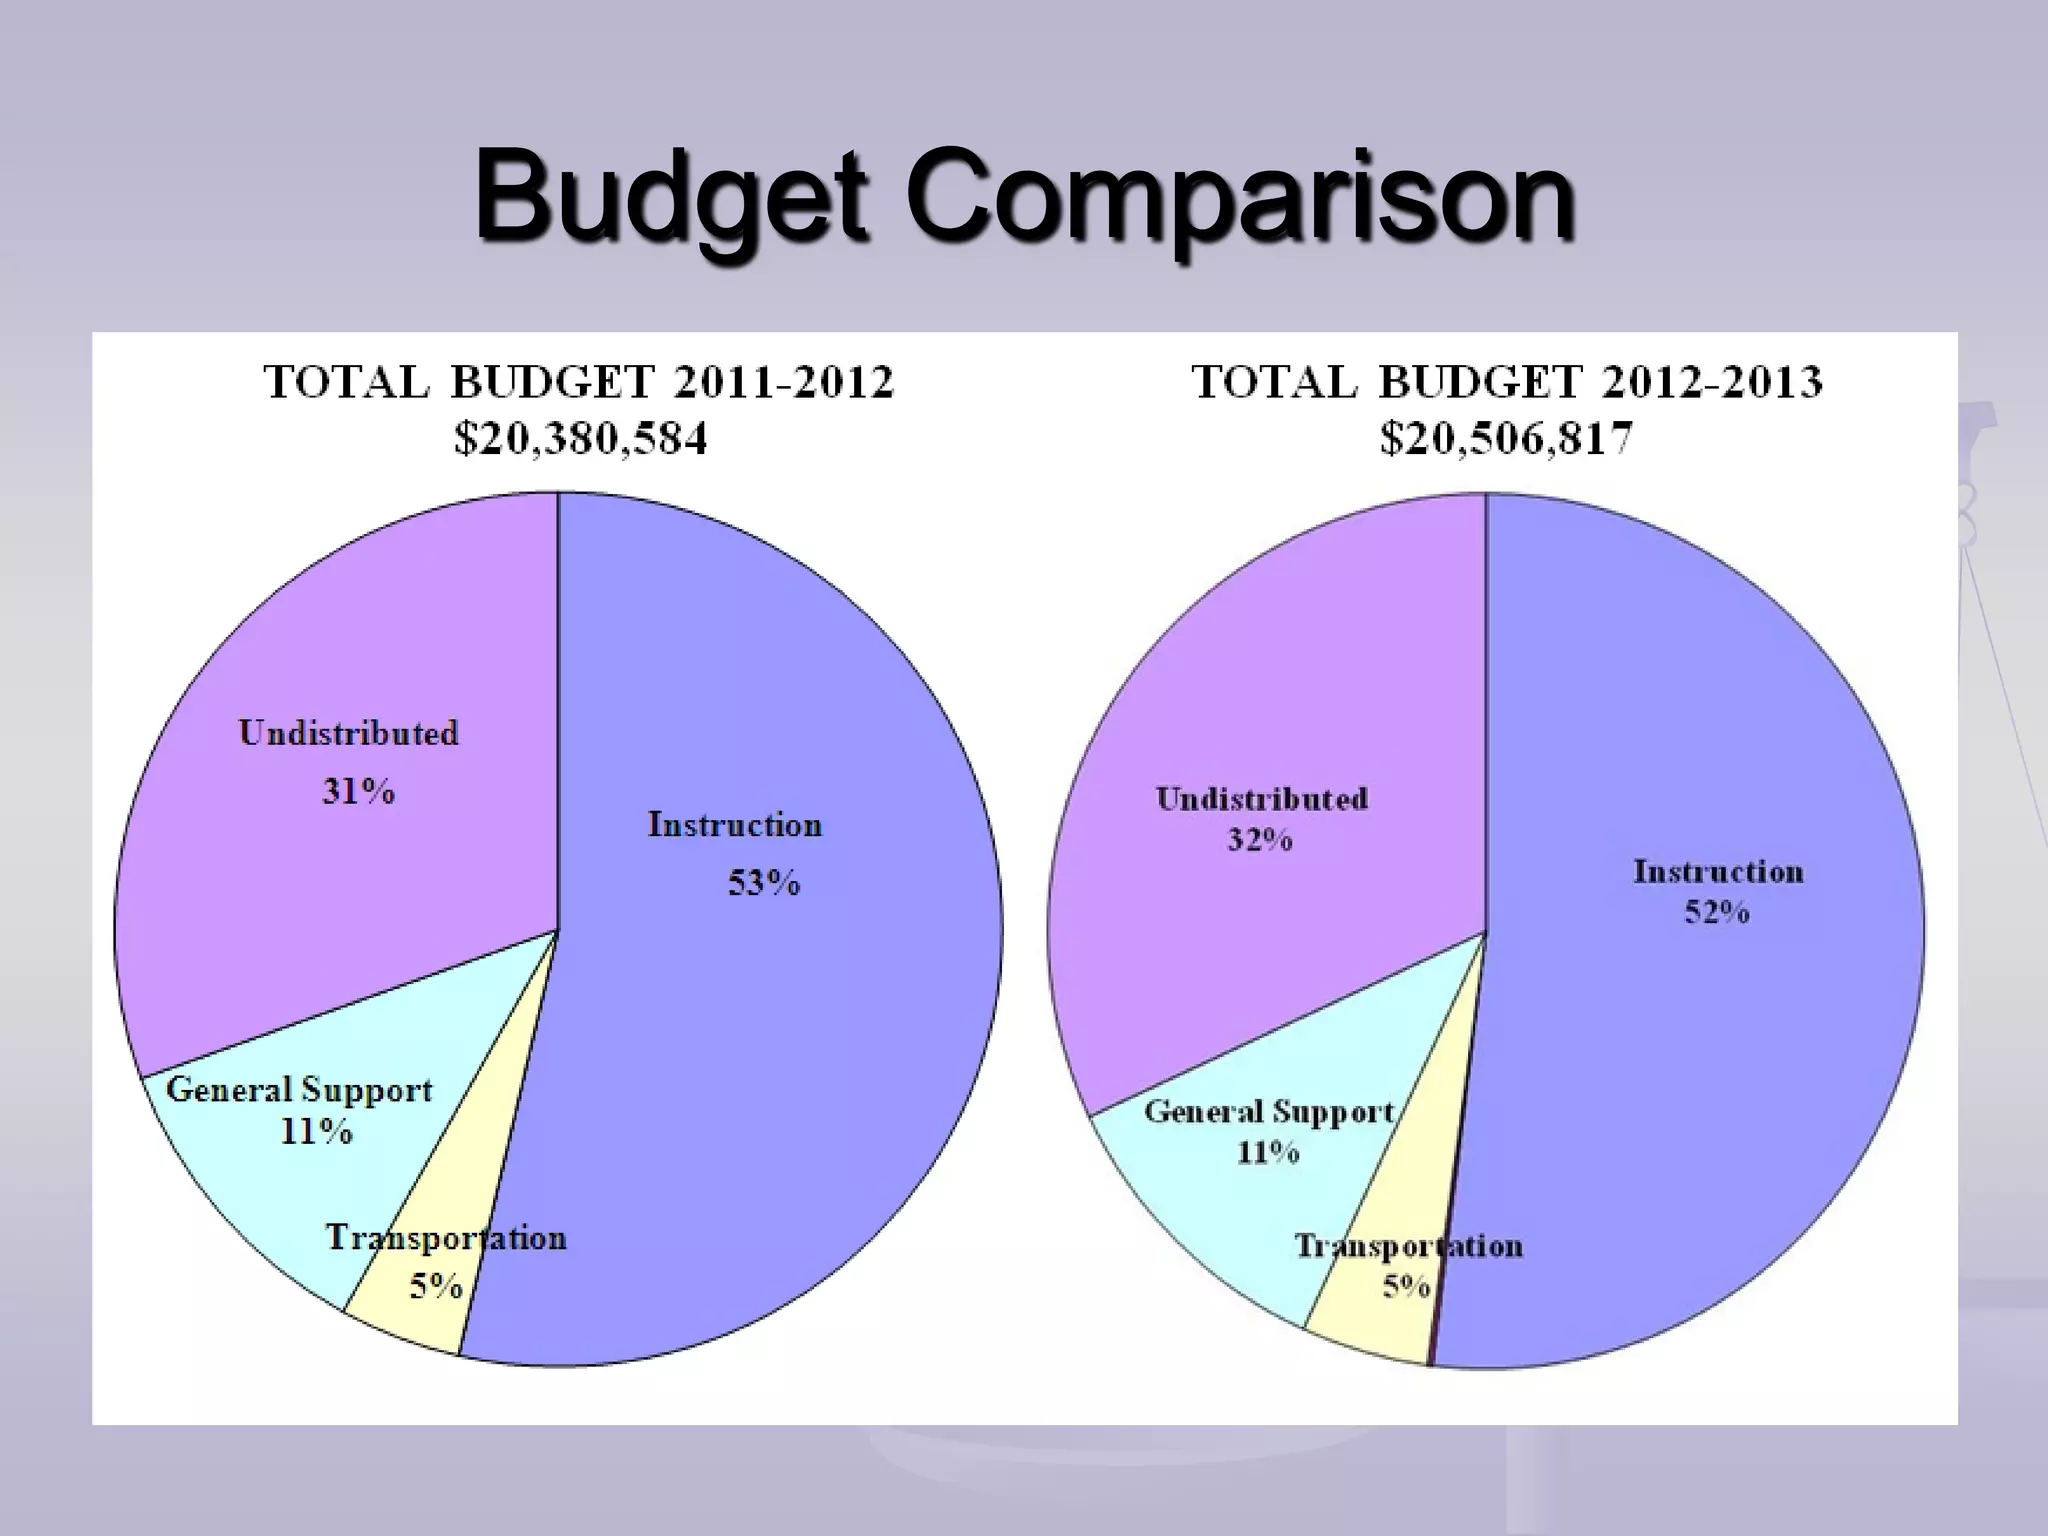
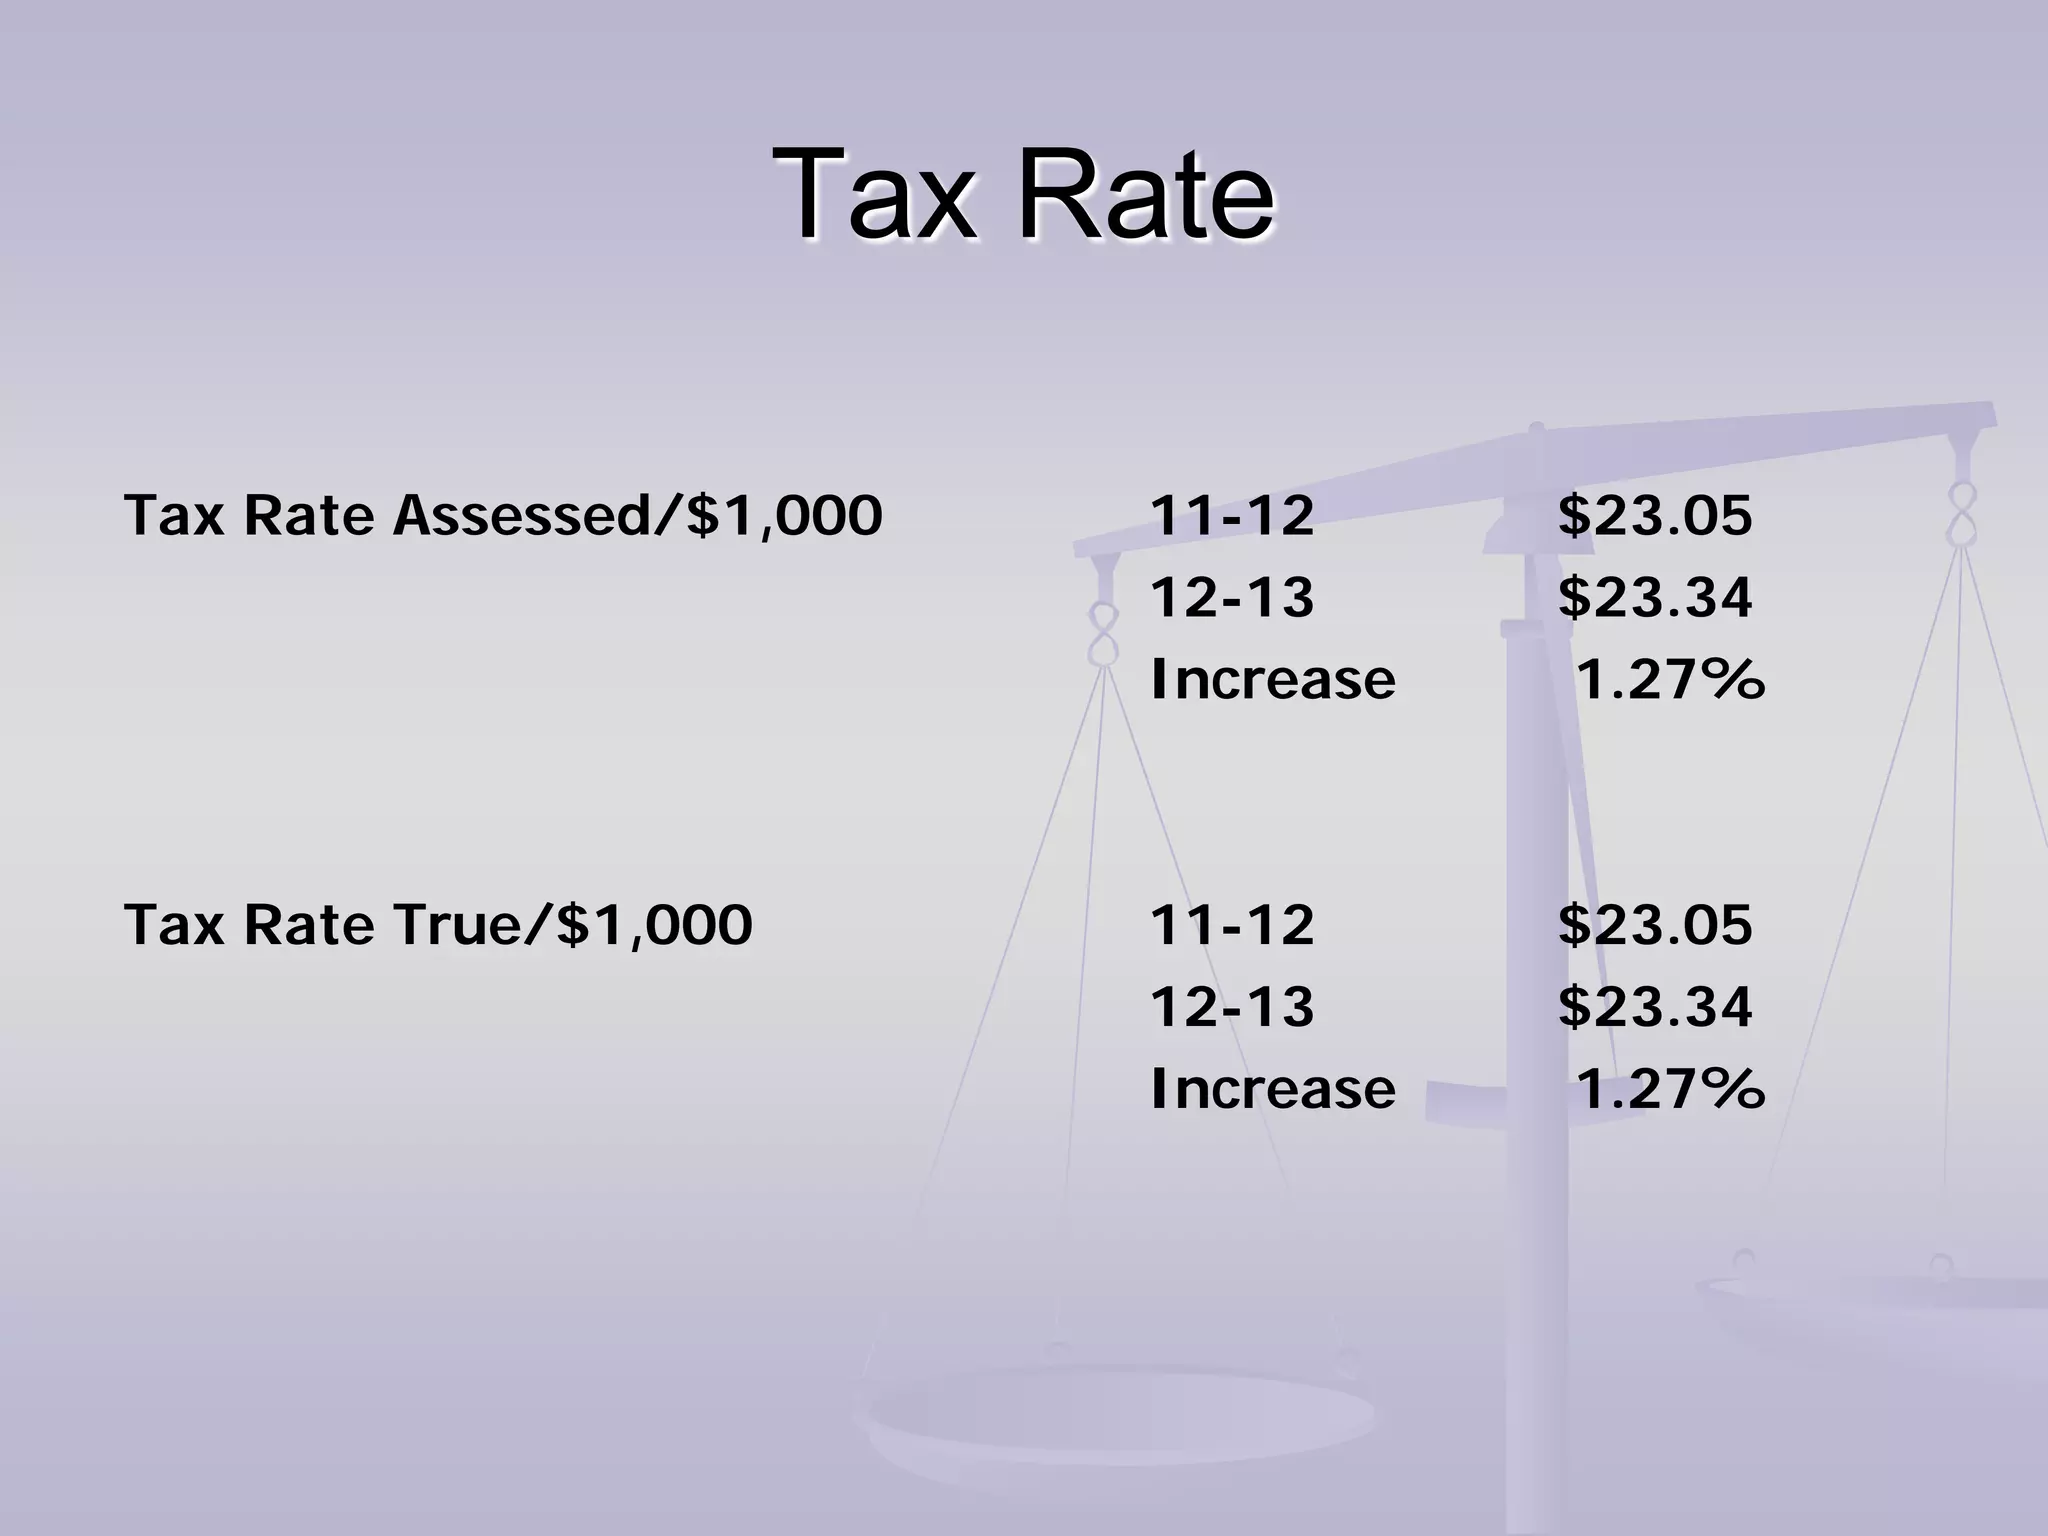
2012-13 BUDGET
Balancing Our Students’ Future with
  the Community’s Ability to Pay
Quotes
   “I think the inequity in education is probably
    the civil rights issue of our time. There are
    two education systems in this state. Not
    public and private. One for the rich and one
    for the poor and they’re both public
    systems.”

   “. . . is committed to redistributing state
    school aid from wealthy, politically powerful
    suburban school districts and sending more
    dollars to high-need rural and urban schools,
    saying that he had a duty to be “the great
    equalizer’.”
Who was the speaker for
        both?
     Andrew Cuomo in 2010
The Concept


                                        Cost to provide
  State Aid                             Fair Education

               State Aid

   Local                    State Aid
  Ability to
    Pay         Local
               Ability to
                 Pay
                             Local
                            Ability
  Higher       Average      Lower
  Wealth       Wealth       Wealth
Loss of Aid
Year             State Aid Loss


2010-2011        1.2 Million


2011-2012        2.0 Million
Our Budget
 Year       Budget       Change

2008-09    $20,691,523

2009-10    $20,617,865   -0.36%

2010-11    $20,678,584   +0.29%

2011-12    $20,380,583   -1.44%

2013-13    $20,506,817   +0.62%
Two years ago
   Two elementary positions
   Half an Administrative position
   One English position (retirement)
   Share Occupational and Physical Therapy services
   ES Home School Counselor
   .4 School Psychologist (voluntary change)
   Two Teaching Assistants
   In-House Support for Assistive Technology (.5
    Speech)
   One ELL (English Language Learners-retirement)
   Physical Education (retirement, .5 replacement)
   Clerk Typist (retirement)
   Network Technician (.4)
Last year
   One Reading Teacher
   One Salaried Bus Driver
   One Social Studies Teacher
   One Special Education Teacher
   One RTI coordinator
   .5 Art Teacher
   .5 Enrichment Teacher
   .5 Math Teacher
   .5 Speech Teacher
   .4 English Teacher
This Year
Overall aid increase of
$358,516

Along with adjustments to expense based aids.

This includes increases of:
 $43,775                      Foundation Aid
$312,137                      Gap Elimination Aid
State Aid Over Time
25,000,000


20,000,000


15,000,000


10,000,000


 5,000,000


          0
                05-06        06-07        07-08        08-09        09-10        10-11        11-12        12-13
 Budget       17,174,303   18,792,757   19,987,180   20,691,523   20,617,865   20,678,584   20,330,584   20,506,817
 State Aid    8,864,024    9,680,856    10,190,000   10,759,000   11,000,000   10,038,237   8,950,541    9,309,057
 Percentage    51.61%       51.51%       50.98%       52.00%       53.35%       48.54%       44.03%       45.39%
Is New York really “38th in results?”


       38th?
NYS Education System is Highly
              Ranked


NYS is ranked 3rd overall at 83.9
Our Graduation Rates

                   Graduation
       Year           Rate
2009             93%


2010             93%


2011             94%
Revenue

                  2011-12       2012-13        Change
State Aid         $8,950,500    $9,309,057     $358,516
Federal Aid        $478,000               $0   ($478,000)

Use of Reserves    $860,000      $820,000       ($40,000)

Sales Tax          $400,000      $400,000               0
Other              $310,100      $383,000        $73,000

Property Taxes    $9,232,000    $9,444,760     $212,761

Fund Balance       $150,000      $150,000               0

Total Revenue     $20,380,600   $20,506,817     $126,217
Revenue Comparison
2012-13 BUDGET
            The Major Cost Drivers
   Health Ins up 18%        = $ 424,000


   Retirements Costs
       ERS up 20%       =   $    66,700
       TRS up 13.25%    =   $   121,800


   Total                    = $ 595,500
Across the Board Changes
   Professional Salaries    2%
   Staff Salaries           2.8%
   Equipment Budget         (10%)
   Contractual Items        (5%)
   Materials and Supplies   (10%)
   BOCES                     2%
Enrollment
                  Enrollment December 2011

120


100


 80


 60


 40


 20


  0
      K   1   2   3    4   5   6    7   8    9   10   11   12
Cuts-Right-sizing

   .6 English
   .8 Science
   .4 Social Studies
   1 Special Education (may not be a job loss
    if students brought back to district)
   .5 Groundskeeper
Cuts to Program


Cut               Covered
.5 Elementary     HS librarian covers MS library
                  ES librarian picks up Enrichment
.5 Math AIS       Support in classroom provided by Teaching
                  Assistants in K-2
.9 Math 7-12      AIS supported by Learning Center (HS), teaching
                  assistants (grade 5,6) and math teachers (grades
                  7,8)
1.0 Reading       High School Reading Teacher moves to ES
                  3-ES, 2-MS, 1-HS remain
Additional Cuts
   Cut all field trips except end of the year
    4th, 8th and 12th grade celebrations.
   Only have one modified team in soccer
    and basketball.
   Implement bus stops on bus run where
    appropriate.
Budget Comparison
2012-13 Budget
    Within the Tax Cap Limit

Estimated Levy increases     2.3%

Estimated Rate increases     1.28%

Tax Rate increase/$1,000      $.29

House assessed at $100,000   $29.00
Tax Rate

Tax Rate Assessed/$1,000    11-12      $23.05
                            12-13      $23.34
                            Increase   1.27%


Tax Rate True/$1,000        11-12      $23.05
                            12-13      $23.34
                            Increase   1.27%
2011-12 School STAR Exemption

  BASIC STAR                         $30,000
BASIC STAR is available to anyone who owns and lives
   in his or her home and earns less than $500,000


  Enhanced STAR                      $62,200
  Enhanced STAR is available to senior homeowners
       whose incomes do not exceed $79,050
Effect of STAR Exemption Amounts
                                                          ENHANCED
                                           BASIC STAR
Example:                                                      STAR

Assessed Value of Property                    $100,000      $100,000

2011-12 Exemption Amount                      ($30,000)    ($62,200)
Taxable Value of Home                          $70,000       $37,800

Est. Tax Rate on Assessed Value *             $0.02334      $0.02334
Est. taxes owed after STAR Exemption * *        $1,634         $882
* Estimated tax rate per $1,000 of
  Taxable Assessed Value without STAR           $23.34        $23.34
* * Effective tax rate per $1,000 of
   Taxable Assessed Value with STAR
   Exemption                                    $16.34         $8.82
Elementary School
Middle School
High School
VOTE
        Tuesday, May 15th
             1-9 PM
Williamson Middle School Cafeteria
Proposition 1: Budget 2012-2013 School Year
Shall the proposed budget for the 2012-2013
  school year, in the amount of $20,506,817 ,
  be approved?

Select one Board Candidate:
Patrick Wright
NELSON MANDELA
Education is the most powerful weapon which you can use
                  to change the world.

                 We believe that this budget has balanced
                 our students’ future with the community’s
                 ability to pay
Questions

May 2, 2012 Budget Hearing

  • 1.
    2012-13 BUDGET Balancing OurStudents’ Future with the Community’s Ability to Pay
  • 2.
    Quotes  “I think the inequity in education is probably the civil rights issue of our time. There are two education systems in this state. Not public and private. One for the rich and one for the poor and they’re both public systems.”  “. . . is committed to redistributing state school aid from wealthy, politically powerful suburban school districts and sending more dollars to high-need rural and urban schools, saying that he had a duty to be “the great equalizer’.”
  • 3.
    Who was thespeaker for both? Andrew Cuomo in 2010
  • 4.
    The Concept Cost to provide State Aid Fair Education State Aid Local State Aid Ability to Pay Local Ability to Pay Local Ability Higher Average Lower Wealth Wealth Wealth
  • 5.
    Loss of Aid Year State Aid Loss 2010-2011 1.2 Million 2011-2012 2.0 Million
  • 6.
    Our Budget Year Budget Change 2008-09 $20,691,523 2009-10 $20,617,865 -0.36% 2010-11 $20,678,584 +0.29% 2011-12 $20,380,583 -1.44% 2013-13 $20,506,817 +0.62%
  • 7.
    Two years ago  Two elementary positions  Half an Administrative position  One English position (retirement)  Share Occupational and Physical Therapy services  ES Home School Counselor  .4 School Psychologist (voluntary change)  Two Teaching Assistants  In-House Support for Assistive Technology (.5 Speech)  One ELL (English Language Learners-retirement)  Physical Education (retirement, .5 replacement)  Clerk Typist (retirement)  Network Technician (.4)
  • 8.
    Last year  One Reading Teacher  One Salaried Bus Driver  One Social Studies Teacher  One Special Education Teacher  One RTI coordinator  .5 Art Teacher  .5 Enrichment Teacher  .5 Math Teacher  .5 Speech Teacher  .4 English Teacher
  • 9.
    This Year Overall aidincrease of $358,516 Along with adjustments to expense based aids. This includes increases of: $43,775 Foundation Aid $312,137 Gap Elimination Aid
  • 10.
    State Aid OverTime 25,000,000 20,000,000 15,000,000 10,000,000 5,000,000 0 05-06 06-07 07-08 08-09 09-10 10-11 11-12 12-13 Budget 17,174,303 18,792,757 19,987,180 20,691,523 20,617,865 20,678,584 20,330,584 20,506,817 State Aid 8,864,024 9,680,856 10,190,000 10,759,000 11,000,000 10,038,237 8,950,541 9,309,057 Percentage 51.61% 51.51% 50.98% 52.00% 53.35% 48.54% 44.03% 45.39%
  • 11.
    Is New Yorkreally “38th in results?” 38th?
  • 12.
    NYS Education Systemis Highly Ranked NYS is ranked 3rd overall at 83.9
  • 13.
    Our Graduation Rates Graduation Year Rate 2009 93% 2010 93% 2011 94%
  • 14.
    Revenue 2011-12 2012-13 Change State Aid $8,950,500 $9,309,057 $358,516 Federal Aid $478,000 $0 ($478,000) Use of Reserves $860,000 $820,000 ($40,000) Sales Tax $400,000 $400,000 0 Other $310,100 $383,000 $73,000 Property Taxes $9,232,000 $9,444,760 $212,761 Fund Balance $150,000 $150,000 0 Total Revenue $20,380,600 $20,506,817 $126,217
  • 15.
  • 16.
    2012-13 BUDGET The Major Cost Drivers  Health Ins up 18% = $ 424,000  Retirements Costs  ERS up 20% = $ 66,700  TRS up 13.25% = $ 121,800  Total = $ 595,500
  • 17.
    Across the BoardChanges  Professional Salaries 2%  Staff Salaries 2.8%  Equipment Budget (10%)  Contractual Items (5%)  Materials and Supplies (10%)  BOCES 2%
  • 18.
    Enrollment Enrollment December 2011 120 100 80 60 40 20 0 K 1 2 3 4 5 6 7 8 9 10 11 12
  • 19.
    Cuts-Right-sizing  .6 English  .8 Science  .4 Social Studies  1 Special Education (may not be a job loss if students brought back to district)  .5 Groundskeeper
  • 20.
    Cuts to Program Cut Covered .5 Elementary HS librarian covers MS library ES librarian picks up Enrichment .5 Math AIS Support in classroom provided by Teaching Assistants in K-2 .9 Math 7-12 AIS supported by Learning Center (HS), teaching assistants (grade 5,6) and math teachers (grades 7,8) 1.0 Reading High School Reading Teacher moves to ES 3-ES, 2-MS, 1-HS remain
  • 21.
    Additional Cuts  Cut all field trips except end of the year 4th, 8th and 12th grade celebrations.  Only have one modified team in soccer and basketball.  Implement bus stops on bus run where appropriate.
  • 22.
  • 23.
    2012-13 Budget Within the Tax Cap Limit Estimated Levy increases 2.3% Estimated Rate increases 1.28% Tax Rate increase/$1,000 $.29 House assessed at $100,000 $29.00
  • 24.
    Tax Rate Tax RateAssessed/$1,000 11-12 $23.05 12-13 $23.34 Increase 1.27% Tax Rate True/$1,000 11-12 $23.05 12-13 $23.34 Increase 1.27%
  • 25.
    2011-12 School STARExemption BASIC STAR $30,000 BASIC STAR is available to anyone who owns and lives in his or her home and earns less than $500,000 Enhanced STAR $62,200 Enhanced STAR is available to senior homeowners whose incomes do not exceed $79,050
  • 26.
    Effect of STARExemption Amounts ENHANCED BASIC STAR Example: STAR Assessed Value of Property $100,000 $100,000 2011-12 Exemption Amount ($30,000) ($62,200) Taxable Value of Home $70,000 $37,800 Est. Tax Rate on Assessed Value * $0.02334 $0.02334 Est. taxes owed after STAR Exemption * * $1,634 $882 * Estimated tax rate per $1,000 of Taxable Assessed Value without STAR $23.34 $23.34 * * Effective tax rate per $1,000 of Taxable Assessed Value with STAR Exemption $16.34 $8.82
  • 27.
  • 28.
  • 29.
  • 30.
    VOTE Tuesday, May 15th 1-9 PM Williamson Middle School Cafeteria
  • 31.
    Proposition 1: Budget2012-2013 School Year Shall the proposed budget for the 2012-2013 school year, in the amount of $20,506,817 , be approved? Select one Board Candidate: Patrick Wright
  • 32.
    NELSON MANDELA Education isthe most powerful weapon which you can use to change the world. We believe that this budget has balanced our students’ future with the community’s ability to pay
  • 33.