Downloaded 90 times
![4
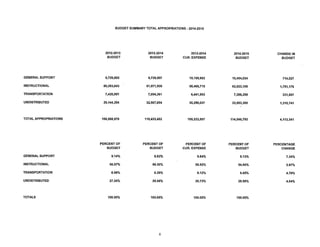
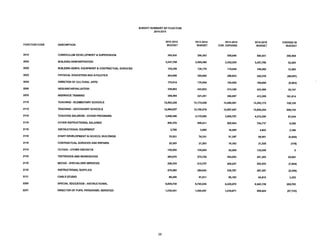
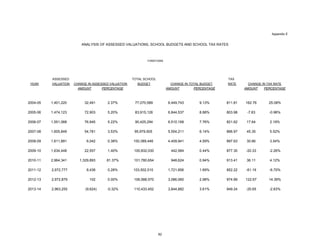
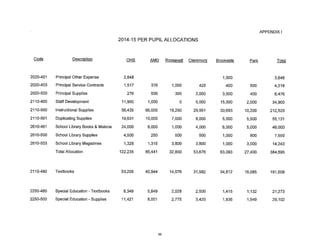
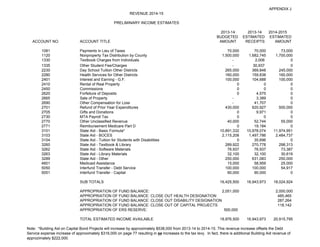
REVENUES
The final New York State legislative budget provides for an additional $1,456,508 in school aid
for Ossining School District.
Other Revenue Sources
There are other limited revenue sources that comprise the total revenue to support the budget.
The two major areas are composed of state aid and property taxes. At this time, the District
anticipates that it will realize approximately $18,024,924 in revenues other than property taxes
and appropriation of Fund Balance for the 2014-2015 school year. This compares with
$16,425,500 which the District had anticipated last year at this time for the current 2013-2014
school year. We will continue to monitor revenue projections and will adjust accordingly, prior
to setting the tax warrant.
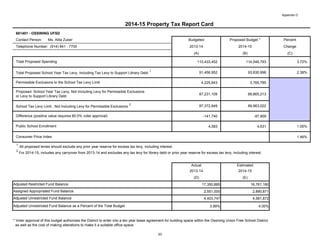
Proposed Budget and Tax Levy
Our 2014-2015 proposed budget is below the District Tax Levy Limit or Cap. The proposed
budget reflects a budget-to-budget increase of3.72% or a dollar value of $4,113,341. Given the
anticipated revenues as referenced above of $18,024,924and an appropriation of Fund Balance in
the amount of $2,890,871, the District projects an estimated tax levy of $ 93,630,998which
represents a tax levy increase of $2,174,046 or 2.38%, which is below the District Tax Levy
Limit or Cap calculated to be 248% for the 2014-2015 school year.
Fund Balance
Through extremely careful planning during the 2013-2014 school year, strategic exercising of
cost saving efficiencies, and deferring various projects, it is anticipated that the District will be
able to realize an authorized Fund Balance of four percent (4%). This Fund Balance is
advantageous within the context of a conservative budget. Given the potential for emergencies
and unexpected situations, maintaining a Fund Balance is quite important.
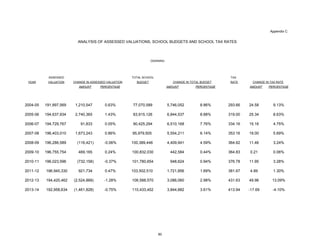
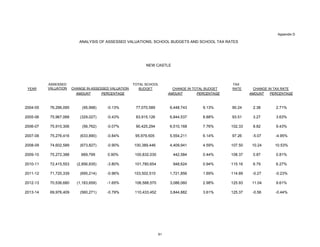
Tax Rates
It should be noted that the tax rates are determined by three independent factors: assessed
valuation as determined by the assessor’s office, equalization rates as determined by the New
York State Office or Real Property Services, and the tax levy as set by the school district.
It is important to note that there are still outstanding tax certiorari claims that have not been
settled. Tax certiorari claims may enable taxpayers to reduce the assessments on their properties.
Until such time as the tax rolls are set in August, the impact upon the final tax rate can not be
determined.
The potential assessment value decreases will have an impact on the tax rate within the three
towns of the Ossining School District. Equalization rate changes, determined by the New York
State Office of Real Property Services [ORPS], also will affect apportionment of the school tax
levy causing a potential shift in each share of the levy. We provide this information in order to
promote greater understanding of the tax rate issues that are well beyond the control of the
District.
1
1](https://image.slidesharecdn.com/1finalproposed2014-15schoolbudget4-21-14-140423113535-phpapp02/85/Final-Proposed-School-Budget-2014-15-6-320.jpg)

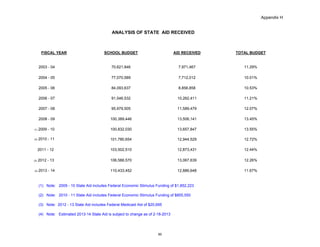
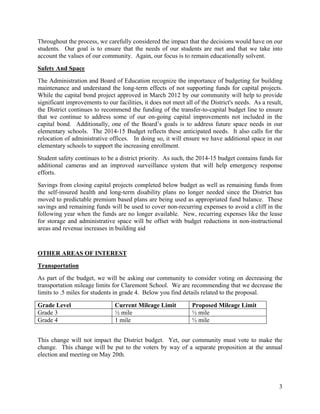
![4/30/2014 2013 | OSSINING UFSD - Report Card | New YorkState Education Department Data Site
http://data.nysed.gov/reportcard.php?instid=800000035059&year=2013&createreport=1&enrollment=1&avgclasssize=1&freelunch=1&attendance=1&teacherqu… 1/52
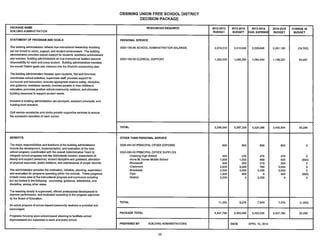
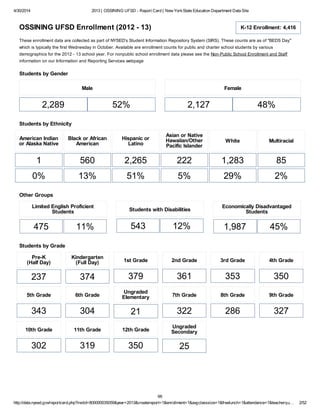
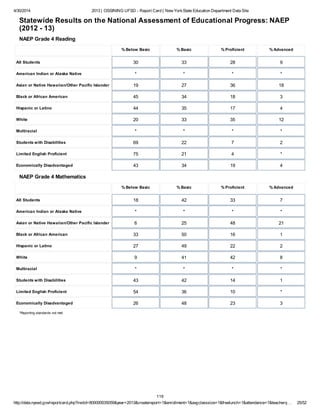
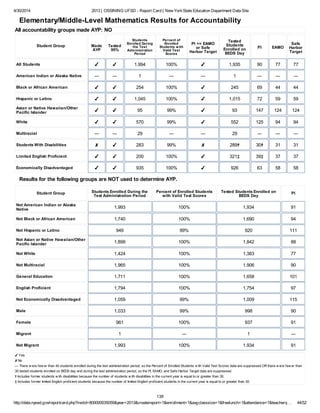
The New York State School Report Card [2012 - 13]
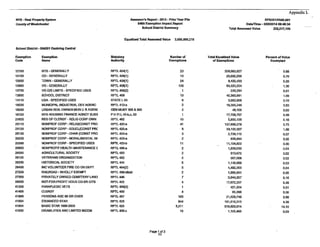
NAME: OSSINING UFSD
BEDS Code: 661401030000
SUPERINTENDENT : Raymond Sanchez
ADDRESS: 190 CROTON AVE, OSSINING, NY 10562
PHONE: (914) 941-7700
The New York State Report Card is an important part of the Board of Regents' effort to raise
learning standards for all students. It provides information to the public on school/district
enrollment and staff, student performance, and other measures of school and district
performance. Knowledge gained from the report card on a school's or district's strengths and
weaknesses can be used to improve instruction and services to students.
95](https://image.slidesharecdn.com/1finalproposed2014-15schoolbudget4-21-14-140423113535-phpapp02/85/Final-Proposed-School-Budget-2014-15-102-320.jpg)

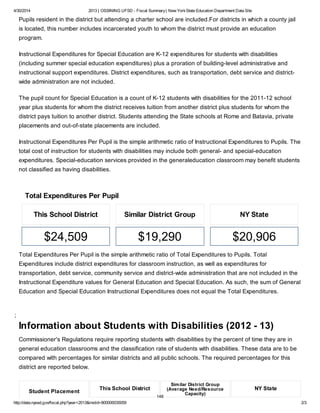

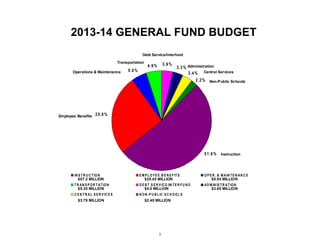
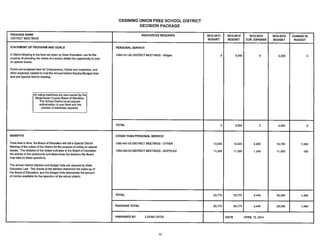
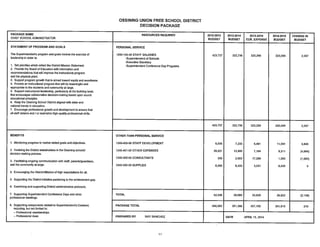
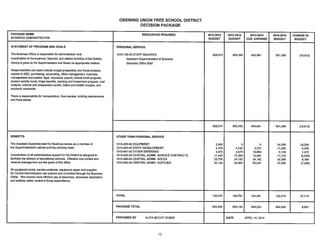
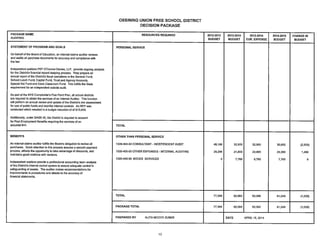
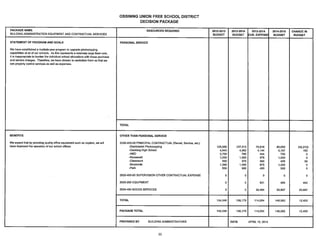
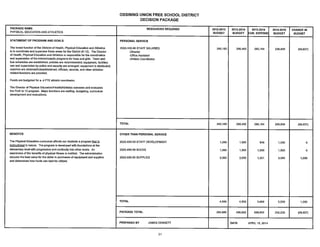
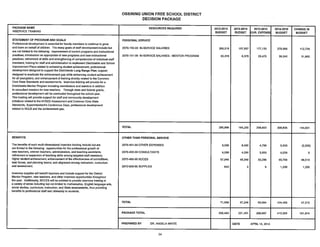
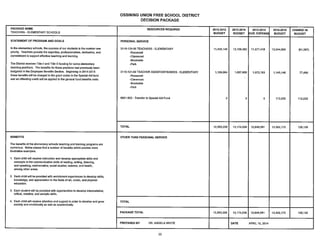
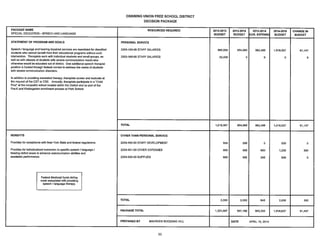
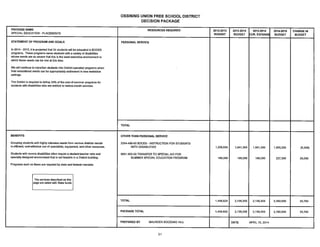
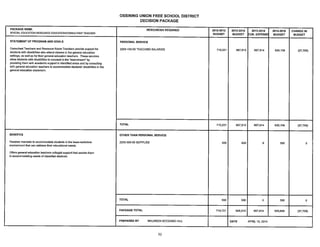
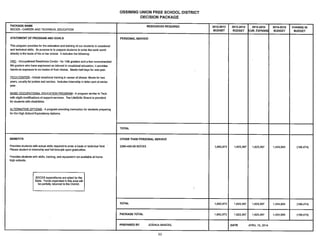
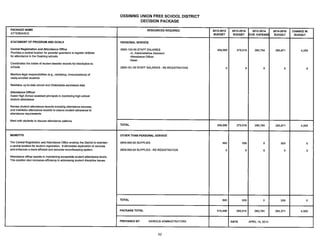
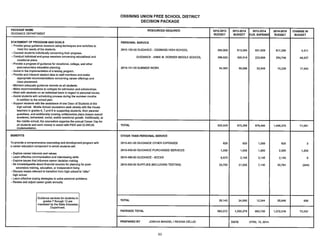
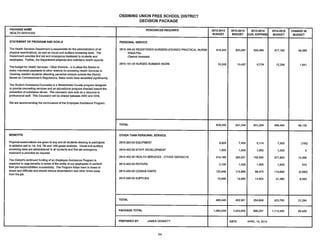
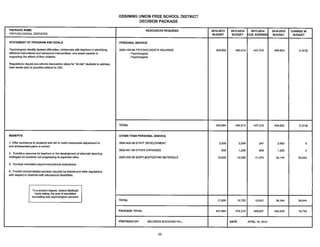
The proposed 2014-2015 Ossining School District budget focuses on educational solvency, safety, and space needs. The $97.5 million budget is a 3.72% increase over last year and remains below the tax levy cap. It aims to maintain current academic, arts, and athletics programs while addressing increasing enrollment through additional staffing. Funds are also allocated for security upgrades and capital projects. The budget process included community input to create a financially responsible spending plan that supports students.