Download as PDF, PPTX


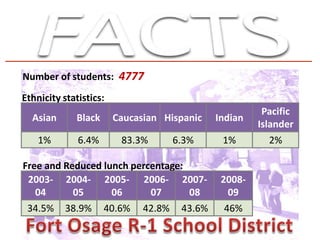
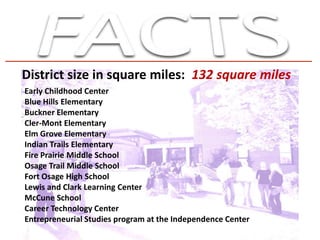

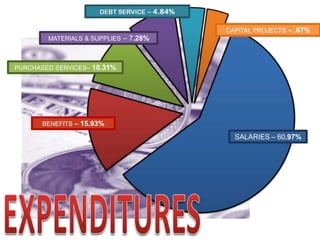
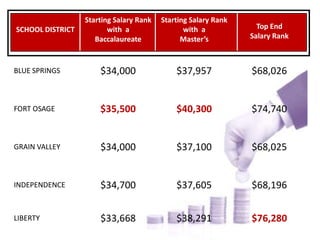
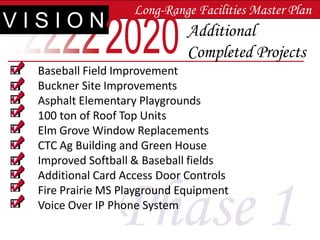
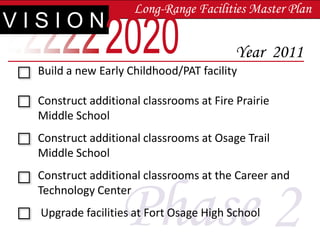
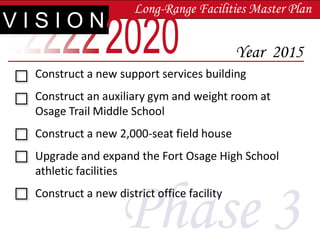

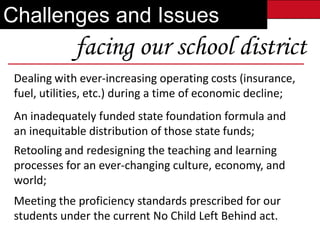


The document provides statistics about a school district including the number of students, ethnicity breakdown, free/reduced lunch percentages, district size, school buildings, salary and expenditure information, long range facility plans, new programs, challenges, and revenue sources. It shows that the district has over 4,700 students, is 132 square miles, and has 13 school buildings. 83.3% of students are Caucasian and over 40% qualify for free/reduced lunch. Over 60% of the budget goes to salaries.


