![5 | P a g e
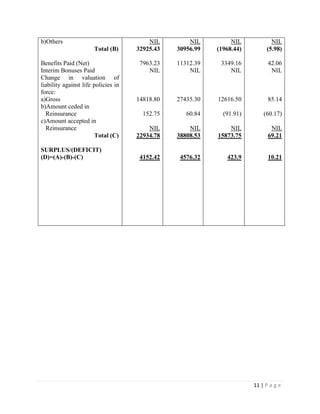
HISTORY:
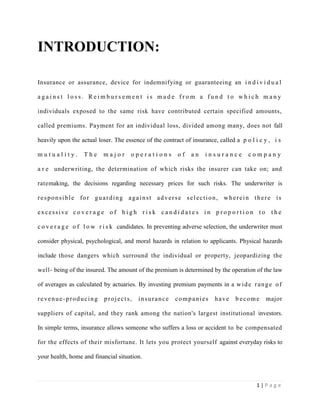
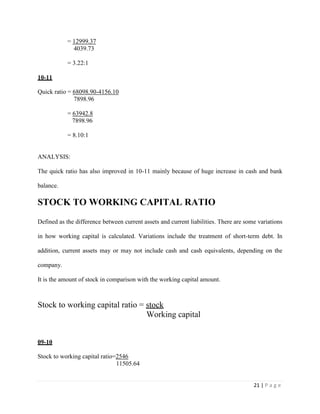
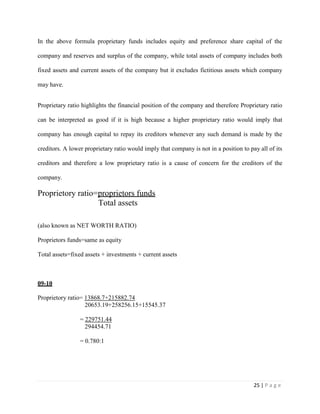
The company was founded in 1845 as the Nautilus (Capt. Nemo) Insurance Company in New
York City, with assets of just $17,000. It was renamed the New York Life Insurance Company in
1849. Its first headquarters were at 112-114 Broadway; the first president was James De Peyster
Ogden. The current New York Life headquarters was designed by noted architect Cass Gilbert
and completed in 1928. The New York Life building, at 51 Madison Avenue, was constructed
during the presidency of Darwin P. Kingsley. He expanded the company’s operations and
developed new types of insurance. As with other early insurance companies in the U.S., in its
early years the company insured the lives of slaves for their owners. In response to bills passed in
California in 2001 and in Illinois in 2003, the company reported that Nautilus sold 485
slaveholder life insurance policies during a two-year period in the 1840s; they added that their
trustees voted to end the sale of such policies 15 years before the Emancipation Proclamation.[5]
The company became known for innovative business practices. In 1860, well before state laws
required it, New York Life developed the non-forfeiture option, the predecessor to the
guaranteed cash values of modern policies, under which a policy remains in force even if a
premium payment is missed. It was also the first American life insurance company to pay a cash
dividend to policyholders, and the first U.S. company to issue policies to women at the same
rates as men. Susan B. Anthony was one of their first female policy holders, and her father
worked for NYLIC. In 1896, New York Life became the first company to insure people with
disabilities and the first to issue a policy with a disability benefit that presumes total disability to
be permanent after a predetermined period.](https://image.slidesharecdn.com/maxlifeinsurance-130514041404-phpapp02/85/Max-life-insurance-5-320.jpg)
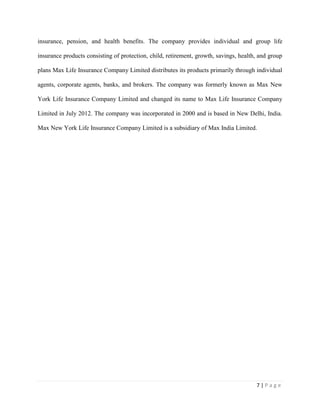
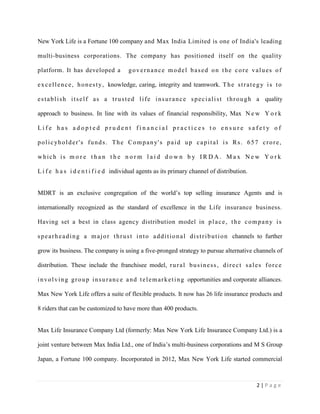
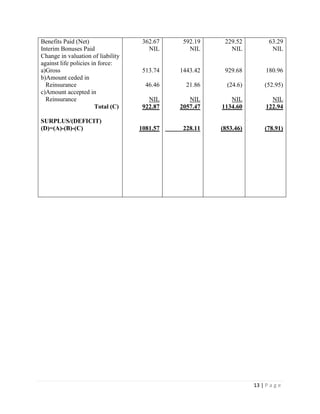
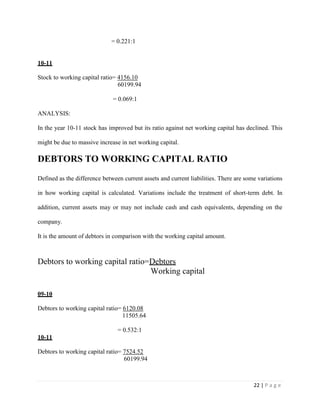
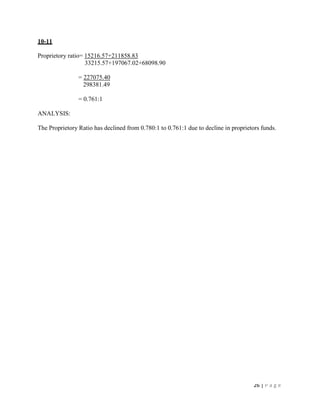
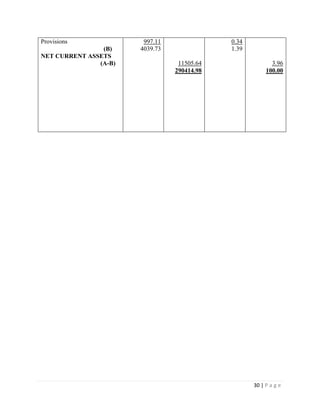
![10 | P a g e
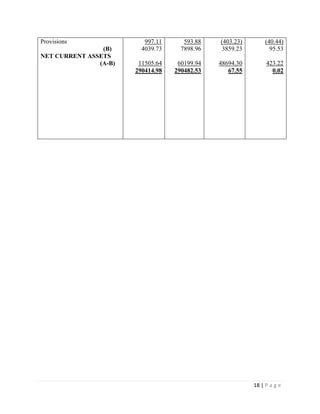
COMPARATIVE ANALYSIS
Comparative analysis of Revenue A/C
[with respect to Participating Policies (Non-Linked)]
Particulars 09-10
(Rs in lacs)
10-11
(Rs in lacs)
Absolute
Increase/
(Decrease)
(In Rs)
Percentage
Increase/
(Decrease)
(In %)
Premiums earned-(Net)
Premiums
Less: Reinsurance Ceded
Add: Reinsurance Accepted
Income from Investments
a)Interest, Dividends & Rent-
Gross
b)Profit on sale/ redemption of
investments
c)(Loss) on sale/ redemption
of investments
d)Transfer/ Gain on
revaluation/change in fair
value
e)Amortization of discount/
(premium)
f)Appropriation/Expropriation
Adjustment account
Other Income
Contribution from the
Shareholders account
Miscellaneous income
Total (A)
Commission
Operating Expenses related to
Insurance business
Provision for doubtful debts
Bad debts written off
Provision for Tax
Provision (other than taxation)
a)For diminution in the value
of investments (Net)
53649.64
219.08
NIL
53430.56
6465.18
124.86
NIL
NIL
(34.97)
NIL
NIL
27.00
60012.63
9971.02
22919.92
34.48
1
NIL
NIL
64754.61
363.73
NIL
64390.88
9155.60
492.36
(1.76)
NIL
116.76
NIL
NIL
188.00
74341.84
8911.90
21989.05
56.04
NIL
NIL
NIL
11104.97
144.65
NIL
10960.32
2690.42
367.5
(1.76)
NIL
151.73
NIL
NIL
161.00
14329.21
(1059.12)
(930.87)
21.56
(1)
NIL
NIL
20.70
66.03
NIL
20.51
41.61
294.33
NIL
NIL
433.89
NIL
NIL
596.30
23.88
(10.62)
(4.06)
62.53
(100)
NIL
NIL](https://image.slidesharecdn.com/maxlifeinsurance-130514041404-phpapp02/85/Max-life-insurance-10-320.jpg)
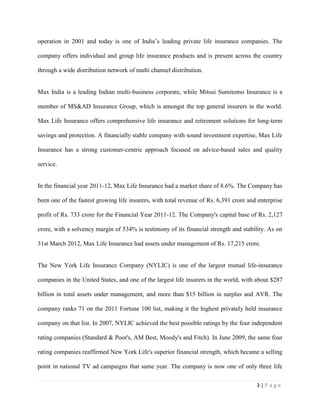
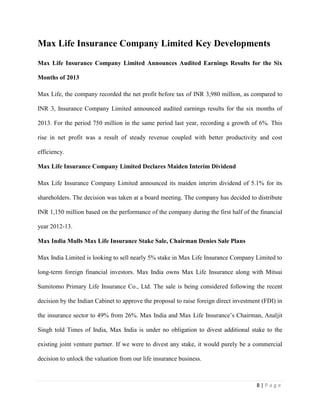
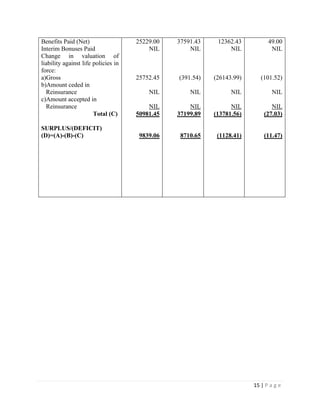
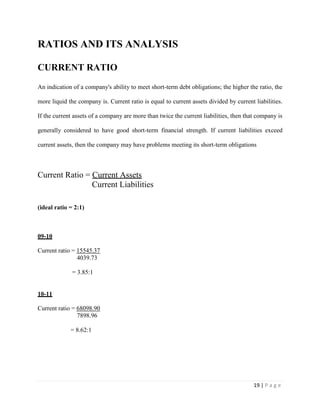
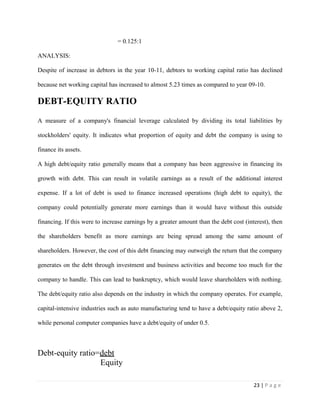
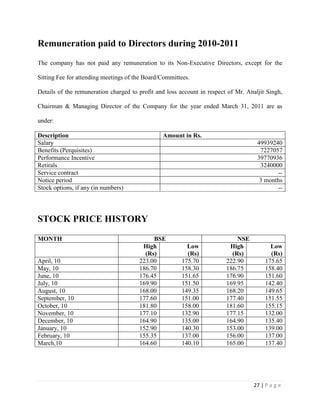
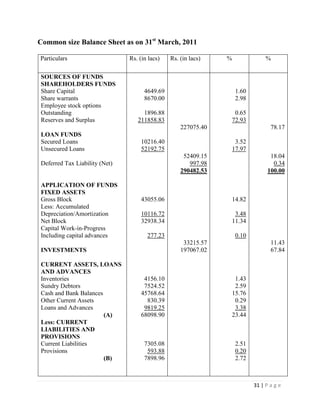
![12 | P a g e
Comparative analysis of Revenue A/C
[with respect to Non-Participating Policies (Non-Linked)]
Particulars 09-10
(Rs in lacs)
10-11
(Rs in lacs)
Absolute
Increase/
(Decrease)
(In Rs)
Percentage
Increase/
(Decrease)
(In %)
Premiums earned-(Net)
Premiums
Less: Reinsurance Ceded
Add: Reinsurance Accepted
Income from Investments
a)Interest, Dividends & Rent-
Gross
b)Profit on sale/ redemption of
investments
c)(Loss) on sale/ redemption
of investments
d)Transfer/ Gain on
revaluation/change in fair
value
e)Amortization of discount/
(premium)
f)Appropriation/Expropriation
Adjustment account
Other Income
Contribution from the
Shareholders account
Miscellaneous income
Total (A)
Commission
Operating Expenses related to
Insurance business
Provision for doubtful debts
Bad debts written off
Provision for Tax
Provision (other than taxation)
a)For diminution in the value
of investments (Net)
b)Others
Total (B)
2154.47
150.22
NIL
2004.25
406.23
16.00
NIL
NIL
(3.12)
NIL
NIL
0.02
2407.54
199.13
203.79
0.18
NIL
NIL
NIL
NIL
403.10
4020.14
126.55
NIL
3893.59
548.80
NIL
NIL
NIL
(2.08)
NIL
NIL
2.03
4442.34
630.05
1523.15
3.56
NIL
NIL
NIL
NIL
2156.76
1865.67
(23.67)
NIL
1889.34
142.57
(16)
NIL
NIL
1.04
NIL
NIL
2.01
2034.80
430.92
1319.36
3.38
NIL
NIL
NIL
NIL
1753.66
86.60
(15.76)
NIL
94.27
35.10
(100)
NIL
NIL
33.33
NIL
NIL
10050
84.52
216.40
647.41
1877.78
NIL
NIL
NIL
NIL
435.04](https://image.slidesharecdn.com/maxlifeinsurance-130514041404-phpapp02/85/Max-life-insurance-12-320.jpg)
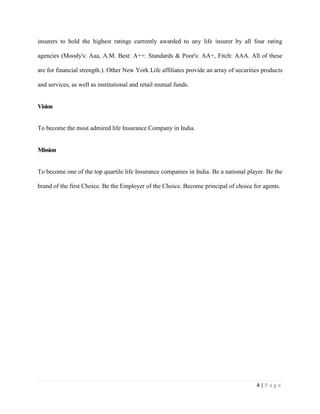
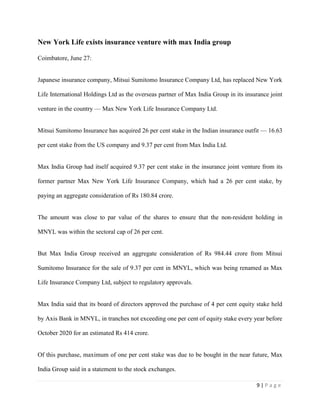
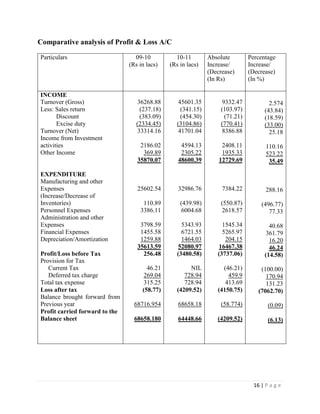
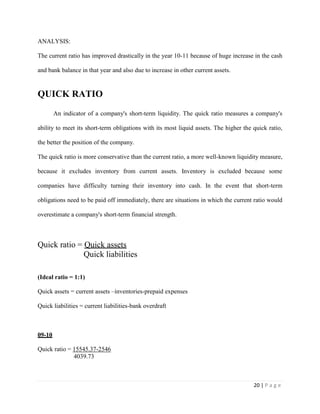
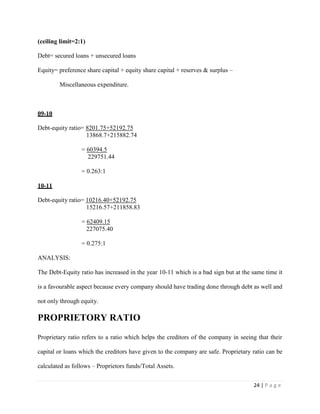
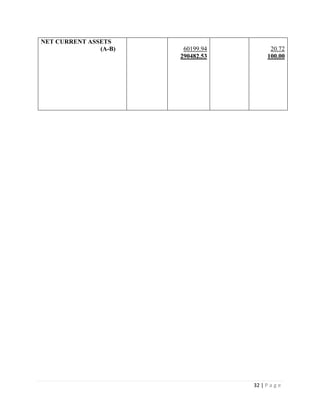
![14 | P a g e
Comparative analysis of Revenue A/C
[with respect to Linked Policies]
Particulars 09-10
(Rs in lacs)
10-11
(Rs in lacs)
Absolute
Increase/
(Decrease)
(In Rs)
Percentage
Increase/
(Decrease)
(In %)
Premiums earned-(Net)
Premiums
Less: Reinsurance Ceded
Add: Reinsurance Accepted
Income from Investments
a)Interest, Dividends & Rent-
Gross
b)Profit on sale/ redemption of
investments
c)(Loss) on sale/ redemption
of investments
d)Transfer/ Gain on
revaluation/change in fair
value
e)Amortization of discount/
(premium)
f)Appropriation/Expropriation
Adjustment account
Other Income
Contribution from the
Shareholders account
Miscellaneous income
Total (A)
Commission
Operating Expenses related to
Insurance business
Provision for doubtful debts
Bad debts written off
Provision for Tax
Provision (other than taxation)
a)For diminution in the value
of investments (Net)
b)Others
Total (B)
69030.31
548.50
NIL
68481.81
7046.46
16907.20
(2704.80)
(20417.05)
(2.93)
57.12
NIL
NIL
69367.81
2001.94
6535.95
9.41
NIL
NIL
NIL
NIL
8547.30
54693.99
390.56
NIL
54303.43
9443.52
16681.54
(19940.94)
(8901.05)
18.09
NIL
NIL
15.21
51619.80
1321.37
4342.94
44.95
NIL
NIL
NIL
NIL
5709.26
(14336.32)
(157.94)
NIL
(14178.38)
2397.06
(225.66)
(17236.14)
11516.00
21.02
(57.12)
NIL
15.21
(17748.01)
(680.57)
(2193.01)
35.54
NIL
NIL
NIL
NIL
(2838.04)
(20.77)
(28.79)
NIL
(20.70)
34.02
(1.33)
(637.24)
56.40
717.41
(100.00)
NIL
NIL
(25.59)
(34.00)
(33.56)
377.68
NIL
NIL
NIL
NIL
(33.20)](https://image.slidesharecdn.com/maxlifeinsurance-130514041404-phpapp02/85/Max-life-insurance-14-320.jpg)
![33 | P a g e
CASH FLOW STATEMENT
Cash flow statement for the year ended 31st
March, 2010 & 2011
Particulars 10-11
Rs. (in lacs)
09-10
Rs. (in lacs)
A] CASH FLOW FROM OPERATING ACTIVITIES:
NET PROFIT/(LOSS) BEFORE TAXATION
Adjustments for:
Depreciation/Amortization
Employee Stock Option Expense
Wealth Tax
Net Loss on sale of fixed assets
Net Profit on sale of Investments
Fixed assets and Spares written off
Provision for Doubtful debts and advances
Diminution in value of Investments and doubtful advances
to subsidiary
Interest expense
Interest income
Dividend Income from current non trade investments
Liability/Provision no longer requited written back
Unrealized Foreign Exchange (Gain)/ Loss
OPERATING PROFIT BEFORE WORKING
CAPITAL CHANGES
MOVEMENT IN WORKING CAPITAL:
Decrease/ (Increase) in sundry debtors
Decrease/ (Increase) in inventories
Decrease/ (Increase) in loans and advances
Decrease/ (Increase) in trade payables
Decrease/ (Increase) in provisions
Cash generated from Operations
Income Tax Refunded/(Paid)
CASH GENERATED FROM/(USED IN) OPERATING
ACTIVITIES (A)
B] CASH FLOW FROM INVESTING ACTIVITIES
Purchase of investments in subsidiaries
Purchase of investments in mutual funds
Proceeds from sale of investments in mutual funds
Deposits with initial maturity of more than three months
Purchase of fixed assets
Proceeds from sale of fixed assets
Interest Received
Dividend income from current non trade investments
(3480.58)
1464.03
1531.28
1.94
17.44
(1969.43)
NIL
5.94
34.41
6579.99
(1878.61)
NIL
(14.68)
18.74
2310.47
(1404.44)
(1610.10)
(3814.51)
2698.12
(152.68)
(1973.14)
(687.93)
(2661.07)
(14811.17)
(176358.23)
254327.97
(36000.00)
(12504.90)
9.43
874.36
NIL
256.48
1259.88
557.63
1.70
24.14
(1760.85)
0.89
0.42
8.53
1357.13
(251.14)
(47.76)
(174.44)
(75.94)
1156.67
(830.34)
258.31
330.01
(113.25)
160.29
961.69
(18.47)
943.22
(25082.48)
(606304.44)
544722.08
NIL
(2080.61)
15.05
267.95
47.76](https://image.slidesharecdn.com/maxlifeinsurance-130514041404-phpapp02/85/Max-life-insurance-33-320.jpg)
![34 | P a g e
CASH GENERATED FROM/(USED IN) INVESTING
ACTIVITIES (B)
C] CASH FLOW FROM FINANCING ACTIVITIES
Proceeds from preferential issue of shares
Proceeds from issue of warrants
Shares issue expenses
Proceeds from exercise of employee stock options
Interest paid
Proceeds from issue of Compulsorily Convertible
Debentures
Proceeds from Long term Borrowing
Repayment of Long Term Loans
Proceeds/(Repayment) of Short Term Borrowings
CASH GENERATED FROM/(USED IN) FINANCING
ACTIVITIES (C)
NET INCREASE/(DECREASE) IN CASH AND CASH
EQUIVALENTS (A+B+C)
CASH AND CASH EQUIVALENTS AT THE
BEGINNING OF THE YEAR
CASH AND CASH EQUIVALENTS AT THE END OF
THE YEAR
15537.46
NIL
NIL
NIL
2.20
(6568.10)
NIL
10155.02
(5237.62)
(2902.75)
(4551.25)
8325.14
1443.50
9768.64
(88414.69)
15000.00
8670.00
(593.13)
0.36
(1048.60)
52192.75
53.85
(2066.03)
72.57
72281.77
(15189.70)
16633.20
1443.50](https://image.slidesharecdn.com/maxlifeinsurance-130514041404-phpapp02/85/Max-life-insurance-34-320.jpg)


The document provides an overview of insurance and the operations of insurance companies. It discusses how insurance works by pooling together funds from many individuals to pay for losses, thereby spreading out costs. It describes the key roles of underwriters in assessing risks and ratemakers in setting premium prices. It also discusses how insurance companies invest premium payments to generate revenue and have become major capital suppliers. In summary, the document outlines the basic concepts of insurance, the roles of insurance companies, and how they operate financially.


