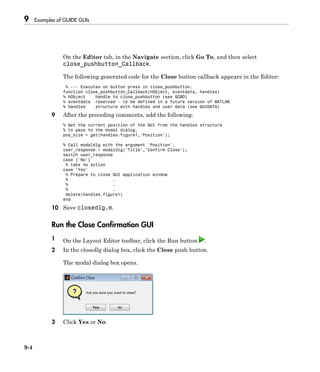
Downloaded 306 times


![Create a Simple GUIDE GUI
2-17
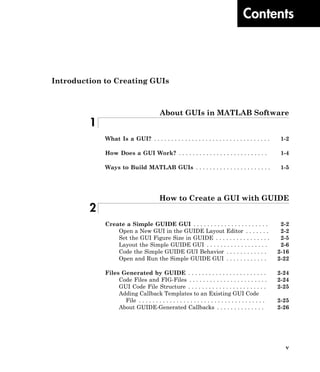
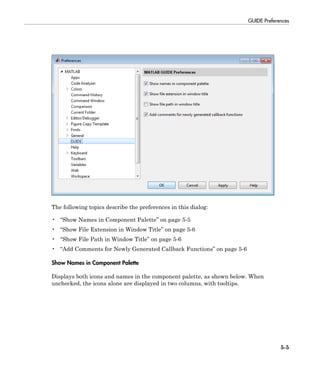
not respond because the functions contain no statements that perform actions yet. This
topic shows you how to add code to the file to make the GUI do things.
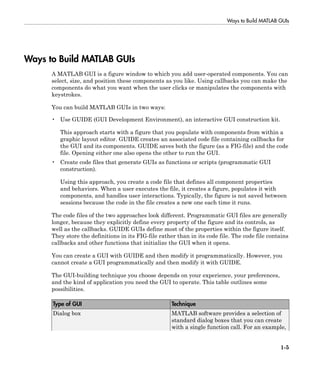
Generate Data to Plot
This topic shows you how to generate the data to be plotted when the GUI user clicks
a button. The opening function generates this data by calling MATLAB functions. The
opening function, which initializes a GUI when it opens, is the first callback in every
GUIDE-generated GUI code file.
In this example, you add code that creates three data sets to the opening function. The
code uses the MATLAB functions peaks, membrane, and sinc.
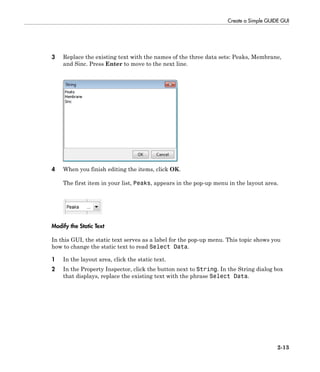
1 Display the opening function in the MATLAB Editor.
If the file simple_gui.m is not already open in the editor, open from the Layout
Editor by selecting View > Editor.
2 On the EDITOR tab, in the NAVIGATE section, click Go To, and then select
simple_gui_OpeningFcn.
The cursor moves to the opening function, which contains this code:
% --- Executes just before simple_gui is made visible.
function simple_gui_OpeningFcn(hObject, eventdata, handles, varargin)
% This function has no output args, see OutputFcn.
% hObject handle to figure
% eventdata reserved - to be defined in a future version of MATLAB
% handles structure with handles and user data (see GUIDATA)
% varargin command line arguments to simple_gui (see VARARGIN)
% Choose default command line output for simple_gui
handles.output = hObject;
% Update handles structure
guidata(hObject, handles);
% UIWAIT makes simple_gui wait for user response (see UIRESUME)
% uiwait(handles.figure1);
3 Create data for the GUI to plot by adding the following code to the opening function
immediately after the comment that begins % varargin...
% Create the data to plot.
handles.peaks=peaks(35);
handles.membrane=membrane;
[x,y] = meshgrid(-8:.5:8);
r = sqrt(x.^2+y.^2) + eps;
sinc = sin(r)./r;](https://image.slidesharecdn.com/matlab-buildgui-150310171915-conversion-gate01/85/Matlab-GUI-41-320.jpg)


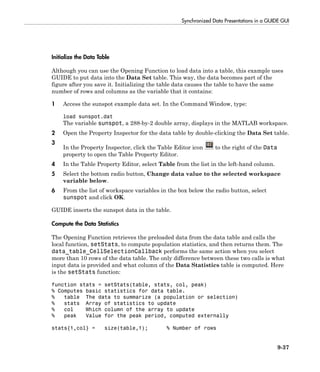
![Create a Simple Programmatic GUI
3-3
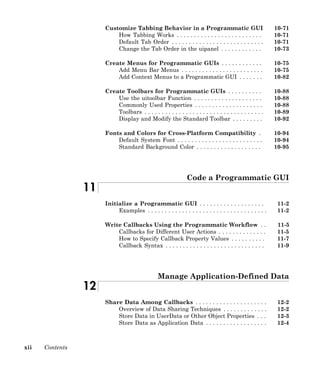
Create a Code File for the Simple Programmatic GUI
Create a function file (as opposed to a script file, which contains a sequence of MATLAB
commands but does not define functions).
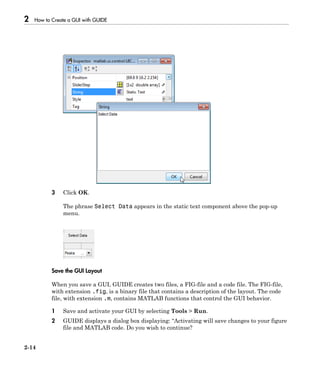
1 At the MATLAB prompt, type edit.
2 Type the following statement in the first line of the Editor.
function simple_gui2
3 Following the function statement, type these comments, ending with a blank line.
(The comments display at the command line in response to the help command.)
% SIMPLE_GUI2 Select a data set from the pop-up menu, then
% click one of the plot-type push buttons. Clicking the button
% plots the selected data in the axes.
(Leave a blank line here)
4 At the end of the file, after the blank line, add an end statement.
Note You need the end statement to specify the end of the function because the
example uses nested functions. To learn more, see “Nested Functions”.
5 Save the file in your current folder or at a location that is on your MATLAB path.
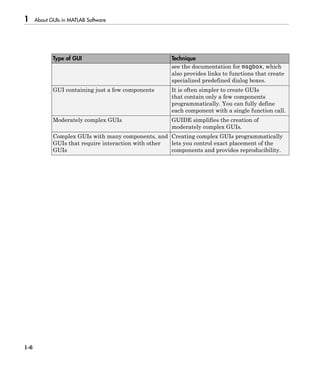
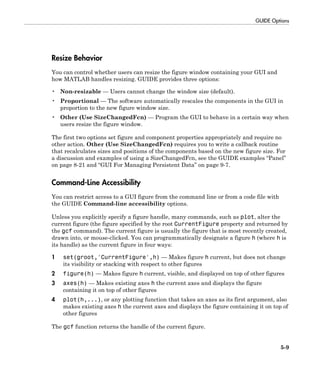
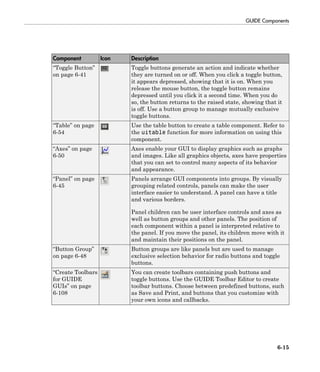
Create a Figure for the Simple Programmatic GUI
Add the following lines before the end statement in your file to create a figure and
position it on the screen. (In MATLAB software, a GUI is a figure. )
% Create and then hide the GUI as it is being constructed.
f = figure('Visible','off','Position',[360,500,450,285]);
The call to the figure function uses two property/value pairs:
• The Visible property makes the GUI invisible so that the GUI user cannot see the
components being added or initialized.
When the GUI has all its components and is initialized, the example makes it visible.
• The Position property is a four-element vector that specifies the location of the GUI
on the screen and its size: [distance from left, distance from bottom, width, height].
Default units are pixels.](https://image.slidesharecdn.com/matlab-buildgui-150310171915-conversion-gate01/85/Matlab-GUI-55-320.jpg)
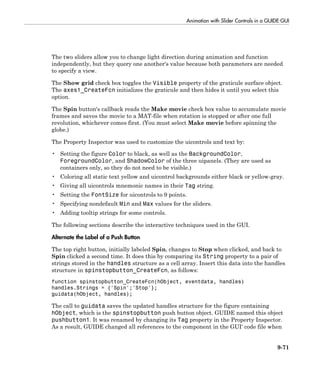
![3 A Simple Programmatic GUI
3-4
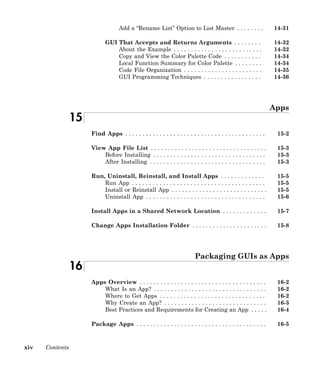
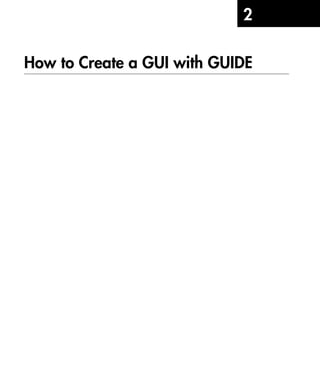
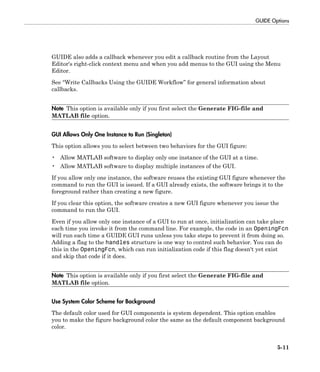
Add Components to the Simple Programmatic GUI
Create the push buttons, static text, pop-up menu, and axes components to the GUI.
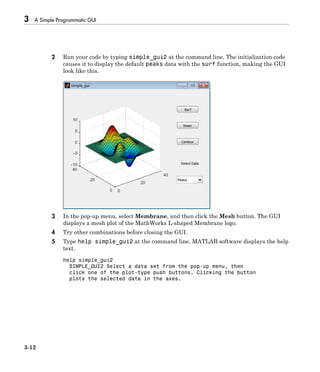
1 Following the call to figure, add these statements to your code file to create three
push button components.
% Construct the components.
hsurf = uicontrol('Style','pushbutton',...
'String','Surf','Position',[315,220,70,25]);
hmesh = uicontrol('Style','pushbutton',...
'String','Mesh','Position',[315,180,70,25]);
hcontour = uicontrol('Style','pushbutton',...
'String','Countour','Position',[315,135,70,25]);
Each statement uses a series of uicontrol property/value pairs to define a push
button:
• The Style property specifies that the uicontrol is a push button.
• The String property specifies the label on each push button: Surf, Mesh, and
Contour.
• The Position property specifies the location of each push button within the GUI
and its size: [distance from left, distance from bottom, width, height]. Default
units for push buttons are pixels.
Each uicontrol call returns the handle of the push button created.
2 Add the pop-up menu and its static text label to your GUI by adding these
statements to the code file following the push button definitions. The first statement
creates a popup menu and the second statement creates a text component that
serves as a label for the popup menu.
htext = uicontrol('Style','text','String','Select Data',...
'Position',[325,90,60,15]);
hpopup = uicontrol('Style','popupmenu',...
'String',{'Peaks','Membrane','Sinc'},...
'Position',[300,50,100,25]);
The pop-up menu component String property uses a cell array to specify the three
items in the pop-up menu: Peaks, Membrane, and Sinc.
The text component, the String property specifies instructions for the GUI user.](https://image.slidesharecdn.com/matlab-buildgui-150310171915-conversion-gate01/85/Matlab-GUI-56-320.jpg)
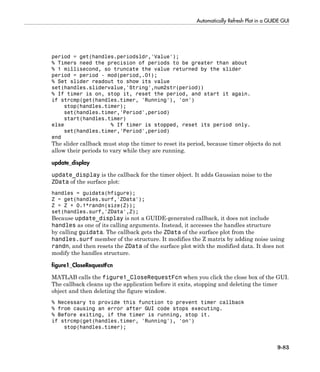
![Create a Simple Programmatic GUI
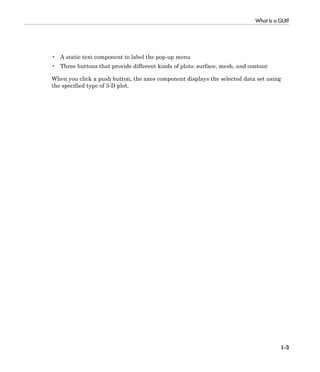
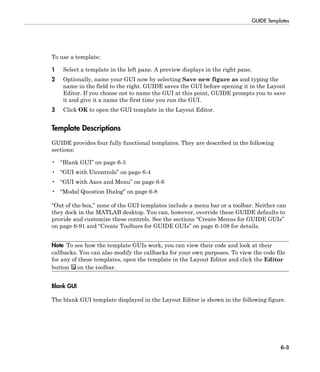
3-5
For both components, the Position property specifies the location of each
component within the GUI and its size: [distance from left, distance from bottom,
width, height]. Default units for these components are pixels.
3 Add the axes to the GUI by adding this statement to the code file.
ha = axes('Units','pixels','Position',[50,60,200,185]);
The Units property specifies pixels so that the axes has the same units as the other
components.
4 Following all the component definitions, add this line to the code file to align all
components, except the axes, along their centers.
align([hsurf,hmesh,hcontour,htext,hpopup],'Center','None');
5 Add this command following the align command.
%Make the GUI visible.
f.Visible = 'on';
Your code file should look like this:
function simple_gui2
% SIMPLE_GUI2 Select a data set from the pop-up menu, then
% click one of the plot-type push buttons. Clicking the button
% plots the selected data in the axes.
% Create and then hide the GUI as it is being constructed.
f = figure('Visible','off','Position',[360,500,450,285]);
% Construct the components.
hsurf = uicontrol('Style','pushbutton','String','Surf',...
'Position',[315,220,70,25]);
hmesh = uicontrol('Style','pushbutton','String','Mesh',...
'Position',[315,180,70,25]);
hcontour = uicontrol('Style','pushbutton',...
'String','Countour',...
'Position',[315,135,70,25]);
htext = uicontrol('Style','text','String','Select Data',...
'Position',[325,90,60,15]);
hpopup = uicontrol('Style','popupmenu',...
'String',{'Peaks','Membrane','Sinc'},...
'Position',[300,50,100,25]);
ha = axes('Units','Pixels','Position',[50,60,200,185]);](https://image.slidesharecdn.com/matlab-buildgui-150310171915-conversion-gate01/85/Matlab-GUI-57-320.jpg)
![3 A Simple Programmatic GUI
3-6
align([hsurf,hmesh,hcontour,htext,hpopup],'Center','None');
%Make the GUI visible.
f.Visible = 'on';
end
6 Run your code by typing simple_gui2 at the command line. You can select a data
set in the pop-up menu and click the push buttons, but nothing happens. This
is because there is no callback code in the file to service the pop-up menu or the
buttons.
Code the Simple Programmatic GUI Behavior
Program the Pop-Up Menu
The pop-up menu enables users to select the data to plot. When a GUI user selects one
of the three data sets in the pop-up menu, MATLAB software sets the pop-up menu
Value property to the index of the selected string. The pop-up menu callback reads the
pop-up menu Value property to determine which item is currently displayed and sets
current_data accordingly.](https://image.slidesharecdn.com/matlab-buildgui-150310171915-conversion-gate01/85/Matlab-GUI-58-320.jpg)

![3 A Simple Programmatic GUI
3-8
end
Program the Callbacks
When the GUI user selects a data set from the pop-up menu or clicks one of the push
buttons, MATLAB software executes the callback associated with that particular event.
Use each component's Callback property to specify the name of the callback with which
each event is associated.
1 To the uicontrol statement that defines the Surf push button, add the property/
value pair
'Callback',{@surfbutton_Callback}
so that the statement looks like this:
hsurf = uicontrol('Style','pushbutton','String','Surf',...
'Position',[315,220,70,25],...
'Callback',{@surfbutton_Callback});
Callback is the name of the property. surfbutton_Callback is the name of the
callback that services the Surf push button.
2 To the uicontrol statement that defines the Mesh push button, add the property/
value pair
'Callback',@meshbutton_Callback
3 To the uicontrol statement that defines the Contour push button, add the
property/value pair
'Callback',@contourbutton_Callback
4 To the uicontrol statement that defines the pop-up menu, add the property/value
pair
'Callback',@popup_menu_Callback
For more information, see “Write Callbacks Using the Programmatic Workflow” on page
11-5.
Initialize the Simple Programmatic GUI
Initialize the GUI, so it is ready for the user when the code makes the GUI visible.
Make the GUI behave properly when it is resized by changing the component and figure
units to normalized. This causes the components to resize when the GUI is resized.](https://image.slidesharecdn.com/matlab-buildgui-150310171915-conversion-gate01/85/Matlab-GUI-60-320.jpg)
![Create a Simple Programmatic GUI
3-9
Normalized units map the lower-left corner of the figure window to (0,0) and the upper-
right corner to (1.0, 1.0).
Replace this code in editor:
% Make the GUI visible.
f.Visible = 'on';
with this code:
% Initialize the GUI.
% Change units to normalized so components resize automatically.
set([f,hsurf,hmesh,hcontour,htext,hpopup],'Units','normalized');
% Generate the data to plot.
peaks_data = peaks(35);
membrane_data = membrane;
[x,y] = meshgrid(-8:.5:8);
r = sqrt(x.^2+y.^2) + eps;
sinc_data = sin(r)./r;
% Create a plot in the axes.
current_data = peaks_data;
surf(current_data);
% Assign the GUI a name to appear in the window title.
f.Name = 'Simple GUI';
% Move the GUI to the center of the screen.
movegui(f,'center')
% Make the GUI visible.
f.Visible = 'on';
Verify Code and Run the Simple Programmatic GUI
Make sure your code appears as it should, and then run it.
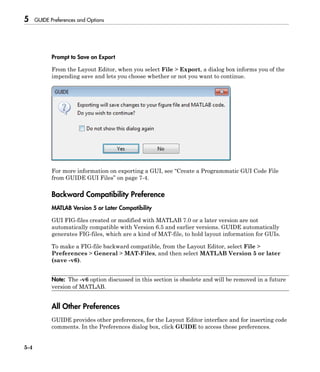
1 Verify that your code file looks like this:
function simple_gui2
% SIMPLE_GUI2 Select a data set from the pop-up menu, then
% click one of the plot-type push buttons. Clicking the button
% plots the selected data in the axes.](https://image.slidesharecdn.com/matlab-buildgui-150310171915-conversion-gate01/85/Matlab-GUI-61-320.jpg)
![3 A Simple Programmatic GUI
3-10
% Create and then hide the GUI as it is being constructed.
f = figure('Visible','off','Position',[360,500,450,285]);
% Construct the components.
hsurf = uicontrol('Style','pushbutton',...
'String','Surf','Position',[315,220,70,25],...
'Callback',@surfbutton_Callback);
hmesh = uicontrol('Style','pushbutton',...
'String','Mesh','Position',[315,180,70,25],...
'Callback',@meshbutton_Callback);
hcontour = uicontrol('Style','pushbutton',...
'String','Countour','Position',[315,135,70,25],...
'Callback',@contourbutton_Callback);
htext = uicontrol('Style','text','String','Select Data',...
'Position',[325,90,60,15]);
hpopup = uicontrol('Style','popupmenu',...
'String',{'Peaks','Membrane','Sinc'},...
'Position',[300,50,100,25],...
'Callback',@popup_menu_Callback);
ha = axes('Units','pixels','Position',[50,60,200,185]);
align([hsurf,hmesh,hcontour,htext,hpopup],'Center','None');
% Initialize the GUI.
% Change units to normalized so components resize automatically.
f.Units = 'normalized';
hsurf.Units = 'normalized';
hmesh.Units = 'normalized';
hcontour.Units = 'normalized';
htext.Units = 'normalized';
hpopup.Units = 'normalized';
% Generate the data to plot.
peaks_data = peaks(35);
membrane_data = membrane;
[x,y] = meshgrid(-8:.5:8);
r = sqrt(x.^2+y.^2) + eps;
sinc_data = sin(r)./r;
% Create a plot in the axes.
current_data = peaks_data;
surf(current_data);
% Assign the GUI a name to appear in the window title.
f.Name = 'Simple GUI';](https://image.slidesharecdn.com/matlab-buildgui-150310171915-conversion-gate01/85/Matlab-GUI-62-320.jpg)


![Add Components to the GUIDE Layout Area
6-19
Use Coordinates to Place Components
The status bar at the bottom of the GUIDE Layout Editor displays:
• Current Point — The current location of the mouse relative to the lower left corner
of the grid area in the Layout Editor.
• Position — The Position property of the selected component, a 4-element vector:
[distance from left, distance from bottom, width, height], where distances are relative
to the parent figure, panel, or button group. All values are given in pixels. Rulers also
display pixels.](https://image.slidesharecdn.com/matlab-buildgui-150310171915-conversion-gate01/85/Matlab-GUI-103-320.jpg)


![Add Components to the GUIDE Layout Area
6-25
Property Value Description
Max Scalar. Default is 1. Maximum value.
Interpretation depends on the
type of component.
Min Scalar. Default is 0. Minimum value.
Interpretation depends on the
type of component.
Position 4-element vector: [distance
from left, distance from
bottom, width, height].
Size of the component and its
location relative to its parent.
String String. Can also be a cell
array or character array of
strings.
Component label. For list
boxes and pop-up menus it is
a list of the items.
Units characters, centimeters,
inches, normalized,
pixels, points. Default is
characters.
Units of measurement used
to interpret the Position
property vector
Value Scalar or vector Value of the component.
Interpretation depends on the
type of component.
For a complete list of properties and for more information about the properties listed in
the table, see Uicontrol Properties.
Push Button
To create a push button with label Button 1, as shown in this figure:](https://image.slidesharecdn.com/matlab-buildgui-150310171915-conversion-gate01/85/Matlab-GUI-109-320.jpg)


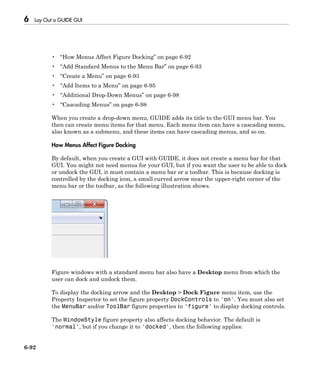
![6 Lay Out a GUIDE GUI
6-28
• Specify the range of the slider by setting its Min property to the minimum value of
the slider and its Max property to the maximum value. The Min property must be less
than Max.
• Specify the value indicated by the slider when it is created by setting the Value
property to the appropriate number. This number must be less than or equal to Max
and greater than or equal to Min. If you specify Value outside the specified range, the
slider is not displayed.
• The slider Value changes by a small amount when a user clicks the arrow button,
and changes by a larger amount when the user clicks the trough (also called
the channel). Control how the slider responds to these actions by setting the
SliderStep property. Specify SliderStep as a two-element vector, [minor_step
major_step], where minor_step is less than or equal to major_step. Because
specifying very small values can cause unpredictable slider behavior, make both
minor_step and major_step greater than 1e-6. Set major_step to the proportion
of the range that clicking the trough moves the slider thumb. Setting it to 1 or higher
causes the thumb to move to Max or Min when the trough is clicked.
As major_step increases, the thumb grows longer. When major_step is 1, the
thumb is half as long as the trough. When major_step is greater than 1, the
thumb continues to grow, slowly approaching the full length of the trough. When a
slider serves as a scroll bar, you can uses this behavior to indicate how much of the
document is currently visible by changing the value of major_step.](https://image.slidesharecdn.com/matlab-buildgui-150310171915-conversion-gate01/85/Matlab-GUI-112-320.jpg)


![6 Lay Out a GUIDE GUI
6-40
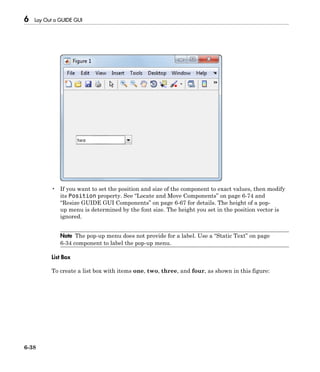
To display the & character in a label, use two & characters in the string. The words
remove, default, and factory (case sensitive) are reserved. To use one of these as a
label, prepend a backslash () to the string. For example, remove yields remove.
If the width of the component is too small to accommodate one or more of the specified
strings, MATLAB software truncates those strings with an ellipsis.
• Specify selection by using the Value property together with the Max and Min
properties.
• To select a single item when the component is created, set Value to a scalar that
indicates the index of the selected list item, where 1 corresponds to the first item
in the list.
• To select more than one item when the component is created, set Value to a vector
of indices of the selected items. Value = [1,3] results in the following selection.](https://image.slidesharecdn.com/matlab-buildgui-150310171915-conversion-gate01/85/Matlab-GUI-124-320.jpg)
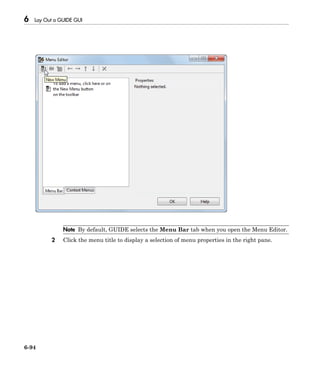
![Add Components to the GUIDE Layout Area
6-41
To enable selection of more than one item, you must specify the Max and Min
properties so that their difference is greater than 1. For example, Max = 2, Min
= 0. Max default is 1, Min default is 0.
• If you want no initial selection, set the Max and Min properties to enable multiple
selection, i.e., Max - Min > 1, and then set the Value property to an empty
matrix [].
• If the list box is not large enough to display all list entries, you can set the
ListBoxTop property to the index of the item you want to appear at the top when the
component is created.
• If you want to set the position or size of the component to an exact value, then modify
its Position property. See “Locate and Move Components” on page 6-74and
“Resize GUIDE GUI Components” on page 6-67 for details.
Note The list box does not provide for a label. Use a “Static Text” on page 6-34
component to label the list box.
Toggle Button
To create a toggle button with label Left/Right Tile, as shown in this figure:](https://image.slidesharecdn.com/matlab-buildgui-150310171915-conversion-gate01/85/Matlab-GUI-125-320.jpg)

![6 Lay Out a GUIDE GUI
6-44
Note To manage exclusive selection of radio buttons and toggle buttons, put them in a
button group. See “Button Group” on page 6-48 for more information.
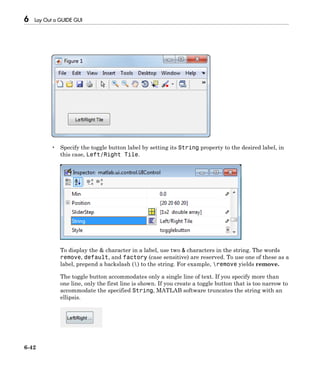
Panels and Button Groups
Panels and button groups are containers that arrange GUI components into groups.
If you move the panel or button group, its children move with it and maintain their
positions relative to the panel or button group.
To define panels and button groups, you must set certain properties. To do this:
1 Use the Property Inspector to modify the appropriate properties. Open the Property
Inspector by selecting View > Property Inspector or by clicking the Property
Inspector button .
2 In the layout area, select the component you are defining.
Note See “GUIDE Components” on page 6-13 for descriptions of these components.
See “Callbacks for Specific Components” on page 8-12 for basic examples of
programming these components.
Subsequent topics describe commonly used properties of panels and button groups and
offer a simple example for each component.
• “Commonly Used Properties” on page 6-44
• “Panel” on page 6-45
• “Button Group” on page 6-48
Commonly Used Properties
The most commonly used properties needed to describe a panel or button group are
shown in the following table:
Property Values Description
Position 4-element vector: [distance
from left, distance from
bottom, width, height].
Size of the component and
its location relative to its
parent.](https://image.slidesharecdn.com/matlab-buildgui-150310171915-conversion-gate01/85/Matlab-GUI-128-320.jpg)


![Add Components to the GUIDE Layout Area
6-51
2 In the layout area, select the component you are defining.
Note See “GUIDE Components” on page 6-13 for a description of this component.
Subsequent topics describe commonly used properties of axes and offer a simple example.
• “Commonly Used Properties” on page 6-51
• “Create Axes” on page 6-52
Commonly Used Properties
The most commonly used properties needed to describe an axes are shown in the
following table:
Property Values Description
NextPlot add, replace,
replacechildren. Default
is replace
Specifies whether plotting
adds graphics, replaces
graphics and resets axes
properties to default, or
replaces graphics only.
Position 4-element vector: [distance
from left, distance from
bottom, width, height].
Size of the component and
its location relative to its
parent.
Units normalized,
centimeters,
characters, inches,
pixels, points. Default is
normalized.
Units of measurement used
to interpret position vector
For a complete list of properties and for more information about the properties listed in
the table, see Axes Properties.
See commands such as the following for more information on axes objects: plot, surf,
line, bar, polar, pie, contour, imagesc, and mesh.
Many of these graphing functions reset axes properties by default, according to the
setting of its NextPlot property, which can cause unwanted behavior in a GUI, such
as resetting axis limits and removing axes context menus and callbacks. See the next](https://image.slidesharecdn.com/matlab-buildgui-150310171915-conversion-gate01/85/Matlab-GUI-135-320.jpg)


![Add Components to the GUIDE Layout Area
6-55
Commonly Used Properties
The most commonly used properties of a table component are listed in the table below.
These are grouped in the order they appear in the Table Property Editor. Please refer to
uitable documentation for detail of all the table properties:
Group Property Values Description
ColumnName 1-by-n cell array
of strings |
{'numbered'} | empty
matrix ([])
The header label of
the column.
ColumnFormat Cell array of strings Determines display
and editability of
columns
ColumnWidth 1-by-n cell array or
'auto'
Width of each
column in pixels;
individual column
widths can also be
set to 'auto'
Column
ColumnEditable logical 1-by-n matrix
| scalar logical value
| empty matrix ([])
Determines data in a
column as editable
Row RowName 1-by-n cell array of
strings
Row header label
names
BackgroundColor n-by-3 matrix of
RGB triples
Background color of
cells
Color
RowStriping {on} | off Color striping of
table rows
Data Data Matrix or cell array
of numeric, logical,
or character data
Table data.
Create a Table
To create a GUI with a table in GUIDE as shown, do the following:](https://image.slidesharecdn.com/matlab-buildgui-150310171915-conversion-gate01/85/Matlab-GUI-139-320.jpg)


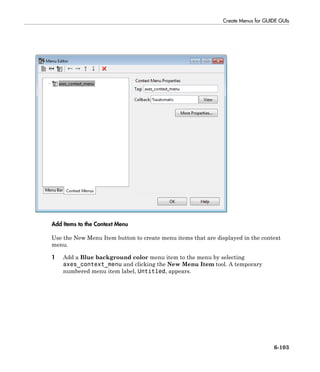
![6 Lay Out a GUIDE GUI
6-74
Locate and Move Components
You can locate or move components in one of the following ways:
In this section...
“Use Coordinate Readouts” on page 6-74
“Drag Components” on page 6-75
“Use Arrow Keys to Move Components” on page 6-76
“Set the Component's Position Property” on page 6-76
Another topic that may be of interest is
• “Align GUIDE GUI Components” on page 6-79
Use Coordinate Readouts
Coordinate readouts indicate where a component is placed and where the mouse pointer
is located. Use these readouts to position and align components manually. The Position
readout shows the position of the selected component as the vector, [x y width
height]. These values are displayed in units of pixels, regardless of the coordinate units
you select for the component.
The Current Point readout displays the current mouse position in pixels.
The size of this push button is 101-by-38 pixels. The lower left corner of the button is
located at x,y = (50,260). The mouse pointer is located at x,y = (156,255).](https://image.slidesharecdn.com/matlab-buildgui-150310171915-conversion-gate01/85/Matlab-GUI-158-320.jpg)


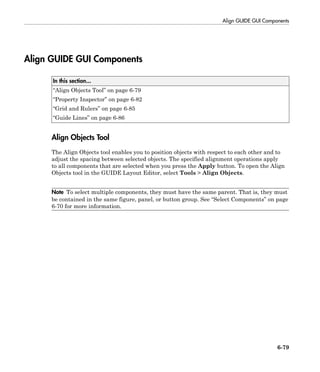


![Align GUIDE GUI Components
6-85
Use the Property Inspector to Align Components
The Property Inspector enables you to align components by setting their Position
properties. A component's Position property is a 4-element vector that specifies the
location of the component on the GUI and its size: [distance from left, distance from
bottom, width, height]. The values are given in the units specified by the Units property
of the component.
1 Select the components you want to align. See “Select Components” on page 6-70 for
information.
2 Select View > Property Inspector or click the Property Inspector button .
3 In the Property Inspector, scroll to the Units property and note its current setting,
then change the setting to inches.
4 Scroll to the Position property. This figure shows the Position property for
multiple components of the same size.
5 Change the value of x to align their left sides. Change the value of y to align their
bottom edges. For example, setting x to 2.0 aligns the left sides of the components 2
inches from the left side of the GUI.
6 When the components are aligned, change the Units property back to its original
setting.
Grid and Rulers
The layout area displays a grid and rulers to facilitate component layout. Grid lines are
spaced at 50-pixel intervals by default and you can select from a number of other values](https://image.slidesharecdn.com/matlab-buildgui-150310171915-conversion-gate01/85/Matlab-GUI-169-320.jpg)


![8 Programming a GUIDE GUI
8-8
on page 8-5. the last argument, varargin, enables you to pass arguments from the
command line to the opening function. The opening function can take actions with
them (for example, setting property values) and also make the arguments available to
callbacks by adding them to the handles structure.
For more information about using varargin, see the varargin reference page and
“Support Variable Number of Inputs”.
Passing Object Properties to an Opening Function
You can pass a property name/value pair for any component as two successive command
line arguments and set that value in the opening function. If you are setting a figure
property, GUIDE handles this automatically. For example, my_gui('Position',
[71.8 44.9 74.8 19.7]) opens the GUI at the specified position, since Position is a
valid figure property (in character units, the default).
You can define new names for properties or combinations of them. For example, you can
make your GUI accept an alias for a figure property as a convenience to the user. For
example, you might want the user to be able to open the GUI with a Title argument
instead of calling it Name, which is the property that specifies the name on the GUI's title
bar. To do this, you must provide code in its OpeningFcn to set theName figure property.
The following example illustrates how to do this.
If you pass an input argument that is not a valid figure property, your code must
recognize its name and use the name/value pair to set the appropriate property on the
correct object. Otherwise, the argument is ignored. The following example is from the
opening function for the Modal Question Dialog GUI template, available from the GUIDE
Quick Start dialog box. The added code opens the modal dialog with a message, specified
from the command line or by another GUI that calls this one. For example,
mygui('String','Do you want to exit?')
displays the text 'Do you want to exit?' on the GUI. To do this, you need to
customize the opening function because 'String' is not a valid figure property, it is a
static text property. The Modal Question Dialog template file contains the following code,
which
• Uses the nargin function to determine the number of user-specified arguments
(which do not include hObject, eventdata, and handles)
• Parses varargin to obtain property name/value pairs, converting each name string to
lower case](https://image.slidesharecdn.com/matlab-buildgui-150310171915-conversion-gate01/85/Matlab-GUI-222-320.jpg)


![Callbacks for Specific Components
8-17
% hObject handle to slider1 (see GCBO)
% eventdata reserved - to be defined in a future version of MATLAB
% handles structure with handles and user data (see GUIDATA)
% Hints: get(hObject,'Value') returns position of slider
% get(hObject,'Min') and get(hObject,'Max') to determine...
slider_value = get(hObject,'Value');
display(slider_value);
When the end user moves the slider, the callback function gets the current value of the
slider and displays it in the Command Window. By default, the slider’s range is [0, 1]. To
modify the range, set the slider’s Max and Min properties to the maximum and minimum
values, respectively.
List Box
Populate Items in the List Box
If you are developing a GUI using GUIDE, use the list box CreateFcn callback to add
items to the list box.
This code is an example of a list box CreateFcn callback that populates the list box with
the items, Red, Green, and Blue.
function listbox1_CreateFcn(hObject, eventdata, handles)
% hObject handle to listbox1 (see GCBO)
% eventdata reserved - to be defined in a future version of MATLAB
% handles empty - handles not created until after all CreateFcns
% Hint: listbox controls usually have a white background on Windows.
if ispc && isequal(get(hObject,'BackgroundColor'), ...
get(0,'defaultUicontrolBackgroundColor'))
set(hObject,'BackgroundColor','white');
end
set(hObject,'String',{'Red';'Green';'Blue'});
The last line, set(hObject,'String',{'Red';'Green';'Blue'}), populates the
contents of the list box.
If you are developing a GUI programmatically (without GUIDE), then populate the list
box when you create it. For example:
function mygui()](https://image.slidesharecdn.com/matlab-buildgui-150310171915-conversion-gate01/85/Matlab-GUI-231-320.jpg)
![8 Programming a GUIDE GUI
8-18
figure
uicontrol('Style','Listbox',...
'String',{'Red';'Green';'Blue'},...
'Position',[40 70 80 50]);
end
Change the Selected Item
When the end user selects a list box item, the list box’s Value property changes to a
number that corresponds to the item’s position in the list. For example, a value of 1
corresponds to the first item in the list. If you want to change the selection in your GUI
code, then change the Value property to another number between 1 and the number of
items in the list.
For example, you can use the handles structure in GUIDE to access the list box and
change the Value property:
set(handles.listbox1,'Value',2)
The first argument, handles.listbox1, might be different in your code, depending on
the value of the list box Tag property.
Write the Callback Function
This code is an example of a list box callback function in GUIDE. Associate this function
with the list box Callback property to make it execute when a selects an item in the list
box.
function listbox1_Callback(hObject, eventdata, handles)
% hObject handle to listbox1 (see GCBO)
% eventdata reserved - to be defined in a future version of MATLAB
% handles structure with handles and user data (see GUIDATA)
% Hints: contents = cellstr(get(hObject,'String')) returns contents
% contents{get(hObject,'Value')} returns selected item from listbox1
items = get(hObject,'String');
index_selected = get(hObject,'Value');
item_selected = items{index_selected};
display(item_selected);
When the end user selects an item in the list box, the callback function performs the
following tasks:
• Gets all the items in the list box and stores them in the variable, items.](https://image.slidesharecdn.com/matlab-buildgui-150310171915-conversion-gate01/85/Matlab-GUI-232-320.jpg)
![Callbacks for Specific Components
8-19
• Gets the numeric index of the selected item and stores it in the variable,
index_selected.
• Gets the string value of the selected item and stores it in the variable,
item_selected.
• Displays the selected item in the MATLAB Command Window.
The example, “Interactive List Box in a GUIDE GUI” on page 9-46 shows how to
populate a list box with directory names.
Pop-Up Menu
Populate Items in the Pop-Up Menu
If you are developing a GUI using GUIDE, use the pop-up menu CreateFcn callback to
add items to the pop-up menu.
This code is an example of a pop-up menu CreateFcn callback that populates the menu
with the items, Red, Green, and Blue.
function popupmenu1_CreateFcn(hObject, eventdata, handles)
% hObject handle to popupmenu1 (see GCBO)
% eventdata reserved - to be defined in a future version of MATLAB
% handles empty - handles not created until after all CreateFcns
% Hint: popupmenu controls usually have a white background on Windows.
if ispc && isequal(get(hObject,'BackgroundColor'),...
get(0,'defaultUicontrolBackgroundColor'))
set(hObject,'BackgroundColor','white');
end
set(hObject,'String',{'Red';'Green';'Blue'});
The last line, set(hObject,'String',{'Red';'Green';'Blue'}), populates the
contents of the pop-up menu.
If you are developing a GUI programmatically (without GUIDE), then populate the pop-
up menu when you create it. For example:
function mygui()
figure
uicontrol('Style','popupmenu',...
'String',{'Red';'Green';'Blue'},...
'Position',[40 70 80 20]);
end](https://image.slidesharecdn.com/matlab-buildgui-150310171915-conversion-gate01/85/Matlab-GUI-233-320.jpg)


![Callbacks for Specific Components
8-25
% hObject handle to copy_menu_item (see GCBO)
% eventdata reserved - to be defined in a future version of MATLAB
% handles structure with handles and user data (see GUIDATA)
display('Copy menu item selected');
% --------------------------------------------------------------------
function tofile_menu_item_Callback(hObject, eventdata, handles)
% hObject handle to tofile_menu_item (see GCBO)
% eventdata reserved - to be defined in a future version of MATLAB
% handles structure with handles and user data (see GUIDATA)
[filename,path] = uiputfile('myfile.m','Save file name');
The function names might be different in your GUI, depending on the tag names you
specify in the GUIDE Menu Editor.
The callback functions trigger in response to these actions:
• When the end user selects the Edit menu, the edit_menu_Callback function
displays the text, 'Edit menu selected', in the MATLAB Command Window.
• When the end user hovers the mouse over the Copy menu item, the
copy_menu_item_Callback function displays the text, 'Copy menu item
selected', in the MATLAB Command Window.
• When the end user clicks and releases the mouse button on the To File menu item,
the tofile_menu_item_Callback function displays a dialog box that prompts the
end user to select a destination folder and file name.
The tofile_menu_item_Callback function calls the uiputfile function to prompt
the end user to supply a destination file and folder. If you want to create a menu item
that prompts the user for an existing file, for example, if your GUI has an Open File
menu item, then use the uigetfile function.
When you create a cascading menu like this one, the intermediate menu items trigger
when the mouse hovers over them. The final, terminating, menu item triggers when the
mouse button releases over the menu item.
How to Update a Menu Item Check
You can add a check mark next to a menu item to indicate that an option is enabled. In
GUIDE, you can select Check mark this item in the Menu Editor to make the menu
item checked by default. Each time the end user selects the menu item, the callback
function can turn the check on or off.
This code shows how to change the check mark next to a menu item.](https://image.slidesharecdn.com/matlab-buildgui-150310171915-conversion-gate01/85/Matlab-GUI-239-320.jpg)


![9 Examples of GUIDE GUIs
9-8
copyfile(fullfile(docroot, 'techdoc','creating_guis',...
'examples','addr*.*')),...
fileattrib('addr*.*', '+w');
guide address_book.fig;
2 In the GUIDE Layout Editor, click the Editor button .
The address_book.m code file opens in the MATLAB Editor.
Calling Syntax
The “address_book_OpeningFcn” on page 9-8 code in address_book.m
interprets the input arguments:
• If you call the GUI, address_book, with no arguments, the GUI uses the default
address book MAT-file.
• If you invoke the GUI with a pair of arguments (for example,
address_book('book','my_list.mat')) , the first argument, 'book', is a key
word that the code looks for in the opening function. If the key word matches, the code
uses the second argument as the MAT-file for the address book.
address_book_OpeningFcn
function address_book_OpeningFcn(hObject, eventdata, ...
handles, varargin)
% Choose default command line output for address_book
handles.output = hObject;
% Make figure non-dockable
% set(hObject,'DockControls','off')
set(hObject,'WindowStyle','normal')
set(hObject,'HandleVisibility','callback')
% Update handles structure
guidata(hObject, handles);
if nargin < 4
% Load the default address book
Check_And_Load([],handles);
% If first element in varargin is 'book' and the second element is a
% MATLAB file, then load that file
elseif (length(varargin) == 2 && ...](https://image.slidesharecdn.com/matlab-buildgui-150310171915-conversion-gate01/85/Matlab-GUI-252-320.jpg)


![GUI For Managing Persistent Data
9-11
Open and Load MAT-File
The address book GUI contains a File > Open menu option for loading address book
MAT-files.
When you select this option, “Open_Callback” on page 9-11 in address_book.m
opens a dialog box that enables you to browse for files.
The dialog box returns the file name and the path to the file, which are passed
to fullfile to ensure the path is properly constructed for any platform. The
Check_And_Load function validates and loads the new address book.
For information on creating the menu, see “Create Menus for GUIDE GUIs” on page
6-91.
Open_Callback
function Open_Callback(hObject, eventdata, handles, varargin)
[filename, pathname] = uigetfile( ...
{'*.mat', 'All MAT-Files (*.mat)'; ...
'*.*','All Files (*.*)'}, ...
'Select Address Book');
% If "Cancel" is selected then return
if isequal([filename,pathname],[0,0])
return
% Otherwise construct the full file name and _and load the file.
else
File = fullfile(pathname,filename);
% if the MAT-file is not valid, do not save the name
if Check_And_Load(File,handles)
handles.LastFIle = File;
guidata(hObject,handles)
end
end
Retrieve and Store Data
The GUI’s Contact Name text box displays the name of the address book entry. If you
type in a new name and press enter, the “Contact_Name_Callback” on page 9-12 in
address_book.m does the following:
• If the name exists in the current address book, the corresponding phone number
displays.](https://image.slidesharecdn.com/matlab-buildgui-150310171915-conversion-gate01/85/Matlab-GUI-255-320.jpg)


![9 Examples of GUIDE GUIs
9-16
the Contact_Name_Callback or the Contact_Phone_Callback updates
handles.Addresses.
If you select Save, the save function is called to save the current MAT-file with the new
names and phone numbers.
If you select Save As, a dialog box displays which enables you to select the name of an
existing MAT-file or specify a new file. The dialog box returns the selected file name and
path. The final steps include:
• Using fullfile to create a platform-independent path name.
• Calling save to save the new data in the MAT-file.
• Updating the handles structure to contain the new MAT-file name.
• Calling guidata to save the handles structure.
Save_Callback
function Save_Callback(hObject, eventdata, handles, varargin)
% Get the Tag of the menu selected
Tag = get(hObject,'Tag');
% Get the address array
Addresses = handles.Addresses;
% Based on the item selected, take the appropriate action
switch Tag
case 'Save'
% Save to the default addrbook file
File = handles.LastFile;
save(File,'Addresses')
case 'Save_As'
% Allow the user to select the file name to save to
[filename, pathname] = uiputfile( ...
{'*.mat';'*.*'}, ...
'Save as');
% If 'Cancel' was selected then return
if isequal([filename,pathname],[0,0])
return
else
% Construct the full path and save
File = fullfile(pathname,filename);
save(File,'Addresses')
handles.LastFile = File;](https://image.slidesharecdn.com/matlab-buildgui-150310171915-conversion-gate01/85/Matlab-GUI-260-320.jpg)

![9 Examples of GUIDE GUIs
9-18
When the you resize the figure and release the mouse, the SizeChangedFcn callback
executes. Unless you have maximized the figure, the SizeChangedFcn callback enforces
the height of the GUI and resets the width of the Contact Name field. The following
sections describe how this calculation works.
Width Changes
If the new width is greater than the original width, set the figure to the new width.
The size of the Contact Name text box changes in proportion to the new figure width.
This is accomplished by:
• Obtaining the figure width as a ratio of its original width.
• Expanding or contracting the width of the Contact Name field proportionally.
If the new width is less than the original width, use the original width. The code relies on
the fact that the original width of the Contact Name field is 72 character units.
Height Changes
The height and width of the GUI is specified in pixel units. Using units of pixels enables
maximizing and minimizing the figure to work properly. The code assumes that its
dimensions are 470-by-250 pixels. If you attempt to change the height, the code restores
the original height. However, because the resize function is triggered when you release
the mouse button after changing the size, the resize function cannot always determine
the original position of the GUI on screen. Therefore, the resize function applies a
compensation to the vertical position (second element in the figure Position vector) by
adding the vertical position to the height when you release the mouse and subtracting
the original height.
When you resize the GUI from the bottom, the GUI stays in the same position. When you
resize from the top, the GUI moves to the location where you release the mouse button.
SizeChangedFcn
% uicontrol units are in 'characters'
Figure_Size = get(hObject,'Position');
% This is the figure's original position in pixel units
Original_Size = [350 700 470 250];
% If the figure seems to be maximized, do not resize at all
pix_pos = get(hObject,'Position');
scr_size = get(groot,'ScreenSize');
if .99*scr_size(3) < pix_pos(3) % Apparently maximized
% When docked, get out](https://image.slidesharecdn.com/matlab-buildgui-150310171915-conversion-gate01/85/Matlab-GUI-262-320.jpg)
![GUI For Managing Persistent Data
9-19
return
end
% If resized figure is smaller than original figure, then compensate.
% However, do not change figure size if it is docked; just adjust
% uicontrols
if ~strcmp(get(hObject,'WindowStyle'),'docked')
if Figure_Size(3) < Original_Size(3)
% If the width is too small then reset to origianl width
set(hObject,'Position',[Figure_Size(1) ...
Figure_Size(2) ...
Original_Size(3) ...
Original_Size(4)])
Figure_Size = get(hObject,'Position');
end
if abs(Figure_Size(4) - Original_Size(4)) > 10 % pixels
% Do not allow the height to change
set(hObject,'Position',[Figure_Size(1) ...
Figure_Size(2)+Figure_Size(4)-Original_Size(4) ...
Figure_Size(3) ...
Original_Size(4)])
end
movegui(hObject, 'onscreen')
end
% Get Contact_Name field Position for readjusting its width
C_N_pos = get(handles.Contact_Name,'Position');
ratio = Figure_Size(3) / Original_Size(3);
% Reset it so that its width remains proportional to figure width
% The original width of the Contact_Name box is 72 (characters)
set(handles.Contact_Name,'Position',[C_N_pos(1) ...
C_N_pos(2) ...
ratio * 72 ...
C_N_pos(4)])
Keeping Resized Figure On Screen
The SizeChangedFcn callback calls movegui to ensure that the resized GUI is on screen
regardless of where you release the mouse.
The first time it runs, the GUI displays at the size and location specified by the figure
Position property. This property was set with the Property Inspector when the GUI
was created and it can be changed it in GUIDE at any time.](https://image.slidesharecdn.com/matlab-buildgui-150310171915-conversion-gate01/85/Matlab-GUI-263-320.jpg)


![9 Examples of GUIDE GUIs
9-26
The edit text callbacks execute when you enter text in an edit box and press Return or
click elsewhere in the GUI. Even if you immediately click the Plot button, the edit text
callback executes before the plot button callback activates. When a callback receives
invalid input, it disables the Plot button, preventing its callback from running. Finally,
it restores focus to itself, selecting the text that did not validate so that you can re-enter
a value.
For example, here is the GUI's response to input of a time vector, [1 2 6 4 5 7 9],
that does not monotonically increase.](https://image.slidesharecdn.com/matlab-buildgui-150310171915-conversion-gate01/85/Matlab-GUI-270-320.jpg)
![GUI That Accepts Parameters and Generates Plots
9-27
In this figure, the two plots reflect the last successful set of inputs, f1 = 31.41, f2
= 120, and t = [1 2 3 4 5 7 9]. The time vector [1 2 6 4 5 7 9] appears
highlighted so that you can enter a new, valid, value. The highlighting results from
executing the command uicontrol(hObject) in the preceding code listing.
Plot Push Button Behavior
When you click the Plot button, the plot_button_Callback performs three basic
tasks: it gets input from the edit text components, calculates data, and creates the two
plots.
Get Input
The first task for the plot_button_Callback is to read the input values. This involves:
• Reading the current values in the three edit text boxes using the handles structure
to access the edit text handles.
• Converting the two frequency values (f1 and f2) from strings to doubles using
str2double.
• Evaluating the time string using eval to produce a vector t, which the callback used
to evaluate the mathematical expression.
The following code shows how the plot_button_Callback obtains the input:
% Get user input from GUI
f1 = str2double(get(handles.f1_input,'String'));
f2 = str2double(get(handles.f2_input,'String'));
t = eval(get(handles.t_input,'String'));
Calculate Data
After constructing the string input parameters to numeric form and assigning
them to local variables, the next step is to calculate data for the two graphs. The
plot_button_Callback computes the time domain data using an expression of sines:
x = sin(2*pi*f1*t) + sin(2*pi*f2*t);
The callback computes the frequency domain data as the Fourier transform of the time
domain data:
y = fft(x,512);
For an explanation of this computation, see the fft function.](https://image.slidesharecdn.com/matlab-buildgui-150310171915-conversion-gate01/85/Matlab-GUI-271-320.jpg)


![Synchronized Data Presentations in a GUIDE GUI
9-41
Selection data is generated during mouseDown events (mouse drags in the data table).
The uitable passes this stream of cell indices (but not cell values) via the eventdata
structure to the data_table_CellSelectionCallback callback. The callback's code
reads the indices from the Indices member of the eventdata.
When the callback runs (for each new value of eventdata), it turns the event data into a
set of rows:
selection = eventdata.Indices(:,1);
selection = unique(selection);
The event data contains a sequence of [row, column] indices for each table cell
currently selected, one cell per line. The preceding code trims the list of indices to a list
of selected rows, removing column indices. Then it calls the unique MATLAB function to
eliminate any duplicate row entries, which arise whenever you select both columns. For
example, suppose eventdata.Indices contains:
1 1
2 1
3 1
3 2
4 2
This indicates that you selected the first three rows in column one (Year) and rows three
and four in column two (Sunspots) by holding down the Ctrl key when selecting numbers
in the second column. The preceding code transforms the indices into this vector:
1
2
3
4
This vector enumerates all the selected rows. If the selection includes less than 11 rows
(as it does here) the callback returns, because computing statistics for a sample that
small is not useful.
When the selection contains 11 or more rows, the data table is obtained, the selection is
cached in the handles structure, and the refreshDisplays function is called to update
the selection statistics and plot, passing the portion of the table that you selected:
table = get(hObject,'Data');
handles.currSelection = selection;
guidata(hObject,handles)
refreshDisplays(table(selection,:), handles, 2)](https://image.slidesharecdn.com/matlab-buildgui-150310171915-conversion-gate01/85/Matlab-GUI-285-320.jpg)


![9 Examples of GUIDE GUIs
9-44
• Make the Tag for the menu plot_axes2.
• Create a menu item under it and make its Label Open plot in new window
and assign it a Tag of plot_ax2.
7 Click OK to save your menus and exit the Menu Editor.
For more information about using the Menu Editor, see “Create Menus for GUIDE GUIs”
on page 6-91.
Attach Context Menus to Axes
Add the context menus you just created to the axes:
1 In the GUIDE Layout Editor, double-click axes1 (the top axes in the upper right
corner) to open it in the Property Inspector.
2 Click the right-hand column next to UIContextMenu to see a drop-down list.
3 From the list, select plot_axes1.
Perform the same steps for axes2, but select plot_axes2 as its UIContextMenu.
Code Context Menu Callbacks
The two context menu items perform the same actions, but create different objects. Each
has its own callback. Here is the plot_ax1_Callback callback for axes1:
function plot_ax1_Callback(hObject, eventdata, handles)
% hObject handle to plot_ax1 (see GCBO)
% eventdata reserved - to be defined in a future version of MATLAB
% handles structure with handles and user data (see GUIDATA)
%
% Displays contents of axes1 at larger size in a new figure
% Create a figure to receive this axes' data
axes1fig = figure;
% Copy the axes and size it to the figure
axes1copy = copyobj(handles.axes1,axes1fig);
set(axes1copy,'Units','Normalized',...
'Position',[.05,.20,.90,.60])
% Assemble a title for this new figure
str = [get(handles.uipanel3,'Title') ' for ' ...
get(handles.poplabel,'String')];
title(str,'Fontweight','bold')
% Save handles to new fig and axes in case](https://image.slidesharecdn.com/matlab-buildgui-150310171915-conversion-gate01/85/Matlab-GUI-288-320.jpg)


![Interactive List Box in a GUIDE GUI
9-49
• Displays the current folder in the text box by setting its String property to the
output of the pwd command.
The load_listbox function is called by the opening function, as well as by the list box
callback.
function load_listbox(dir_path, handles)
cd (dir_path)
dir_struct = dir(dir_path);
[sorted_names,sorted_index] = sortrows({dir_struct.name}');
handles.file_names = sorted_names;
handles.is_dir = [dir_struct.isdir];
handles.sorted_index = sorted_index;
guidata(handles.figure1,handles)
set(handles.listbox1,'String',handles.file_names,...
'Value',1)
set(handles.text1,'String',pwd)
Code List Box Behavior
The listbox1_Callback code handles only one case: a double-click of an item. Double
clicking is the standard way to open a file from a list box. If the selected item is a file, it
is passed to the open command; if it is a folder, the GUI changes to that folder and lists
its contents.
• Define how to open file types
The open command can handle a number of different file types, however, the callback
treats FIG-files differently. Instead of opening the FIG-file as a standalone figure, it
opens it with guide for editing.
• Determine which item was selected
Since a single click of an item also invokes the list box callback, you must query the
figure SelectionType property to determine when you have performed a double
click. A double-click of an item sets the SelectionType property to open.
All the items in the list box are referenced by an index from 1 to n. A value of 1 refers
to the first item, and a value of n is the index of the nth item. The software saves this
index in the list box Value property.
The callback uses this index to get the name of the selected item from the list of items
contained in the String property.](https://image.slidesharecdn.com/matlab-buildgui-150310171915-conversion-gate01/85/Matlab-GUI-293-320.jpg)
![9 Examples of GUIDE GUIs
9-50
• Determine whether the selected item is a file or directory
The load_listbox function uses the dir command to obtain a list of values that
indicate whether an item is a file or folder. These values (1 for folder, 0 for file)
are saved in the handles structure. The list box callback queries these values to
determine if current selection is a file or folder and takes the following action:
• If the selection is a folder — change to the folder (cd) and call load_listbox
again to populate the list box with the contents of the new folder.
• If the selection is a file — get the file extension (fileparts) to determine if it is a
FIG-file, which is opened with guide. All other file types are passed to open.
The open statement is called within a try, catch block to capture errors in an error
dialog box (errordlg), instead of returning to the command line.
You can extend the file types that the open command recognizes to include any file
having a three-character extension. Do this by creating a MATLAB code file with the
name openxyz.m. xyz is the file extension for the type of files to be handled. Do not,
however, take this approach for opening FIG-files, because openfig.m is a MATLAB
function which is needed to open GUIs. For more information, see open and openfig.
listbox1_Callback code
function listbox1_Callback(hObject, eventdata, handles)
get(handles.figure1,'SelectionType');
% If double click
if strcmp(get(handles.figure1,'SelectionType'),'open')
index_selected = get(handles.listbox1,'Value');
file_list = get(handles.listbox1,'String');
% Item selected in list box
filename = file_list{index_selected};
% If folder
if handles.is_dir(handles.sorted_index(index_selected))
cd (filename)
% Load list box with new folder.
load_listbox(pwd,handles)
else
[path,name,ext] = fileparts(filename);
switch ext
case '.fig'
% Open FIG-file with guide command.
guide (filename)
otherwise](https://image.slidesharecdn.com/matlab-buildgui-150310171915-conversion-gate01/85/Matlab-GUI-294-320.jpg)


![Plot Workspace Variables in a GUIDE GUI
9-55
• Returns two string variables, if there are two items selected. Otherwise
get_var_names displays an error dialog box stating that you must select two
variables.
Here is the code for get_var_names:
function [var1,var2] = get_var_names(handles)
list_entries = get(handles.listbox1,'String');
index_selected = get(handles.listbox1,'Value');
if length(index_selected) ~= 2
errordlg('You must select two variables',...
'Incorrect Selection','modal')
else
var1 = list_entries{index_selected(1)};
var2 = list_entries{index_selected(2)};
end
Callbacks for the Plotting Buttons
The callbacks for the plotting buttons call get_var_names to get the names of the
variables to plot and then call evalin to execute the plot commands in the base
workspace.
For example, here is the callback for the plot function:
function plot_button_Callback(hObject, eventdata, handles)
[x,y] = get_var_names(handles);
evalin('base',['plot(' x ',' y ')'])
The command to evaluate is created by concatenating the strings and variables, and
looks like this:
try
evalin('base',['semilogx(',x,',',y,')'])
catch ex
errordlg(...
ex.getReport('basic'),'Error generating semilogx plot','modal')
end
The try/catch block handles errors resulting from attempting to graph inappropriate
data. When evaluated, the result of the command is:
plot(x,y)](https://image.slidesharecdn.com/matlab-buildgui-150310171915-conversion-gate01/85/Matlab-GUI-299-320.jpg)


![9 Examples of GUIDE GUIs
9-60
• GUI allows only one instance to run
Open the Simulink Block Diagrams
This example is designed to work with the f14 Simulink model. Because the GUI
sets parameters and runs the simulation, the f14 model must be open when the
GUI is displayed. When the GUI runs, the model_open local function executes. The
model_open function performs these tasks:
• Determines if the model is open (find_system).
• Opens the block diagram for the model and the subsystem where the parameters are
being set, if not open already (open_system).
• Changes the size of the controller Gain block so it can display the gain value
(set_param).
• Brings the GUI forward so it is displayed on top of the Simulink diagrams (figure).
• Sets the block parameters to match the current settings in the GUI.
Here is the code for model_open:
function model_open(handles)
if isempty(find_system('Name','f14')),
open_system('f14'); open_system('f14/Controller')
set_param('f14/Controller/Gain','Position',[275 14 340 56])
figure(handles.F14ControllerEditor)
set_param('f14/Controller Gain','Gain',...
get(handles.KfCurrentValue,'String'))
set_param(...
'f14/Controller/Proportional plus integral compensator',...
'Numerator',...
get(handles.KiCurrentValue,'String'))
end
Program the Slider and Edit Text Components
Each slider is coupled to an edit text component to accomplish these tasks:
• Display the current value of the slider in the edit text box.
• Update the slider when you enter a value into the edit text box.
• Update the appropriate model parameters when you interact with the slider and edit
text box.](https://image.slidesharecdn.com/matlab-buildgui-150310171915-conversion-gate01/85/Matlab-GUI-304-320.jpg)


![GUI for Setting Simulink Model Parameters
9-63
• Stores the structure in the handles structure.
• Updates the list box String to list the most recent run.
Here is the Simulate and store results button callback:
function SimulateButton_Callback(hObject, eventdata, handles)
[timeVector,stateVector,outputVector] = sim('f14');
% Retrieve old results data structure
if isfield(handles,'ResultsData') &
~isempty(handles.ResultsData)
ResultsData = handles.ResultsData;
% Determine the maximum run number currently used.
maxNum = ResultsData(length(ResultsData)).RunNumber;
ResultNum = maxNum+1;
else % Set up the results data structure
ResultsData = struct('RunName',[],'RunNumber',[],...
'KiValue',[],'KfValue',[],'timeVector',[],...
'outputVector',[]);
ResultNum = 1;
end
if isequal(ResultNum,1),
% Enable the Plot and Remove buttons
set([handles.RemoveButton,handles.PlotButton],'Enable','on')
end
% Get Ki and Kf values to store with the data and put in the
results list.
Ki = get(handles.KiValueSlider,'Value');
Kf = get(handles.KfValueSlider,'Value');
ResultsData(ResultNum).RunName = ['Run',num2str(ResultNum)];
ResultsData(ResultNum).RunNumber = ResultNum;
ResultsData(ResultNum).KiValue = Ki;
ResultsData(ResultNum).KfValue = Kf;
ResultsData(ResultNum).timeVector = timeVector;
ResultsData(ResultNum).outputVector = outputVector;
% Build the new results list string for the listbox
ResultsStr = get(handles.ResultsList,'String');
if isequal(ResultNum,1)
ResultsStr = {['Run1',num2str(Kf),' ',num2str(Ki)]};
else
ResultsStr = [ResultsStr;...
{['Run',num2str(ResultNum),' ',num2str(Kf),' ', ...
num2str(Ki)]}];
end
set(handles.ResultsList,'String',ResultsStr);](https://image.slidesharecdn.com/matlab-buildgui-150310171915-conversion-gate01/85/Matlab-GUI-307-320.jpg)
![9 Examples of GUIDE GUIs
9-64
% Store the new ResultsData
handles.ResultsData = ResultsData;
guidata(hObject, handles)
Remove Results from List Box
The GUI Remove button callback deletes any selected item from the Results list list
box. It also deletes the corresponding run data from the handles structure. When you
click the Remove button, the callback performs these tasks:
• Determines which list box items are selected when you click the Remove button and
remove those items from the list box String property by setting each item to the
empty matrix [].
• Removes the deleted data from the handles structure.
• Displays the string <empty> and disables the Remove and Plot buttons (using the
Enable property), if all the items in the list box are removed.
• Save the changes to the handles structure (guidata).
Here is the Remove button callback:
function RemoveButton_Callback(hObject, eventdata, handles)
currentVal = get(handles.ResultsList,'Value');
resultsStr = get(handles.ResultsList,'String');
numResults = size(resultsStr,1);
% Remove the data and list entry for the selected value
resultsStr(currentVal) =[];
handles.ResultsData(currentVal)=[];
% If there are no other entries, disable the Remove and Plot
button
% and change the list string to <empty>
if isequal(numResults,length(currentVal)),
resultsStr = {'<empty>'};
currentVal = 1;
set([handles.RemoveButton,handles.PlotButton],'Enable','off')
end
% Ensure that list box Value is valid, then reset Value and String
currentVal = min(currentVal,size(resultsStr,1));
set(handles.ResultsList,'Value',currentVal,'String',resultsStr)
% Store the new ResultsData
guidata(hObject, handles)
Plot Results Data
The GUI Plot button callback creates a plot of the run data and adds a legend. The data
to plot is passed to the callback in the handles structure, which also contains the gain](https://image.slidesharecdn.com/matlab-buildgui-150310171915-conversion-gate01/85/Matlab-GUI-308-320.jpg)

![9 Examples of GUIDE GUIs
9-66
legendStr{ctVal} = ...
[handles.ResultsData(currentVal(ctVal)).RunName,'; Kf=',...
num2str(handles.ResultsData(currentVal(ctVal)).KfValue),...
'; Ki=', ...
num2str(handles.ResultsData(currentVal(ctVal)).KiValue)];
end
% If necessary, create the plot figure and store in handles
% structure
if ~isfield(handles,'PlotFigure') ||...
~ishandle(handles.PlotFigure),
handles.PlotFigure = ...
figure('Name','F14 Simulation Output',...
'Visible','off','NumberTitle','off',...
'HandleVisibility','off','IntegerHandle','off');
handles.PlotAxes = axes('Parent',handles.PlotFigure);
guidata(hObject, handles)
end
% Plot data
pHandles = plot(PlotData{:},'Parent',handles.PlotAxes);
% Add a legend, and bring figure to the front
legend(pHandles(1:2:end),legendStr{:})
% Make the figure visible and bring it forward
figure(handles.PlotFigure)
The GUI Help Button
The GUI Help button callback displays an HTML file in the MATLAB Help browser. It
uses two commands:
• The which command returns the full path to the file when it is on the MATLAB path
• The web command displays the file in the Help browser.
This is the Help button callback.
function HelpButton_Callback(hObject, eventdata, handles)
HelpPath = which('f14ex_help.html');
web(HelpPath);
You can also display the help document in a Web browser or load an external URL. For a
description of these options, see the documentation for the web function.
Close the GUI
The GUI Close button callback closes the plot figure, if one exists and then closes the
GUI. The handle of the plot figure and the GUI figure are available from the handles
structure. The callback executes two steps:](https://image.slidesharecdn.com/matlab-buildgui-150310171915-conversion-gate01/85/Matlab-GUI-310-320.jpg)


![Animation with Slider Controls in a GUIDE GUI
9-73
object that handles updating the graphics. This example does not explore the technique,
but you can find information about programming timers in “Use a MATLAB Timer
Object”.
Make a Movie of the Animation
Selecting the Make movie check box before clicking Spin causes the application to
record each frame displayed in the while loop of the spinstopbutton_Callback
routine. When you select this check box, the animation runs more slowly because the
following block of code executes:
filming = handles.movie;
...
if ishandle(handles.axes1) && filming > 0 && filming < 361
globeframes(filming) = getframe; % Capture axes in movie
filming = filming + 1;
end
Because it is the value of a check box, handles.movie is either 0 or 1. When it is 1, a
copy (filming) of it keeps a count of the number of frames saved in the globeframes
matrix (which contains the axes CData and colormap for each frame). You cannot toggle
saving the movie on or off while the globe is spinning, because the while loop code does
not monitor the state of the Make movie check box.
The ishandle test prevents the getframe from generating an error if the axes is
destroyed before the while loop finishes.
When the while loop terminates, the callback prints the results of capturing movie
frames to the Command Window and writes the movie to a MAT-file:
if (filming)
filename = sprintf('globe%i.mat',filming-1);
disp(['Writing movie to file ' filename]);
save (filename, 'globeframes')
end
Note: Before creating a movie file with the GUI, make sure that you have write
permission for the current folder.
The file name of the movie ends with the number of frames it contains. Supposing the
movie's file name is globe360.mat, you play it with:](https://image.slidesharecdn.com/matlab-buildgui-150310171915-conversion-gate01/85/Matlab-GUI-317-320.jpg)

![Animation with Slider Controls in a GUIDE GUI
9-75
• “Light the Globe and Shift the Light Source” on page 9-77
Create the Graphic Objects
The axes1_CreateFcn function initializes the axes, the two objects displayed in it, and
two hgtransform objects that affect the rotation of the globe:
• The globe is a surfaceplot generated by surface.
• The geographic graticule (lines of latitude and longitude), also a surfaceplot object,
generated by a call to mesh.
Data for these two objects are rectangular x-y-z grids generated by the sphere function.
The globe's grid is 50-by-50 and the graticule grid is 8-by-15. (Every other row of the 15-
by-15 grid returned by sphere is removed to equalize its North-South and East-West
spans when viewed on the globe.)
The axes x-, y-, and z-limits are set to [-1.02 1.02]. Because the graphic objects are
unit spheres, this leaves a little space around them while constraining all three axes to
remain the same relative and absolute size. The graticule grid is also enlarged by 2%,
which is barely enough to prevent the opaque texture-mapped surface of the globe from
obscuring the graticule. If you watch carefully, you can sometimes see missing pieces of
graticule edges as the globe spins.
Texture and Color the Globe
Code in the axes1_CreateFcn sets the CData for the globe to the 180-by-360 (one
degree) topo terrain grid by setting its FaceColor property to 'texturemap'. You
can use any image or grid to texture a surface. Specify surface properties as a struct
containing one element per property that you must set, as follows:
props.FaceColor= 'texture';
props.EdgeColor = 'none';
props.FaceLighting = 'gouraud';
props.Cdata = topo;
props.Parent = hgrotate;
hsurf = surface(x,y,z,props);
colormap(cmap)
Tip You can create MATLAB structs that contain values for sets of parameters and
provide them to functions instead of parameter-value pairs, and save the structs to MAT-
files for later use.](https://image.slidesharecdn.com/matlab-buildgui-150310171915-conversion-gate01/85/Matlab-GUI-319-320.jpg)
![9 Examples of GUIDE GUIs
9-76
The surface function plots the surface into the axes. Setting the Parent of the surface
to hgrotate puts the surface object under the control of the hgtransform that spins
the globe (see the illustration in “Orient the Globe and Graticule” on page 9-76). By
setting EdgeColor to 'none', the globe displays face colors only, with no grid lines
(which, by default, display in black). The colormap function sets the colormap for the
surface to the 64-by-3 colormap cmap defined in the code, which is appropriate for terrain
display. While you can use more colors, 64 is sufficient, given the relative coarseness of
the texture map (1-by-1 degree resolution).
Plot the Graticule
Unlike the globe grid, the graticule grid displays with no face colors and gray edge color.
(You turn the graticule grid on and off by clicking the Show grid button.) Like the
terrain map, it is a surfaceplot object; however, the mesh function creates it, rather than
the surface function, as follows:
hmesh = mesh(gx,gy,gz,'parent',hgrotate,...
'FaceColor','none','EdgeColor',[.5 .5 .5]);
set(hmesh,'Visible','off')
The state of the Show grid button is initially off, causing the graticule not to display.
Show grid toggles the mesh object's Visible property.
As mentioned earlier, enlarging the graticule by 2 percent before plotting prevents the
terrain surface from obscuring it.
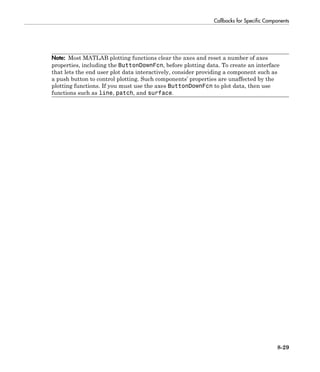
Orient the Globe and Graticule
The globe and graticule rotate as if they were one object, under the control of a pair of
hgtransform objects. Within the figure, the HG objects are set up in this hierarchy.](https://image.slidesharecdn.com/matlab-buildgui-150310171915-conversion-gate01/85/Matlab-GUI-320-320.jpg)


![10 Lay Out a Programmatic GUI
10-4
Create Figures for Programmatic GUIs
In MATLAB software, a GUI is a figure. Before you add components to it, create the
figure explicitly and obtain a handle for it. In the initialization section of your file, use a
statement such as the following to create the figure:
fh = figure;
where fh is the figure handle.
Note If you create a component when there is no figure, MATLAB creates a figure
automatically but does not return the figure handle.
When you create the figure, you can also specify properties for the figure. The most
commonly used figure properties are shown in the following table:
Property Values Description
MenuBar figure, none. Default is figure. Display or hide the MATLAB
standard menu bar menus. If none
and there are no user-created
menus, the menu bar itself is
removed.
Name String Title displayed in the figure
window. If NumberTitle is on,
this string is appended to the
figure number.
NumberTitle on, off. Default is on. Determines whether the string
'Figure n' (where n is the figure
number) is prefixed to the figure
window title specified by Name.
Position 4-element vector: [distance from
left, distance from bottom, width,
height].
Size of the GUI figure and its
location relative to the lower-left
corner of the screen.
Resize on, off. Default is on. Determines if the user can resize
the figure window with the mouse.
Toolbar auto, none, figure. Default is
auto.
Display or hide the default figure
toolbar.](https://image.slidesharecdn.com/matlab-buildgui-150310171915-conversion-gate01/85/Matlab-GUI-334-320.jpg)
![Create Figures for Programmatic GUIs
10-5
Property Values Description
• none — do not display the
figure toolbar.
• auto — display the figure
toolbar, but remove it if a user
interface control (uicontrol) is
added to the figure.
• figure — display the figure
toolbar.
Units pixels, centimeters,
characters, inches,
normalized, points, Default is
pixels.
Units of measurement used to
interpret position vector
Visible on, off. Default is on. Determines whether a figure is
displayed on the screen.
For a complete list of properties and for more information about the properties listed in
the table, see Figure Properties.
The following statement names the figure My GUI, positions the figure on the screen,
and makes the GUI invisible so that the user cannot see the components as they are
added or initialized. All other properties assume their defaults.
f = figure('Visible','off','Name','My GUI',...
'Position',[360,500,450,285]);
Related Examples
• “Layout a GUI Programmatically”
• “Add Components to a Programmatic GUI” on page 10-9
• “Create Menus for Programmatic GUIs” on page 10-75
• “Create Toolbars for Programmatic GUIs” on page 10-88](https://image.slidesharecdn.com/matlab-buildgui-150310171915-conversion-gate01/85/Matlab-GUI-335-320.jpg)


![10 Lay Out a Programmatic GUI
10-10
• “Push Button” on page 10-22
• “Radio Button” on page 10-23
• “Slider” on page 10-25
• “Static Text” on page 10-26
• “Toggle Button” on page 10-27
Commonly Used Properties
The most commonly used properties needed to describe a user interface control are shown
in the following table:
Property Values Description
Max Scalar. Default is 1. Maximum value. Interpretation
depends on the Style property.
Min Scalar. Default is 0. Minimum value. Interpretation
depends on the Style property.
Position 4-element vector: [distance
from left, distance from bottom,
width, height]. Default is [20, 20,
60, 20].
Size of the component and its
location relative to its parent.
String String. Can be a cell array or
character array or strings.
Component label. For list boxes
and pop-up menus it is a list of the
items. To display the & character
in a label, use two & characters
in the string. The words remove,
default, and factory (case
sensitive) are reserved. To use
one of these as a label, prepend
a backslash () to the string. For
example, remove yields remove.
Style pushbutton, togglebutton,
radiobutton, checkbox,
edit, text, slider, listbox,
popupmenu. Default is
pushbutton.
Type of user interface control
object.
TooltipString String Text of the tooltip associated with
the push tool or toggle tool.](https://image.slidesharecdn.com/matlab-buildgui-150310171915-conversion-gate01/85/Matlab-GUI-340-320.jpg)
![Add Components to a Programmatic GUI
10-11
Property Values Description
Units pixels, centimeters,
characters, inches,
normalized, points, Default is
pixels.
Units of measurement used to
interpret position vector
Value Scalar or vector Value of the component.
Interpretation depends on the
Style property.
For a complete list of properties and for more information about the properties listed in
the table, see Uicontrol Properties.
Check Box
The following statement creates a check box with handle cbh.
cbh = uicontrol(fh,'Style','checkbox',...
'String','Display file extension',...
'Value',1,'Position',[30 20 130 20]);
The first argument, fh, specifies the handle of the parent figure. You can also specify the
parent as a panel or button group. See “Panel” on page 10-31 and “Button Group” on
page 10-33 for more information.
The Style property, checkbox, specifies the user interface control as a check box.
The String property labels the check box as Display file extension. The check box
accommodates only a single line of text. If you specify a component width that is too](https://image.slidesharecdn.com/matlab-buildgui-150310171915-conversion-gate01/85/Matlab-GUI-341-320.jpg)
![10 Lay Out a Programmatic GUI
10-12
small to accommodate the specified String, MATLAB software truncates the string with
an ellipsis.
The Value property specifies whether the box is checked. Set Value to the value of the
Max property (default is 1) to create the component with the box checked. Set Value to
Min (default is 0) to leave the box unchecked. Correspondingly, when the user clicks the
check box, MATLAB software sets Value to Max when the user checks the box and to Min
when the user unchecks it.
The Position property specifies the location and size of the list box. In this example, the
list box is 130 pixels wide and 20 high. It is positioned 30 pixels from the left of the figure
and 20 pixels from the bottom. The statement assumes the default value of the Units
property, which is pixels.
Note: You can also use an image as a label. See “Add an Image to a Push Button” on page
10-23 for more information.
Edit Text
The following statement creates an edit text component with handle eth:
eth = uicontrol(fh,'Style','edit',...
'String','Enter your name here.',...
'Position',[30 50 130 20]);](https://image.slidesharecdn.com/matlab-buildgui-150310171915-conversion-gate01/85/Matlab-GUI-342-320.jpg)
![Add Components to a Programmatic GUI
10-13
The first argument, fh, specifies the handle of the parent figure. You can also specify the
parent as a panel or button group. See “Panel” on page 10-31 and “Button Group” on
page 10-33 for more information.
The Style property, edit, specifies the user interface control as an edit text component.
The String property defines the text that appears in the component.
To enable multiple-line input, Max - Min must be greater than 1, as in the following
statement. MATLAB software wraps the string if necessary.
eth = uicontrol(fh,'Style','edit',...
'String','Enter your name and address here.',...
'Max',2,'Min',0,...
'Position',[30 20 130 80]);](https://image.slidesharecdn.com/matlab-buildgui-150310171915-conversion-gate01/85/Matlab-GUI-343-320.jpg)
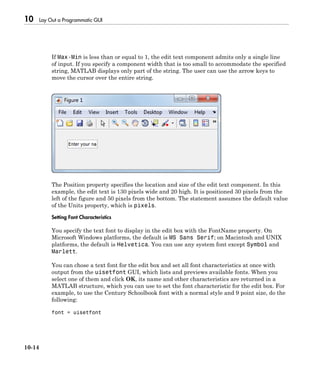

![10 Lay Out a Programmatic GUI
10-16
Instead of designating a font yourself, you could provide a push button or context menu
in your GUI that allows users to select fonts themselves via the uisetfont GUI. The
callback for the feature could be
font = uisetfont;
set(eth, font)
where eth is the handle for the edit box whose font the user is setting. You can store the
handle in the figure's application data and retrieve it with getappdata.
List Box
The following statement creates a list box with handle lbh:
lbh = uicontrol(fh,'Style','listbox',...
'String',{'one','two','three','four'},...
'Value',1,'Position',[30 20 130 80]);
The first argument, fh, specifies the handle of the parent figure. You can also specify the
parent as a panel or button group. See “Panel” on page 10-31 and “Button Group” on
page 10-33 for more information.
The Style property, listbox, specifies the user interface control as a list box.
The String property defines the list items. You can specify the items in any of the formats
shown in the following table.](https://image.slidesharecdn.com/matlab-buildgui-150310171915-conversion-gate01/85/Matlab-GUI-346-320.jpg)
![Add Components to a Programmatic GUI
10-17
String Property Format Example
Cell array of strings {'one' 'two' 'three'}
Padded string matrix ['one ';'two ';'three']
String vector separated by
vertical slash (|) characters
['one|two|three']
If you specify a component width that is too small to accommodate one or more of the
specified strings, MATLAB software truncates those strings with an ellipsis.
The Value property specifies the item or items that are selected when the component
is created. To select a single item, set Value to a scalar that indicates the index of the
selected list item, where 1 corresponds to the first item in the list.
To select more than one item, set Value to a vector of indices of the selected items. To
enable selection of more than one item, Max - Min must be greater than 1, as in the
following statement:
lbh = uicontrol(fh,'Style','listbox',...
'String',{'one','two','three','four'},...
'Max',2,'Min',0,'Value',[1 3],...
'Position',[30 20 130 80]);
If you want no initial selection:](https://image.slidesharecdn.com/matlab-buildgui-150310171915-conversion-gate01/85/Matlab-GUI-347-320.jpg)
![10 Lay Out a Programmatic GUI
10-18
1 Set the Max and Min properties to enable multiple selection
2 Set the Value property to an empty matrix [].
If the list box is not large enough to display all list entries, you can set the ListBoxTop
property to the index of the item you want to appear at the top when the component is
created.
The Position property specifies the location and size of the list box. In this example, the
list box is 130 pixels wide and 80 high. It is positioned 30 pixels from the left of the figure
and 20 pixels from the bottom. The statement assumes the default value of the Units
property, which is pixels.
The list box does not provide for a label. Use a static text component to label the list box.
Pop-Up Menu
The following statement creates a pop-up menu (also known as a drop-down menu or
combo box) with handle pmh:
pmh = uicontrol(fh,'Style','popupmenu',...
'String',{'one','two','three','four'},...
'Value',1,'Position',[30 80 130 20]);](https://image.slidesharecdn.com/matlab-buildgui-150310171915-conversion-gate01/85/Matlab-GUI-348-320.jpg)
![Add Components to a Programmatic GUI
10-19
The first argument, fh, specifies the handle of the parent figure. You can also specify the
parent as a panel or button group. See “Panel” on page 10-31 and “Button Group” on
page 10-33 for more information.
The Style property, popupmenu, specifies the user interface control as a pop-up menu.
The String property defines the menu items. You can specify the items in any of the
formats shown in the following table.
String Property Format Example
Cell array of strings {'one' 'two' 'three'}
Padded string matrix ['one ';'two ';'three']
String vector separated by
vertical slash (|) characters
['one|two|three']
If you specify a component width that is too small to accommodate one or more of the
specified strings, MATLAB software truncates those strings with an ellipsis.
The Value property specifies the index of the item that is selected when the component
is created. Set Value to a scalar that indicates the index of the selected menu item,
where 1 corresponds to the first item in the list. In the statement, if Value is 2, the menu
looks like this when it is created:](https://image.slidesharecdn.com/matlab-buildgui-150310171915-conversion-gate01/85/Matlab-GUI-349-320.jpg)


![10 Lay Out a Programmatic GUI
10-22
Push Button
The following statement creates a push button with handle pbh:
pbh = uicontrol(fh,'Style','pushbutton','String','Button 1',...
'Position',[50 20 60 40]);
The first argument, fh, specifies the handle of the parent figure. You can also specify the
parent as a panel or button group. See “Panel” on page 10-31 and “Button Group” on
page 10-33 for more information.
The Style property, pushbutton, specifies the user interface control as a push button.
Because pushbutton is the default style, you can omit the 'Style' property from the
statement.
The String property labels the push button as Button 1. The push button allows only
a single line of text. If you specify more than one line, only the first line is shown. If
you specify a component width that is too small to accommodate the specified String,
MATLAB software truncates the string with an ellipsis.](https://image.slidesharecdn.com/matlab-buildgui-150310171915-conversion-gate01/85/Matlab-GUI-352-320.jpg)
![Add Components to a Programmatic GUI
10-23
The Position property specifies the location and size of the push button. In this example,
the push button is 60 pixels wide and 40 high. It is positioned 50 pixels from the left of
the figure and 20 pixels from the bottom. This statement assumes the default value of
the Units property, which is pixels.
Add an Image to a Push Button
To add an image to a push button, assign the button's CData property an m-by-n-by-3
array of RGB values that defines a “truecolor image”. For example, the array img defines
16-by-64 truecolor image using random values between 0 and 1 (generated by rand).
img(:,:,1) = rand(16,64);
img(:,:,2) = rand(16,64);
img(:,:,3) = rand(16,64);
pbh = uicontrol(fh,'Style','pushbutton',...
'Position',[50 20 100 45],...
'CData',img);
Note See ind2rgb for information on converting a matrix X and corresponding colormap,
i.e., an (X, MAP) image, to RGB (truecolor) format.
Radio Button
The following statement creates a radio button with handle rbh:
rbh = uicontrol(fh,'Style','radiobutton',...
'String','Indent nested functions.',...
'Value',1,'Position',[30 20 150 20]);](https://image.slidesharecdn.com/matlab-buildgui-150310171915-conversion-gate01/85/Matlab-GUI-353-320.jpg)

![Add Components to a Programmatic GUI
10-25
Slider
The following statement creates a slider with handle sh:
sh = uicontrol(fh,'Style','slider',...
'Max',100,'Min',0,'Value',25,...
'SliderStep',[0.05 0.2],...
'Position',[30 20 150 30]);
• The first argument, fh, specifies the handle of the parent figure. You can also specify
the parent as a panel or button group. See “Panel” on page 10-31 and “Button
Group” on page 10-33 for more information.
• The Style property, slider, specifies the user interface control as a slider.
• Specify the range of the slider by setting its Min property to the minimum value of
the slider and its Max property to the maximum value. The Min property must be less
than Max.
• Specify the value indicated by the slider when it is created by setting the Value
property to the appropriate number. This number must be less than or equal to Max
and greater than or equal to Min. If you specify Value outside the specified range, the
slider is not displayed.
• The slider Value changes by a small amount when a user clicks the arrow button,
and changes by a larger amount when the user clicks the trough (also called
the channel). Control how the slider responds to these actions by setting the
SliderStep property. Specify SliderStep as a two-element vector, [minor_step
major_step], where minor_step is less than or equal to major_step. Because](https://image.slidesharecdn.com/matlab-buildgui-150310171915-conversion-gate01/85/Matlab-GUI-355-320.jpg)
![10 Lay Out a Programmatic GUI
10-26
specifying very small values can cause unpredictable slider behavior, make both
minor_step and major_step greater than 1e-6. Set major_step to the proportion
of the range that clicking the trough moves the slider thumb. Setting it to 1 or higher
causes the thumb to move to Max or Min when the trough is clicked.
As major_step increases, the thumb grows longer. When major_step is 1, the
thumb is half as long as the trough. When major_step is greater than 1, the
thumb continues to grow, slowly approaching the full length of the trough. When a
slider serves as a scroll bar, you can uses this behavior to indicate how much of the
document is currently visible by changing the value of major_step.
• If you want to set the location or size of the component to an exact value, then modify
its Position property.
The example provides a 5 percent minor step and a 20 percent major step. The default
major_step and minor_step, [0.01 0.10], provides a 1 percent minor step and a 10
percent major step.
The Position property specifies the location and size of the slider. In this example, the
slider is 150 pixels wide and 30 high. It is positioned 30 pixels from the left of the figure
and 20 pixels from the bottom. The statement assumes the default value of the Units
property, which is pixels.
Note: On Mac platforms, the height of a horizontal slider is constrained. If the height you
set in the position vector exceeds this constraint, the displayed height of the slider is the
maximum allowed. The height element of the position vector is not changed.
The slider component provides no text description or data entry capability. Use a “Static
Text” on page 6-34 component to label the slider. Use an “Edit Text” on page 6-32
component to enable a user to input a value to apply to the slider.
Static Text
The following statement creates a static text component with handle sth:](https://image.slidesharecdn.com/matlab-buildgui-150310171915-conversion-gate01/85/Matlab-GUI-356-320.jpg)
![Add Components to a Programmatic GUI
10-27
sth = uicontrol(fh,'Style','text',...
'String','Select a data set.',...
'Position',[30 50 130 30]);
The first argument, fh, specifies the handle of the parent figure. You can also specify the
parent as a panel or button group. See “Panel” on page 10-31 and “Button Group” on
page 10-33 for more information.
The Style property, text, specifies the user interface control as a static text component.
The String property defines the text that appears in the component. If you specify
a component width that is too small to accommodate the specified String, MATLAB
software wraps the string.
The Position property specifies the location and size of the static text component. In this
example, the static text is 130 pixels wide and 20 high. It is positioned 30 pixels from the
left of the figure and 50 pixels from the bottom. The statement assumes the default value
of the Units property, which is pixels.
Toggle Button
The following statement creates a toggle button with handle tbh:](https://image.slidesharecdn.com/matlab-buildgui-150310171915-conversion-gate01/85/Matlab-GUI-357-320.jpg)
![10 Lay Out a Programmatic GUI
10-28
tbh = uicontrol(fh,'Style','togglebutton',...
'String','Left/Right Tile',...
'Value',0,'Position',[30 20 100 30]);
The first argument, fh, specifies the handle of the parent figure. You can also specify the
parent as a panel or button group. Use a button group to manage exclusive selection of
radio buttons and toggle buttons. See “Panel” on page 10-31 and “Button Group” on
page 10-33 for more information.
The Style property, togglebutton, specifies the user interface control as a toggle
button.
The String property labels the toggle button as Left/Right Tile. The toggle button
allows only a single line of text. If you specify more than one line, only the first line is
shown. If you specify a component width that is too small to accommodate the specified
String, MATLAB software truncates the string with an ellipsis.
The Value property specifies whether the toggle button is selected when the component is
created. Set Value to the value of the Max property (default is 1) to create the component
with the toggle button selected (depressed). Set Value to Min (default is 0) to leave the
toggle button unselected (raised). The following figure shows the toggle button in the
depressed position.](https://image.slidesharecdn.com/matlab-buildgui-150310171915-conversion-gate01/85/Matlab-GUI-358-320.jpg)

![10 Lay Out a Programmatic GUI
10-30
A syntax for button groups is
bgh = uibuttongroup('PropertyName',PropertyValue,...)
where bgh is the handle of the resulting button group. For button groups, you must use
the Parent property to specify the component parent. See the uibuttongroup reference
page for other valid syntaxes.
For both panels and button groups, if you do not specify a parent, the component parent
is the current figure as specified by the root CurrentFigure property.
Subsequent topics describe commonly used properties of panels and button groups and
offer a simple example for each component.
• “Commonly Used Properties” on page 10-30
• “Panel” on page 10-31
• “Button Group” on page 10-33
Commonly Used Properties
The most commonly used properties needed to describe a panel or button group are
shown in the following table:
Property Values Description
Parent Handle Handle of the component's parent
figure, panel, or button group.
Position 4-element vector: [distance
from left, distance from
bottom, width, height].
Default is [0, 0, 1, 1].
Size of the component and its location
relative to its parent.
Title String Component label. To display the
& character in a label, use two &
characters in the string. The words
remove, default, and factory (case
sensitive) are reserved. To use one of
these as a label, prepend a backslash
() to the string. For example, remove
yields remove.](https://image.slidesharecdn.com/matlab-buildgui-150310171915-conversion-gate01/85/Matlab-GUI-360-320.jpg)
![Add Components to a Programmatic GUI
10-31
Property Values Description
TitlePosition lefttop, centertop,
righttop, leftbottom,
centerbottom,
rightbottom. Default is
lefttop.
Location of title string in relation to the
panel or button group.
Units normalized,
centimeters,
characters, inches,
pixels, points. Default
is normalized.
Units of measurement used to interpret
position vector
For a complete list of properties and for more information about the properties listed
in the table, see Uipanel Properties and Uibuttongroup Properties. Properties needed
to control GUI behavior are discussed in “Write Callbacks Using the Programmatic
Workflow” on page 11-5.
Panel
The following statement creates a panel with handle ph. Use a panel to group
components in the GUI.
ph = uipanel('Parent',fh,'Title','My Panel',...
'Position',[.25 .1 .5 .8]);](https://image.slidesharecdn.com/matlab-buildgui-150310171915-conversion-gate01/85/Matlab-GUI-361-320.jpg)

![Add Components to a Programmatic GUI
10-33
The following statements add two push buttons to the panel with handle ph. The Position
property of each component within a panel is interpreted relative to the panel.
pbh1 = uicontrol(ph,'Style','pushbutton','String','Button 1',...
'Units','normalized',...
'Position',[.1 .55 .8 .3]);
pbh2 = uicontrol(ph,'Style','pushbutton','String','Button 2',...
'Units','normalized',...
'Position',[.1 .15 .8 .3]);
See “Push Button” on page 10-22 for more information about adding push buttons.
Button Group
The following statement creates a button group with handle bgh. Use a button group to
exclusively manage radio buttons and toggle buttons.
bgh = uibuttongroup('Parent',fh,'Title','My Button Group',...](https://image.slidesharecdn.com/matlab-buildgui-150310171915-conversion-gate01/85/Matlab-GUI-363-320.jpg)
![10 Lay Out a Programmatic GUI
10-34
'Position',[.1 .2 .8 .6]);
The Parent property specifies the handle fh of the parent figure. You can also specify the
parent as a panel or button group.
The Title property labels the button group as My Button Group.
The statement assumes the default TitlePosition property, which is lefttop.
The Units property is used to interpret the Position property. This button group assumes
the default Units property, normalized. This enables the button group to resize
automatically when the figure is resized.
The Position property specifies the location and size of the button group. In this example,
the button group is 80 percent of the width of the figure and 60 percent of its height. It
is positioned 10 percent of the figure width from the left of the figure and 20 percent of
the figure height from the bottom. As the figure is resized the button group retains these
proportions.](https://image.slidesharecdn.com/matlab-buildgui-150310171915-conversion-gate01/85/Matlab-GUI-364-320.jpg)
![Add Components to a Programmatic GUI
10-35
The following statements add two radio buttons to the button group with handle bgh.
rbh1 = uicontrol(bgh,'Style','radiobutton','String','Red',...
'Units','normalized',...
'Position',[.1 .6 .3 .2]);
rbh2 = uicontrol(bgh,'Style','radiobutton','String','Blue',...
'Units','normalized',...
'Position',[.1 .2 .3 .2]);
By default, the software automatically selects the first radio button added to a button
group. You can use the radio button Value property to explicitly specify the initial
selection. See “Radio Button” on page 10-23 for information.
Add Axes
Axes enable your GUI to display graphics such as graphs and images using commands
such as: plot, surf, line, bar, polar, pie, contour, and mesh.](https://image.slidesharecdn.com/matlab-buildgui-150310171915-conversion-gate01/85/Matlab-GUI-365-320.jpg)
![10 Lay Out a Programmatic GUI
10-36
Note See “Programmatic Components” on page 10-6 for a description of this component.
Use the axes function to create an axes. A syntax for this function is
ah = axes('PropertyName',PropertyValue,...)
where ah is the handle of the resulting axes. You must use the Parent property to specify
the axes parent. If you do not specify Parent, the parent is the current figure as specified
by the root CurrentFigure property. See the axes reference page for other valid syntaxes.
Subsequent topics describe commonly used properties of axes and offer a simple example.
• “Commonly Used Properties” on page 10-36
• “Axes” on page 10-37
Commonly Used Properties
The most commonly used properties needed to describe an axes are shown in the
following table:
Property Values Description
HandleVisibility on, callback, off. Default is
on.
Determines if an object's
handle is visible in its parent's
list of children. For axes,
set HandleVisibility to
callback to protect them from
command line operations.
NextPlot add, replace,
replacechildren. Default is
replace
Specifies whether plotting adds
graphics, replaces graphics and
resets axes properties to default,
or replaces graphics only.
Parent Handle Handle of the component's parent
figure, panel, or button group.
Position 4-element vector: [distance
from left, distance from bottom,
width, height].
Size of the component and its
location relative to its parent.
Units normalized, centimeters,
characters, inches,
Units of measurement used to
interpret position vector](https://image.slidesharecdn.com/matlab-buildgui-150310171915-conversion-gate01/85/Matlab-GUI-366-320.jpg)
![Add Components to a Programmatic GUI
10-37
Property Values Description
pixels, points. Default is
normalized.
For a complete list of properties and for more information about the properties listed in
the table, see Axes Properties.
See commands such as the following for more information on axes objects: plot, surf,
line, bar, polar, pie, contour, imagesc, and mesh.
Axes
The following statement creates an axes with handle ah:
ah = axes('Parent',fh,'Position',[.15 .15 .7 .7]);
The Parent property specifies the handle fh of the parent figure. You can also specify the
parent as a panel or button group.](https://image.slidesharecdn.com/matlab-buildgui-150310171915-conversion-gate01/85/Matlab-GUI-367-320.jpg)


![10 Lay Out a Programmatic GUI
10-40
Layout a GUI Programmatically
You can adjust the size and location of components, and manage front-to-back order
of grouped components by setting certain property values. This topic explains how
to use these properties to get the layout you want. It also explains how to use the
SizeChangedFcn callback to control the GUI’s resizing behavior.
In this section...
“Component Placement and Sizing” on page 10-40
“Managing the Layout in Resizable GUIs” on page 10-45
“Manage the Stacking Order of Grouped Components” on page 10-48
Component Placement and Sizing
A GUI layout consists of a figure and one or more components that you place inside
the figure. Accurate placement and sizing of each component involves setting certain
properties and understanding how the inner and outer boundaries of the figure relate to
each other.
Location and Size of Outer Bounds and Drawable Area
The area inside the figure, which contains the UI components, is called the drawable
area. The drawable area is inside the outer bounds of the figure, but does not include
the menu bar or tool bar. You can control the location and size of the drawable area by
setting the figure’s Position property as a four-element row vector. The first two elements
of this vector specify the location. The last two elements specify the size. By default, the
figure’s Position values are in pixels.
This command creates a figure and sets the Position value. The left edge of the drawable
area is 258 pixels from the left side of the screen. Its bottom edge is 132 pixels up from
the bottom of the screen. Its size is 560 pixels wide by 420 pixels high:
f = figure('Position',[258 132 560 420]);](https://image.slidesharecdn.com/matlab-buildgui-150310171915-conversion-gate01/85/Matlab-GUI-370-320.jpg)

![10 Lay Out a Programmatic GUI
10-42
Explicitly changing the Position or OuterPosition causes the other property to change.
For example, this is the current Position value of f:
f.Position
ans =
258 132 560 420
Changing the OuterPosition causes the Position to change:
f.OuterPosition = [250 250 490 340];
f.Position
ans =](https://image.slidesharecdn.com/matlab-buildgui-150310171915-conversion-gate01/85/Matlab-GUI-372-320.jpg)
![Layout a GUI Programmatically
10-43
258 258 474 248
Other UI components, such as uicontrols, uitables, and uipanels have a Position
property, which you can use to set their location and size.
Units of Measure
The default units associated with the Position property depend on the component you are
placing. However, you can change the Units property to lay out your GUI in the units of
your choice. There are six different units of measure to choose from: inches, centimeters,
normalized, points, pixels, and characters.
Always specify Units before Position for the most predictable results.
f = figure('Units','inches','Position',[4 3 6 5]);
Your choice of units can affect the appearance and resizing behavior of the GUI:
• If you want the components inside the figure to scale proportionally with the figure
when the user resizes the window, set the Units property of the components inside the
figure to 'normalized'.
• If you are developing a cross-platform GUI, then you can set the Units property to
'points' or 'characters' to make the layout consistent across all platforms.
• There might be other situations in which you want to lay out your GUI using
nondefault units. For example, you might need to specify height and width values in
inches in order to conform to a specification.
• When the value of the Units property is 'inches', 'centimeters', 'points',
'pixels', or 'characters', the component does not scale with the figure when
the user resizes the GUI. To enable automatic scaling, set the Units property to
'normalized' after the code that specifies the Position in the other units.
Example of a Simple Layout
Here is the code for a simple GUI containing an axes and a button. To see how it works,
copy and paste this code into the editor and run it.
function mygui
% Add the GUI components
hs = addcomponents;](https://image.slidesharecdn.com/matlab-buildgui-150310171915-conversion-gate01/85/Matlab-GUI-373-320.jpg)
![10 Lay Out a Programmatic GUI
10-44
% Make figure visible after adding components
hs.fig.Visible = 'on';
function hs = addcomponents
% add components, save handles in a struct
hs.fig = figure('Visible','off',...
'Resize','off',...
'Tag','fig');
hs.btn = uicontrol(hs.fig,'Position',[10 340 70 30],...
'String','Plot Sine',...
'Tag','button',...
'Callback',@plotsine);
hs.ax = axes('Parent',hs.fig,...
'Position',[0.20 0.13 0.71 0.75],...
'Tag','ax');
end
function plotsine(hObject,callbackdata)
theta = 0:pi/64:6*pi;
y = sin(theta);
plot(hs.ax,theta,y);
end
end
This code performs the following tasks:
• The main function, mygui, calls the addcomponents function. The addcomponents
function returns a structure, hs, containing the handles to all the GUI components.
• The addcomponents function creates a figure, an axes, and a button, each with
specific Position values.
• Notice that the Resize property of the figure is 'off'. This value disables the
resizing capability of the figure.
• Notice that the Visible property of the figure is 'off' inside the addcomponents
function. The value changes to 'on' after addcomponents returns to the calling
function. Doing this delays the figure display until after MATLAB adds all the
components. Thus, the resulting GUI has a clean appearance when it starts up.
• The plotsine function plots the sine function inside the axes when the user clicks
the button.](https://image.slidesharecdn.com/matlab-buildgui-150310171915-conversion-gate01/85/Matlab-GUI-374-320.jpg)


![Layout a GUI Programmatically
10-47
'Units','pixels',...
'Tag','ax');
end
function plotsine(hObject,callbackdata)
theta = 0:pi/64:6*pi;
y = sin(theta);
plot(hs.ax,theta,y);
end
function resizegui(hObject,callbackdata)
% Get figure width and height
figwidth = hs.fig.Position(3);
figheight = hs.fig.Position(4);
% Set button position
bheight = 30;
bwidth = 70;
bbottomedge = figheight - bheight - 50;
bleftedge = 10;
hs.btn.Position = [bleftedge bbottomedge bwidth bheight];
% Set axes position
axheight = .75*figheight;
axbottomedge = max(0,figheight - axheight - 30);
axleftedge = bleftedge + bwidth + 30;
axwidth = max(0,figwidth - axleftedge - 50);
hs.ax.Position = [axleftedge axbottomedge axwidth axheight];
end
end
The resizegui function sets the location and size of the button and axes whenever the
user resizes the window:
• The button height, width, and left edge stay the same when the window resizes.
• The bottom edge of the button, bbottomedge, allows 50 pixels of space between the
top of the figure and the top of the button.
• The value of the axes height, axheight, is 75% of the available height in the figure.
• The value of the axes bottom edge, axbottomedge, allows 30 pixels of space between
the top of the figure and the top of the axes. In this calculation, the max function
limits this value to nonnegative values.](https://image.slidesharecdn.com/matlab-buildgui-150310171915-conversion-gate01/85/Matlab-GUI-377-320.jpg)


![10 Lay Out a Programmatic GUI
10-50
Note: The following sections describe some techniques for interactively refining the
appearance of GUIs. If you are building a GUI that opens a saved FIG-file, re-saving that
file will preserve most of the properties you interactively change. If your program file
creates a new figure to contain your GUI whenever you open it (most programmatic GUIs
work this way), you need to specify all changed properties in the program file itself to
keep the GUI up-to-date.
Set Positions of Components Interactively
If you do not like the initial positions or other properties of GUI components, you can
make manual adjustments to them. By placing the GUI figure in plot edit mode, you can
use your mouse to move, resize, align, and change various components properties. Then,
you can read out the values of properties you changed and copy them into your GUI code
file to initialize the components.
To set position in plot edit mode:
1
Enter plot edit mode. Click the Arrow tool , or select Edit Plot from the Tools
menu. If your figure has no menus or toolbar, type plotedit on in the Command
Window.
2 Select a component. Click the left mouse button while over the component you are
editing.
3 Move and resize the component. Click within it and drag to move it to a new location.
Click a square black handle and drag to change its shape. Use arrow keys to make
small adjustments.
4 Make sure that you know the handle of the component you have manipulated. In the
following code, the handle is a variable named object_handle.
5 Get the component’s Position value from the Property Inspector. Execute this
command to open the Property Inspector.
inspect
Or, use dot notation to get the value at the command prompt.
object_handle.Position
ans =
15.2500 333.0000 106.0000 20.0000
6 Assign the Postion property to that value (ans).
object_handle.Position = [15.2500 333.0000 106.0000 20.0000];](https://image.slidesharecdn.com/matlab-buildgui-150310171915-conversion-gate01/85/Matlab-GUI-380-320.jpg)
![Adjust Programmatic GUI Layouts Interactively
10-51
Tip Instead of using a separate set command, after you decide upon a position for the
object, you can modify the statement in your code file that creates the object to include
the Position parameter and value.
To position components systematically, you can create a function to manage the process.
Here is a simple example function called editpos:
function rect = editpos(handle)
% Enters plot edit mode, pauses to let user manipulate objects,
% then turns the mode off. It does not track what user does.
% User later needs to output a Position property, if changed.
if ~ishghandle(handle)
disp(['=E= gbt_moveobj: Invalid handle: ' inputname(1)])
return
end
plotedit(handle,'on')
disp('=== Select, move and resize object. Use mouse and arrow keys.')
disp('=== When you are finished, press Return to continue.')
pause
rect = handle.Position;
inspect(handle)
To experiment with the function, enter the following code in the Command Window:
hfig = figure;
hsl = uicontrol('Style','slider')
editpos(hsl)
After you call editpos, the following prompt appears:
=== Select, move and resize the object. Use mouse and arrow keys.
=== When you are finished, press Return to continue.
When you first enter plot edit mode, the selection is figure itself. Click the slider to select
it and reposition it. For example, move it to the right side of the figure and orient it
vertically, as shown in the following figure.](https://image.slidesharecdn.com/matlab-buildgui-150310171915-conversion-gate01/85/Matlab-GUI-381-320.jpg)


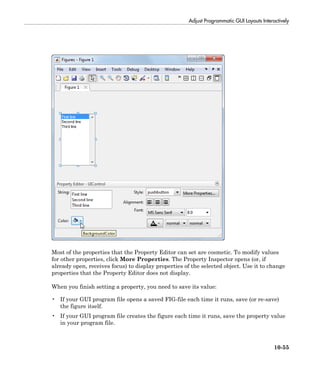
![10 Lay Out a Programmatic GUI
10-56
You can obtain the new property value using dot notation and the property name. For
example, this command gets the BackgroundColor property value of object_handle
and stores it in the variable, bc.
bc = object_handle.BackgroundColor;
Sketch a Position Vector
rbbox is a useful function for setting positions. When you call it, you drag out a rubber
band box anywhere in the figure. You receive a position vector for that box when you
release the mouse button. Be aware that when rbbox executes,
• A figure window must have focus.
• The mouse cursor must be within the figure window.
• Your left mouse button must down.
Because of this behavior, you must call rbbox from a function or a script that waits for
you to press the mouse button. The returned position vector specifies the rectangle you
draw in figure units. The following function, called setpos, calls rbbox to specify a
position for a component. It returns the position vector you drag out and also places it on
the system clipboard:
function rect = setpos(object_handle)
% Use RBBOX to establish a position for a GUI component.
% object_handle is a handle to a uicomponent that uses
% any Units. Internally, figure Units are used.
disp(['=== Drag out a Position for object ' inputname(1)])
waitforbuttonpress % So that rbbox does not return immediately
rect = rbbox; % User drags out a rectangle, releases button
% Pressing a key aborts rbbox, so check for null width & height
if rect(3) ~= 0 && rect(4) ~= 0
% Save and restore original units for object
myunits = object_handle.Units;
object_handle.Units = get(gcf,'Units');
object_handle.Position = rect;
object_handle.Units = myunits;
else
rect = [];
end
clipboard('copy', rect) % Place set string on system
% clipboard as well as returning it](https://image.slidesharecdn.com/matlab-buildgui-150310171915-conversion-gate01/85/Matlab-GUI-386-320.jpg)


![Adjust Programmatic GUI Layouts Interactively
10-59
4 The button Position is set, returned and placed on the system clipboard:
rect =
37 362 127 27
Add a Position parameter and empty value to the uicontrol command from step 1
in your GUI code file, as follows:
btn1 = uicontrol('Style','pushbutton',...
'String','Push Me','Position',[])
With the cursor inside the brackets [], type Ctrl+V to paste the setpos output as
the Position parameter value:
btn1 = uicontrol('Style','pushbutton',...
'String','Push Me','Position',[37 362 127 27])
You cannot call setpos when you are creating a component because setpos requires the
handle of the component as an argument. However, you can create a small function that
lets you position a component interactively as you create it. The function waits for you
to press the mouse button, then calls rbbox, and returns a position rectangle when you
release the mouse button:
function rect = getrect
disp('=== Click and drag out a Position rectangle.')
waitforbuttonpress % So that rbbox does not return immediately
rect = rbbox; % User drags out a rectangle, releases button
clipboard('copy', rect) % Place set string on system
% clipboard as well as returning it
To use getrect:
1 In the editor, place the following statement in your GUI code file to generate a push
button. Specify getrect within it as the value for the Position property:
btn1 = uicontrol('Style','pushbutton','String','Push Me',...
'Position',getrect);
2 Select the entire statement in the editor and execute it with the F9 key or by right-
clicking and selecting Evaluate Selection.
3 In the figure window, drag out a rectangle for the control to occupy. When you
have finished dragging, the new component displays in that rectangle. (If you type
a character while you are dragging, rbbox aborts, you receive an error, and no
uicontrol is created.)
4 In the editor, select getrect in the uicontrol statement, and type [] in place of it.
The statement now looks like this:](https://image.slidesharecdn.com/matlab-buildgui-150310171915-conversion-gate01/85/Matlab-GUI-389-320.jpg)
![10 Lay Out a Programmatic GUI
10-60
btn1 = uicontrol('Style','pushbutton','String','Push Me',...
'Position',[]);
5 Place your cursor between the empty brackets and type Ctrl+V, or right-click and
select Paste. Allowing for differences in coordinate values, the statement looks like
this one:
btn1 = uicontrol('Style','pushbutton','String','Push Me',...
'Position',[55 253 65 25]);
Remember that rbbox returns coordinates in figure units ('pixels', in this example).
If the default Units value of a component is not the same as the figure, specify it to be
the same when you make the component. For example, the default Units of a uipanel is
'normalized'. To sketch a uipanel position, use code that uses figure Units, as in the
following example:
pnl1 = uipanel('Title','Inputs',...
'Units',get(gcf,'Units'),...
'Position',getrect)
Two MATLAB utilities for composing GUIs can assist you in specifying positions. Use
getpixelposition to obtain a position vector for a component in units of pixels
regardless of its Units setting. The position origin is with respect to the parent of the
component or the enclosing figure. Use setpixelposition to specify a new component
position in pixels. The Units property of the component remains unchanged after calling
either of these functions.
Align Components
• “Use the align Function” on page 10-60
• “Use Align Distribute Tools” on page 10-64
After you position components, they still might not line up perfectly. To make final
adjustments, use the align function from the Command Window. As an interactive
alternative, use the Align Distribute tool, a GUI available from the figure menu. The
following sections describe both approaches.
Use the align Function
Use the align function to align user interface controls and axes. This function enables
you to line up the components vertically and horizontally. You can also distribute the
components evenly across their span or specify a fixed distance between them.](https://image.slidesharecdn.com/matlab-buildgui-150310171915-conversion-gate01/85/Matlab-GUI-390-320.jpg)
![Adjust Programmatic GUI Layouts Interactively
10-61
A syntax for the align function is
align(HandleList,'HorizontalAlignment','VerticalAlignment')
The following table lists the possible values for these parameters.
HorizontalAlignment VerticalAlignment
None, Left, Center, Right, Distribute,
or Fixed
None, Top, Middle, Bottom, Distribute,
or Fixed
All handles in HandleList must have the same parent. See the align reference page
for information about other syntaxes.
The align function positions components with respect to their bounding box, shown as a
blue dashed line in the following figures. For demonstration purposes, create three push
buttons in arbitrary places using the following code.
fh = figure('Position',[400 300 300 150])
b1 = uicontrol(fh,'Position',[30 10 60 30],'String','B1');
b2 = uicontrol(fh,'Position',[50 50 60 30],'String','B2');
b3 = uicontrol(fh,'Position',[10 80 60 30],'String','B3');
Note: Each of the three following align examples starts with these unaligned push
buttons and repositions them in different ways. In practice, when you create buttons with](https://image.slidesharecdn.com/matlab-buildgui-150310171915-conversion-gate01/85/Matlab-GUI-391-320.jpg)
![10 Lay Out a Programmatic GUI
10-62
uicontrol and do not specify a Position, their location is always [20 20 60 20] (in
pixels). That is, if you keep creating them with default positions, they lie on top of one
another.
Align Components Horizontally
The following statement moves the push buttons horizontally to the right of their
bounding box. It does not alter their vertical positions. The figure shows the original
bounding box.
align([b1 b2 b3],'Right','None');
Align Components Horizontally While Distributing Them Vertically
The following statement moves the push buttons horizontally to the center of their
bounding box and adjusts their vertical placement. The 'Fixed' option makes the
distance between the boxes uniform. Specify the distance in points (1 point = 1/72 inch).
In this example, the distance is seven points. The push buttons appear in the center of
the original bounding box. The bottom push button remains at the bottom of the original
bounding box.
align([b1 b2 b3],'Center','Fixed',7);](https://image.slidesharecdn.com/matlab-buildgui-150310171915-conversion-gate01/85/Matlab-GUI-392-320.jpg)
![Adjust Programmatic GUI Layouts Interactively
10-63
Align Components Vertically While Distributing Them Horizontally
The following statement moves the push buttons to the bottom of their bounding box. It
also adjusts their horizontal placement to create a fixed distance of five points between
the boxes. The push buttons appear at the bottom of the original bounding box.
align([b1 b2 b3],'Fixed',5,'Bottom');](https://image.slidesharecdn.com/matlab-buildgui-150310171915-conversion-gate01/85/Matlab-GUI-393-320.jpg)


![Adjust Programmatic GUI Layouts Interactively
10-69
that has a String property. You can also specify the string itself at the same time by
calling inputdlg, which is a predefined GUI for entering text strings. Here is an
example that creates static text and sets the font properties.
f = figure('Position',[300 300 385 285]);
txt1 = uicontrol(f,...
'Style','text',...
'String',inputdlg('String','Static Text'),...
uisetfont,'Position',[50 200 150 40]);
The inputdlg dialog box appears first.
After you enter a string and click OK, the uisetfont dialog box opens for you to set font
characteristics for displaying the string.](https://image.slidesharecdn.com/matlab-buildgui-150310171915-conversion-gate01/85/Matlab-GUI-399-320.jpg)
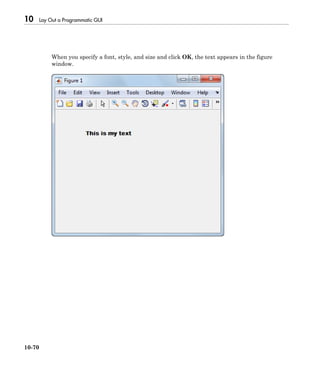
![Customize Tabbing Behavior in a Programmatic GUI
10-71
Customize Tabbing Behavior in a Programmatic GUI
In this section...
“How Tabbing Works” on page 10-71
“Default Tab Order” on page 10-71
“Change the Tab Order in the uipanel” on page 10-73
How Tabbing Works
A GUI's tab order is the order in which components of the GUI acquire focus when a user
presses the keyboard Tab key. Focus is generally denoted by a border or a dotted border.
Tab order is determined separately for the children of each parent. For example, child
components of the GUI figure have their own tab order. Child components of each panel
or button group also have their own tab order.
If, in tabbing through the components at one level, a user tabs to a panel or button group,
then the tabbing sequences through the components of the panel or button group before
returning to the level from which the panel or button group was reached. For example, if
a GUI figure contains a panel that contains three push buttons and the user tabs to the
panel, then the tabbing sequences through the three push buttons before returning to the
figure.
Note You cannot tab to axes and static text components. You cannot determine
programmatically which component has focus.
Default Tab Order
The default tab order for each level is the order in which you create the components at
that level.
The following code creates a GUI that contains a pop-up menu with a static text label, a
panel with three push buttons, and an axes.
fh = figure('Position',[200 200 450 270]);
pmh = uicontrol(fh,'Style','popupmenu',...
'String',{'peaks','membrane','sinc'},...](https://image.slidesharecdn.com/matlab-buildgui-150310171915-conversion-gate01/85/Matlab-GUI-401-320.jpg)
![10 Lay Out a Programmatic GUI
10-72
'Position',[290 200 130 20]);
sth = uicontrol(fh,'Style','text','String','Select Data',...
'Position',[290 230 60 20]);
ph = uipanel('Parent',fh,'Units','pixels',...
'Position',[290 30 130 150]);
ah = axes('Parent',fh,'Units','pixels',...
'Position',[40 30 220 220]);
bh1 = uicontrol(ph,'Style','pushbutton',...
'String','Contour','Position',[20 20 80 30]);
bh2 = uicontrol(ph,'Style','pushbutton',...
'String','Mesh','Position',[20 60 80 30]);
bh3 = uicontrol(ph,'Style','pushbutton',...
'String','Surf','Position',[20 100 80 30]);
You can obtain the default tab order for a figure, panel, or button group by looking at its
Children property. For the example, this command gets the children of the uipanel, ph.
ch = ph.Children
ch =](https://image.slidesharecdn.com/matlab-buildgui-150310171915-conversion-gate01/85/Matlab-GUI-402-320.jpg)


![10 Lay Out a Programmatic GUI
10-82
Add Context Menus to a Programmatic GUI
Context menus appear when the user right-clicks on a figure or GUI component. Follow
these steps to add a context menu to your GUI:
1 Create the context menu object using the uicontextmenu function.
2 Add menu items to the context menu using the uimenu function.
3 Associate the context menu with a graphics object using the object's UIContextMenu
property.
Subsequent topics describe commonly used context menu properties and explain each of
these steps:
• “Commonly Used Properties” on page 10-82
• “Create the Context Menu Object” on page 10-83
• “Add Menu Items to the Context Menu” on page 10-83
• “Associate the Context Menu with Graphics Objects” on page 10-84
• “Force Display of the Context Menu” on page 10-86
Commonly Used Properties
The most commonly used properties needed to describe a context menu object are shown
in the following table. These properties apply only to the menu object and not to the
individual menu items.
Property Values Description
HandleVisibility on, off. Default is on. Determines if an object's handle is visible in
its parent's list of children. For menus, set
HandleVisibility to off to protect menus
from operations not intended for them.
Parent Figure handle Handle of the context menu's parent figure.
Position 2-element vector:
[distance from left,
distance from bottom].
Default is [0 0].
Distances from the bottom left corner of the
parent figure to the top left corner of the
context menu. This property is used only when
you programmatically set the context menu
Visible property to on.](https://image.slidesharecdn.com/matlab-buildgui-150310171915-conversion-gate01/85/Matlab-GUI-412-320.jpg)
![Create Menus for Programmatic GUIs
10-83
Property Values Description
Visible off, on. Default is
off
• Indicates whether the context menu is
currently displayed. While the context menu
is displayed, the property value is on; when
the context menu is not displayed, its value is
off.
• Setting the value to on forces the posting of
the context menu. Setting to off forces the
context menu to be removed. The Position
property determines the location where the
context menu is displayed.
For a complete list of properties and for more information about the properties listed in
the table, see Uicontextmenu Properties.
Create the Context Menu Object
Use the uicontextmenu function to create a context menu object. The syntax is
handle = uicontextmenu('PropertyName',PropertyValue,...)
The parent of a context menu must always be a figure. Use the context menu Parent
property to specify its parent. If you do not specify Parent, the parent is the current
figure as specified by the root CurrentFigure property.
The following code creates a figure and a context menu whose parent is the figure. At this
point, the figure is visible, but not the menu.
fh = figure('Position',[300 300 400 225]);
cmenu = uicontextmenu('Parent',fh,'Position',[10 215]);
Note “Force Display of the Context Menu” on page 10-86 explains the use of the
Position property.
Add Menu Items to the Context Menu
Use the uimenu function to add items to the context menu. The items appear on the
menu in the order in which you add them. The following code adds three items to the
context menu created above.](https://image.slidesharecdn.com/matlab-buildgui-150310171915-conversion-gate01/85/Matlab-GUI-413-320.jpg)
![10 Lay Out a Programmatic GUI
10-84
mh1 = uimenu(cmenu,'Label','Item 1');
mh2 = uimenu(cmenu,'Label','Item 2');
mh3 = uimenu(cmenu,'Label','Item 3');
You can specify any applicable Uimenu Properties when you define the context menu
items. See the uimenu reference page and “Add Menu Bar Menus” on page 10-75 for
information about using uimenu to create menu items. Note that context menus do not
have an Accelerator property.
Note After you have created the context menu and all its items, set their
HandleVisibility properties to 'off' by executing the following statements:
cmenuhandles = findall(figurehandle,'type','uicontextmenu');
cmenuhandles.HandleVisibility = 'off';
menuitemhandles = findall(cmenuhandles,'type','uimenu');
menuitemhandles.HandleVisibility = 'off';
Associate the Context Menu with Graphics Objects
You can associate a context menu with the figure itself and with all components that
have a UIContextMenu property. This includes axes, panel, button group, all user
interface controls (uicontrols).
This code adds a panel and an axes to the figure. The panel contains a single push
button.
ph = uipanel('Parent',fh,'Units','pixels',...
'Position',[20 40 150 150]);
bh1 = uicontrol(ph,'String','Button 1',...
'Position',[20 20 60 40]);
ah = axes('Parent',fh,'Units','pixels',...
'Position',[220 40 150 150]);](https://image.slidesharecdn.com/matlab-buildgui-150310171915-conversion-gate01/85/Matlab-GUI-414-320.jpg)

![10 Lay Out a Programmatic GUI
10-86
Force Display of the Context Menu
If you set the context menu Visible property on, the context menu is displayed at the
location specified by the Position property, without the user taking any action. In this
example, the context menu Position property is [10 215].
cmenu.Visible = 'on';
The context menu displays 10 pixels from the left of the figure and 215 pixels from the
bottom.](https://image.slidesharecdn.com/matlab-buildgui-150310171915-conversion-gate01/85/Matlab-GUI-416-320.jpg)


![Create Toolbars for Programmatic GUIs
10-89
Property Values Description
displayed on either a push button or
toggle button.
HandleVisibility on, off. Default is on. Determines if an object's handle is
visible in its parent's list of children.
For toolbars and their tools, set
HandleVisibility to off to protect
them from operations not intended
for them.
Separator off, on. Default is off. Draws a dividing line to left of the
push tool or toggle tool
State off, on. Default is off. Toggle tool state. on is the down, or
depressed, position. off is the up, or
raised, position.
TooltipString String Text of the tooltip associated with
the push tool or toggle tool.
For a complete list of properties and for more information about the properties listed
in the table, see the Uitoolbar Properties, Uipushtool Properties, and Uitoggletool
Properties.
Toolbars
The following statements add a toolbar to a figure, and then add a push tool and a toggle
tool to the toolbar. By default, the tools are added to the toolbar, from left to right, in the
order they are created.
% Create the toolbar
fh = figure;
tbh = uitoolbar(fh);
% Add a push tool to the toolbar
a = [.20:.05:0.95];
img1(:,:,1) = repmat(a,16,1)';
img1(:,:,2) = repmat(a,16,1);
img1(:,:,3) = repmat(flipdim(a,2),16,1);
pth = uipushtool(tbh,'CData',img1,...
'TooltipString','My push tool',...
'HandleVisibility','off');](https://image.slidesharecdn.com/matlab-buildgui-150310171915-conversion-gate01/85/Matlab-GUI-419-320.jpg)


![Initialize a Programmatic GUI
11-3
The fullfile function builds a full filename from parts.
The following statements start the Icon Editor application. The first statement creates a
new icon. The second statement opens existing icon file for editing.
cdata = iconEditor('iconwidth',16,'iconheight',25)
cdata = iconEditor('iconfile','eraser.gif');
iconEditor calls a routine, processUserIputs, during the initialization to accomplish
these tasks:
• Identify each property by matching it to the first column of the cell array
• Call the routine named in the second column to validate the input
• Assign the value to the variable named in the third column
Make the Figure Invisible
When you create the GUI figure, make it invisible when you create it. Display it only
after you have added all the UI components.
To make the GUI invisible, set the figure Visible property to 'off' when you create
the figure:
hMainFigure = figure(...
'Units','characters',...
'MenuBar','none',...
'Toolbar','none',...
'Position',[71.8 34.7 106 36.15],...
'Visible','off');
After you have added all the components to the figure window, make the figure visible:
hMainFigure.Visible = 'on';
Most components have a Visible property. Thus, you can also use this property to make
individual components invisible.
Return Output to the User
If your GUI function provides for an argument to the left of the equal sign, and the user
specifies such an argument, then you want to return the expected output. The code that
provides this output usually appears just before the GUI main function returns.
In the example shown here,](https://image.slidesharecdn.com/matlab-buildgui-150310171915-conversion-gate01/85/Matlab-GUI-429-320.jpg)
![11 Code a Programmatic GUI
11-4
1 A call to uiwait blocks execution until uiresume is called or the current figure is
deleted.
2 While execution is blocked, the user creates the icon.
3 When the user clicks OK, that push button’s callback calls the uiresume function.
4 The GUI then returns the completed icon to the user as output of the GUI.
% Make the GUI blocking.
uiwait(hMainFigure);
% Return the edited icon CData if it is requested.
mOutputArgs{1} = mIconCData;
if nargout>0
[varargout{1:nargout}] = mOutputArgs{:};
end
mIconData contains the icon that the user created or edited. mOutputArgs is a cell
array defined to hold the output arguments. nargout indicates how many output
arguments the user has supplied. varargout contains the optional output arguments
returned by the GUI. See the complete Icon Editor code file for more information.](https://image.slidesharecdn.com/matlab-buildgui-150310171915-conversion-gate01/85/Matlab-GUI-430-320.jpg)


![11 Code a Programmatic GUI
11-8
disp(['Slider moved to ' newval]);
end
This callback function displays the value of the slider when the end user adjusts it.
A benefit of specifying callbacks as function handles is that MATLAB checks the
function for syntax errors and missing dependencies when you assign the callback to the
component. If there is a problem in the callback function, then MATLAB returns an error
immediately instead of waiting for the end user to trigger the callback. This behavior
helps you to find problems in your code before the end user encounters them.
Note: If you want to use an existing function that does not support the hObject and
callbackdata arguments, then you can specify it as an anonymous function. For
example,
uicontrol('Style','slider','Callback',@(hObject,callbackdata)myfunction(x));
In this case, x is an input argument to the function, myfunction. See “Anonymous
Functions” for more information.
Specify a Cell Array
Use a cell array to specify a callback function that accepts input arguments that you
want to use in the function. The first element in the cell array is a function handle.
The other elements in the cell array are the input arguments to the function, separated
by commas. For example, this code creates a push button component and specifies its
callback to be a cell array containing the function handle, @pushbutton_callback, and
one input argument, myvar. To see how it works, copy and paste this code into an editor
and run it.
function somegui()
myvar = 5;
figure
uicontrol('Style','pushbutton',...
'Callback',{@pushbutton_callback,myvar});
end
function pushbutton_callback(hObject,callbackdata,x)
display(x);
end
The function definition must define two input arguments, hObject and callbackdata,
followed by any additional arguments the function uses. Handle Graphics automatically
passes the hObject and callbackdata arguments when it calls the function. If you
define additional input arguments, then the values you pass to the callback must exist in
the workspace when the end user triggers the callback.](https://image.slidesharecdn.com/matlab-buildgui-150310171915-conversion-gate01/85/Matlab-GUI-434-320.jpg)
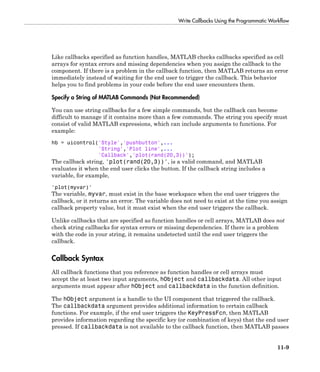


![Share Data Among Callbacks
12-3
Method Description Requirements and Trade-Offs
GUIs)” on page
12-5
• Can share multiple variables.
“Store Data
Using the
guidata
Function” on
page 12-6
Share data with the GUI figure
using the guidata function.
• Stores or retrieves the data
through any UI component.
• Stores only one variable at
a time, but you can store
multiple values as a struct
array or cell array.
Store Data in UserData or Other Object Properties
UI components contain useful information in their properties, which you can access
directly as long as you have the component handle. If you do not have a handle to the
component, then use the findobj function to search for a handle that has a known
property value. You can store any data in the UserData property of a UI component or
figure. For example, the following programmatic GUI code uses the UserData property
to share information about the slider. To see how it works, copy and paste this code into
an editor and run it.
function my_slider()
hfig = figure();
slider = uicontrol('Parent', hfig,'Style','slider',...
'Units','normalized',...
'Position',[0.3 0.5 0.4 0.1],...
'Tag','slider1',...
'UserData',struct('val',0,'diffMax',1),...
'Callback',@slider_callback);
button = uicontrol('Parent', hfig,'Style','pushbutton',...
'Units','normalized',...
'Position',[0.4 0.3 0.2 0.1],...
'String','Display Difference',...
'Callback',@button_callback);
end
function slider_callback(hObject,eventdata)
sval = hObject.Value;
diffMax = hObject.Max - sval;
data = struct('val',sval,'diffMax',diffMax);
hObject.UserData = data;](https://image.slidesharecdn.com/matlab-buildgui-150310171915-conversion-gate01/85/Matlab-GUI-439-320.jpg)
![12 Manage Application-Defined Data
12-4
end
function button_callback(hObject,eventdata)
h = findobj('Tag','slider1');
data = h.UserData;
display([data.val data.diffMax]);
end
When the end user moves the slider, the slider_callback function stores the current
slider value and the difference between the current and maximum values in the
UserData property. When the end user clicks the push button, the button_callback
function finds the handle to the component containing the Tag property, 'slider1'.
Then, the last two commands in the button_callback function get and display the
values stored in the slider’s UserData property, respectively.
You can store any MATLAB variable in the UserData property. The syntax for storing
and retrieving data is the same for GUIDE and programmatic GUIs.
Store Data as Application Data
You can share data in a GUI using a facility called application data. To store application
data, you call the setappdata function:
setappdata(h,name,value);
The first input, h, is the handle to the component with which to associate the data. The
second input, name, is string that identifies the value. The third input, value, is the
value you want to store.
To retrieve application data, use the getappdata function:
data = getappdata(h,name);
The handle, h, must be a handle to the component associated with the data. The second
input, name, must match the string you used to store the data. Unlike UserData, which
only stores only one variable, application data can accommodate multiple variables.
The following programmatic GUI code uses application data to share two values. To see
how it works, copy and paste this code into an editor and run it.
function my_slider()
hfig = figure();
setappdata(hfig,'slidervalue',0);
setappdata(hfig,'difference',1);
slider = uicontrol('Parent', hfig,'Style','slider',...](https://image.slidesharecdn.com/matlab-buildgui-150310171915-conversion-gate01/85/Matlab-GUI-440-320.jpg)
![Share Data Among Callbacks
12-5
'Units','normalized',...
'Position',[0.3 0.5 0.4 0.1],...
'Tag','slider1',...
'Callback',@slider_callback);
button = uicontrol('Parent', hfig,'Style','pushbutton',...
'Units','normalized',...
'Position',[0.4 0.3 0.2 0.1],...
'String','Display Values',...
'Callback',@button_callback);
end
function slider_callback(hObject,eventdata)
diffMax = hObject.Max - hObject.Value;
setappdata(hObject.Parent,'slidervalue',hObject.Value);
setappdata(hObject.Parent,'difference',diffMax);
end
function button_callback(hObject,eventdata)
currentval = getappdata(hObject.Parent,'slidervalue');
diffval = getappdata(hObject.Parent,'difference');
display([currentval diffval]);
end
When the end user moves the slider, the slider_callback function calls setappdata
to save the new slider value as application data using the name, 'slidervalue'. The
next line of code calls setappdata to save another value, diffMax, using the name,
'difference'. Both calls to setappdata associate the data with the parent object,
which is the GUI figure in this case.
When the end user clicks the push button, the button_callback function calls
getappdata to retrieve the values named 'slidervalue' and 'difference'. Then,
the final command in the button_callback function displays those values.
The setappdata and getappdata syntaxes are the same for GUIDE and programmatic
GUIs.
Create Nested Callback Functions (Programmatic GUIs)
You can nest callback functions inside the main function of a programmatic GUI. When
you do this, the nested callback functions share a workspace with the main function. As
a result, the nested functions have access to all the GUI handles and variables defined in
the main function. The following example code uses nested functions to share data about](https://image.slidesharecdn.com/matlab-buildgui-150310171915-conversion-gate01/85/Matlab-GUI-441-320.jpg)
![12 Manage Application-Defined Data
12-6
the slider position. To see how it works, copy and paste this code into an editor and run
it.
function my_slider()
hfig = figure();
data = struct('val',0,'diffMax',1);
slider = uicontrol('Parent', hfig,'Style','slider',...
'Units','normalized',...
'Position',[0.3 0.5 0.4 0.1],...
'Tag','slider1',...
'Callback',@slider_callback);
button = uicontrol('Parent', hfig,'Style','pushbutton',...
'Units','normalized',...
'Position',[0.4 0.3 0.2 0.1],...
'String','Display Difference',...
'Callback',@button_callback);
function slider_callback(hObject,eventdata)
sval = hObject.Value;
diffMax = hObject.Max - sval;
data.val = sval;
data.diffMax = diffMax;
end
function button_callback(hObject,eventdata)
display([data.val data.diffMax]);
end
end
The main function defines a struct array called data. When the end user moves the
slider, the slider_callback function updates the val and diffMax fields of the data
structure. When the end user clicks the push button, the button_callback function
displays the values stored in data.
Note: Nested functions are not recommended for GUIDE GUIs.
Store Data Using the guidata Function
The guidata function provides a way to share data with the GUI figure. You can store
or retrieve the your data in any callback through the hObject handle. This means
that, unlike working with UserData or application data, you do not have to search](https://image.slidesharecdn.com/matlab-buildgui-150310171915-conversion-gate01/85/Matlab-GUI-442-320.jpg)
![Share Data Among Callbacks
12-7
for a specific UI component handle to access your data. Call guidata with two input
arguments to store data:
guidata(object_handle,data);
The first input, object_handle, is a handle to any component in the GUI (typically
hObject). The second input, data, is the variable to store. Every time you call guidata
using two input arguments, MATLAB overwrites any previously stored data. This means
you can only store one variable at a time. If you want to share multiple values, then store
the data as a struct array or cell array.
To retrieve data, call guidata using one input argument and one output argument:
data = guidata(object_handle);
The handle you specify to store the data does not need to be the same handle that you use
to retrieve it.
If your data is stored as a struct array or cell array, and you want to update one
element without changing the other elements, then retrieve the data and replace it with
the modified array:
data = guidata(hObject);
data.myvalue = 2;
guidata(hObject,data);
Use guidata in a Programmatic GUI
To use guidata in a programmatic GUI, store the data with some initial values in the
main function. Then you can retrieve and modify the data in any callback function.
The following code is a simple example of a programmatic GUI that uses guidata to
share a struct array containing two fields. To see how it works, copy and paste this code
into an editor and run it.
function my_slider()
hfig = figure();
guidata(hfig,struct('val',0,'diffMax',1));
slider = uicontrol('Parent', hfig,'Style','slider',...
'Units','normalized',...
'Position',[0.3 0.5 0.4 0.1],...
'Tag','slider1',...
'Callback',@slider_callback);
button = uicontrol('Parent', hfig,'Style','pushbutton',...
'Units','normalized',...](https://image.slidesharecdn.com/matlab-buildgui-150310171915-conversion-gate01/85/Matlab-GUI-443-320.jpg)
![12 Manage Application-Defined Data
12-8
'Position',[0.4 0.3 0.2 0.1],...
'String','Display Values',...
'Callback',@button_callback);
end
function slider_callback(hObject,eventdata)
data = guidata(hObject);
data.val = hObject.Value;
data.diffMax = hObject.Max - data.val;
guidata(hObject,data);
end
function button_callback(hObject,eventdata)
data = guidata(hObject);
display([data.val data.diffMax]);
end
When the end user moves the slider, the slider_callback function calls guidata to
retrieve a copy of the stored struct array. The next two lines of code modify the struct
array. The last line in the function replaces the stored struct array with the modified
copy.
When the end users clicks the push button, the button_callback function calls
guidata to retrieve a copy of the stored struct array. Then it displays the two values
stored in the array.
Use guidata in a GUIDE GUI
GUIDE uses guidata to store a struct array called handles, which contains all the
handles in the GUI. MATLAB passes the handles array to every callback function.
If you want to use guidata to share additional data, then add fields to the handles
structure in the OpeningFcn callback. To modify your data in a callback function, modify
the handles array, and then store it using guidata. This slider callback function shows
how to modify and store the handles array in a callback function.
function slider1_Callback(hObject,eventdata,handles)
handles.myvalue = 2;
guidata(hObject,handles);
end
To see a full example of a GUIDE GUI that uses the guidata function, follow these steps
to copy and examine the code.
1 Set your current folder to one to which you have write access.](https://image.slidesharecdn.com/matlab-buildgui-150310171915-conversion-gate01/85/Matlab-GUI-444-320.jpg)


![13 Manage Callback Execution
13-6
Clicking either button triggers the button's Callback callback, which creates and
updates a waitbar.
This code creates the two Wait buttons and specifies the callbacks that service them.
h_interrupt = uicontrol(h_panel1,'Style','pushbutton',...
'Position',[30,110,120,30],...
'String','Wait (interruptible)',...
'Interruptible','on',...
'Callback',@wait_interruptible);
h_noninterrupt = uicontrol(h_panel1,'Style','pushbutton',...
'Position',[30,40,120,30],...
'String','Wait (noninterruptible)',...
'Interruptible','off',...
'Callback',@wait_noninterruptible);
• The second GUI contains two push buttons:
• Surf Plot (queue) whose BusyAction property is queue
• Mesh Plot (cancel) whose BusyAction property is cancel
Clicking either button triggers the button's Callback callback to generate a plot in
the axes.](https://image.slidesharecdn.com/matlab-buildgui-150310171915-conversion-gate01/85/Matlab-GUI-452-320.jpg)
![Interrupt Callback Execution
13-7
This code creates the two plot buttons and specifies the callbacks that service them.
hsurf_queue = uicontrol(h_panel2,'Style','pushbutton',...
'Position',[30,200,110,30],...
'String','Surf Plot (queue)',...
'TooltipString','BusyAction = queue',...
'BusyAction','queue',...
'Callback',@surf_queue);
hmesh_cancel = uicontrol(h_panel2,'Style','pushbutton',...
'Position',[30,130,110,30],...
'String','Mesh Plot (cancel)',...
'BusyAction','cancel',...
'TooltipString','BusyAction = cancel',...
'Callback',@mesh_cancel);
Using the Example GUIs
Click here to run the example GUIs.](https://image.slidesharecdn.com/matlab-buildgui-150310171915-conversion-gate01/85/Matlab-GUI-453-320.jpg)


![Axes, Menus, and Toolbars in Programmatic GUIs
14-5
hPlotAxes = axes(... % Axes for plotting the selected plot
'Parent', hMainFigure, ...
'Units', 'normalized', ...
'HandleVisibility','callback', ...
'Position',[0.11 0.13 0.80 0.67]);
• The axes function creates the axes. Setting the axes Parent property to
hMainFigure makes it a child of the main figure.
• Setting the Units property to 'normalized' ensures that the axes resizes
proportionately when the user resizes the figure window.
• The Position property is a 4-element vector that specifies the location of the axes
within the figure and its size: [distance from left, distance from bottom, width,
height].
The Pop-Up Menu
This command creates the pop-up menu:
hPlotsPopupmenu = uicontrol(... % List of available types of plot
'Parent', hMainFigure, ...
'Units','normalized',...
'Position',[0.11 0.85 0.45 0.1],...
'HandleVisibility','callback', ...
'String',mPlotTypes(:,1),...
'Style','popupmenu');
• The uicontrol function creates various user interface controls based on the value of
the Style property. Here, the Style property is set to 'popupmenu'.
• For a pop-up menu, the String property defines the list of items in the menu. Here it
is defined as a 5-by-1 cell array of strings derived from the cell array mPlotTypes.
The Update Push Button
This command creates the Update push button:
hUpdateButton = uicontrol(... % Button for updating selected plot
'Parent', hMainFigure, ...
'Units','normalized',...
'HandleVisibility','callback', ...
'Position',[0.6 0.85 0.3 0.1],...
'String','Update',...
'Callback', @hUpdateButtonCallback);
• The uicontrol function creates various user interface controls based on the value
of the Style property. This statement does not set the Style property because its
default is 'pushbutton'.](https://image.slidesharecdn.com/matlab-buildgui-150310171915-conversion-gate01/85/Matlab-GUI-461-320.jpg)
![Axes, Menus, and Toolbars in Programmatic GUIs
14-7
• For each of the menu items, the Callback property specifies the callback that
services that item. These callbacks are defined as nested functions in the same file.
The Toolbar
These statements define the toolbar and the two buttons it contains:
hToolbar = uitoolbar(... % Toolbar for Open and Print buttons
'Parent',hMainFigure, ...
'HandleVisibility','callback');
hOpenPushtool = uipushtool(... % Open toolbar button
'Parent',hToolbar,...
'TooltipString','Open File',...
'CData',iconRead(fullfile(matlabroot,...
'toolboxmatlabiconsopendoc.mat')),...
'HandleVisibility','callback', ...
'ClickedCallback', @hOpenMenuitemCallback);
hPrintPushtool = uipushtool(... % Print toolbar button
'Parent',hToolbar,...
'TooltipString','Print Figure',...
'CData',iconRead(fullfile(matlabroot,...
'toolboxmatlabiconsprintdoc.mat')),...
'HandleVisibility','callback', ...
'ClickedCallback', @hPrintMenuitemCallback);
• The uitoolbar function creates the toolbar.
• The uipushtool function creates the two push buttons in the toolbar.
• The uipushtool TooltipString property assigns a tool tip that displays when the
user moves the mouse pointer over the button and leaves it there.
• The CData property specifies a truecolor image that displays on the button. For these
two buttons, the utility iconRead function supplies the image.
• For each of the uipushtools, the ClickedCallback property specifies the callback
that executes when the user clicks the buttons.
Initialize the GUI
This code creates the plot that appears when the GUI initially displays. This code also
checks to see if the user provided an output argument.
% Update the plot with the initial plot type
localUpdatePlot();
% Define default output and return it if it is requested by users
mOutputArgs{1} = hMainFigure;
if nargout>0
[varargout{1:nargout}] = mOutputArgs{:};](https://image.slidesharecdn.com/matlab-buildgui-150310171915-conversion-gate01/85/Matlab-GUI-463-320.jpg)


![14 Examples of GUIs Created Programmatically
14-10
The hPrintMenuitemCallback function calls the printdlg function. This function
opens the standard system dialog box for printing the current figure. Your print dialog
box might look different than the one shown here.
Close Menu Item Callback
The hCloseMenuitemCallback function services the Close menu item. It executes
when the GUI user selects Close from the File menu.
function hCloseMenuitemCallback(hObject, eventdata)
% Callback function run when the Close menu item is selected
selection = ...
questdlg(['Close ' hMainFigure.Name '?'],...
['Close ' hMainFigure.Name '...'],...
'Yes','No','Yes');
if strcmp(selection,'No')
return;
end](https://image.slidesharecdn.com/matlab-buildgui-150310171915-conversion-gate01/85/Matlab-GUI-466-320.jpg)


![14 Examples of GUIs Created Programmatically
14-14
the plot. A more natural way to add this capability is to allow the user to supply input
arguments to the GUI to identify a data file or workspace variable, and to supply text
strings to use for column headers.
View the Example Code
To obtain copies of the GUI files for this example, follow these steps:
1 Set your current folder to one to which you have write access.
2 Copy the example code and display it in the Editor by issuing the following MATLAB
commands:
copyfile(fullfile(docroot, 'techdoc','creating_guis',...
'examples','tableplot.m')),...
fileattrib('tableplot.m', '+w');
edit tableplot.m
Set Up and Interact with the uitable
This example has one file, tableplot.m, that contains its main function plus two local
functions (uicontrol callbacks). The main tableplot function creates a figure and
populates it with uicontrols and one axes.
The function hides the figure's menu bar because it is not needed.
% Create a figure that will have a uitable, axes and checkboxes
figure('Position', [100, 300, 600, 460],...
'Name', 'TablePlot',... % Title figure
'NumberTitle', 'off',... % Do not show figure number
'MenuBar', 'none'); % Hide standard menu bar menus
The main tableplot function sets up the uitable immediately after loading a data
matrix into the workspace. The table's size adapts to the matrix size (matrices for
uitables must be 1-D or 2-D).
% Load some tabular data (traffic counts from somewhere)
count = load('count.dat');
tablesize = size(count); % This demo data is 24-by-3
% Define parameters for a uitable (col headers are fictional)
colnames = {'Oak Ave', 'Washington St', 'Center St'};
% All column contain numeric data (integers, actually)
colfmt = {'numeric', 'numeric', 'numeric'};](https://image.slidesharecdn.com/matlab-buildgui-150310171915-conversion-gate01/85/Matlab-GUI-470-320.jpg)
![Synchronized Data Presentations in a Programmatic GUI
14-15
% Disallow editing values (but this can be changed)
coledit = [false false false];
% Set columns all the same width (must be in pixels)
colwdt = {60 60 60};
% Create a uitable on the left side of the figure
htable = uitable('Units', 'normalized',...
'Position', [0.025 0.03 0.375 0.92],...
'Data', count,...
'ColumnName', colnames,...
'ColumnFormat', colfmt,...
'ColumnWidth', colwdt,...
'ColumnEditable', coledit,...
'ToolTipString',...
'Select cells to highlight them on the plot',...
'CellSelectionCallback',{@select_callback});
The tableplot function performs these tasks:
• Passes the count matrix to the table as the Data parameter.
• Specifies the column names using the ColumnName property
• Specifies that all columns hold numeric data using the ColumnFormat property
• Specifies that all columns have a width of 60 pixels
MATLAB always interprets the ColumnWidth property in pixels
• Provides a tooltip string for the table
• Accepts default values for most of the remaining Uitable Properties.
In the next block of code, the tableplot function sets up an axes on the right side of the
figure. It plots lines and markers in response to the user's actions.
% Create an axes on the right side; set x and y limits to the
% table value extremes, and format labels for the demo data.
haxes = axes('Units', 'normalized',...
'Position', [.465 .065 .50 .85],...
'XLim', [0 tablesize(1)],...
'YLim', [0 max(max(count))],...
'XLimMode', 'manual',...
'YLimMode', 'manual',...
'XTickLabel',...
{'12 AM','5 AM','10 AM','3 PM','8 PM'});
title(haxes, 'Hourly Traffic Counts') % Describe data set
% Prevent axes from clearing when new lines or markers are plotted](https://image.slidesharecdn.com/matlab-buildgui-150310171915-conversion-gate01/85/Matlab-GUI-471-320.jpg)

![Synchronized Data Presentations in a Programmatic GUI
14-17
% Get vectors of x,y values for each column in the selection;
for idx = 1:numel(selcols)
col = selcols(idx);
xvals = sel(:,1);
xvals(sel(:,2) ~= col) = [];
yvals = table(xvals, col)';
% Create Z-vals = 1 in order to plot markers above lines
zvals = col*ones(size(xvals));
% Plot markers for xvals and yvals using a line object
hmkrs(col).Visible = 'on';.
hmkrs(col).XData = xvals;
hmkrs(col).YData = yvals;
hmkrs(col).ZData = zvals;
end
end
The function passes the rows and columns of the user-selected cells in
eventdata.Indices and copies them into sel. For example, if the user selects all three
columns in row 3 of the table, then
eventdata =
Indices: [3x2 double]
sel =
3 1
3 2
3 3
If the user selects rows 5, 6, and 7 of columns 2 and 3, then
eventdata =
Indices: [6x2 double]
sel =
5 2
5 3
6 2
6 3
7 2
7 3
After hiding all the markers, the callback performs these tasks:
1 Identifies the unique columns that the user selected.
2 Iterates over the unique columns to find the row indices for the selection.](https://image.slidesharecdn.com/matlab-buildgui-150310171915-conversion-gate01/85/Matlab-GUI-473-320.jpg)


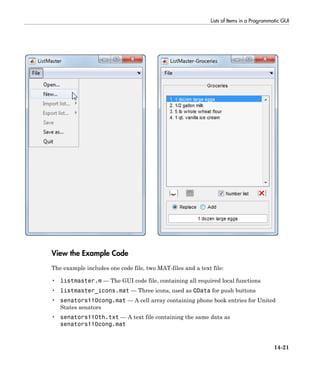


![14 Examples of GUIs Created Programmatically
14-26
Menu Item How Used Callback
Save as... Saves current List Master to a different FIG-
file
lmsaveas
Quit Exits List Master, with option to save first lmquit
After creating a blank GUI with a File menu, the listmaster function exits.
The main function sets up the figure as follows:
fh = figure('MenuBar','none', ...
'NumberTitle','off', ...
'Name','ListMaster', ...
'Tag','lmfigtag', ...
'CloseRequestFcn', @lmquit, ...
'Units','pixels', ...
'Position', pos);
Turning off the MenuBar eliminates the default figure window menus, which the
program later replaces with its own File menu. NumberTitle is turned off to eliminate a
figure number in its title bar.
Here is the code that calculates the initial position of the GUI window:
su = get(groot,'Units');
set(groot,'Units','pixels')
scnsize = get(groot,'ScreenSize');
scnsize(3) = min(scnsize(3),1280); % Limit superwide screens
figx = 264; figy = 356; % Default (resizable) GUI size
pos = [scnsize(3)/2-figx/2 scnsize(4)/2-figy/2 figx figy];
...
set(groot,'Units',su) % Restore default root screen units
The Open menu option only opens figures created by listmaster.m. Every List Master
figure has its Tag set to lmfigtag. When the program opens a FIG-file, it uses this
property value to determine that figure is a List Master GUI. If the Tag has any other
value, the program closes the figure and displays an error.
The Quit menu option closes the GUI after checking whether the figure needs to be
saved. If the contents have changed, its callback (lmquit) calls the lmsaveas callback
to give the user an opportunity to save. The figure's CloseRequestFcn also uses the
lmquit callback when the user clicks the figure's close box.](https://image.slidesharecdn.com/matlab-buildgui-150310171915-conversion-gate01/85/Matlab-GUI-482-320.jpg)


![GUI That Accepts and Returns Arguments
14-37
• The second column contains a function handle for the function,
localValidateInput, that validates the input property values.
• The third column is the local variable that holds the value of the property.
colorPalette then initializes the properties with default values.
mPaletteParent = []; % Use input property 'parent' to initialize
Process the Input Arguments
The processUserInputs helper function processes the input property-value pairs.
colorPalette calls processUserInputs before it creates the components, to
determine the parent of the components.
% Process the command line input arguments supplied when
% the GUI is invoked
processUserInputs();
1 processUserInputs sequences through the inputs, if any, and tries to match each
property name to a string in the first column of the mPropertyDefs cell array.
2 If it finds a match, processUserInputs assigns the value that was input for the
property to its variable in the third column of the mPropertyDefs cell array.
3 processUserInputs then calls the helper function specified in the second column
of the mPropertyDefs cell array to validate the value that was passed in for the
property.
Pass Output to a Caller on Returning
If a host GUI calls the colorPalette function with an output argument, it returns a
function handle that the host GUI can call to get the currently selected color.
The host GUI calls colorPalette only once. The call creates the color palette in the
specified parent and then returns the function handle.
The data definition section of the colorPalette code file creates a cell array to hold the
output:
mOutputArgs = {}; % Variable for storing output when GUI returns
Just before returning, colorPalette assigns the function handle,
mgetSelectedColor, to the cell array mOutputArgs and then assigns mOutputArgs to
varargout to return the arguments.](https://image.slidesharecdn.com/matlab-buildgui-150310171915-conversion-gate01/85/Matlab-GUI-493-320.jpg)
![14 Examples of GUIs Created Programmatically
14-38
mOutputArgs{} = @getSelectedColor;
if nargout>0
[varargout{1:nargout}] = mOutputArgs{:};
end](https://image.slidesharecdn.com/matlab-buildgui-150310171915-conversion-gate01/85/Matlab-GUI-494-320.jpg)


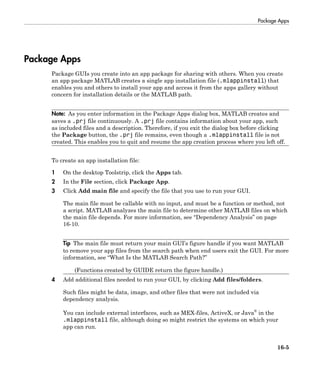


The document is a comprehensive guide on creating graphical user interfaces (GUIs) with MATLAB R2014b, providing legal and support information, revision history, and an overview of GUI structures and functionalities. It details methods for building GUIs using tools like GUIDE, including coding behaviors, managing components, and customizing layouts. Additionally, it offers instructions on saving and programming GUIs, along with discussions on compatibility and user preferences.


![Cimco edit 5 user guide[1]](https://cdn.slidesharecdn.com/ss_thumbnails/cimcoedit5userguide1-110305112440-phpapp01-thumbnail.jpg?width=640&height=640&fit=bounds)