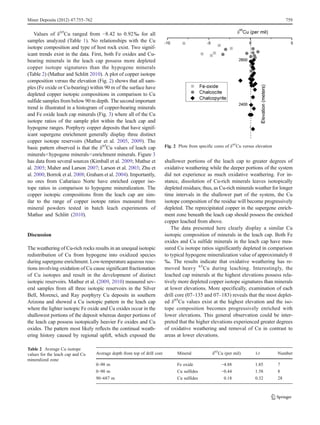
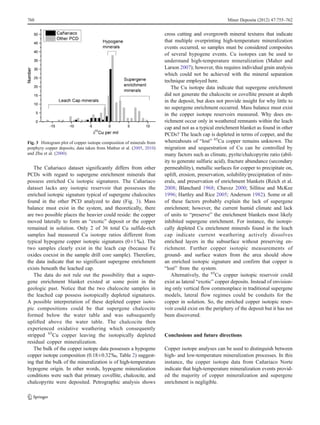
The copper isotope ratios were measured in 42 mineral separates from the Cañariaco Norte porphyry copper deposit in northern Peru. Isotopic ratios ranged from -8.42‰ to 0.61‰, with near-surface iron oxides having the most depleted values and deeper chalcocite, covellite, and chalcopyrite having more typical hypogene ratios. The data indicate that most of the chalcocite and covellite formed from high-temperature hypogene processes, with only a minor portion resulting from supergene enrichment. The lack of an enriched isotopic signature suggests little potential for an extensive supergene enrichment blanket at depth due to the weathering history.
And now for something very different:
Evidence that banded iron formations formed very rapidly
and a proposed YE correlation.
Enjoy the food for thought in this extraordinary period we are all experiencing!
Sulfide mineralization are the main resource for exploiting Pb, Zn, and Cu metals in Egypt.
Sulfide mineralization is represented by four sulfide types of the different setting, lithology and ages, namely:
i) Lead-Zinc sulphide Deposits
ii) Cu-NiCo sulphide Deposits
This type of mineralization is well represented in Abu Swayel in South Eastern Desert. The ore is closely related to mafic-ultramafic and gabbro of ophiolitic rocks.
iii) Cu-Ni sulphide deposits
This type of mineralization occurs in layered mafic-ultramafic intrusions like gabbro rocks at Akarm and El Geneina .
iv) Stratiform Massive Sulphide (Zn-Cu-Pb) Deposits
This type of mineralization is represented by a group of small lenses associated with talc deposits in South Eastern Desert at: Um Samuki, Helgit, Maakal, Atshan, Darhib, Abu Gurdi, and Egat.
SUPERGENE ENRICHMENT; Definition; Zones; Morphology of Zoning; Oxidized zone ; Supergene zone ; Gossans and Cappings; Chemical Changes Involved; Electrowinning; Formation of Copper Oxides
Residual mineral deposits; Laterites; Laterite Profile; Laterisation system; Laterite/Bauxite Conditions; Laterite-type Bauxite, Constitution of Bauxite, Types of deposits; Origin and Mode of formation; Clay (Kaolinite) Deposits; Nickel Laterite Deposits; Mineralogy and Types of lateritic nickel ore deposits; World Nickel Laterite Deposits; Processing of Ni Laterites; Example: Ni-laterites, Ni in soils in east Albania
MANGANESE ORE DEPOSITS, Sedimentary Manganese Deposits, Types of Sedimentary Manganese, Classification, Manganese Nodules, EGYPTIAN MANGANESE ORE DEPOSITS , IRON ORE DEPOSITS, Cycle of Iron , Ironstone (Sedimentary iron) Ore Deposits, Bog Iron Ore Deposits, Principal iron-bearing minerals, Geochemical stability of iron-rich minerals, World Resources Iron Deposit, EGYPTIAN IRON ORE DEPOSITS, Iron ore deposit of sedimentary nature, Sinai: Gabal Halal iron ore deposit, Aswan iron Ore Deposits, Bahariya iron Ore Deposits
Geochemistry and Genesis of Kammatturu Iron Ores of Devagiri Formation, Sandu...IJMER
The Greenstone belts of Karnataka are enriched in BIFs in Dharwar craton, where Iron
formations are confined to the basin shelf, clearly separated from the deeper-water iron formation that
accumulated at the basin margin and flanking the marine basin. Geochemical data procured in terms of
major, trace and REE are plotted in various diagrams to interpret the genesis of BIFs. Al2O3, Fe2O3 (T),
TiO2, CaO, and SiO2 abundances and ratios show a wide variation. Ni, Co, Zr, Sc, V, Rb, Sr, U, Th,
ΣREE, La, Ce and Eu anomalies and their binary relationships indicate that wherever the terrigenous
component has increased, the concentration of elements of felsic such as Zr and Hf has gone up. Elevated
concentrations of Ni, Co and Sc are contributed by chlorite and other components characteristic of basic
volcanic debris. The data suggest that these formations were generated by chemical and clastic
sedimentary processes on a shallow shelf. During transgression, chemical precipitation took place at the
sediment-water interface, whereas at the time of regression. Iron ore formed with sedimentary structures
and textures in Kammatturu area, in a setting where the water column was oxygenated.
WHAT IS VERMICULITE?; TYPICAL vermiculite PROPERTIES; GRADES OF VERMICULITE; VERMICULITE EXPANSION; Processing Vermiculite; Vermiculite Expansion; Production and Reserves of Vermiculite; Vermiculite occurrences in Gabal Hafafit area, Eastern Desert, Egypt; Uses of Vermiculite
massive type interlayer with gabbroic rocks in the Eastern Desert; Main occurrences of Ti-Fe oxide deposits in Egypt; Abu Ghalaga Ore Deposit; Abu Ghalaga ilmenite ore deposit categories ; Abu Ghalaga Mineral composition; Mining Techniques; Origins; Korabkanci titano-magnetite ore; black sand placer deposits type; Rosetta (or Rashid East); Northern Sinai Coast
Metallogenic Epoch and Province
Metallogenetic Epochs
Metallogenetic epochs, as defined above, are specific periods characterised by formation of large number of mineral deposits. It does not mean that all the mineral deposits formed during a definite metallogenetic epochs. In India the chief metallogenetic epochs were:
1. Precambrian
2. Late Palaeozoic
3. Late Mesozoic to Early Tertiary
Manganese ore deposits are widely scattered in various districts in Egypt.
They occur at some localities in Sinai Peninsula and at a few localities in the Eastern Desert.
Manganese deposits are known:
in the Um Bogma district in west central Sinai; and
in the Halaib "Elba" district in the southern portion of Eastern Desert.
In addition, minor occurrences are known in Wadi Mialik near Abu Ghosun and Ras Banas in the Southern Eastern Desert, and Wadi Abu Shaar El Qibli (Black Hill), to the north of Hurghada
Considering the importance of the healthy coral reef ecosystems to Langkawi’s economy as well as to the global coral reef biodiversity, the present study provided the baseline database regarding on distribution of heavy metals concentration (Cd, Cu, Pb) and the trend of heavy metals accumulation in Diploria Labyrinthiformis and Favia Pallida corals at Pulau Langkawi region. This report showed the level of heavy metal contamination in each of 5 years growth rate bands in both coral specie susing AAS. The averages of heavy metals concentration in Diploria Labyrinthiformis were 0.018±0.002 mg/L, 0.044±0.11 mg/L, and 0.120±0.01 mg/L for Cd, Cu, and Pb respectively. Meanwhile the concentrations of heavy metals for Favia Pallida were 0.017±0.02 mg/L, 0.088±0.004 mg/L, and 0.218±0.14 mg/L for Cd, Cu, and Pb respectively. Both species showed the low concentration and not exceeding the MPI safety level that indicated that the corals were not impacted by pollution. The trend and correlationships of the Cd, Cu, and Pb in the bands coral slab showed the increasing trend of concentration which were increased gradually from the surface (youngest) to bottom (oldest) layer for the samples.
PowerPoint Presentation prepared for the PDAC 202mining convention as an explainer tool for Major Mining companies, with a view to joint venture the Pecors Nickel, Copper, Platinum, Palladium, Gold project at Pecors lake, Ontario, Canada
Mineralization of Rare Earths, Platinum and Gold in a Sedimentary Deposit, Fo...CrimsonPublishersAMMS
Mineralization of Rare Earths, Platinum and Gold in a Sedimentary Deposit, Found Using an Indirect Method of Exploration by Eleazar Salinas-Rodríguez in Aspects in Mining & Mineral Science
Explore our most comprehensive guide on lookback analysis at SafePaaS, covering access governance and how it can transform modern ERP audits. Browse now!
As a business owner in Delaware, staying on top of your tax obligations is paramount, especially with the annual deadline for Delaware Franchise Tax looming on March 1. One such obligation is the annual Delaware Franchise Tax, which serves as a crucial requirement for maintaining your company’s legal standing within the state. While the prospect of handling tax matters may seem daunting, rest assured that the process can be straightforward with the right guidance. In this comprehensive guide, we’ll walk you through the steps of filing your Delaware Franchise Tax and provide insights to help you navigate the process effectively.
RMD24 | Debunking the non-endemic revenue myth Marvin Vacquier Droop | First ...BBPMedia1
Marvin neemt je in deze presentatie mee in de voordelen van non-endemic advertising op retail media netwerken. Hij brengt ook de uitdagingen in beeld die de markt op dit moment heeft op het gebied van retail media voor niet-leveranciers.
Retail media wordt gezien als het nieuwe advertising-medium en ook mediabureaus richten massaal retail media-afdelingen op. Merken die niet in de betreffende winkel liggen staan ook nog niet in de rij om op de retail media netwerken te adverteren. Marvin belicht de uitdagingen die er zijn om echt aansluiting te vinden op die markt van non-endemic advertising.
Remote sensing and monitoring are changing the mining industry for the better. These are providing innovative solutions to long-standing challenges. Those related to exploration, extraction, and overall environmental management by mining technology companies Odisha. These technologies make use of satellite imaging, aerial photography and sensors to collect data that might be inaccessible or from hazardous locations. With the use of this technology, mining operations are becoming increasingly efficient. Let us gain more insight into the key aspects associated with remote sensing and monitoring when it comes to mining.
What is the TDS Return Filing Due Date for FY 2024-25.pdfseoforlegalpillers
It is crucial for the taxpayers to understand about the TDS Return Filing Due Date, so that they can fulfill your TDS obligations efficiently. Taxpayers can avoid penalties by sticking to the deadlines and by accurate filing of TDS. Timely filing of TDS will make sure about the availability of tax credits. You can also seek the professional guidance of experts like Legal Pillers for timely filing of the TDS Return.
[Note: This is a partial preview. To download this presentation, visit:
https://www.oeconsulting.com.sg/training-presentations]
Sustainability has become an increasingly critical topic as the world recognizes the need to protect our planet and its resources for future generations. Sustainability means meeting our current needs without compromising the ability of future generations to meet theirs. It involves long-term planning and consideration of the consequences of our actions. The goal is to create strategies that ensure the long-term viability of People, Planet, and Profit.
Leading companies such as Nike, Toyota, and Siemens are prioritizing sustainable innovation in their business models, setting an example for others to follow. In this Sustainability training presentation, you will learn key concepts, principles, and practices of sustainability applicable across industries. This training aims to create awareness and educate employees, senior executives, consultants, and other key stakeholders, including investors, policymakers, and supply chain partners, on the importance and implementation of sustainability.
LEARNING OBJECTIVES
1. Develop a comprehensive understanding of the fundamental principles and concepts that form the foundation of sustainability within corporate environments.
2. Explore the sustainability implementation model, focusing on effective measures and reporting strategies to track and communicate sustainability efforts.
3. Identify and define best practices and critical success factors essential for achieving sustainability goals within organizations.
CONTENTS
1. Introduction and Key Concepts of Sustainability
2. Principles and Practices of Sustainability
3. Measures and Reporting in Sustainability
4. Sustainability Implementation & Best Practices
To download the complete presentation, visit: https://www.oeconsulting.com.sg/training-presentations
India Orthopedic Devices Market: Unlocking Growth Secrets, Trends and Develop...Kumar Satyam
According to TechSci Research report, “India Orthopedic Devices Market -Industry Size, Share, Trends, Competition Forecast & Opportunities, 2030”, the India Orthopedic Devices Market stood at USD 1,280.54 Million in 2024 and is anticipated to grow with a CAGR of 7.84% in the forecast period, 2026-2030F. The India Orthopedic Devices Market is being driven by several factors. The most prominent ones include an increase in the elderly population, who are more prone to orthopedic conditions such as osteoporosis and arthritis. Moreover, the rise in sports injuries and road accidents are also contributing to the demand for orthopedic devices. Advances in technology and the introduction of innovative implants and prosthetics have further propelled the market growth. Additionally, government initiatives aimed at improving healthcare infrastructure and the increasing prevalence of lifestyle diseases have led to an upward trend in orthopedic surgeries, thereby fueling the market demand for these devices.
Enterprise Excellence is Inclusive Excellence.pdfKaiNexus
Enterprise excellence and inclusive excellence are closely linked, and real-world challenges have shown that both are essential to the success of any organization. To achieve enterprise excellence, organizations must focus on improving their operations and processes while creating an inclusive environment that engages everyone. In this interactive session, the facilitator will highlight commonly established business practices and how they limit our ability to engage everyone every day. More importantly, though, participants will likely gain increased awareness of what we can do differently to maximize enterprise excellence through deliberate inclusion.
What is Enterprise Excellence?
Enterprise Excellence is a holistic approach that's aimed at achieving world-class performance across all aspects of the organization.
What might I learn?
A way to engage all in creating Inclusive Excellence. Lessons from the US military and their parallels to the story of Harry Potter. How belt systems and CI teams can destroy inclusive practices. How leadership language invites people to the party. There are three things leaders can do to engage everyone every day: maximizing psychological safety to create environments where folks learn, contribute, and challenge the status quo.
Who might benefit? Anyone and everyone leading folks from the shop floor to top floor.
Dr. William Harvey is a seasoned Operations Leader with extensive experience in chemical processing, manufacturing, and operations management. At Michelman, he currently oversees multiple sites, leading teams in strategic planning and coaching/practicing continuous improvement. William is set to start his eighth year of teaching at the University of Cincinnati where he teaches marketing, finance, and management. William holds various certifications in change management, quality, leadership, operational excellence, team building, and DiSC, among others.
Affordable Stationery Printing Services in Jaipur | Navpack n PrintNavpack & Print
Looking for professional printing services in Jaipur? Navpack n Print offers high-quality and affordable stationery printing for all your business needs. Stand out with custom stationery designs and fast turnaround times. Contact us today for a quote!
Business Valuation Principles for EntrepreneursBen Wann
This insightful presentation is designed to equip entrepreneurs with the essential knowledge and tools needed to accurately value their businesses. Understanding business valuation is crucial for making informed decisions, whether you're seeking investment, planning to sell, or simply want to gauge your company's worth.
Falcon stands out as a top-tier P2P Invoice Discounting platform in India, bridging esteemed blue-chip companies and eager investors. Our goal is to transform the investment landscape in India by establishing a comprehensive destination for borrowers and investors with diverse profiles and needs, all while minimizing risk. What sets Falcon apart is the elimination of intermediaries such as commercial banks and depository institutions, allowing investors to enjoy higher yields.
Premium MEAN Stack Development Solutions for Modern BusinessesSynapseIndia
Stay ahead of the curve with our premium MEAN Stack Development Solutions. Our expert developers utilize MongoDB, Express.js, AngularJS, and Node.js to create modern and responsive web applications. Trust us for cutting-edge solutions that drive your business growth and success.
Know more: https://www.synapseindia.com/technology/mean-stack-development-company.html
Premium MEAN Stack Development Solutions for Modern Businesses
Mathur2012
1. LETTER
Use of Cu isotopes to distinguish primary and secondary Cu
mineralization in the Cañariaco Norte porphyry copper
deposit, Northern Peru
Ryan Mathur & Joaquin Ruiz & Michael J. Casselman &
Peter Megaw & Robert van Egmond
Received: 11 December 2011 /Accepted: 15 August 2012 /Published online: 4 September 2012
Cañariaco Norte porphyry copper deposit in northern Peru
occurs in chalcocite and covellite-rich veins and dissemina-
tions that exist from the surface to depths greater than 1 km.
The overall range of Cu isotopic ratios of 42 mineral sepa-
rates from Cañariaco varies from −8.42 to 0.61‰, with
near-surface chalcocite and Fe oxides having isotopically
depleted values compared to chalcocite, covellite, and chal-
copyrite from deeper levels. The majority (34 of 36) of
measured Cu sulfides have a typical hypogene copper iso-
tope composition of δ65
Cu00.18±0.38‰, with no enriched
isotopic signature existing in the Cañariaco Norte sulfide
data. Thus, the copper isotope data indicate that most of the
chalcocite and covellite formed from high-temperature hypo-
gene mineralization processes and that only a minor portion of
the deposit is enriched by supergene processes. The nonexis-
tence of an enriched δ65
Cu reservoir suggest the presence of
an undiscovered lateral/exotic Cu occurrence that enriched
65
Cu that remained in solution during weathering. Regardless
of the cause, the comparative analysis of the Cu isotope data-
set reveals that little exploration potential for an extensive
supergene enrichment blanket exists because the weathering
history at Cañariaco Norte was not conducive to preservation
of enriched Cu at depth beneath the leach cap.
Keywords Cu isotope . Supergene . Hypogene . Porphyry
copper . Cañariaco . Peru
Introduction
The application of Cu isotopes to understanding both high-
and low-temperature aqueous processes is gaining momentum
(Kimball et al. 2009; Mathur et al. 2005, 2009, 2010; Mathur
and Schlitt 2010; Asael et al. 2007, 2009; Haest et al. 2009;
Larson et al. 2003; Maher and Larson 2007; Rouxel et al.
2004; Li et al. 2010; Palacios et al. 2011). Low-temperature
aqueous reactions clearly lead to high fractionation of Cu
isotopes in residual minerals, aqueous solutions, and the min-
erals precipitated from them. Thus, the deposition of Cu from
low-temperature aqueous solutions can be identified by highly
fractionated Cu isotope ratios in minerals or solutions as
demonstrated by several studies of actively weathering and
preserved weathered rocks (Mathur et al. 2005, 2009, 2010;
2012; Haest et al. 2009; Mirnejad et al. 2010; Palacios et al.
2011). All of these studies have demonstrated that the redox
reactions occurring during weathering lead to patterns in the
copper isotope signatures of minerals found in vertical profiles
in supergene ore bodies. In contrast, copper minerals precip-
itated from higher-temperature fluids show much lower frac-
tionation (Seo et al. 2007; Maher and Larson 2007; Graham et
al. 2004; Ikehata et al. 2011).
The Cañariaco system possesses abundant chalcocite-
dominant veins that occur from near surface to great depths.
However, despite having mineralogy throughout that
appeared favorable for copper recovery by solvent extrac-
tion, it was found that only the most near-surface chalcocite
ores responded well to this treatment. This suggested not
only that both hypogene and supergene chalcocite were
present, but also that chalcocite genesis also affects metal-
lurgical behavior. In order to resolve this question and
Editorial handling: F. Barra
R. Mathur (*)
Juniata College,
Huntingdon, PA 16652, USA
e-mail: mathur@juniata.edu
J. Ruiz
University of Arizona,
Tucson, AZ 85721, USA
M. J. Casselman :P. Megaw :R. van Egmond
Candente Copper Corp,
Vancouver, Canada
Miner Deposita (2012) 47:755–762
DOI 10.1007/s00126-012-0439-y
# Springer-Verlag 2012
Abstract A significant proportion of the copper in the
2. understand the potential extent of supergene effects in the
Cañariaco deposit, the copper isotopic composition was
measured on 42 mineral separates from drill core intercepts
ranging from the near surface leached, through the inter-
preted supergene enrichment zone to deep hypogene zones.
Geology
The Cañariaco project contains a major porphyry–copper–
gold deposit, Cañariaco Norte, and two porphyry–copper–
gold-mineralized centers that are at a prospect stage of
evaluation, Cañariaco Sur and Quebrada Verde.
The Cañariaco property is located at latitude 06°05′ South
and longitude 79°17′ West, in the Western Cordillera of the
Peruvian Andes, in the Cañaris District of the Province of
Ferreñafe, Department of Lambayeque of northwestern Peru.
The property is situated approximately 700 km northwest of
Lima, the capital of Peru, and approximately 110 km to the
northeast of the city of Chiclayo. The property is located at
elevations between 2,700 and 3,600 m above sea level and
encompasses both tropical forest in the Cañariaco River Val-
ley and open grassland on ridges and plains at higher eleva-
tions. The deposit is located on the west side of the Cañariaco
River valley. The topography of the deposit area is very
rugged and is made up of a series of steep valleys and narrow
ridges. There is significant rainfall during the November to
March rainy season. The water table is at or near surface.
Copper was first discovered at Cañariaco Norte in the
early 1970s during a regional exploration program carried
out by the Peruvian Servicio National de Geología y Min-
ería (“INGEMMET”), in cooperation with a British Geolog-
ical Survey Team. Exploration was sporadic with phases of
exploration and drilling in the 1970s and 1990s. Candente
Resource Corp acquired the Cañariaco property in 2002 and
did extensive exploration and drilling from 2004 to 2010.
The Cañariaco Norte deposit has a resource of 750 Mtonne
at 0.46 % Cu, 0.07 g/tonne Au, and 1.80 g/tonne Ag.
Cañariaco Norte is an example of a primary porphyry–
copper–gold system. The Cañariaco Norte Early to Late
Tertiary polyphase intrusive-breccia complex is approxi-
mately 1.7 km in strike extent, 1.1 km wide, and has
been drilled to a depth of about 770 m. The complex has
intruded Early Tertiary volcanic units of the Llama and
Porculla Formations of the Calipuy Group. Three major
intrusive generations have been identified, a crowded
quartz–feldspar porphyry, a biotite–feldspar porphyry,
and a coarse quartz porphyry. These intrusive units are
cross-cut by feldspar porphyry dykes. Three breccia bod-
ies that post-date the intrusive rocks are also recognized:
hydrothermal breccias, tourmaline breccias, and polymic-
tic breccias.
Copper mineralization was introduced during series of
events closely following the emplacement of each of the
three major intrusive units and the polymictic breccia unit.
In general, the highest copper grades (>0.5 % Cu) occur in
the biotite–feldspar porphyry and polymictic breccia units.
Intermediate copper grades (0.35 to 0.5 % Cu) are most
common in the hydrothermal breccia and the coarse quartz
porphyry, and the lowest grades (0.2 to 0.35 % Cu) domi-
nate in the crowded quartz feldspar porphyry, tourmaline
breccia, and volcanic host rocks.
Alteration forms distinct concentric zones with central
potassic alteration; central to intermediate, overlapping, and
partly overprinting phyllic, argillic, and advanced argillic alter-
ation; and fringing propylitic and minor silicic alteration. Alter-
ation development is directly related to the density of fracturing
in the hosting lithologies and brecciation in the polymictic
breccia unit. Locally, alteration distribution and intensity are
controlled by northeast- and northwest-trending faults.
Mineralization occurs primarily as disseminations and in
fractures, sulfide and quartz veins, faults, and breccias.
Fracture density is the single most important factor influ-
encing copper grades, although breccias and faults can lo-
cally be important.
Three main zones have been recognized in the deposit: a
variable-thickness leached cap, minor supergene copper min-
eralization under the leached cap, and hypogene copper miner-
alization; the main component of the deposit. Hypogene copper
mineralization consists mainly of chalcopyrite, chalcocite, and
covellite, with lesser enargite and minor bornite, tennantite, and
digenite. Supergene copper consists of chalcocite and covellite.
Sampling and methods
Figure 1 shows the location of the sampled drill holes and
shows that samples were taken from Cu-rich ores vertically
from the leach cap through the supergene and hypogene zones
within the major igneous intrusion phases. Mineralization
commonly occurred as veins and fine-grained mineral dissem-
inations. Minerals from veins were handpicked, whereas rocks
containing disseminated sulfide mineralization were either
powdered and handpicked, or the whole rock powder (<250-
μm fraction) was used. X-ray diffraction (XRD) of the pure
mineral powders was done to verify the minerals present
where approximately 0.2 g of powder was used for analysis
on a Scintag Pad V X-ray powder diffractometer. XRD scans
were completed in slow, step scan mode. Table 1 reports the
major sulfide or Fe oxide minerals present.
Potentially, different copper minerals could possess dif-
ferent Cu isotopic compositions caused by either high- or
low-temperature aqueous processes. Due to the disseminat-
ed nature of the ores, multiple copper-bearing phases exist
in the samples as shown in Table 1. To test for isotopic
756 Miner Deposita (2012) 47:755–762
3. heterogeneity in the samples, different mineral separates
were analyzed from two samples (samples with an asterisk
in Table 1). Regardless of the aliquot, the copper isotopic
composition remained consistent, and copper isotope values
of the minerals overlap within reported error. For instance,
the mineral powder for sample 07–137-depth 620 m has the
same δ65
Cu0−0.07±0.14‰ as the pure sulfide separate
obtained through handpicking δ65
Cu00.15±0.14‰.
The minerals were dissolved in heated aqua regia (approx-
imately 100 °C) in Teflon beakers for approximately 18 h. All
samples possessed a small amount of nondissolved silicate
residue because the handpicking did not completely eliminate
all silicate and other trace minerals. The XRD did not detect
the silicate minerals because they were <3 % of the powder.
The presence of silicates or other phases that could provide
ions into solution could impact measurements (Pribil et al.
2009; Marechal and Albarede 2002) on the multicollector
inductively coupled mass spectrometer (MC-ICP-MS); there-
fore, ion exchange chromatography, with the use of the MP-1
BioRad 200–400 mesh size resin, was used to separate Cu
from the samples following the procedure described by
Mathur et al. (2005), Marechal et al. (1999), and Chapman
Fig. 1 Geologic map and drill
hole location for samples
Miner Deposita (2012) 47:755–762 757
4. et al. (2006). All reported results have yields of Cu from the
columns at greater than 90 %. Concentrations of Fe, Cu, Mg,
and Na were measured on an inductively coupled plasma
atomic emission spectrometer at the Pennsylvania State Uni-
versity Materials Characterization Lab to determine the
amount of ions needed for ion exchange chromatography.
The volume of ion exchange resin used here (1.6–1.8 ml)
can accommodate approximately 2,000 meq. Fe and Cu were
the dominant ions in solution by at least one order of magni-
tude in comparison to the other ions. In order to ensure
chromatographic separation of Cu, no more than 900 meq of
all measured ions was loaded onto the ion exchange resins.
The samples were measured on the MC-ICP-MS at
Washington State University. All samples were diluted to
approximately 100 ppb and produced a 1- to 1.8-V 65
Cu
signal on the instrument. Background peaks were measured
on peak and subtracted out of each analysis. The combined
background of the 2 % nitric acid the solutions were run
with and procedural blanks (running acid through the col-
umn without samples and measuring the Cu) never reached
a value greater than 0.001 V for 65
Cu. Thirty ratios were
collected for each block and two blocks were measured for
each sample. Mass bias was corrected using the standard–
sample–standard bracketing technique. The NIST 976 stan-
dard was used and isotope ratios are reported as:
d65
Cu ¼
65Cu
63Cu
sample
65Cu
63Cu
standard
1
#
1; 000
Isobaric interferences from Mg and Na were checked
because elevated concentrations of these and other elements
can cause matrix effects and result in spurious data
(Marechal and Albarede 2002; Marechal et al. 1999; Pribil
et al. 2009; Mathur et al. 2005; Zhu et al. 2000). None of the
samples contained significant concentrations of the possible
isobars. Measurement errors for these values are in the sixth
decimal place for all reported values. This does not represent
the true instrument error. In order to assess the error, we
analyzed the variation of the standard over 300 times where
the 2 σ error is 0.14‰.
Results
Mineralogy and isotope data are presented in Table 1. The
mineralogy of the samples is typical of those found in
leached caps, hypogene and supergene zones in porphyry
copper deposits (Sillitoe 2010; Titley 1981; Titley and
Beane 1981; Seedorff et al. 2008). Reported mineral
phases were identified from XRD peaks which have ap-
proximately 5 % resolution. Therefore, the reported min-
eral phases represent the dominant Cu sulfide species in
the diffraction pattern. At the micron scale, all of the Cu
species most likely exist throughout the deposit (and in all
of the samples analyzed).
Table 1 Sample location, mineralogy (hem hematite, goe goethite, cpy
chalcopyrite, py pyrite, cc chalcocite, dj djurleite, cv covellite) and Cu
isotope measurements
Drill core Elevation (m) Mineralogy δ65
Cu (per mil)
07–135 2,933 hem/goe −3.74
07–135 2,906 hem/goe −2.29
07–146 2,865 hem/goe −4.31
07–183 2,856 hem/goe −5.81
07–183 2,842 hem/goe −4.69
07–200 2,952 hem/goe −8.42
07–200a
2,952 hem/goe −8.21
004–008 2,702 cc+cpy 0.10
004–008 2,657 cc+cpy 0.12
004–008 2,833 cc+cpy 0.06
004–008 2,754 cc+cpy 0.08
005–033 2,624 cc+cpy 0.18
07–103 2,861 cc −0.43
07–135 2,903 cc 0.33
07–135 2,852 cpy+cc −3.31
07–146 2,841 cc 0.50
07–183 2,822 cc 0.58
004–001 2,897 dj −2.98
004–001 2,876 dj 0.92
004–001 2,867 dj 0.32
005–033 2,573 cc+cv 0.14
006–74 2,769 cpy+py 0.31
006–74 2,724 cpy 0.37
006–74 2,619 cpy+py 0.16
07–135 2,788 cpy 0.06
07–135 2,737 cpy 0.29
07–135 2,633 cpy −0.03
07–135 2,617 cpy −1.20
07–135 2,398 cpy 0.10
07–135 2,684 cpy 0.45
07–135 2,627 cpy+cv 0.30
07–135 2,589 cpy+cv 0.61
07–135 2,536 cpy 0.55
07–137 2,596 cpy+py 0.07
07–137 2,310 cpy 0.15
07–137a
2,310 cpy −0.07
07–183 2,802 cpy 0.41
07–183 2,668 cpy 0.28
07–183 2,659 cpy+cv 0.20
07–183 2,573 cpy+cv 0.37
07–183 2,468 cpy+cv 0.32
07–183 2,366 cpy 0.42
07–183 2182 cpy 0.32
a
indicates samples of rock powder replicates
758 Miner Deposita (2012) 47:755–762
5. Values of δ65
Cu ranged from −8.42 to 0.92‰ for all
samples analyzed (Table 1). No relationships with the Cu
isotope composition and type of host rock exist. Two signif-
icant trends exist in the data. First, both Fe oxides and Cu-
bearing minerals in the leach cap possess more depleted
copper isotope signatures than the hypogene minerals
(Table 2) (Mathur and Schlitt 2010). A plot of copper isotope
composition versus the elevation (Fig. 2) shows that all sam-
ples (Fe oxide or Cu-bearing) within 90 m of the surface have
depleted copper isotopic compositions in comparison to Cu
sulfide samples from below 90 m depth. The second important
trend is illustrated in a histogram of copper-bearing minerals
and Fe oxide leach cap minerals (Fig. 3) where all of the Cu
isotope ratios of the sample plot within the leach cap and
hypogene ranges. Porphyry copper deposits that have signif-
icant supergene enrichment generally display three distinct
copper isotope reservoirs (Mathur et al. 2005, 2009). The
basic pattern observed is that the δ65
Cu values of leach cap
mineralshypogene mineralsenrichment minerals. Figure 3
has data from several sources (Kimball et al. 2009; Mathur et
al. 2005; Maher and Larson 2007; Larson et al. 2003; Zhu et
al. 2000; Borrok et al. 2008; Graham et al. 2004). Importantly,
no ores from Cañariaco Norte have enriched copper iso-
tope ratios in comparison to hypogene mineralization. The
copper isotopic compositions from the leach cap are sim-
ilar to the range of copper isotope ratios measured from
mineral powders tested in batch leach experiments of
Mathur and Schlitt (2010).
Discussion
The weathering of Cu-rich rocks results in an unequal isotopic
redistribution of Cu from hypogene into oxidized species
during supergene enrichment. Low-temperature aqueous reac-
tions involving oxidation of Cu cause significant fractionation
of Cu isotopes and result in the development of distinct
isotopic reservoirs. Mathur et al. (2009, 2010) measured sev-
eral samples from all three isotopic reservoirs in the Silver
Bell, Morenci, and Ray porphyry Cu deposits in southern
Arizona and showed a Cu isotopic pattern in the leach cap
where the lighter isotopic Fe oxide and Cu oxides occur in the
shallowest portions of the deposit whereas deeper portions of
the leach cap possess isotopically heavier Fe oxides and Cu
oxides. The pattern most likely reflects the continual weath-
ering history caused by regional uplift, which exposed the
shallower portions of the leach cap to greater degrees of
oxidative weathering while the deeper portions of the system
did not experience as much oxidative weathering. For in-
stance, dissolution of Cu-rich minerals leaves isotopically
depleted residues; thus, as Cu-rich minerals weather for longer
time intervals in the shallower part of the system, the Cu
isotope composition of the residue will become progressively
depleted. The reprecipitated copper in the supergene enrich-
ment zone beneath the leach cap should possess the enriched
copper leached from above.
The data presented here clearly display a similar Cu
isotopic composition of minerals in the leach cap. Both Fe
oxides and Cu sulfide minerals in the leach cap have mea-
sured Cu isotope ratios significantly depleted in comparison
to typical hypogene mineralization value of approximately 0
‰. The results indicate that oxidative weathering has re-
moved heavy 65
Cu during leaching. Interestingly, the
leached cap minerals at the highest elevations possess rela-
tively more depleted copper isotope signatures than minerals
at lower elevations. More specifically, examination of each
drill core (07–135 and 07–183) reveals that the most deplet-
ed δ65
Cu values exist at the highest elevation and the iso-
tope composition becomes progressively enriched with
lower elevations. This general observation could be inter-
preted that the higher elevations experienced greater degrees
of oxidative weathering and removal of Cu in contrast to
areas at lower elevations.
Table 2 Average Cu isotope
values for the leach cap and Cu
mineralized zone
Average depth from top of drill core Mineral δ65
Cu (per mil) 1σ Number
0–90 m Fe oxide −4.88 1.85 7
0–90 m Cu sulfides −0.44 1.58 8
90–687 m Cu sulfides 0.18 0.32 28
Fig. 2 Plots from specific cores of δ65
Cu versus elevation
Miner Deposita (2012) 47:755–762 759
6. The Cañariaco dataset significantly differs from other
PCDs with regard to supergene enrichment minerals that
possess enriched Cu isotopic signatures. The Cañariaco
dataset lacks any isotopic reservoir that possesses the
enriched isotopic signature typical of supergene chalcocites
found in the other PCD analyzed to date (Fig. 3). Mass
balance must exist in the system, and theoretically, there
are two possible places the heavier could reside: the copper
moved laterally to form an “exotic” deposit or the copper
remained in solution. Only 2 of 36 total Cu sulfide-rich
samples had measured Cu isotope ratios different from
typical hypogene copper isotopic signatures (0±1‰). The
two samples clearly exist in the leach cap (because Fe
oxides coexist in the sample drill core sample). Therefore,
the data indicate that no significant supergene enrichment
exists beneath the leached cap.
The data do not rule out the possibility that a super-
gene enrichment blanket existed at some point in the
geologic past. Notice that the two chalcocite samples in
the leached cap possess isotopically depleted signatures.
A possible interpretation of these depleted copper isoto-
pic compositions could be that supergene chalcocite
formed below the water table and was subsequently
uplifted above the water table. The chalcocite then
experienced oxidative weathering which consequently
stripped 65
Cu copper leaving the isotopically depleted
residual copper mineralization.
The bulk of the copper isotope data possesses a hypogene
copper isotope composition (0.18±0.32‰, Table 2) suggest-
ing that the bulk of the mineralization is of high-temperature
hypogene origin. In other words, hypogene mineralization
conditions were such that primary covellite, chalcocite, and
chalcopyrite were deposited. Petrographic analysis shows
cross cutting and overgrowth mineral textures that indicate
that multiple overprinting high-temperature mineralization
events occurred, so samples must be considered composites
of several hypogene events. Cu isotopes can be used to
understand high-temperature mineralization (Maher and
Larson 2007); however, this requires individual grain analysis
which could not be achieved with the mineral separation
technique employed here.
The Cu isotope data indicate that supergene enrichment
did not generate the chalcocite or covellite present at depth
in the deposit, but does not provide insight for why little to
no supergene enrichment occurred. Mass balance must exist
in the copper isotope reservoirs measured. Why does en-
richment occur only in weathered remnants within the leach
cap and not as a typical enrichment blanket as found in other
PCDs? The leach cap is depleted in terms of copper, and the
whereabouts of “lost” 65
Cu copper remains unknown. The
migration and sequestration of Cu can be controlled by
many factors such as climate, pyrite/chalcopyrite ratio (abil-
ity to generate sulfuric acid), fracture abundance (secondary
permeability), metallic surfaces for copper to precipitate on,
uplift, erosion, preservation, solubility/precipitation of min-
erals, and preservation of enrichment blankets (Reich et al.
2008; Blanchard 1968; Chavez 2000; Sillitoe and McKee
1996; Hartley and Rice 2005; Anderson 1982). Some or all
of these factors probably explain the lack of supergene
enrichment; however, the current humid climate and lack
of units to “preserve” the enrichment blankets most likely
inhibited supergene enrichment. For instance, the isotopi-
cally depleted Cu enrichment minerals found in the leach
cap indicate current weathering actively dissolves
enriched layers in the subsurface without preserving en-
richment. Further copper isotopic measurements of
ground- and surface waters from the area should show
an enriched isotopic signature and confirm that copper is
“lost” from the system.
Alternatively, the 65
Cu copper isotopic reservoir could
exist as lateral “exotic” copper deposits. Instead of envision-
ing only vertical flow commonplace in traditional supergene
models, lateral flow regimes could be conduits for the
copper in solution. So, the enriched copper isotopic reser-
voir could exist on the periphery of the deposit but it has not
been discovered.
Conclusions and future directions
Copper isotope analyses can be used to distinguish between
high- and low-temperature mineralization processes. In this
instance, the copper isotope data from Cañariaco Norte
indicate that high-temperature mineralization events provid-
ed the majority of copper mineralization and supergene
enrichment is negligible.
Fig. 3 Histogram plot of copper isotope composition of minerals from
porphyry copper deposits; data taken from Mathur et al. (2005, 2010)
and Zhu et al. (2000)
760 Miner Deposita (2012) 47:755–762
7. The implications possess a twofold significance for ex-
ploration geology and hydrometallurgy: (1) From an explo-
ration geologic standpoint, the lack of a supergene blanket
throughout the deposit eliminates the need to explore for
horizontal copper mineralization. However, the data could
be congruent with the existence of lateral flow of copper and
the existence of “exotic” copper deposits trapped down-
stream by a suitable reductant. (2) From a hydrometallugical
standpoint, process of the ores should focus on treating
hypogene mineral assemblages.
In order to further augment the dataset collected here,
copper isotope measurements of fluids actively weathering
the deposit would be ideal. The solutions should possess a
relatively enriched copper isotopic signature. Equally im-
portant in understanding the overall mass balance of copper
in the system would be copper isotopic measurements from
soils derived from the weathering of the igneous rocks at
Cañariaco Norte.
Acknowledgments We would like to thank Candente Resources for
their financial support and willingness to supply relevant samples with
excellent geologic context. We also thank the editor, M. Reich, and two
other reviewers for helpful comments and constructive criticism during
the editing of this document.
References
Anderson JA (1982) Characteristics of leached capping and techniques
of appraisal. Advances in geology of porphyry copper deposits;
southwestern North America. Univ. Ariz. Press, Tucson
Asael D, Matthews A, Bar-Matthews M, Halicz L (2007) Copper
isotope fractionation in sedimentary copper mineralization (Timna
Valley, Israel). Chem Geol 243(3–4):238–254
Asael D, Matthews A, Oszczepalski S, Bar-Matthews M, Halicz L
(2009) Fluid speciation controls of low temperature copper iso-
tope fractionation applied to the Kupferschiefer and Timna ore
deposits. Chem Geol 262(3–4):147–158
Blanchard R (1968) Interpretation of leached outcrops. Nevada Bureau
of Mines, Bulletin
Borrok DM, Nimick DA, Wanty RB, Ridley WI (2008) Isotopic
variations of dissolved copper and zinc in stream waters affected
by historical mining. Geochim Cosmochim Acta 72(2):329–344
Chapman JB, Mason TFD, Weiss DJ, Coles BJ, Wilkinson JJ (2006)
Chemical separation and isotopic variations of Cu and Zn from
five geological reference materials. Geostand Geoanalytical Res
30(1):5–16
Chavez WX (2000) Supergene oxidation of copper deposits; zoning
and distribution of copper oxide minerals. SEG Newsletter 41
(1):10–21
Graham S, Pearson N, Jackson S, Griffin W, O'Reilly SY (2004)
Tracing Cu and Fe from source to porphyry; in situ determination
of Cu and Fe isotope ratios in sulfides from the Grasberg Cu-Au
deposit. Chem Geol 207(3–4):147–169
Haest M, Muchez P, Petit JCJ, Vanhaecke F (2009) Cu isotope ratio
variations in the Dikulushi Cu-Ag deposit, DRC: of primary
origin or induced by supergene reworking. Econ Geol 104
(7):1055–1064. doi:10.2113/gsecongeo.104.7.1055
Hartley AJ, Rice CM (2005) Controls on supergene enrichment of
porphyry copper deposits in the Central Andes: a review and
discussion. Miner Deposita 40(5):515–525
Ikehata K, Notsu K, Hirata T, Navarrete JU, Borrok DM, Viveros M,
Ellzey JT (2011) Copper isotope characteristics of copper-rich
minerals from Besshi-type volcanogenic massive sulfide deposits,
Japan, determined using a femtosecond LA-MC-ICM-MS. Econ
Geol 106(2):307–316. doi:10.2113/econgeo.106.2.307
Kimball BE, Mathur R, Dohnalkova AC, Wall AJ, Runkel RL, Brantley
SL (2009) Copper isotope fractionation in acid mine drainage. Geo-
chim Cosmochim Acta 73(5):1247–1263
Larson PB, Maher K, Ramos FC, Chang Z, Gaspar M, Meinert LD
(2003) Copper isotope ratios in magmatic and hydrothermal ore-
forming environments. Chem Geol 201(3–4):337–350
Li W, Jackson SE, Pearson NJ, Graham S (2010) Copper isotopic
zonation in the Northparkes porphyry Cu-Au deposit, SE Aus-
tralia. Geochimica et Cosmochimica Acta 74(14):4078–4096
Maher KC, Larson PB (2007) Variation in copper isotope ratios and
controls on fractionation in hypogene skarn mineralization at
Coroccohuayco and Tintaya, Peru. Econ Geol 102(2):225–237.
doi:10.2113/gsecongeo.102.2.225
Marechal C, Albarede F (2002) Ion-exchange fractionation of copper
and zinc isotopes. Geochim Cosmochim Acta 66(9):1499–1509
Marechal CN, Telouk P, Albarede F (1999) Precise analysis of copper
and zinc isotopic compositions by plasma-source mass spectrom-
etry. Chem Geol 156(1–4):251–273
Mathur R, Schlitt WJ (2010) Identification of the dominant Cu ore minerals
providing soluble copper at Cañariaco, Peru through Cu isotope anal-
yses of batch leach experiments. Hydrometallurgy 101(1–2):15–19
Mathur R, Ruiz J, Titley S, Liermann L, Buss H, Brantley SL (2005)
Cu isotopic fractionation in the supergene environment with and
without bacteria. Geochim Cosmochim Acta 69(22):5233–5246
Mathur R, Titley S, Barra F, Brantley S, Wilson M, Phillips A,
Munizaga F, Maksaev V, Vervoort J, Hart G (2009) Exploration
potential of Cu isotope fractionation in porphyry copper deposits.
J Geochem Explor 102(1):1–6
Mathur R, Dendas M, Titley S, Phillips A (2010) Patterns in the copper
isotope composition of minerals in porphyry copper deposits in
Southwestern United States. Econ Geol 105(8):1457–1467
Mathur R, Jin L, Prush V, Paul J, Ebersole C, Fornadel A, Williams JZ,
Brantley S (2012) Cu isotopes and concentrations during weath-
ering of black shale of the Marcellus Formation, Huntingdon
County, Pennsylvania (USA). Chem Geol 304–305:175–184.
doi:10.1016/j.chemgeo.2012.02.015
Mirnejad H, Mathur R, Einali M, Dendas M, Alirezaei S (2010) A
comparative copper isotope study of porphyry copper deposits in
Iran. Geochem Explor Environ Anal 10(4):413–418
Palacios C, Rouxel O, Reich M, Cameron E, Leybourne M (2011)
Pleistocene recycling of copper at a porphyry system, Atacama
Desert, Chile: Cu isotope evidence. Miner Deposita 46(1):1–7.
doi:10.1007/s00126-010-0315-6
Pribil MJ, Wanty RB, Ridley WI, Borrok DM (2009) Influence of
sulfur-bearing polyatomic species on high precision measure-
ments of Cu isotopic composition. Chem Geol 272(1–4):49–54
Reich M, Palacios C, Parada MA, Fehn U, Cameron EM, Leybourne
MI, Zuniga A (2008) Atacamite formation by deep saline waters
in copper deposits from the Atacama Desert, Chile: evidence from
fluid inclusions, ground water geochemistry, TEM, and 36
Cl data.
Miner Deposita 43(6):663–675
Rouxel O, Fouquet Y, Ludden JN (2004) Copper isotope systematics of
the Lucky Strike, Rainbow, and Logatchev sea-floor hydrother-
mal fields on the mid-Atlantic ridge. Econ Geol 99(3):585–600.
doi:10.2113/99.3.585
Seedorff E, Barton MD, Stavast WJA, Maher DJ (2008) Root zones of
porphyry systems: extending the porphyry model to depth. Econ
Geol 103(5):939–956. doi:10.2113/gsecongeo.103.5.939
Miner Deposita (2012) 47:755–762 761
8. Seo JH, Lee SK, Lee I (2007) Quantum chemical calculations of
equilibrium copper (I) isotope fractionations in ore-forming flu-
ids. Chem Geol 243(3–4):225–237
Sillitoe RH (2010) Porphyry copper systems. Economic Geology 105
(1):3–41. doi:10.2113/gsecongeo.105.1.3
Sillitoe RH, McKee EH (1996) Age of supergene oxidation and en-
richment in the Chilean porphyry copper province. Econ Geol 91
(1):164–179. doi:10.2113/gsecongeo.91.1.164
Titley SR (1981) Porphyry copper. Am Sci 69(6):632–638
Titley SR, Beane RE (1981) Porphyry copper deposits: Part I, geologic
settings, petrology, and tectogenesis. Economic geology; seventy-
fifth anniversary volume; 1905–1980. Econ. Geol. Publ. Co
Zhu XK, O'Nions RK, Guo Y, Belshaw NS, Rickard D (2000) Deter-
mination of natural Cu-isotope variation by plasma-source mass
spectrometry: implications for use as geochemical tracers. Chem
Geol 163(1–4):139–149
762 Miner Deposita (2012) 47:755–762