Maths.pptx
•Download as PPTX, PDF•
0 likes•282 views
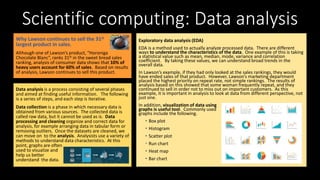
Data analysis involves several iterative phases including data collection from various sources, data processing and cleaning to organize and correct data, and analysis of the cleaned datasets using various methods to understand characteristics. Visualization using graphs is also an important analysis tool. For example, Lawson continues to sell one of its products ranked 31st in sales because exploratory data analysis of consumer data showed that 10% of heavy users accounted for 60% of sales.
Report
Share
Report
Share

Recommended
Data mining
- Data mining involves discovering novel patterns from large databases using algorithms and computers. It aims to find hidden patterns in datasets by analyzing attribute correlations.
- Common data mining tasks include classification, regression, clustering, association analysis, and anomaly detection. These can be used to solve problems like product recommendations, student enrollment predictions, and fraud detection.
- The key steps in data mining typically involve data preparation, exploration, model development, and result interpretation. Association rule mining is commonly used and aims to find relationships between variables in large datasets.
Emcien overview v6 01282013
This document discusses the need for a new paradigm in big data analytics using algorithms. It begins by describing the limitations of traditional analytics approaches like statistical analysis, data mining, visualization and business intelligence tools when applied to big data. These approaches are query-based and labor intensive. Emerging big data tools like Hadoop and in-memory databases help with storage and queries but do not provide automated insights. The document argues that the new paradigm should focus on algorithms that can automatically surface insights from data in seconds, replacing the need for data analysts to manually query databases. This represents a shift from humans digging for insights to algorithms surfacing insights for humans to evaluate.
data mining
This document provides an introduction to data mining. It defines data mining as the process of extracting knowledge from large amounts of data. The document outlines the typical steps in the knowledge discovery process including data cleaning, transformation, mining, and evaluation. It also describes some common challenges in data mining like dealing with large, high-dimensional, heterogeneous and distributed data. Finally, it summarizes several common data mining tasks like classification, association analysis, clustering, and anomaly detection.
A Comparative Study of Various Data Mining Techniques: Statistics, Decision T...
In this paper we focus on some techniques for solving data mining tasks such as: Statistics, Decision Trees and Neural
Networks. The new approach has succeed in defining some new criteria for the evaluation process, and it has obtained valuable results
based on what the technique is, the environment of using each techniques, the advantages and disadvantages of each technique, the
consequences of choosing any of these techniques to extract hidden predictive information from large databases, and the methods of
implementation of each technique. Finally, the paper has presented some valuable recommendations in this field.
Milestone 2 Guidance For your final project… Most importa.docx
Milestone 2 Guidance
For your final project… Most important…. KEEP IT SIMPLE
• Thank about the equations you are most comfortable with when it comes to calculating velocities and
energy transfer. Build your device around those situations.
• Start with a pencil sketch!
• Use at least three steps. Your “selected step” for analysis cannot be your first or last step because you
need to analyze the transitions before and after your selected step.
Example:
The only time the initial velocity is zero is if gravity starts the step’s motion. If there is any sort of interaction
between two objects, the initial velocity of the step is the velocity of the object AFTER that interaction. In the
above example, the red ball is at rest when the blue ball starts. The selected step, though, starts with the
velocity that the red ball has picked up from the interaction with the blue ball.
Any transition that involves contact with moving objects will have a transfer of energy. For an object that flips
a switch and releases a ball allowing gravity to act on it, there is work done to flip the switch, but no energy
transferred to the next step.
For Milestone Two, if you chose the step that you will analyze for your final project, you can use the work you
do for Milestone Two and my feedback to make it all perfect for the final submission. For Part 1 of this
milestone, you will describe the selected step.
For Part 2 of Milestone 2, we look to the transition between the previous step and the selected step:
This section has three parts. First, describe in words what is happening between the two objects at the
transition and how the energy is being transferred. This is just to set the stage, do not include equations and
numbers in this intro section. The second part is to introduce the equations you will be using to track the
energy and momentum. Conservation of momentum tells us that the total momentum before the collision
will equal that total momentum after the collision. Conservation of energy tells us that the total kinetic
energy before the collision is equal to the total kinetic energy after the collision. The trick is to write the
equations to match those two scenarios. The assignment also asks you to explain “the connection between
the basic physics concepts in the equations and the interaction of the object and force(s) from step to step.”
That means you need to explain what numbers you will plug into the equations, where you will find them and
what you will solve for. The final part of this section is to perform the calculations and describe how those
numbers indicate the future path of the object in the selected step.
In Part 3 of Milestone 2, we look at how the energy distribution changes throughout the course of the
selected step:
We are looking at the changes in kinetic and potential energy as the ball travels through the selected step.
The total energy r ...
Data mining
The past two decades has seen a dramatic increase in the amount of information or data being stored in electronic format. This accumulation of data has taken place at an explosive rate. It has been estimated that the amount of information in the world doubles every 20 months and the size and number of databases are increasing even faster. The increase in use of electronic data gathering devices such as point-of-sale or remote sensing devices has contributed to this explosion of available data. Figure 1 from the Red Brick company illustrates the data explosion.
On Machine Learning and Data Mining
The document discusses the differences between machine learning (ML), statistical learning, data mining (DM), and automated learning (AL). It argues that while ML and statistical learning developed similar techniques starting in the 1960s, DM emerged in the 1990s from a merging of database research and automated learning. However, industry was much more enthusiastic about adopting DM techniques compared to AL techniques, even though many DM systems are just friendly interfaces of AL systems. The document aims to explain the key differences between DM and AL that led to DM's greater commercial success.
UNIT1-2.pptx
This document provides an introduction to data science concepts including statistical thinking, modeling, and the data science process. Key points covered include:
- Statistical thinking involves understanding uncertainty and randomness in data through probability models.
- Models are built from data to represent processes and extract meaning through statistical inference.
- Exploratory data analysis is used to systematically analyze and gain insights from data through visualizations and summary statistics.
- The data science process involves collecting raw data, exploring and cleaning it, building models and algorithms, and communicating findings.
Regression and correlation
This document provides an overview of data analytics including:
- The basics of data analytics including analytics definitions and the need for data analytics due to increasing data volumes.
- Descriptions of different types of analytics including descriptive, diagnostic, predictive, and prescriptive analytics and their purposes.
- An overview of the data analytics lifecycle including phases such as data preparation, model planning, model building, and communication of results.
A Hybrid Theory Of Power Theft Detection
The document discusses character recognition for Devnagari script using a hybrid approach. Devnagari script poses challenges for character recognition due to complexities like fused characters, modifiers, and similarities between some letters. The proposed system uses Hough transform to detect features from lines and curves, and SVM for classification. This hybrid approach aims to address issues in handwritten character recognition for Devnagari script by utilizing effective feature extraction and classification methods.
Guide for a Data Scientist
If you’re learning data science, you’re probably on the lookout for cool data science projects. Look no further! We have a wide variety of guided projects that’ll get you working with real data in real-world scenarios while also helping you learn and apply new data science skills.
The projects in the list below are also designed to help you get a job! Each project was designed by a data scientist on our content team, and they’re representative examples of the real projects working data analysts and data scientists do every day. They’re designed to guide you through the process while also challenging your skills, and they’re open-ended so that you can put your own twist on each project and use it for your data science portfolio.
You can complete each project right in your browser, or you can download the data set to your computer and work locally! If you work on our site, you’ll also be able to download your code at any time so that you can continue locally, or upload your project to GitHub.
The sky is the limit here and what you decide to look into further is completely up to you and your imagination!
1. Learning by Doing
Learning by doing refers to a theory of education expounded by American philosopher John Dewey. It is a hands-on approach to learning, meaning students must interact with their environment in order to adapt and learn. This way of learning sharpen your current skills and knowledge and also helps in gaining new skills that could only be acquired by doing.
Car driving is a perfect example of this, you can read as much as you would like about the theory of driving and the rules, and this is very important, and the more you understand the theory the better you get in the practical part. But you will only be able to drive better by applying this knowledge on the real road. In addition to that, there are some skills and knowledge that will be only gained by actually driving.
Data science is the same as driving. It is very important to have solid theoretical knowledge and to regularly increase them to be able to get better while working on a project. However, you should always apply this theoretical knowledge to projects. By this, you will deepen your understanding of these concepts and Knowledge, have a better point of view of how they work in a real-life, and will also show others that you have strong theoretical knowledge and are able to put them into practice.
There are different types of guided projects. One of them is a guided project for
There are a lot of benefits for it:
It removes the barriers between you and doing projects
Saves you much time thinking about the project and preparing the data.
It allows you to apply the theoretical knowledge without getting distracted by obstacles.
Practical tips that can save your effort and time in the future.
#datasciencefree
#rohitdubey
#teachtechtoe
#linkedin.com/in/therohitdubey
The Transpose Technique On Number Of Transactions Of...
The document discusses how data mining techniques can be applied to extract useful knowledge and patterns from large datasets. It notes that raw data needs to be analyzed and manipulated to uncover its value, similar to an unpolished diamond needing to be polished to reveal its worth. The goal of data mining is to systematically analyze stored data to discover hidden patterns that can provide valuable insights and information for the future.
Introduction to Data Science: Unveiling Insights Hidden in Data
Embark on a journey into the fascinating field of Data Science and uncover the valuable insights concealed within vast datasets. In this article, we explore the fundamental concepts of Data Science and its applications. Discover how a Data science Training Institute in Jaipur, Lucknow, Indore, Mumbai, Delhi, Noida, Gurgaon and other cities in India can equip you with the knowledge and skills to analyze, interpret, and extract meaningful information from data. Explore topics such as data preprocessing, statistical analysis, machine learning, and data visualization. Join us on this enlightening exploration of the world of Data Science.
Action research data analysis
The document discusses key steps in data analysis and interpretation for action research:
1) Data analysis involves summarizing collected data in an accurate manner depending on the type of data collected, such as using qualitative analysis for narrative data or quantitative analysis for numerical data.
2) Data interpretation finds meaning in the data by answering "So what?" and explaining trends, patterns, and relationships that emerge from the analysis.
3) Critical steps in analysis and interpretation include making data summaries, developing categories and coding, writing theoretical notes, quantification, and shaping metaphors to understand the data from different perspectives.
Mastering Data Science A Comprehensive Introduction.docx
Mastering Data Science: A Comprehensive Introduction" is your ultimate guide to the dynamic and ever-evolving world of data science. With over 3000 words of in-depth content, this book takes you on a journey from the foundational concepts of data science to its practical applications in various industries.
Discover the significance of data in the modern age and the role of data scientists in transforming raw information into actionable insights. Explore the data science lifecycle, from problem formulation to model deployment and ongoing maintenance. Learn how to acquire, clean, and preprocess data effectively, ensuring data quality and reliability.
Delve into the art of exploratory data analysis (EDA), where data visualization and statistical techniques help uncover patterns and relationships. Gain expertise in feature engineering and selection, as well as the fundamentals of machine learning, including supervised and unsupervised learning, deep learning, and reinforcement learning.
Uncover the specifics of various machine learning algorithms, from linear regression to neural networks, and understand when and how to use them. Learn how to rigorously evaluate and select models using performance metrics, cross-validation, and hyperparameter tuning while considering bias and fairness.
The book goes beyond model building by addressing the deployment of models in real-world applications, including recommendation systems, fraud detection, and natural language processing. It also explores ethical considerations related to data science.
As data continues to grow, the chapter on big data and data science introduces you to the challenges and tools used to handle large-scale datasets efficiently.
Data science isn't confined to one industry. Explore practical applications in business and industry, such as data-driven decision-making, customer analytics, and predictive maintenance. Understand the role of data science in research and academia, including data-intensive research and data ethics.
Stay ahead of the curve by examining the future of data science, including emerging trends like artificial intelligence, deep learning, and responsible data science practices.
"Mastering Data Science" isn't just a book; it's your key to unlocking the potential of data in the 21st century. Whether you're a novice or an experienced data scientist, this comprehensive guide equips you to navigate the ever-expanding world of data and make meaningful contributions to various domains.
Lesson 1 - Overview of Machine Learning and Data Analysis.pptx
This document provides an overview of machine learning and data analysis. It defines machine learning as a field of artificial intelligence that enables computers to learn from data without being explicitly programmed. The main types of machine learning are supervised, unsupervised, and reinforcement learning. Data analysis is the process of extracting meaningful insights from data through techniques like cleaning, exploring for patterns/trends, statistical analysis, and visualization. Machine learning automates many data analysis tasks and can be applied through techniques like classification, clustering, and regression. The relationship between machine learning and data analysis fuels discovery, with data analysis providing foundation and machine learning generating insights.
Data Science Unit1 AMET.pdf
Data science involves extracting meaningful insights from raw data through scientific methods and algorithms. It is an interdisciplinary field that focuses on analyzing large datasets using skills from computer science, mathematics, and statistics. Python is a commonly used programming language for data science due to its powerful libraries for tasks like data analysis, machine learning, and visualization. Key Python libraries include NumPy, Pandas, Matplotlib, Scikit-learn, and SciPy. The document then discusses tools, applications, and basic concepts in data science and Python.
EDA-Unit 1.pdf
This document provides an overview of exploratory data analysis (EDA). It discusses the key stages of EDA including data requirements, collection, processing, cleaning, exploration, modeling, products, and communication. The stages involve examining available data to discover patterns and relationships. EDA is the first step in data mining projects to understand data without assumptions. The document also outlines the problem definition, data preparation, analysis, and result development and representation steps of EDA. Finally, it discusses different types of data like numeric, categorical, and the importance of understanding data types for analysis.
Unit 1.pptx
This document outlines the course structure for a structured data analytics course. It is a 3 credit course that includes practice sessions, assessments like quizzes and assignments. The course covers topics like data wrangling, classification/regression algorithms, association analysis, time series, and recommender systems. It also discusses popular machine learning algorithms and reading resources. Finally, it provides an overview of the first unit which is on data analytics from a business perspective.
Data Science-1 (1).ppt
The document provides an overview of data science and what it entails. It discusses the hype around big data and data science, and how data science has evolved due to improvements in technology that allow for large-scale data processing. It defines data science as a process that involves collecting, cleaning, analyzing and extracting meaningful insights from data. Data scientists come from a variety of academic backgrounds and work in both industry and academia developing solutions to real-world problems using data-driven approaches.
Guide to data analytics
Data science has become essential for businesses to analyze large amounts of data. While machine learning seems promising, there are no shortcuts - data exploration is needed to improve model accuracy. The key steps of data exploration are identifying variables, univariate and bivariate analysis, and treating missing values and outliers to clean the data before building predictive models. Understanding the data generation process is important for leaders to evaluate the quality of analytics.
Data collection, Data Integration, Data Understanding e Data Cleaning & Prepa...
Data collection, Data Integration, Data Understanding e Data Cleaning & Prepa...Laboratorio di Cultura Digitale, labcd.humnet.unipi.it
Attività didattiche trasversali per i dottori di ricerca - UNIPI a.a. 2018-2019
Moduli offerti dal LabCDData analysis aug-11
The document discusses various methods for analyzing and interpreting data. It describes descriptive analysis which helps summarize data patterns. Statistical analysis techniques like clustering, regression, and cohorts are explained. Inferential analysis makes judgments about differences between groups. Qualitative and quantitative methods are outlined for interpreting data through coding and establishing relationships. The purpose of data analysis and interpretation is to answer research questions and determine trends to support decision making.
OpenML data@Sheffield
OpenML aims to enable collaborative machine learning by allowing researchers to explore data and algorithms together online at web scale in real time. It seeks to remove friction from the machine learning process by making it easy to contribute and reuse datasets, algorithms, and experiments. This will allow research to progress faster and at larger scale through open sharing and automated collaboration across fields and laboratories.
cap.doc
This document discusses data mining and summarizes a research article on the topic. It defines data mining as extracting useful patterns from large databases. The data mining process involves selecting, transforming, and mining data, then interpreting and validating the results. Various data mining techniques are described, including summarization, clustering, classification, regression, and detecting patterns and deviations. The goal of data mining is to better understand data and support decision making.
lec1.pdf
This summary provides an overview of the key points from the document:
1) The document is a lecture introduction on the topic of data mining given by Professor Pabitra Mitra. It discusses the motivation for data mining, the knowledge discovery process, and types of patterns that can be discovered.
2) Large volumes of data are being collected from various sources like e-commerce, social media, and scientific experiments, but this data is not providing enough useful knowledge. Data mining aims to automatically analyze massive data to extract meaningful knowledge.
3) The knowledge discovery process involves selecting relevant data from databases, preprocessing and integrating it into a data warehouse, then applying data mining techniques to discover patterns and knowledge.
Data Science Demystified_ Journeying Through Insights and Innovations
In the digital age, data has emerged as one of the most valuable resources, driving decision-making processes across industries. Data science, the interdisciplinary field that extracts insights and knowledge from structured and unstructured data, plays a pivotal role in leveraging this resource. This section provides an overview of data science, its importance, and its applications in various domains.
Motivations of Early Adopters of Technology - The case of Social Networks
This document provides a literature review on the motivations of early adopters of technology, specifically social networks. It discusses four key areas of literature:
1) Diffusion of innovations theory which examines how new ideas and technologies are adopted over time. Important factors that influence adoption are relative advantage, compatibility, complexity, trialability, observability.
2) Literature on early adopters which finds they are often less technically savvy than assumed and more interested in exploring new solutions for their needs.
3) Consumer motivation literature which looks at psychological drivers for consumption.
4) Networks literature with a focus on social networks, which are the subject of the study.
The literature review aims to understand the motiv
Social Media Ethics.pptx
Social media has changed communication but also raises ethical issues around privacy, misinformation, and mental health. Key debates focus on balancing free speech against harmful content. Filter bubbles and confirmation bias can limit exposure to diverse views through algorithms that amplify aligned content. Disinformation spreads for political and financial gain using bots, fake accounts and doctored content, undermining trust and democracy. Hate speech and cyberbullying on platforms can seriously impact mental health.
More Related Content
Similar to Maths.pptx
Regression and correlation
This document provides an overview of data analytics including:
- The basics of data analytics including analytics definitions and the need for data analytics due to increasing data volumes.
- Descriptions of different types of analytics including descriptive, diagnostic, predictive, and prescriptive analytics and their purposes.
- An overview of the data analytics lifecycle including phases such as data preparation, model planning, model building, and communication of results.
A Hybrid Theory Of Power Theft Detection
The document discusses character recognition for Devnagari script using a hybrid approach. Devnagari script poses challenges for character recognition due to complexities like fused characters, modifiers, and similarities between some letters. The proposed system uses Hough transform to detect features from lines and curves, and SVM for classification. This hybrid approach aims to address issues in handwritten character recognition for Devnagari script by utilizing effective feature extraction and classification methods.
Guide for a Data Scientist
If you’re learning data science, you’re probably on the lookout for cool data science projects. Look no further! We have a wide variety of guided projects that’ll get you working with real data in real-world scenarios while also helping you learn and apply new data science skills.
The projects in the list below are also designed to help you get a job! Each project was designed by a data scientist on our content team, and they’re representative examples of the real projects working data analysts and data scientists do every day. They’re designed to guide you through the process while also challenging your skills, and they’re open-ended so that you can put your own twist on each project and use it for your data science portfolio.
You can complete each project right in your browser, or you can download the data set to your computer and work locally! If you work on our site, you’ll also be able to download your code at any time so that you can continue locally, or upload your project to GitHub.
The sky is the limit here and what you decide to look into further is completely up to you and your imagination!
1. Learning by Doing
Learning by doing refers to a theory of education expounded by American philosopher John Dewey. It is a hands-on approach to learning, meaning students must interact with their environment in order to adapt and learn. This way of learning sharpen your current skills and knowledge and also helps in gaining new skills that could only be acquired by doing.
Car driving is a perfect example of this, you can read as much as you would like about the theory of driving and the rules, and this is very important, and the more you understand the theory the better you get in the practical part. But you will only be able to drive better by applying this knowledge on the real road. In addition to that, there are some skills and knowledge that will be only gained by actually driving.
Data science is the same as driving. It is very important to have solid theoretical knowledge and to regularly increase them to be able to get better while working on a project. However, you should always apply this theoretical knowledge to projects. By this, you will deepen your understanding of these concepts and Knowledge, have a better point of view of how they work in a real-life, and will also show others that you have strong theoretical knowledge and are able to put them into practice.
There are different types of guided projects. One of them is a guided project for
There are a lot of benefits for it:
It removes the barriers between you and doing projects
Saves you much time thinking about the project and preparing the data.
It allows you to apply the theoretical knowledge without getting distracted by obstacles.
Practical tips that can save your effort and time in the future.
#datasciencefree
#rohitdubey
#teachtechtoe
#linkedin.com/in/therohitdubey
The Transpose Technique On Number Of Transactions Of...
The document discusses how data mining techniques can be applied to extract useful knowledge and patterns from large datasets. It notes that raw data needs to be analyzed and manipulated to uncover its value, similar to an unpolished diamond needing to be polished to reveal its worth. The goal of data mining is to systematically analyze stored data to discover hidden patterns that can provide valuable insights and information for the future.
Introduction to Data Science: Unveiling Insights Hidden in Data
Embark on a journey into the fascinating field of Data Science and uncover the valuable insights concealed within vast datasets. In this article, we explore the fundamental concepts of Data Science and its applications. Discover how a Data science Training Institute in Jaipur, Lucknow, Indore, Mumbai, Delhi, Noida, Gurgaon and other cities in India can equip you with the knowledge and skills to analyze, interpret, and extract meaningful information from data. Explore topics such as data preprocessing, statistical analysis, machine learning, and data visualization. Join us on this enlightening exploration of the world of Data Science.
Action research data analysis
The document discusses key steps in data analysis and interpretation for action research:
1) Data analysis involves summarizing collected data in an accurate manner depending on the type of data collected, such as using qualitative analysis for narrative data or quantitative analysis for numerical data.
2) Data interpretation finds meaning in the data by answering "So what?" and explaining trends, patterns, and relationships that emerge from the analysis.
3) Critical steps in analysis and interpretation include making data summaries, developing categories and coding, writing theoretical notes, quantification, and shaping metaphors to understand the data from different perspectives.
Mastering Data Science A Comprehensive Introduction.docx
Mastering Data Science: A Comprehensive Introduction" is your ultimate guide to the dynamic and ever-evolving world of data science. With over 3000 words of in-depth content, this book takes you on a journey from the foundational concepts of data science to its practical applications in various industries.
Discover the significance of data in the modern age and the role of data scientists in transforming raw information into actionable insights. Explore the data science lifecycle, from problem formulation to model deployment and ongoing maintenance. Learn how to acquire, clean, and preprocess data effectively, ensuring data quality and reliability.
Delve into the art of exploratory data analysis (EDA), where data visualization and statistical techniques help uncover patterns and relationships. Gain expertise in feature engineering and selection, as well as the fundamentals of machine learning, including supervised and unsupervised learning, deep learning, and reinforcement learning.
Uncover the specifics of various machine learning algorithms, from linear regression to neural networks, and understand when and how to use them. Learn how to rigorously evaluate and select models using performance metrics, cross-validation, and hyperparameter tuning while considering bias and fairness.
The book goes beyond model building by addressing the deployment of models in real-world applications, including recommendation systems, fraud detection, and natural language processing. It also explores ethical considerations related to data science.
As data continues to grow, the chapter on big data and data science introduces you to the challenges and tools used to handle large-scale datasets efficiently.
Data science isn't confined to one industry. Explore practical applications in business and industry, such as data-driven decision-making, customer analytics, and predictive maintenance. Understand the role of data science in research and academia, including data-intensive research and data ethics.
Stay ahead of the curve by examining the future of data science, including emerging trends like artificial intelligence, deep learning, and responsible data science practices.
"Mastering Data Science" isn't just a book; it's your key to unlocking the potential of data in the 21st century. Whether you're a novice or an experienced data scientist, this comprehensive guide equips you to navigate the ever-expanding world of data and make meaningful contributions to various domains.
Lesson 1 - Overview of Machine Learning and Data Analysis.pptx
This document provides an overview of machine learning and data analysis. It defines machine learning as a field of artificial intelligence that enables computers to learn from data without being explicitly programmed. The main types of machine learning are supervised, unsupervised, and reinforcement learning. Data analysis is the process of extracting meaningful insights from data through techniques like cleaning, exploring for patterns/trends, statistical analysis, and visualization. Machine learning automates many data analysis tasks and can be applied through techniques like classification, clustering, and regression. The relationship between machine learning and data analysis fuels discovery, with data analysis providing foundation and machine learning generating insights.
Data Science Unit1 AMET.pdf
Data science involves extracting meaningful insights from raw data through scientific methods and algorithms. It is an interdisciplinary field that focuses on analyzing large datasets using skills from computer science, mathematics, and statistics. Python is a commonly used programming language for data science due to its powerful libraries for tasks like data analysis, machine learning, and visualization. Key Python libraries include NumPy, Pandas, Matplotlib, Scikit-learn, and SciPy. The document then discusses tools, applications, and basic concepts in data science and Python.
EDA-Unit 1.pdf
This document provides an overview of exploratory data analysis (EDA). It discusses the key stages of EDA including data requirements, collection, processing, cleaning, exploration, modeling, products, and communication. The stages involve examining available data to discover patterns and relationships. EDA is the first step in data mining projects to understand data without assumptions. The document also outlines the problem definition, data preparation, analysis, and result development and representation steps of EDA. Finally, it discusses different types of data like numeric, categorical, and the importance of understanding data types for analysis.
Unit 1.pptx
This document outlines the course structure for a structured data analytics course. It is a 3 credit course that includes practice sessions, assessments like quizzes and assignments. The course covers topics like data wrangling, classification/regression algorithms, association analysis, time series, and recommender systems. It also discusses popular machine learning algorithms and reading resources. Finally, it provides an overview of the first unit which is on data analytics from a business perspective.
Data Science-1 (1).ppt
The document provides an overview of data science and what it entails. It discusses the hype around big data and data science, and how data science has evolved due to improvements in technology that allow for large-scale data processing. It defines data science as a process that involves collecting, cleaning, analyzing and extracting meaningful insights from data. Data scientists come from a variety of academic backgrounds and work in both industry and academia developing solutions to real-world problems using data-driven approaches.
Guide to data analytics
Data science has become essential for businesses to analyze large amounts of data. While machine learning seems promising, there are no shortcuts - data exploration is needed to improve model accuracy. The key steps of data exploration are identifying variables, univariate and bivariate analysis, and treating missing values and outliers to clean the data before building predictive models. Understanding the data generation process is important for leaders to evaluate the quality of analytics.
Data collection, Data Integration, Data Understanding e Data Cleaning & Prepa...
Data collection, Data Integration, Data Understanding e Data Cleaning & Prepa...Laboratorio di Cultura Digitale, labcd.humnet.unipi.it
Attività didattiche trasversali per i dottori di ricerca - UNIPI a.a. 2018-2019
Moduli offerti dal LabCDData analysis aug-11
The document discusses various methods for analyzing and interpreting data. It describes descriptive analysis which helps summarize data patterns. Statistical analysis techniques like clustering, regression, and cohorts are explained. Inferential analysis makes judgments about differences between groups. Qualitative and quantitative methods are outlined for interpreting data through coding and establishing relationships. The purpose of data analysis and interpretation is to answer research questions and determine trends to support decision making.
OpenML data@Sheffield
OpenML aims to enable collaborative machine learning by allowing researchers to explore data and algorithms together online at web scale in real time. It seeks to remove friction from the machine learning process by making it easy to contribute and reuse datasets, algorithms, and experiments. This will allow research to progress faster and at larger scale through open sharing and automated collaboration across fields and laboratories.
cap.doc
This document discusses data mining and summarizes a research article on the topic. It defines data mining as extracting useful patterns from large databases. The data mining process involves selecting, transforming, and mining data, then interpreting and validating the results. Various data mining techniques are described, including summarization, clustering, classification, regression, and detecting patterns and deviations. The goal of data mining is to better understand data and support decision making.
lec1.pdf
This summary provides an overview of the key points from the document:
1) The document is a lecture introduction on the topic of data mining given by Professor Pabitra Mitra. It discusses the motivation for data mining, the knowledge discovery process, and types of patterns that can be discovered.
2) Large volumes of data are being collected from various sources like e-commerce, social media, and scientific experiments, but this data is not providing enough useful knowledge. Data mining aims to automatically analyze massive data to extract meaningful knowledge.
3) The knowledge discovery process involves selecting relevant data from databases, preprocessing and integrating it into a data warehouse, then applying data mining techniques to discover patterns and knowledge.
Data Science Demystified_ Journeying Through Insights and Innovations
In the digital age, data has emerged as one of the most valuable resources, driving decision-making processes across industries. Data science, the interdisciplinary field that extracts insights and knowledge from structured and unstructured data, plays a pivotal role in leveraging this resource. This section provides an overview of data science, its importance, and its applications in various domains.
Motivations of Early Adopters of Technology - The case of Social Networks
This document provides a literature review on the motivations of early adopters of technology, specifically social networks. It discusses four key areas of literature:
1) Diffusion of innovations theory which examines how new ideas and technologies are adopted over time. Important factors that influence adoption are relative advantage, compatibility, complexity, trialability, observability.
2) Literature on early adopters which finds they are often less technically savvy than assumed and more interested in exploring new solutions for their needs.
3) Consumer motivation literature which looks at psychological drivers for consumption.
4) Networks literature with a focus on social networks, which are the subject of the study.
The literature review aims to understand the motiv
Similar to Maths.pptx (20)
The Transpose Technique On Number Of Transactions Of...
The Transpose Technique On Number Of Transactions Of...
Introduction to Data Science: Unveiling Insights Hidden in Data
Introduction to Data Science: Unveiling Insights Hidden in Data
Mastering Data Science A Comprehensive Introduction.docx
Mastering Data Science A Comprehensive Introduction.docx
Lesson 1 - Overview of Machine Learning and Data Analysis.pptx
Lesson 1 - Overview of Machine Learning and Data Analysis.pptx
Data collection, Data Integration, Data Understanding e Data Cleaning & Prepa...
Data collection, Data Integration, Data Understanding e Data Cleaning & Prepa...
Data Science Demystified_ Journeying Through Insights and Innovations
Data Science Demystified_ Journeying Through Insights and Innovations
Motivations of Early Adopters of Technology - The case of Social Networks
Motivations of Early Adopters of Technology - The case of Social Networks
More from john6938
Social Media Ethics.pptx
Social media has changed communication but also raises ethical issues around privacy, misinformation, and mental health. Key debates focus on balancing free speech against harmful content. Filter bubbles and confirmation bias can limit exposure to diverse views through algorithms that amplify aligned content. Disinformation spreads for political and financial gain using bots, fake accounts and doctored content, undermining trust and democracy. Hate speech and cyberbullying on platforms can seriously impact mental health.
Future of Information Ethics.pptx
The document discusses several issues relating to the future of information ethics, including privacy, surveillance, algorithmic bias, intellectual property, globalization, and augmentation. Specifically, it addresses the need for individuals to have control over their personal data and consent to its use (privacy), the debate around balancing privacy rights with security interests behind surveillance practices, how algorithms can perpetuate inequality if not designed carefully, balancing copyright with open-source licensing, challenges of cross-border data flows, and both current and future ethical challenges relating to new technologies.
Bioethics.pptx
Bioethics examines ethical issues arising from advances in biology and medicine. It focuses on topics like abortion, euthanasia, genetic testing, and human experimentation. Bioethics also explores the duties of health professionals and aims to protect vulnerable groups. It provides a framework for complex moral issues in healthcare. Key events in bioethics history include the first test-tube baby in 1978 and gene-edited children in 2018. U.S. laws like HIPAA and the Common Rule aim to protect privacy and informed consent while international guidelines promote human dignity. Autonomy, beneficence, and justice are important principles in bioethical decision making.
Surveillance and security.pptx
This document discusses the ethics of surveillance and security. It covers various ethical approaches, security concepts, types of surveillance, hacking techniques, legal frameworks, privacy concepts, stakeholders, social factors, and ethical dilemmas related to information security and privacy. Key topics include utilitarianism, deontology, virtue ethics, rights-based ethics, social contract theory, encryption, firewalls, intrusion detection, authentication, CCTV, data mining, internet monitoring, wiretapping, facial recognition, penetration testing, social engineering, phishing, vulnerability assessments, GDPR, CFAA, FISMA, the right to be forgotten, consent decrees, anonymity, data minimization, opt-in vs opt-out, information lifec
Introduction to Expert Systems.pptx
The document describes 4 different expert systems proposed by different teams to identify the author of an email. Each system analyzes word frequency, keyword frequency, and part-of-speech patterns after keywords in known and questioned texts to determine the author. The systems compare feature vectors representing writing style extracted from the texts to identify or verify the author.
Starbuck.pptx
The police collected 4 datasets of emails - 2 from Debbie before and after marriage, 1 from Jamie, and 1 large reference collection. They analyzed the datasets using linguistic analysis of word frequencies, keywords that occur more than expected, and patterns around keywords. Comparing these linguistic features across the datasets could determine if the same person wrote the questioned and known datasets.
Unit 4 Problem breakdown.pptx
The document discusses using an expert system to analyze linguistic patterns in written documents. It describes using an expert system to analyze a threatening email and other emails from a suspect's computer to identify similarities in word frequencies, keywords, and keyword order that could indicate the suspect authored the threatening email. The system would analyze the questioned, known, and reference documents to generate shared word frequency, keyword frequency, and keyword positional lists to help determine authorship.
Image_recognition.pptx
Barcodes and image recognition technology are examples of machine-readable representations of data. Barcodes use a pattern of bars and spaces that can be read by optical scanners to identify numbers and letters. Image recognition allows computers to identify objects in images through techniques like deep learning, which automatically extracts features from image data. Face recognition is a type of image recognition that extracts features from facial images and compares them to identify individuals, using algorithms like ResNet that represent faces as vectors and compare their Euclidean distances.
Algorithms.pptx
There are many sorting algorithms that can sort a list of numbers in ascending or descending order. Some common sorting algorithms include bubble sort, merge sort, and quicksort. Bubble sort has a computational complexity of O(n2) while merge sort and quicksort have better complexities of O(n log n). Stack and queue are abstract data types - stack follows LIFO (Last In First Out) while queue follows FIFO (First In First Out). Stack adds and removes elements from the top of the data structure, while queue adds to the tail and removes from the head.
Artificial_intelligence.pptx
Edge AI allows devices like self-driving cars to make decisions immediately using on-device processing rather than cloud-based processing, which introduces latency. Edge AI processes data and inferences locally on IoT and sensor devices. This enables applications like self-driving cars using computer vision to detect humans and stop in real-time. While Edge AI provides benefits like lower latency, security, and data privacy, it also faces limitations in processing power and operational complexity compared to cloud-based AI.
Image_generation.pptx
The document describes how to generate and review images using machine learning. To generate images, a model learns from original images, searches topics to generate new images on, and iterates generating and scoring images until a threshold is passed. To review generated images, both input and generated images are disassembled into pixels, quantified by color, analyzed for tendencies, which are then compared between input and generated images to find the generated image most similar to the original tendencies.
Computer_Graphics.pptx
Computer graphics refers to images and figures created using a computer. There are two main types: 2D computer graphics, which are two-dimensional images, and 3D computer graphics, which create three-dimensional virtual spaces and objects. Creating 3D computer graphics involves several steps: modeling virtual objects, adding textures, rigging for movement, lighting, animation, and rendering to convert the 3D scene to a 2D image. A challenge with creating realistic human figures with 3D computer graphics is the "uncanny valley" effect, where figures that are almost but not perfectly realistic can appear creepy. Advances in technology now allow for highly realistic 3D computer graphics that avoid this effect.
Security.pptx
The document discusses information security and protecting personal information. It defines information security as ensuring the confidentiality, integrity, and availability of information. Confidentiality means only authorized individuals can access information. Integrity means information has not been altered or destroyed. Availability means authorized individuals have access to information when needed without interruption. Security measures help protect against potential harm from others by restricting what others can do. However, security has weaknesses that can be exploited.
Gravitational_wave_detection.pptx
Gravitational wave detection and denoising algorithm uses machine learning to classify and filter noise from gravitational wave data. There are 22 main types of noise that can be identified using supervised and unsupervised learning algorithms. Unsupervised learning allows the computer to classify noise types on its own by finding inherent groupings or clusters in the data, while supervised learning uses labeled examples to efficiently perform classifications. The proposed method uses a variational autoencoder and invariant information clustering to learn features from spectrogram images of transient noise and then classify the noise types based on the learned features.
Embedded_Systems.pptx
This document discusses key considerations for designing real-time embedded systems to ensure predictability and avoid failure. It identifies four main problems: whether the architecture is suitable, if link speeds are adequate, if processing components are powerful enough, and if the operating system is suitable. For each problem, it provides details on how to evaluate them and ensure real-time requirements are met, such as keeping CPU and link utilization below 50% and using an RTOS with preemptive scheduling and low interrupt latency and scheduling variance.
Software_engineering.pptx
Python is the most widely used programming language in the world due to its simple syntax, wide platform support, and ease of use. It can be learned by both professionals and students. A survey by Stack Overflow found incredible growth in the number of visitors to Python questions on the site. Lisp is one of the oldest high-level programming languages still in use, known for its extensive use of parentheses in code. It was influential in the development of artificial intelligence. R is a programming language and software environment for statistical analysis and graphics. It provides many statistical and graphical techniques and is highly extensible.
Quantum_computers.pptx
Quantum computers can solve problems in hours that would take classical computers over 100 million years by leveraging the quantum state of superposition where multiple states exist simultaneously. Specifically, quantum computers could crack RSA encryption, which normally takes over 100 million years on classical computers, in just a few hours by applying this quantum superposition property.
NLP.pptx
Neural networks like artificial neural networks (ANNs) and long short-term memory (LSTM) networks are commonly used in machine translation systems. ANNs mimic the human brain by recognizing relationships in vast amounts of data, similar to neural connections in the brain. The field of machine translation began in the 1950s with rule-based machine translation (RBMT) relying on linguistic rules and dictionaries. Statistical machine translation (SMT) developed in the late 1970s and analyzed existing human translations. More recently, neural machine translation (NMT) introduced in the last decade learns from each translation to improve. LSTM is a type of RNN with feedback connections that can process entire sequences of data over time and is well-suited for classifying
Sensors_SLAM.pptx
SLAM is a technology that uses sensors to allow objects like vehicles to simultaneously map their environment and locate themselves within it. It utilizes sensors such as LiDAR and cameras to create maps without relying on GPS. LiDAR SLAM is particularly accurate and commonly used for automated driving as LiDAR can measure distance and shape using reflected laser time.
More from john6938 (20)
Recently uploaded
DRUGS AND ITS classification slide share
Any substance (other than food) that is used to prevent, diagnose, treat, or relieve symptoms of a
disease or abnormal condition
The Diamonds of 2023-2024 in the IGRA collection
A review of the growth of the Israel Genealogy Research Association Database Collection for the last 12 months. Our collection is now passed the 3 million mark and still growing. See which archives have contributed the most. See the different types of records we have, and which years have had records added. You can also see what we have for the future.
How to Setup Warehouse & Location in Odoo 17 Inventory
In this slide, we'll explore how to set up warehouses and locations in Odoo 17 Inventory. This will help us manage our stock effectively, track inventory levels, and streamline warehouse operations.
Executive Directors Chat Leveraging AI for Diversity, Equity, and Inclusion
Let’s explore the intersection of technology and equity in the final session of our DEI series. Discover how AI tools, like ChatGPT, can be used to support and enhance your nonprofit's DEI initiatives. Participants will gain insights into practical AI applications and get tips for leveraging technology to advance their DEI goals.
The simplified electron and muon model, Oscillating Spacetime: The Foundation...
Discover the Simplified Electron and Muon Model: A New Wave-Based Approach to Understanding Particles delves into a groundbreaking theory that presents electrons and muons as rotating soliton waves within oscillating spacetime. Geared towards students, researchers, and science buffs, this book breaks down complex ideas into simple explanations. It covers topics such as electron waves, temporal dynamics, and the implications of this model on particle physics. With clear illustrations and easy-to-follow explanations, readers will gain a new outlook on the universe's fundamental nature.
ISO/IEC 27001, ISO/IEC 42001, and GDPR: Best Practices for Implementation and...
Denis is a dynamic and results-driven Chief Information Officer (CIO) with a distinguished career spanning information systems analysis and technical project management. With a proven track record of spearheading the design and delivery of cutting-edge Information Management solutions, he has consistently elevated business operations, streamlined reporting functions, and maximized process efficiency.
Certified as an ISO/IEC 27001: Information Security Management Systems (ISMS) Lead Implementer, Data Protection Officer, and Cyber Risks Analyst, Denis brings a heightened focus on data security, privacy, and cyber resilience to every endeavor.
His expertise extends across a diverse spectrum of reporting, database, and web development applications, underpinned by an exceptional grasp of data storage and virtualization technologies. His proficiency in application testing, database administration, and data cleansing ensures seamless execution of complex projects.
What sets Denis apart is his comprehensive understanding of Business and Systems Analysis technologies, honed through involvement in all phases of the Software Development Lifecycle (SDLC). From meticulous requirements gathering to precise analysis, innovative design, rigorous development, thorough testing, and successful implementation, he has consistently delivered exceptional results.
Throughout his career, he has taken on multifaceted roles, from leading technical project management teams to owning solutions that drive operational excellence. His conscientious and proactive approach is unwavering, whether he is working independently or collaboratively within a team. His ability to connect with colleagues on a personal level underscores his commitment to fostering a harmonious and productive workplace environment.
Date: May 29, 2024
Tags: Information Security, ISO/IEC 27001, ISO/IEC 42001, Artificial Intelligence, GDPR
-------------------------------------------------------------------------------
Find out more about ISO training and certification services
Training: ISO/IEC 27001 Information Security Management System - EN | PECB
ISO/IEC 42001 Artificial Intelligence Management System - EN | PECB
General Data Protection Regulation (GDPR) - Training Courses - EN | PECB
Webinars: https://pecb.com/webinars
Article: https://pecb.com/article
-------------------------------------------------------------------------------
For more information about PECB:
Website: https://pecb.com/
LinkedIn: https://www.linkedin.com/company/pecb/
Facebook: https://www.facebook.com/PECBInternational/
Slideshare: http://www.slideshare.net/PECBCERTIFICATION
Main Java[All of the Base Concepts}.docx
This is part 1 of my Java Learning Journey. This Contains Custom methods, classes, constructors, packages, multithreading , try- catch block, finally block and more.
South African Journal of Science: Writing with integrity workshop (2024)
South African Journal of Science: Writing with integrity workshop (2024)Academy of Science of South Africa
A workshop hosted by the South African Journal of Science aimed at postgraduate students and early career researchers with little or no experience in writing and publishing journal articles.LAND USE LAND COVER AND NDVI OF MIRZAPUR DISTRICT, UP
This Dissertation explores the particular circumstances of Mirzapur, a region located in the
core of India. Mirzapur, with its varied terrains and abundant biodiversity, offers an optimal
environment for investigating the changes in vegetation cover dynamics. Our study utilizes
advanced technologies such as GIS (Geographic Information Systems) and Remote sensing to
analyze the transformations that have taken place over the course of a decade.
The complex relationship between human activities and the environment has been the focus
of extensive research and worry. As the global community grapples with swift urbanization,
population expansion, and economic progress, the effects on natural ecosystems are becoming
more evident. A crucial element of this impact is the alteration of vegetation cover, which plays a
significant role in maintaining the ecological equilibrium of our planet.Land serves as the foundation for all human activities and provides the necessary materials for
these activities. As the most crucial natural resource, its utilization by humans results in different
'Land uses,' which are determined by both human activities and the physical characteristics of the
land.
The utilization of land is impacted by human needs and environmental factors. In countries
like India, rapid population growth and the emphasis on extensive resource exploitation can lead
to significant land degradation, adversely affecting the region's land cover.
Therefore, human intervention has significantly influenced land use patterns over many
centuries, evolving its structure over time and space. In the present era, these changes have
accelerated due to factors such as agriculture and urbanization. Information regarding land use and
cover is essential for various planning and management tasks related to the Earth's surface,
providing crucial environmental data for scientific, resource management, policy purposes, and
diverse human activities.
Accurate understanding of land use and cover is imperative for the development planning
of any area. Consequently, a wide range of professionals, including earth system scientists, land
and water managers, and urban planners, are interested in obtaining data on land use and cover
changes, conversion trends, and other related patterns. The spatial dimensions of land use and
cover support policymakers and scientists in making well-informed decisions, as alterations in
these patterns indicate shifts in economic and social conditions. Monitoring such changes with the
help of Advanced technologies like Remote Sensing and Geographic Information Systems is
crucial for coordinated efforts across different administrative levels. Advanced technologies like
Remote Sensing and Geographic Information Systems
9
Changes in vegetation cover refer to variations in the distribution, composition, and overall
structure of plant communities across different temporal and spatial scales. These changes can
occur natural.
Digital Artifact 1 - 10VCD Environments Unit
Digital Artifact 1 - 10VCD Environments Unit - NGV Pavilion Concept Design
Community pharmacy- Social and preventive pharmacy UNIT 5
Covered community pharmacy topic of the subject Social and preventive pharmacy for Diploma and Bachelor of pharmacy
BBR 2024 Summer Sessions Interview Training
Qualitative research interview training by Professor Katrina Pritchard and Dr Helen Williams
Recently uploaded (20)
Pride Month Slides 2024 David Douglas School District
Pride Month Slides 2024 David Douglas School District
How to Setup Warehouse & Location in Odoo 17 Inventory
How to Setup Warehouse & Location in Odoo 17 Inventory
Executive Directors Chat Leveraging AI for Diversity, Equity, and Inclusion
Executive Directors Chat Leveraging AI for Diversity, Equity, and Inclusion
The simplified electron and muon model, Oscillating Spacetime: The Foundation...
The simplified electron and muon model, Oscillating Spacetime: The Foundation...
Film vocab for eal 3 students: Australia the movie
Film vocab for eal 3 students: Australia the movie
ISO/IEC 27001, ISO/IEC 42001, and GDPR: Best Practices for Implementation and...
ISO/IEC 27001, ISO/IEC 42001, and GDPR: Best Practices for Implementation and...
South African Journal of Science: Writing with integrity workshop (2024)
South African Journal of Science: Writing with integrity workshop (2024)
LAND USE LAND COVER AND NDVI OF MIRZAPUR DISTRICT, UP
LAND USE LAND COVER AND NDVI OF MIRZAPUR DISTRICT, UP
Community pharmacy- Social and preventive pharmacy UNIT 5
Community pharmacy- Social and preventive pharmacy UNIT 5
Maths.pptx
- 1. Data analysis is a process consisting of several phases and aimed at finding useful information. The following is a series of steps, and each step is iterative. Data collection is a phase in which necessary data is obtained from various sources. The collected data is called raw data, but it cannot be used as is. Data processing and cleaning organize and correct data for analysis, for example arranging data in tabular form or removing outliers. Once the datasets are cleaned, we can move on to the analysis. Analysists use a variety of methods to understand data characteristics. At this point, graphs are often used to visualize and help us better understand the data. Scientific computing: Data analysis Why Lawson continues to sell the 31st largest product in sales. Although one of Lawson’s product, “Horoniga Chocolate Blanc”, ranks 31st in the sweet bread sales ranking, analysis of consumer data shows that 10% of heavy users account for 60% of sales. Based on results of analysis, Lawson continues to sell this product. Exploratory data analysis (EDA) EDA is a method used to actually analyze processed data. There are different ways to understand the characteristics of the data. One example of this is taking a statistical value such as mean, median, mode, variance and correlation coefficient. By taking these values, we can understand broad trends in the overall data. In Lawson’s example, if they had only looked at the sales rankings, they would have ended sales of that product. However, Lawson’s marketing department placed the highest priority on repeat rate, not simple rankings. The results of analysis based on this showed that some woman frequently repeat, and they continued to sell in order not to miss out on important customers. As this example, it is important in analysis to look at data from different perspective, not just one. In addition, visualization of data using graphs is useful tool. Commonly used graphs include the following. ・Box plot ・Histogram ・Scatter plot ・Run chart ・Heat map ・Bar chart
- 2. Mathematical Foundation -Quantum Mechanics- Hook Everything around us is made of atoms. Atoms consist of elementary particles. Key details 1.Elementary particles have mysterious property. 2. Application of Quantum Mechanics More details 1.Quantum Mechanics is the study of observing the physical phenomena of its elementary particles. At first, we thought light was a wave, but when scientist shone light on metal, electrons popped out. Scientist think that this phenomena is light is wave and particle. This was the birth of the quantum mechanics. In short, elementary particles have two properties. It is very mysterious. 2.In fact, Quantum Mechanic of thinking is used in modern society. Using computer system from potential of elementary particles. So called “quantum computer”. Other ways, Used in laser technology applications.
- 3. Numerical Calculation Hook Numerical Calculation : To solve problems with computers. Key details • Mathematics • Physics • Meteorology More details • In mathematics field, calculations of differential, integral, Fourier transform and so on are possible. With these knowledge, this technique is applied to other fields. • In physics field, by numerical calculation, phenomenon of the real world can be simulated. For example, RLC circuit can be modeled with differential equation. • In meteorology field, numerical calculation is used to represent information such as temperature, air pressure, humidity by numerical values. By measuring these values and solving equation using these data, prediction of weather becomes possible.