SlideShare a Scribd company logo
Milestone 2 Guidance
For your final project… Most important…. KEEP IT SIMPLE
• Thank about the equations you are most comfortable with
when it comes to calculating velocities and
energy transfer. Build your device around those situations.
• Start with a pencil sketch!
• Use at least three steps. Your “selected step” for analysis
cannot be your first or last step because you
need to analyze the transitions before and after your selected
step.
Example:
The only time the initial velocity is zero is if gravity starts the
step’s motion. If there is any sort of interaction
between two objects, the initial velocity of the step is the
velocity of the object AFTER that interaction. In the
above example, the red ball is at rest when the blue ball starts.
The selected step, though, starts with the
velocity that the red ball has picked up from the interaction with
the blue ball.
Any transition that involves contact with moving objects will
have a transfer of energy. For an object that flips
a switch and releases a ball allowing gravity to act on it, there
is work done to flip the switch, but no energy
transferred to the next step.
For Milestone Two, if you chose the step that you will analyze
for your final project, you can use the work you
do for Milestone Two and my feedback to make it all perfect for
the final submission. For Part 1 of this
milestone, you will describe the selected step.
For Part 2 of Milestone 2, we look to the transition between the
previous step and the selected step:
This section has three parts. First, describe in words what is
happening between the two objects at the
transition and how the energy is being transferred. This is just
to set the stage, do not include equations and
numbers in this intro section. The second part is to introduce
the equations you will be using to track the
energy and momentum. Conservation of momentum tells us that
the total momentum before the collision
will equal that total momentum after the collision.
Conservation of energy tells us that the total kinetic
energy before the collision is equal to the total kinetic energy
after the collision. The trick is to write the
equations to match those two scenarios. The assignment also
asks you to explain “the connection between
the basic physics concepts in the equations and the interaction
of the object and force(s) from step to step.”
That means you need to explain what numbers you will plug
into the equations, where you will find them and
what you will solve for. The final part of this section is to
perform the calculations and describe how those
numbers indicate the future path of the object in the selected
step.
In Part 3 of Milestone 2, we look at how the energy distribution
changes throughout the course of the
selected step:
We are looking at the changes in kinetic and potential energy as
the ball travels through the selected step.
The total energy remains constant throughout the step. This
example has changes in height, which means
changes in potential and kinetic energy. Your selected step
might not have changes in height, which means
you will not have any changes in how the energy is distributed.
If that is the case, be sure to explain why there
is no change in energy… don’t just skip this part of the
milestone!
For Part 4 of Milestone 2, we go through the exact same process
as we did for Part 2, but we use the
transition to the subsequent step for our analysis.
When I set up my scene, I double clicked (right click on a PC)
on the blue ball and looked for the VELOCITY
option. I set the initial velocity to 3.5 m/sec to kick off the
interaction. In the MATERIALS option, I set the
friction to zero and the restitution to one. A restitution of one
is what makes the collisions elastic and zero
friction will give us constant energy throughout the motion.
After that, I clicked on all objects and surfaces
one at a time to make those same friction and restitution
settings.
Most of all, have fun with it!! Try not to overthink it. Review
the project guidelines again after you finish
writing your project and use the checklist below to make sure it
is complete:
energy through the
interaction between previous and selected
step. What do you know about energy and momentum?
and momentum transfer between steps.
Also indicate what you will measure and what you will solve
for.
standard units.
energy throughout the step, then perform
the calculations showing all work and using standard units. If
there are no energy changes, explain
why the energy does not change. DO NOT SKIP THIS PART
interaction between selected and subsequent
step. What do you know about energy and momentum?
and momentum transfer between steps.
Also indicate what you will measure and what you will solve
for.
standard units.
You can also use the project rubric to ensure each section has
the required amount of detail.
Response 1:
Visual Analytics is a process to transform the approach
information into an opportunity in a way as information
visualization has changed our view on databases, the purpose of
Visual Analytics is to make the frameworks of taking care of
data and information clear for an analytic discourse. Visual
Analytics helps in propelling the gainful evaluation, change and
quick improvement of the strategies and models improving the
data for choosing better decisions. The degree of visual
Analytics can in like manner be depicted similar to the merged
information and communication technology (ICT) key advances
like information visualization, data mining, knowledge
discovery or illustrating, and reenactment" (Janssen, Wimmer
and Deljoo, 2015, p. 325). The two important parts of the model
given by Keim,2008 are information visualization (upper part)
and automated data analysis (lower part). The four pieces of
visual data examination are visualization, Data, Models and
knowledge.
Here I would like to discuss the process between visualization
and models, in perspective on data volume and complexity
information visualization can't be honestly applied. Here comes
the necessity for data analytics. Visualization visualizes the
changed data in the structure where the customer can get data
and assist in building models. At the point when the model is
made the parameters which are ought to have been modified are
then changed and is given to the data which is then moved to
the Data where the additional data mining is finished and the
yield of data mining is given to the models. Right, when all-out
data mining is finished the results are given from the models to
portrayal for model discernment. This system of coordination of
visual and customized data assessment technique is valuable for
expansive and keen decision help.
Visual analytics actions help development that joins the
characteristics of human and electronic data planning,
discernment transforms into the techniques for a semi-robotized
informative strategy, where individuals and machines take an
interest using their specific undeniable capacities for the best
results (Keim, 2008).
Response 2:
Visual data exploration may appear Analytics 101, yet experts
who avoid this progression may pass up significant bits of
knowledge and a more profound comprehension of the data with
which they are working.
On the off chance that something glances wrong in your
data, it presumably isn't right, said Tatiana Gabor, an
investigation supervisor for the income group at music gushing
organization Spotify. Visual data disclosure instruments reliably
rank among examination buyers' top needs. Be that as it may,
the product is regularly conveyed as an end unto itself, with
numerous organizations buying it to work as a self-
administration investigation apparatus for business clients. In
the hands of experienced data researchers, in any case, it can
create much more profound bits of knowledge.
Data exploration is a suggested initial phase in any
investigation, yet examiners frequently simply take a gander at
numbers: rundown measurements like mean, middle and spread.
They don't generally take part in visual data exploration.
A few examiners additionally carry a lot of suspicions to
data and test those immediately by running the data through a
relapse or grouping model. Yet, hopping to these strategies
initially can make an examiner disregard significant highlights
of the data. Data visualization is a basic device in the data
investigation process. Visualization errands can extend from
creating key appropriation plots to understanding the interaction
of complex powerful factors in AI calculations. In this
instructional exercise, we center around the utilization of
visualization for beginning data investigation.
Data visualization is a basic apparatus in the data examination
process. Visualization undertakings can extend from creating
crucial appropriation plots to understanding the interaction of
complex powerful factors in AI calculations. In this
instructional exercise, we center around the utilization of
visualization for starting data investigation.
Visual data investigation is a required initial step whether
progressively formal examination pursues. At the point when
joined with expressive insights, visualization gives a viable
method to recognize synopses, structure, connections, contrasts,
and variations from the norm in the data. In many cases, no
detailed investigation is fundamental as all the significant
determinations required for a choice are apparent from basic
visual assessment of the data. Different occasions, data
investigation will be utilized to help control the data cleaning,
include determination, and examining process.
In any case, visual data investigation is tied in with
researching the attributes of your data set. To do this, we
ordinarily make various plots in an intelligent manner. This
instructional exercise will tell you the best way to make plots
that answer a portion of the basic inquiries we commonly have
of our data.
References:
Bowen Yu, Claudio T. Silva (2019). Florence: A Natural
Language Interface for Visual Data Exploration within a
Dataflow System
Submitted on 2 Aug 2019 (v1), last revised 6 Oct 2019 (this
version, v2)
Zhe Cui, Sriram Karthik Badam, Adil Yalçin, Niklas
Elmqvist(2018). DataSite: Proactive Visual Data Exploration
with Computation of Insight-based Recommendations
Submitted on 23 Feb 2018 (v1), last revised 22 Sep 2018 (this
version, v3)
Response 3:
Information visualization emerged from research in human-
computer interaction, computer science, graphics, visual design,
psychology, and business methods(Shneiderman and Bederson
2003). It allows to intuitively access results of complex models,
even for nonexperts, while not being limited to intrinsic
application fields. In fact, information visualization is
increasingly considered as critical components scientific
research, data mining, digital libraries, financial data analysis,
manufacturing production control, market studies, and drug
discovery (Shneiderman andBederson 2003). The growing
amount of data collected and produced in modern society
contains hidden knowledge that needs to be considered in
decision making. Due to the data connecting the information
visualization (top) and the data mining (bottom) processes
volume and complexity information, visualization can no longer
be applied alone. A new research discipline within information
visualization was introduced. Visual analytics is defined as “the
science of analytical reasoning facilitated by interactive visual
interfaces” (Thomas and Cook 2005). The goal of visual
analytics research is the creation of tools and techniques to
enable the user to (a) synthesize information and derive insight
from massive, dynamic, ambiguous, and often conflicting data,
(b)detect the expected and discover the unexpected, (c) provide
timely, defensible, and understandable assessments, and (d)
communicate assessment effectively for action. In contrast to
pure information visualization, visual analytics combines
interactive visualization with automated data analysis methods
to provide scalable interactive decision support. Figure 15.2
shows an adaptation of Keim’s widely accepted process model
for visual analytics (Keim et al. 2008). The visual data
exploration process from information visualization (upper part),
and automated data analysis methods (lower part) are combined
with one visual, and interactive analysis process model. The
users directly included in the model by interactive access to the
process steps. This generic process model makes visual
analytics applicable to a variety of data-oriented research fields
such as engineering, financial analysis, public safety and
security, environment and climate change, as well as
socioeconomic applications and policy analysis, respectively.
The scope of visual analytics can also be described in terms of
the incorporated information and communication technologies
(ICT) key technologies like information visualization, data
mining, knowledge discovery or modeling, and simulation
(Keim et al. 2008). In its framework program seven, the
European Commission (EC) emphasized visualization as a key
technology in the objective for ICT for governance and policy
modeling (European Commission 2010). Recently,
methodologies on how to design and implement information
visualization and visual analytics solutions for data-driven
challenges of domain specialists have been presented (Munzner
2009; Sedlmair et al. 2012). Due to their reflection upon
practical experiences of hundreds of information visualization
and visual analytics research papers, the value of the introduced
methodologies is widely recognized. In these methodologies,
visualization researchers are guided in how to analyze a specific
real-world problem faced by domain experts, how to design
visualization systems that support solving this problem, and
how to validate the design. Considering information
visualization validation, we refer to Lam et al. (2012). Recent
approaches in visual analytics focus on the questions on how to
simplify the access to the analysis functionality of visual
analytics techniques, and on how to present analysis results.
This includes the analysis process with its intermediate steps,
and the findings derived from the visual analytics techniques
(Kosara and Mackinlay2013).
PHY 101 Milestone Two Guidelines and Rubric
The final project for this course is the creation of an analysis
report. For Milestone Three, you will submit Setup of the
Quantitative Description of Your Rube
Goldberg Device Step.
This milestone is due in Module Five. It will provide an
additional step towards the completion of the final project. This
step should be fully analyzed in the final
submission. Your submission will demonstrate the knowledge of
how to calculate the values that give a quantitative description
of what is going on during the
selected step and at the transitions to/from the neighboring
steps, using the quantitative description as a starting point.
Specifically, the following critical elements must be addressed:
I. Step Selection: Select a step or stage in the Rube Goldberg
device. Provide a concise description of the step.
II. Previous Step
A. Description: Analyze the behavior of the object in the
interaction between the previous step and the selected step,
qualitatively describing the
transfer of energy that occurs. Which principles of conservation
of energy and momentum can you apply to this behavior?
B. Equations: Provide the equations that can be used to describe
the transfer of energy and the momentum of the object from the
previous step to
the selected step. What is the connection between the basic
physics concepts in the equations and the interaction of the
object and force(s)
from step to step?
C. Calculations: Using the applicable equations you identified,
calculate the transfer of energy and the momentum from the
previous step to the
selected step. How do these calculations help you predict the
object’s location and velocity from the previous step to the step
you selected?
III. Selected Step
B. Equations: If applicable, provide the equations that can be
used to describe the change in type and amount of energy across
the selected step.
C. Energy Calculation: Calculate the amount of energy that is
converted from one form to another form using the changes in
mass and height. For
example, if appropriate for your selected step, you could
calculate the transformation of potential energy to kinetic
energy.
IV. Subsequent Step
A. Description: Analyze the behavior of the object in the
interaction between the selected step and the subsequent step,
qualitatively describing
the transfer of energy that occurs. Which principles of
conservation of energy and momentum can you apply to this
behavior?
B. Equations: Provide the equations that can be used to describe
the transfer of energy and the momentum of the object. What is
the connection
between the basic physics concepts in the equations and the
interaction of the object and force(s) from step to step?
C. Calculations: Using the applicable equations you identified,
calculate the transfer of energy and the momentum from your
selected step to the
subsequent step. How do these calculations help you predict the
object’s location and velocity from the step you selected to the
subsequent
step?
Guidelines for Submission: Submit assignment as a Word
document with double spacing, 12-point Times New Roman
font, and one-inch margins. Your
paper should be 2- to 3-pages.
Critical Elements Proficient (100%) Needs Improvement (75%)
Not Evident (0%) Value
Step Selection Selects and concisely describes step in
Rube Goldberg device
Selects and describes step in Rube
Goldberg device but description is wordy
or vague
Does not select and describe step in Rube
Goldberg device
10
Previous Step:
Description
Accurately analyzes behavior of object in
the interaction between the previous step
and the selected step, qualitatively
describing the transfer of energy that
occurs, and applies principles of
conservation of energy and momentum to
behavior
Analyzes behavior of object in the
interaction between the previous step and
the selected step and applies principles of
conservation of energy and momentum to
behavior but response lacks accuracy,
detail, or qualitative description of
transfer of energy
Does not analyze behavior of object in the
interaction between the previous step and
the selected step and does not apply
principles of conservation of energy and
momentum to behavior
10
Previous Step:
Equations
Provides correct equations for describing
the transfer of energy and momentum of
the object from the previous step to the
selected step and clearly explains the
connection between laws and principles
in the equations and the interaction of the
object and force(s)
Provides equations for describing the
transfer of energy and momentum of the
object from the previous step to the
selected step and explains the connection
between laws and principles in the
equations and the interaction of the
object and force(s), but not all equations
are correct or explanation lacks clarity or
detail
Does not provide equations for describing
the transfer of energy and momentum of
the object from the previous step to the
selected step
10
Previous Step:
Calculations
Accurately calculates the transfer of
energy and momentum from the previous
step to the selected step and clearly
explains how the calculations can be used
to predict the object’s location and
velocity
Calculates the transfer of energy and
momentum from the previous step to the
selected step and explains how the
calculations can be used to predict the
object’s location and velocity, but
calculations contain inaccuracies or
explanation lacks clarity or detail
Does not calculate the transfer of energy
and momentum from the previous step to
the selected step
10
Selected Step:
Equations
Provides correct, applicable equations for
describing the change in type and amount
of energy across the selected step
Provides equations for describing the
change in type and amount of energy
across the selected step but not all
equations are correct or applicable to
energy changes
Does not provide equations for describing
the change in type and amount of energy
across the selected step
10
Selected Step: Energy
Calculation
Accurately calculates the amount of
energy converted from one form to
another using changes in mass and height
Calculates the amount of energy
converted from one form to another using
changes in mass and height but with gaps
in accuracy
Does not calculate the amount of energy
converted from one form to another using
changes in mass and height
10
Subsequent Step:
Description
Accurately analyzes behavior of object in
the interaction between the selected step
and the subsequent step, qualitatively
describing the transfer of energy that
occurs, and applies principles of
conservation of energy and momentum to
behavior
Analyzes behavior of object in the
interaction between the selected step and
the subsequent step and applies
principles of conservation of energy and
momentum to behavior, but response
lacks accuracy, detail, or qualitative
description of transfer of energy
Does not analyze behavior of object in the
interaction between the selected step and
the subsequent step and does not apply
principles of conservation of energy and
momentum to behavior
10
Subsequent Step:
Equations
Provides correct equations for describing
the transfer of energy and momentum of
the object from the selected step to the
subsequent step and clearly explains the
connection between laws and principles
in the equations and the interaction of the
object and force(s)
Provides equations for describing the
transfer of energy and momentum of the
object from the selected step to the
subsequent step and explains the
connection between laws and principles
in the equations and the interaction of the
object and force(s), but not all equations
are correct or explanation lacks clarity or
detail
Does not provide equations for describing
the transfer of energy and momentum of
the object from the selected step to the
subsequent step
10
Subsequent Step:
Calculations
Accurately calculates the transfer of
energy and momentum from the selected
step to the subsequent step and clearly
explains how the calculations can be used
to predict the object’s location and
velocity
Calculates the transfer of energy and
momentum from the selected step to the
subsequent step and explains how the
calculations can be used to predict the
object’s location and velocity, but
calculations contain inaccuracies or
explanation lacks clarity or detail
Does not calculate the transfer of energy
and momentum from the selected step to
the subsequent step
10
Articulation of
Response
Submission has no major errors related to
citations, grammar, spelling, syntax, or
organization
Submission has major errors related to
citations, grammar, spelling, syntax, or
organization that negatively impact
readability and articulation of main ideas
Submission has critical errors related to
citations, grammar, spelling, syntax, or
organization that prevent understanding
of ideas
10
Earned Total 100%
PHY 101 Milestone Two Guidelines and Rubric
Running head: QUALITATIVE DESCRIPTION OF YOUR
RUBE GOLDBERG DEVICE STEP 1
QUALITATIVE DESCRIPTION OF YOUR RUBE GOLDBERG
DEVICE STEP 2
Qualitative Description of Your Rube Goldberg Device Step
Calvin Singh
SNHU
PHY 101: Milestone One.
Qualitative Description of Your Rube Goldberg Device Step.
I. Step Selection
a. Select a step or stage in the Rube Goldberg device. Provide a
concise description of the step.
In this step, I will have a rubber block weighing 5kg on a
table being pulled by a falling weight connected via a pulley
using a chain. The rubber block rests 10cm away from the edge
of the table and attains an acceleration of 3m/s^2 in 2 seconds
before falling off the table’s edge. The static friction coefficient
(µs) is 1.0, while the kinetic friction coefficient (µk) is 0.7.
II. Selected Step A. Initial Velocity
a. Calculate the initial velocity of the object in the selected
step.
The initial velocity of the rubber block is 0m/s. This is because
the rubber block is resting stationary on the table. According to
Newton’s first law of motion, a body at rest will stay at rest
until a net external force acts on it (Suleiman, 2018). In the
setup, the net external force due to the falling weight that will
overcome the friction force between the rubber block and the
surface of the table
b. What does the initial velocity of the object tell you about the
behavior of the object?
The 0m/s velocity implies that the rubber block remains in
a state of inertia until the net force due to the falling weight
causes it to move. When the falling weight pulls the rubber
block, the rubber block simultaneously pulls the falling weight.
These forces are opposite in direction and equal in size.
Selected step B. Velocity and Force Calculations
c. Calculate the change in velocity that would be observed
based on kinematics and force principles.
Change in velocity = Final velocity – Initial velocity.
Final velocity = displacement / time.
Final velocity = 10 cm / 2 seconds = 5cm/s =0.05m/s.
Change in velocity = 0.05m/s.
d. Then, use Newton’s Second Law to calculate the force acting
on the object.
Newton’s second states that the acceleration of an object
as produced by a net force is directly proportional to the
magnitude of the net force, in the same direction as the net
force, and inversely proportional to the mass of the object
(Roeder, 2017).
F = ma.
In the set-up, the force that causes the rubber block to
accelerate towards the table’s edge, ma is equal to the force due
to the weight of the falling weight, mg. These forces are equal
in size and exert in the opposite direction.
F = ma = mg = 5kg × 3m/s^2 = 15N.
Considering the effects of static and kinetic friction,
Static friction, Ff max = µsF =1.0 × 15 = 15N.
Kinetic friction, Ff = µkF =0.7 × 15 = 10.5N
References.
Roeder, J. L. (2017). More on deriving Newton’s second
law. The Physics Teacher, 55(7), 388-388.
Suleiman, R. (2018). Newton's First Law revisited. Journal of
Modern Physics.

More Related Content

Similar to Milestone 2 Guidance For your final project… Most importa.docx

Unit2
Unit2Unit2
Pentaho Meeting 2008 - Statistics & BI
Pentaho Meeting 2008 - Statistics & BIPentaho Meeting 2008 - Statistics & BI
Pentaho Meeting 2008 - Statistics & BI
Studio Synthesis
 
Analyzing Performance Test Data
Analyzing Performance Test DataAnalyzing Performance Test Data
Analyzing Performance Test Data
Optimus Information Inc.
 
V2 i9 ijertv2is90699-1
V2 i9 ijertv2is90699-1V2 i9 ijertv2is90699-1
V2 i9 ijertv2is90699-1
warishali570
 
lec13_ref.pdf
lec13_ref.pdflec13_ref.pdf
lec13_ref.pdf
vishal choudhary
 
IRJET- Machine Learning: Survey, Types and Challenges
IRJET- Machine Learning: Survey, Types and ChallengesIRJET- Machine Learning: Survey, Types and Challenges
IRJET- Machine Learning: Survey, Types and Challenges
IRJET Journal
 
old seven quality control tools
old seven quality control toolsold seven quality control tools
old seven quality control tools
Vivek Singh Chauhan
 
fmelleHumanActivityRecognitionWithMobileSensors
fmelleHumanActivityRecognitionWithMobileSensorsfmelleHumanActivityRecognitionWithMobileSensors
fmelleHumanActivityRecognitionWithMobileSensorsFridtjof Melle
 
A Study On Hybrid System
A Study On Hybrid SystemA Study On Hybrid System
A Study On Hybrid System
Carmen Sanborn
 
Mining Frequent Patterns and Associations from the Smart meters using Bayesia...
Mining Frequent Patterns and Associations from the Smart meters using Bayesia...Mining Frequent Patterns and Associations from the Smart meters using Bayesia...
Mining Frequent Patterns and Associations from the Smart meters using Bayesia...
Eswar Publications
 
Top Machine Learning Algorithms Used By AI Professionals ARTiBA.pdf
Top Machine Learning Algorithms Used By AI Professionals ARTiBA.pdfTop Machine Learning Algorithms Used By AI Professionals ARTiBA.pdf
Top Machine Learning Algorithms Used By AI Professionals ARTiBA.pdf
Artificial Intelligence Board of America
 
How ml can improve purchase conversions
How ml can improve purchase conversionsHow ml can improve purchase conversions
How ml can improve purchase conversions
Sudeep Shukla
 
OPTIMIZATION IN ENGINE DESIGN VIA FORMAL CONCEPT ANALYSIS USING NEGATIVE ATTR...
OPTIMIZATION IN ENGINE DESIGN VIA FORMAL CONCEPT ANALYSIS USING NEGATIVE ATTR...OPTIMIZATION IN ENGINE DESIGN VIA FORMAL CONCEPT ANALYSIS USING NEGATIVE ATTR...
OPTIMIZATION IN ENGINE DESIGN VIA FORMAL CONCEPT ANALYSIS USING NEGATIVE ATTR...
csandit
 
OPTIMIZATION IN ENGINE DESIGN VIA FORMAL CONCEPT ANALYSIS USING NEGATIVE ATTR...
OPTIMIZATION IN ENGINE DESIGN VIA FORMAL CONCEPT ANALYSIS USING NEGATIVE ATTR...OPTIMIZATION IN ENGINE DESIGN VIA FORMAL CONCEPT ANALYSIS USING NEGATIVE ATTR...
OPTIMIZATION IN ENGINE DESIGN VIA FORMAL CONCEPT ANALYSIS USING NEGATIVE ATTR...
cscpconf
 
Krupa rm
Krupa rmKrupa rm
Krupa rm
Krupa Mehta
 
Lecture-1-Introduction to Deep learning.pptx
Lecture-1-Introduction to Deep learning.pptxLecture-1-Introduction to Deep learning.pptx
Lecture-1-Introduction to Deep learning.pptx
JayChauhan100
 
Running Head Data Mining in The Cloud .docx
Running Head Data Mining in The Cloud                            .docxRunning Head Data Mining in The Cloud                            .docx
Running Head Data Mining in The Cloud .docx
healdkathaleen
 
Data analysis_PredictingActivity_SamsungSensorData
Data analysis_PredictingActivity_SamsungSensorDataData analysis_PredictingActivity_SamsungSensorData
Data analysis_PredictingActivity_SamsungSensorData
Karen Yang
 
Fairness in Search & RecSys 네이버 검색 콜로키움 김진영
Fairness in Search & RecSys 네이버 검색 콜로키움 김진영Fairness in Search & RecSys 네이버 검색 콜로키움 김진영
Fairness in Search & RecSys 네이버 검색 콜로키움 김진영
Jin Young Kim
 

Similar to Milestone 2 Guidance For your final project… Most importa.docx (19)

Unit2
Unit2Unit2
Unit2
 
Pentaho Meeting 2008 - Statistics & BI
Pentaho Meeting 2008 - Statistics & BIPentaho Meeting 2008 - Statistics & BI
Pentaho Meeting 2008 - Statistics & BI
 
Analyzing Performance Test Data
Analyzing Performance Test DataAnalyzing Performance Test Data
Analyzing Performance Test Data
 
V2 i9 ijertv2is90699-1
V2 i9 ijertv2is90699-1V2 i9 ijertv2is90699-1
V2 i9 ijertv2is90699-1
 
lec13_ref.pdf
lec13_ref.pdflec13_ref.pdf
lec13_ref.pdf
 
IRJET- Machine Learning: Survey, Types and Challenges
IRJET- Machine Learning: Survey, Types and ChallengesIRJET- Machine Learning: Survey, Types and Challenges
IRJET- Machine Learning: Survey, Types and Challenges
 
old seven quality control tools
old seven quality control toolsold seven quality control tools
old seven quality control tools
 
fmelleHumanActivityRecognitionWithMobileSensors
fmelleHumanActivityRecognitionWithMobileSensorsfmelleHumanActivityRecognitionWithMobileSensors
fmelleHumanActivityRecognitionWithMobileSensors
 
A Study On Hybrid System
A Study On Hybrid SystemA Study On Hybrid System
A Study On Hybrid System
 
Mining Frequent Patterns and Associations from the Smart meters using Bayesia...
Mining Frequent Patterns and Associations from the Smart meters using Bayesia...Mining Frequent Patterns and Associations from the Smart meters using Bayesia...
Mining Frequent Patterns and Associations from the Smart meters using Bayesia...
 
Top Machine Learning Algorithms Used By AI Professionals ARTiBA.pdf
Top Machine Learning Algorithms Used By AI Professionals ARTiBA.pdfTop Machine Learning Algorithms Used By AI Professionals ARTiBA.pdf
Top Machine Learning Algorithms Used By AI Professionals ARTiBA.pdf
 
How ml can improve purchase conversions
How ml can improve purchase conversionsHow ml can improve purchase conversions
How ml can improve purchase conversions
 
OPTIMIZATION IN ENGINE DESIGN VIA FORMAL CONCEPT ANALYSIS USING NEGATIVE ATTR...
OPTIMIZATION IN ENGINE DESIGN VIA FORMAL CONCEPT ANALYSIS USING NEGATIVE ATTR...OPTIMIZATION IN ENGINE DESIGN VIA FORMAL CONCEPT ANALYSIS USING NEGATIVE ATTR...
OPTIMIZATION IN ENGINE DESIGN VIA FORMAL CONCEPT ANALYSIS USING NEGATIVE ATTR...
 
OPTIMIZATION IN ENGINE DESIGN VIA FORMAL CONCEPT ANALYSIS USING NEGATIVE ATTR...
OPTIMIZATION IN ENGINE DESIGN VIA FORMAL CONCEPT ANALYSIS USING NEGATIVE ATTR...OPTIMIZATION IN ENGINE DESIGN VIA FORMAL CONCEPT ANALYSIS USING NEGATIVE ATTR...
OPTIMIZATION IN ENGINE DESIGN VIA FORMAL CONCEPT ANALYSIS USING NEGATIVE ATTR...
 
Krupa rm
Krupa rmKrupa rm
Krupa rm
 
Lecture-1-Introduction to Deep learning.pptx
Lecture-1-Introduction to Deep learning.pptxLecture-1-Introduction to Deep learning.pptx
Lecture-1-Introduction to Deep learning.pptx
 
Running Head Data Mining in The Cloud .docx
Running Head Data Mining in The Cloud                            .docxRunning Head Data Mining in The Cloud                            .docx
Running Head Data Mining in The Cloud .docx
 
Data analysis_PredictingActivity_SamsungSensorData
Data analysis_PredictingActivity_SamsungSensorDataData analysis_PredictingActivity_SamsungSensorData
Data analysis_PredictingActivity_SamsungSensorData
 
Fairness in Search & RecSys 네이버 검색 콜로키움 김진영
Fairness in Search & RecSys 네이버 검색 콜로키움 김진영Fairness in Search & RecSys 네이버 검색 콜로키움 김진영
Fairness in Search & RecSys 네이버 검색 콜로키움 김진영
 

More from altheaboyer

InstructionsUNIXLinux Versus Mac Versus WindowsWrite a 4.docx
InstructionsUNIXLinux Versus Mac Versus WindowsWrite a 4.docxInstructionsUNIXLinux Versus Mac Versus WindowsWrite a 4.docx
InstructionsUNIXLinux Versus Mac Versus WindowsWrite a 4.docx
altheaboyer
 
InstructionsUsing theWeek 5 research template identify.docx
InstructionsUsing theWeek 5 research template identify.docxInstructionsUsing theWeek 5 research template identify.docx
InstructionsUsing theWeek 5 research template identify.docx
altheaboyer
 
InstructionsWritten Assignment 1The purpose of this assignment i.docx
InstructionsWritten Assignment 1The purpose of this assignment i.docxInstructionsWritten Assignment 1The purpose of this assignment i.docx
InstructionsWritten Assignment 1The purpose of this assignment i.docx
altheaboyer
 
InstructionsRead the assigned article by Linstrom (2004), an.docx
InstructionsRead the assigned article by Linstrom (2004), an.docxInstructionsRead the assigned article by Linstrom (2004), an.docx
InstructionsRead the assigned article by Linstrom (2004), an.docx
altheaboyer
 
InstructionsPlease complete the required federal corporation .docx
InstructionsPlease complete the required federal corporation .docxInstructionsPlease complete the required federal corporation .docx
InstructionsPlease complete the required federal corporation .docx
altheaboyer
 
InstructionsHW Assignments will be uploaded to Kean Blackboard a.docx
InstructionsHW Assignments will be uploaded to Kean Blackboard a.docxInstructionsHW Assignments will be uploaded to Kean Blackboard a.docx
InstructionsHW Assignments will be uploaded to Kean Blackboard a.docx
altheaboyer
 
InstructionsDue within 6-7 hoursSelect a past act of terrorism.docx
InstructionsDue within 6-7 hoursSelect a past act of terrorism.docxInstructionsDue within 6-7 hoursSelect a past act of terrorism.docx
InstructionsDue within 6-7 hoursSelect a past act of terrorism.docx
altheaboyer
 
INSTRUCTIONSA detailed and thoughtful response Minimum of 500 wor.docx
INSTRUCTIONSA detailed and thoughtful response Minimum of 500 wor.docxINSTRUCTIONSA detailed and thoughtful response Minimum of 500 wor.docx
INSTRUCTIONSA detailed and thoughtful response Minimum of 500 wor.docx
altheaboyer
 
InstructionsDevelop a six-to-eight-page document in Word format d.docx
InstructionsDevelop a six-to-eight-page document in Word format d.docxInstructionsDevelop a six-to-eight-page document in Word format d.docx
InstructionsDevelop a six-to-eight-page document in Word format d.docx
altheaboyer
 
InstructionsCheck with TURN IT IN Create a portable forensi.docx
InstructionsCheck with TURN IT IN Create a portable forensi.docxInstructionsCheck with TURN IT IN Create a portable forensi.docx
InstructionsCheck with TURN IT IN Create a portable forensi.docx
altheaboyer
 
InstructionsContent ReviewDirectionsRespond to each item. Eac.docx
InstructionsContent ReviewDirectionsRespond to each item. Eac.docxInstructionsContent ReviewDirectionsRespond to each item. Eac.docx
InstructionsContent ReviewDirectionsRespond to each item. Eac.docx
altheaboyer
 
instructions1.   Create an APA-style Title Page for this assignm.docx
instructions1.   Create an APA-style Title Page for this assignm.docxinstructions1.   Create an APA-style Title Page for this assignm.docx
instructions1.   Create an APA-style Title Page for this assignm.docx
altheaboyer
 
Instructions1. Prepare a bank reconciliation.2. Journalize the n.docx
Instructions1. Prepare a bank reconciliation.2. Journalize the n.docxInstructions1. Prepare a bank reconciliation.2. Journalize the n.docx
Instructions1. Prepare a bank reconciliation.2. Journalize the n.docx
altheaboyer
 
Instructions1. Create an APA-style Title Page for this a.docx
Instructions1. Create an APA-style Title Page for this a.docxInstructions1. Create an APA-style Title Page for this a.docx
Instructions1. Create an APA-style Title Page for this a.docx
altheaboyer
 
Instructions You are responsible for creating a healthcare system .docx
Instructions You are responsible for creating a healthcare system .docxInstructions You are responsible for creating a healthcare system .docx
Instructions You are responsible for creating a healthcare system .docx
altheaboyer
 
Instructions  Create a 1-2 page questionnaire for your patients .docx
Instructions  Create a 1-2 page questionnaire for your patients .docxInstructions  Create a 1-2 page questionnaire for your patients .docx
Instructions  Create a 1-2 page questionnaire for your patients .docx
altheaboyer
 
InstructionsDirections Be sure to make an electronic copy of your.docx
InstructionsDirections Be sure to make an electronic copy of your.docxInstructionsDirections Be sure to make an electronic copy of your.docx
InstructionsDirections Be sure to make an electronic copy of your.docx
altheaboyer
 
InstructionsDisciplinary Assignment Part 1 Instructions.docx
InstructionsDisciplinary Assignment Part 1 Instructions.docxInstructionsDisciplinary Assignment Part 1 Instructions.docx
InstructionsDisciplinary Assignment Part 1 Instructions.docx
altheaboyer
 
InstructionsFor this assignment propose a scenario where you.docx
InstructionsFor this assignment propose a scenario where you.docxInstructionsFor this assignment propose a scenario where you.docx
InstructionsFor this assignment propose a scenario where you.docx
altheaboyer
 
instructions1.   Create an APA-style Title Page for this assig.docx
instructions1.   Create an APA-style Title Page for this assig.docxinstructions1.   Create an APA-style Title Page for this assig.docx
instructions1.   Create an APA-style Title Page for this assig.docx
altheaboyer
 

More from altheaboyer (20)

InstructionsUNIXLinux Versus Mac Versus WindowsWrite a 4.docx
InstructionsUNIXLinux Versus Mac Versus WindowsWrite a 4.docxInstructionsUNIXLinux Versus Mac Versus WindowsWrite a 4.docx
InstructionsUNIXLinux Versus Mac Versus WindowsWrite a 4.docx
 
InstructionsUsing theWeek 5 research template identify.docx
InstructionsUsing theWeek 5 research template identify.docxInstructionsUsing theWeek 5 research template identify.docx
InstructionsUsing theWeek 5 research template identify.docx
 
InstructionsWritten Assignment 1The purpose of this assignment i.docx
InstructionsWritten Assignment 1The purpose of this assignment i.docxInstructionsWritten Assignment 1The purpose of this assignment i.docx
InstructionsWritten Assignment 1The purpose of this assignment i.docx
 
InstructionsRead the assigned article by Linstrom (2004), an.docx
InstructionsRead the assigned article by Linstrom (2004), an.docxInstructionsRead the assigned article by Linstrom (2004), an.docx
InstructionsRead the assigned article by Linstrom (2004), an.docx
 
InstructionsPlease complete the required federal corporation .docx
InstructionsPlease complete the required federal corporation .docxInstructionsPlease complete the required federal corporation .docx
InstructionsPlease complete the required federal corporation .docx
 
InstructionsHW Assignments will be uploaded to Kean Blackboard a.docx
InstructionsHW Assignments will be uploaded to Kean Blackboard a.docxInstructionsHW Assignments will be uploaded to Kean Blackboard a.docx
InstructionsHW Assignments will be uploaded to Kean Blackboard a.docx
 
InstructionsDue within 6-7 hoursSelect a past act of terrorism.docx
InstructionsDue within 6-7 hoursSelect a past act of terrorism.docxInstructionsDue within 6-7 hoursSelect a past act of terrorism.docx
InstructionsDue within 6-7 hoursSelect a past act of terrorism.docx
 
INSTRUCTIONSA detailed and thoughtful response Minimum of 500 wor.docx
INSTRUCTIONSA detailed and thoughtful response Minimum of 500 wor.docxINSTRUCTIONSA detailed and thoughtful response Minimum of 500 wor.docx
INSTRUCTIONSA detailed and thoughtful response Minimum of 500 wor.docx
 
InstructionsDevelop a six-to-eight-page document in Word format d.docx
InstructionsDevelop a six-to-eight-page document in Word format d.docxInstructionsDevelop a six-to-eight-page document in Word format d.docx
InstructionsDevelop a six-to-eight-page document in Word format d.docx
 
InstructionsCheck with TURN IT IN Create a portable forensi.docx
InstructionsCheck with TURN IT IN Create a portable forensi.docxInstructionsCheck with TURN IT IN Create a portable forensi.docx
InstructionsCheck with TURN IT IN Create a portable forensi.docx
 
InstructionsContent ReviewDirectionsRespond to each item. Eac.docx
InstructionsContent ReviewDirectionsRespond to each item. Eac.docxInstructionsContent ReviewDirectionsRespond to each item. Eac.docx
InstructionsContent ReviewDirectionsRespond to each item. Eac.docx
 
instructions1.   Create an APA-style Title Page for this assignm.docx
instructions1.   Create an APA-style Title Page for this assignm.docxinstructions1.   Create an APA-style Title Page for this assignm.docx
instructions1.   Create an APA-style Title Page for this assignm.docx
 
Instructions1. Prepare a bank reconciliation.2. Journalize the n.docx
Instructions1. Prepare a bank reconciliation.2. Journalize the n.docxInstructions1. Prepare a bank reconciliation.2. Journalize the n.docx
Instructions1. Prepare a bank reconciliation.2. Journalize the n.docx
 
Instructions1. Create an APA-style Title Page for this a.docx
Instructions1. Create an APA-style Title Page for this a.docxInstructions1. Create an APA-style Title Page for this a.docx
Instructions1. Create an APA-style Title Page for this a.docx
 
Instructions You are responsible for creating a healthcare system .docx
Instructions You are responsible for creating a healthcare system .docxInstructions You are responsible for creating a healthcare system .docx
Instructions You are responsible for creating a healthcare system .docx
 
Instructions  Create a 1-2 page questionnaire for your patients .docx
Instructions  Create a 1-2 page questionnaire for your patients .docxInstructions  Create a 1-2 page questionnaire for your patients .docx
Instructions  Create a 1-2 page questionnaire for your patients .docx
 
InstructionsDirections Be sure to make an electronic copy of your.docx
InstructionsDirections Be sure to make an electronic copy of your.docxInstructionsDirections Be sure to make an electronic copy of your.docx
InstructionsDirections Be sure to make an electronic copy of your.docx
 
InstructionsDisciplinary Assignment Part 1 Instructions.docx
InstructionsDisciplinary Assignment Part 1 Instructions.docxInstructionsDisciplinary Assignment Part 1 Instructions.docx
InstructionsDisciplinary Assignment Part 1 Instructions.docx
 
InstructionsFor this assignment propose a scenario where you.docx
InstructionsFor this assignment propose a scenario where you.docxInstructionsFor this assignment propose a scenario where you.docx
InstructionsFor this assignment propose a scenario where you.docx
 
instructions1.   Create an APA-style Title Page for this assig.docx
instructions1.   Create an APA-style Title Page for this assig.docxinstructions1.   Create an APA-style Title Page for this assig.docx
instructions1.   Create an APA-style Title Page for this assig.docx
 

Recently uploaded

Unit 2- Research Aptitude (UGC NET Paper I).pdf
Unit 2- Research Aptitude (UGC NET Paper I).pdfUnit 2- Research Aptitude (UGC NET Paper I).pdf
Unit 2- Research Aptitude (UGC NET Paper I).pdf
Thiyagu K
 
The Roman Empire A Historical Colossus.pdf
The Roman Empire A Historical Colossus.pdfThe Roman Empire A Historical Colossus.pdf
The Roman Empire A Historical Colossus.pdf
kaushalkr1407
 
CLASS 11 CBSE B.St Project AIDS TO TRADE - INSURANCE
CLASS 11 CBSE B.St Project AIDS TO TRADE - INSURANCECLASS 11 CBSE B.St Project AIDS TO TRADE - INSURANCE
CLASS 11 CBSE B.St Project AIDS TO TRADE - INSURANCE
BhavyaRajput3
 
MARUTI SUZUKI- A Successful Joint Venture in India.pptx
MARUTI SUZUKI- A Successful Joint Venture in India.pptxMARUTI SUZUKI- A Successful Joint Venture in India.pptx
MARUTI SUZUKI- A Successful Joint Venture in India.pptx
bennyroshan06
 
The Challenger.pdf DNHS Official Publication
The Challenger.pdf DNHS Official PublicationThe Challenger.pdf DNHS Official Publication
The Challenger.pdf DNHS Official Publication
Delapenabediema
 
Synthetic Fiber Construction in lab .pptx
Synthetic Fiber Construction in lab .pptxSynthetic Fiber Construction in lab .pptx
Synthetic Fiber Construction in lab .pptx
Pavel ( NSTU)
 
Additional Benefits for Employee Website.pdf
Additional Benefits for Employee Website.pdfAdditional Benefits for Employee Website.pdf
Additional Benefits for Employee Website.pdf
joachimlavalley1
 
Language Across the Curriculm LAC B.Ed.
Language Across the  Curriculm LAC B.Ed.Language Across the  Curriculm LAC B.Ed.
Language Across the Curriculm LAC B.Ed.
Atul Kumar Singh
 
Sectors of the Indian Economy - Class 10 Study Notes pdf
Sectors of the Indian Economy - Class 10 Study Notes pdfSectors of the Indian Economy - Class 10 Study Notes pdf
Sectors of the Indian Economy - Class 10 Study Notes pdf
Vivekanand Anglo Vedic Academy
 
Supporting (UKRI) OA monographs at Salford.pptx
Supporting (UKRI) OA monographs at Salford.pptxSupporting (UKRI) OA monographs at Salford.pptx
Supporting (UKRI) OA monographs at Salford.pptx
Jisc
 
The French Revolution Class 9 Study Material pdf free download
The French Revolution Class 9 Study Material pdf free downloadThe French Revolution Class 9 Study Material pdf free download
The French Revolution Class 9 Study Material pdf free download
Vivekanand Anglo Vedic Academy
 
How to Make a Field invisible in Odoo 17
How to Make a Field invisible in Odoo 17How to Make a Field invisible in Odoo 17
How to Make a Field invisible in Odoo 17
Celine George
 
Digital Tools and AI for Teaching Learning and Research
Digital Tools and AI for Teaching Learning and ResearchDigital Tools and AI for Teaching Learning and Research
Digital Tools and AI for Teaching Learning and Research
Vikramjit Singh
 
Thesis Statement for students diagnonsed withADHD.ppt
Thesis Statement for students diagnonsed withADHD.pptThesis Statement for students diagnonsed withADHD.ppt
Thesis Statement for students diagnonsed withADHD.ppt
EverAndrsGuerraGuerr
 
Cambridge International AS A Level Biology Coursebook - EBook (MaryFosbery J...
Cambridge International AS  A Level Biology Coursebook - EBook (MaryFosbery J...Cambridge International AS  A Level Biology Coursebook - EBook (MaryFosbery J...
Cambridge International AS A Level Biology Coursebook - EBook (MaryFosbery J...
AzmatAli747758
 
PART A. Introduction to Costumer Service
PART A. Introduction to Costumer ServicePART A. Introduction to Costumer Service
PART A. Introduction to Costumer Service
PedroFerreira53928
 
Template Jadual Bertugas Kelas (Boleh Edit)
Template Jadual Bertugas Kelas (Boleh Edit)Template Jadual Bertugas Kelas (Boleh Edit)
Template Jadual Bertugas Kelas (Boleh Edit)
rosedainty
 
ESC Beyond Borders _From EU to You_ InfoPack general.pdf
ESC Beyond Borders _From EU to You_ InfoPack general.pdfESC Beyond Borders _From EU to You_ InfoPack general.pdf
ESC Beyond Borders _From EU to You_ InfoPack general.pdf
Fundacja Rozwoju Społeczeństwa Przedsiębiorczego
 
Overview on Edible Vaccine: Pros & Cons with Mechanism
Overview on Edible Vaccine: Pros & Cons with MechanismOverview on Edible Vaccine: Pros & Cons with Mechanism
Overview on Edible Vaccine: Pros & Cons with Mechanism
DeeptiGupta154
 
Basic phrases for greeting and assisting costumers
Basic phrases for greeting and assisting costumersBasic phrases for greeting and assisting costumers
Basic phrases for greeting and assisting costumers
PedroFerreira53928
 

Recently uploaded (20)

Unit 2- Research Aptitude (UGC NET Paper I).pdf
Unit 2- Research Aptitude (UGC NET Paper I).pdfUnit 2- Research Aptitude (UGC NET Paper I).pdf
Unit 2- Research Aptitude (UGC NET Paper I).pdf
 
The Roman Empire A Historical Colossus.pdf
The Roman Empire A Historical Colossus.pdfThe Roman Empire A Historical Colossus.pdf
The Roman Empire A Historical Colossus.pdf
 
CLASS 11 CBSE B.St Project AIDS TO TRADE - INSURANCE
CLASS 11 CBSE B.St Project AIDS TO TRADE - INSURANCECLASS 11 CBSE B.St Project AIDS TO TRADE - INSURANCE
CLASS 11 CBSE B.St Project AIDS TO TRADE - INSURANCE
 
MARUTI SUZUKI- A Successful Joint Venture in India.pptx
MARUTI SUZUKI- A Successful Joint Venture in India.pptxMARUTI SUZUKI- A Successful Joint Venture in India.pptx
MARUTI SUZUKI- A Successful Joint Venture in India.pptx
 
The Challenger.pdf DNHS Official Publication
The Challenger.pdf DNHS Official PublicationThe Challenger.pdf DNHS Official Publication
The Challenger.pdf DNHS Official Publication
 
Synthetic Fiber Construction in lab .pptx
Synthetic Fiber Construction in lab .pptxSynthetic Fiber Construction in lab .pptx
Synthetic Fiber Construction in lab .pptx
 
Additional Benefits for Employee Website.pdf
Additional Benefits for Employee Website.pdfAdditional Benefits for Employee Website.pdf
Additional Benefits for Employee Website.pdf
 
Language Across the Curriculm LAC B.Ed.
Language Across the  Curriculm LAC B.Ed.Language Across the  Curriculm LAC B.Ed.
Language Across the Curriculm LAC B.Ed.
 
Sectors of the Indian Economy - Class 10 Study Notes pdf
Sectors of the Indian Economy - Class 10 Study Notes pdfSectors of the Indian Economy - Class 10 Study Notes pdf
Sectors of the Indian Economy - Class 10 Study Notes pdf
 
Supporting (UKRI) OA monographs at Salford.pptx
Supporting (UKRI) OA monographs at Salford.pptxSupporting (UKRI) OA monographs at Salford.pptx
Supporting (UKRI) OA monographs at Salford.pptx
 
The French Revolution Class 9 Study Material pdf free download
The French Revolution Class 9 Study Material pdf free downloadThe French Revolution Class 9 Study Material pdf free download
The French Revolution Class 9 Study Material pdf free download
 
How to Make a Field invisible in Odoo 17
How to Make a Field invisible in Odoo 17How to Make a Field invisible in Odoo 17
How to Make a Field invisible in Odoo 17
 
Digital Tools and AI for Teaching Learning and Research
Digital Tools and AI for Teaching Learning and ResearchDigital Tools and AI for Teaching Learning and Research
Digital Tools and AI for Teaching Learning and Research
 
Thesis Statement for students diagnonsed withADHD.ppt
Thesis Statement for students diagnonsed withADHD.pptThesis Statement for students diagnonsed withADHD.ppt
Thesis Statement for students diagnonsed withADHD.ppt
 
Cambridge International AS A Level Biology Coursebook - EBook (MaryFosbery J...
Cambridge International AS  A Level Biology Coursebook - EBook (MaryFosbery J...Cambridge International AS  A Level Biology Coursebook - EBook (MaryFosbery J...
Cambridge International AS A Level Biology Coursebook - EBook (MaryFosbery J...
 
PART A. Introduction to Costumer Service
PART A. Introduction to Costumer ServicePART A. Introduction to Costumer Service
PART A. Introduction to Costumer Service
 
Template Jadual Bertugas Kelas (Boleh Edit)
Template Jadual Bertugas Kelas (Boleh Edit)Template Jadual Bertugas Kelas (Boleh Edit)
Template Jadual Bertugas Kelas (Boleh Edit)
 
ESC Beyond Borders _From EU to You_ InfoPack general.pdf
ESC Beyond Borders _From EU to You_ InfoPack general.pdfESC Beyond Borders _From EU to You_ InfoPack general.pdf
ESC Beyond Borders _From EU to You_ InfoPack general.pdf
 
Overview on Edible Vaccine: Pros & Cons with Mechanism
Overview on Edible Vaccine: Pros & Cons with MechanismOverview on Edible Vaccine: Pros & Cons with Mechanism
Overview on Edible Vaccine: Pros & Cons with Mechanism
 
Basic phrases for greeting and assisting costumers
Basic phrases for greeting and assisting costumersBasic phrases for greeting and assisting costumers
Basic phrases for greeting and assisting costumers
 

Milestone 2 Guidance For your final project… Most importa.docx

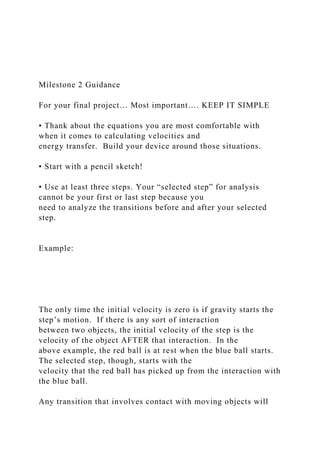
  • 1. Milestone 2 Guidance For your final project… Most important…. KEEP IT SIMPLE • Thank about the equations you are most comfortable with when it comes to calculating velocities and energy transfer. Build your device around those situations. • Start with a pencil sketch! • Use at least three steps. Your “selected step” for analysis cannot be your first or last step because you need to analyze the transitions before and after your selected step. Example: The only time the initial velocity is zero is if gravity starts the step’s motion. If there is any sort of interaction between two objects, the initial velocity of the step is the velocity of the object AFTER that interaction. In the above example, the red ball is at rest when the blue ball starts. The selected step, though, starts with the velocity that the red ball has picked up from the interaction with the blue ball. Any transition that involves contact with moving objects will
  • 2. have a transfer of energy. For an object that flips a switch and releases a ball allowing gravity to act on it, there is work done to flip the switch, but no energy transferred to the next step. For Milestone Two, if you chose the step that you will analyze for your final project, you can use the work you do for Milestone Two and my feedback to make it all perfect for the final submission. For Part 1 of this milestone, you will describe the selected step. For Part 2 of Milestone 2, we look to the transition between the previous step and the selected step: This section has three parts. First, describe in words what is happening between the two objects at the transition and how the energy is being transferred. This is just to set the stage, do not include equations and numbers in this intro section. The second part is to introduce the equations you will be using to track the energy and momentum. Conservation of momentum tells us that the total momentum before the collision will equal that total momentum after the collision. Conservation of energy tells us that the total kinetic energy before the collision is equal to the total kinetic energy after the collision. The trick is to write the equations to match those two scenarios. The assignment also asks you to explain “the connection between
  • 3. the basic physics concepts in the equations and the interaction of the object and force(s) from step to step.” That means you need to explain what numbers you will plug into the equations, where you will find them and what you will solve for. The final part of this section is to perform the calculations and describe how those numbers indicate the future path of the object in the selected step. In Part 3 of Milestone 2, we look at how the energy distribution changes throughout the course of the selected step: We are looking at the changes in kinetic and potential energy as the ball travels through the selected step. The total energy remains constant throughout the step. This example has changes in height, which means changes in potential and kinetic energy. Your selected step might not have changes in height, which means you will not have any changes in how the energy is distributed. If that is the case, be sure to explain why there is no change in energy… don’t just skip this part of the milestone! For Part 4 of Milestone 2, we go through the exact same process as we did for Part 2, but we use the transition to the subsequent step for our analysis.
  • 4. When I set up my scene, I double clicked (right click on a PC) on the blue ball and looked for the VELOCITY option. I set the initial velocity to 3.5 m/sec to kick off the interaction. In the MATERIALS option, I set the friction to zero and the restitution to one. A restitution of one is what makes the collisions elastic and zero friction will give us constant energy throughout the motion. After that, I clicked on all objects and surfaces one at a time to make those same friction and restitution settings. Most of all, have fun with it!! Try not to overthink it. Review the project guidelines again after you finish writing your project and use the checklist below to make sure it is complete: energy through the interaction between previous and selected step. What do you know about energy and momentum? and momentum transfer between steps. Also indicate what you will measure and what you will solve for. standard units. energy throughout the step, then perform
  • 5. the calculations showing all work and using standard units. If there are no energy changes, explain why the energy does not change. DO NOT SKIP THIS PART interaction between selected and subsequent step. What do you know about energy and momentum? and momentum transfer between steps. Also indicate what you will measure and what you will solve for. standard units. You can also use the project rubric to ensure each section has the required amount of detail. Response 1: Visual Analytics is a process to transform the approach information into an opportunity in a way as information visualization has changed our view on databases, the purpose of Visual Analytics is to make the frameworks of taking care of data and information clear for an analytic discourse. Visual Analytics helps in propelling the gainful evaluation, change and quick improvement of the strategies and models improving the data for choosing better decisions. The degree of visual Analytics can in like manner be depicted similar to the merged information and communication technology (ICT) key advances like information visualization, data mining, knowledge discovery or illustrating, and reenactment" (Janssen, Wimmer and Deljoo, 2015, p. 325). The two important parts of the model given by Keim,2008 are information visualization (upper part) and automated data analysis (lower part). The four pieces of
  • 6. visual data examination are visualization, Data, Models and knowledge. Here I would like to discuss the process between visualization and models, in perspective on data volume and complexity information visualization can't be honestly applied. Here comes the necessity for data analytics. Visualization visualizes the changed data in the structure where the customer can get data and assist in building models. At the point when the model is made the parameters which are ought to have been modified are then changed and is given to the data which is then moved to the Data where the additional data mining is finished and the yield of data mining is given to the models. Right, when all-out data mining is finished the results are given from the models to portrayal for model discernment. This system of coordination of visual and customized data assessment technique is valuable for expansive and keen decision help. Visual analytics actions help development that joins the characteristics of human and electronic data planning, discernment transforms into the techniques for a semi-robotized informative strategy, where individuals and machines take an interest using their specific undeniable capacities for the best results (Keim, 2008). Response 2: Visual data exploration may appear Analytics 101, yet experts who avoid this progression may pass up significant bits of knowledge and a more profound comprehension of the data with which they are working. On the off chance that something glances wrong in your data, it presumably isn't right, said Tatiana Gabor, an investigation supervisor for the income group at music gushing organization Spotify. Visual data disclosure instruments reliably rank among examination buyers' top needs. Be that as it may, the product is regularly conveyed as an end unto itself, with
  • 7. numerous organizations buying it to work as a self- administration investigation apparatus for business clients. In the hands of experienced data researchers, in any case, it can create much more profound bits of knowledge. Data exploration is a suggested initial phase in any investigation, yet examiners frequently simply take a gander at numbers: rundown measurements like mean, middle and spread. They don't generally take part in visual data exploration. A few examiners additionally carry a lot of suspicions to data and test those immediately by running the data through a relapse or grouping model. Yet, hopping to these strategies initially can make an examiner disregard significant highlights of the data. Data visualization is a basic device in the data investigation process. Visualization errands can extend from creating key appropriation plots to understanding the interaction of complex powerful factors in AI calculations. In this instructional exercise, we center around the utilization of visualization for beginning data investigation. Data visualization is a basic apparatus in the data examination process. Visualization undertakings can extend from creating crucial appropriation plots to understanding the interaction of complex powerful factors in AI calculations. In this instructional exercise, we center around the utilization of visualization for starting data investigation. Visual data investigation is a required initial step whether progressively formal examination pursues. At the point when joined with expressive insights, visualization gives a viable method to recognize synopses, structure, connections, contrasts, and variations from the norm in the data. In many cases, no detailed investigation is fundamental as all the significant determinations required for a choice are apparent from basic visual assessment of the data. Different occasions, data investigation will be utilized to help control the data cleaning, include determination, and examining process. In any case, visual data investigation is tied in with researching the attributes of your data set. To do this, we
  • 8. ordinarily make various plots in an intelligent manner. This instructional exercise will tell you the best way to make plots that answer a portion of the basic inquiries we commonly have of our data. References: Bowen Yu, Claudio T. Silva (2019). Florence: A Natural Language Interface for Visual Data Exploration within a Dataflow System Submitted on 2 Aug 2019 (v1), last revised 6 Oct 2019 (this version, v2) Zhe Cui, Sriram Karthik Badam, Adil Yalçin, Niklas Elmqvist(2018). DataSite: Proactive Visual Data Exploration with Computation of Insight-based Recommendations Submitted on 23 Feb 2018 (v1), last revised 22 Sep 2018 (this version, v3) Response 3: Information visualization emerged from research in human- computer interaction, computer science, graphics, visual design, psychology, and business methods(Shneiderman and Bederson 2003). It allows to intuitively access results of complex models, even for nonexperts, while not being limited to intrinsic
  • 9. application fields. In fact, information visualization is increasingly considered as critical components scientific research, data mining, digital libraries, financial data analysis, manufacturing production control, market studies, and drug discovery (Shneiderman andBederson 2003). The growing amount of data collected and produced in modern society contains hidden knowledge that needs to be considered in decision making. Due to the data connecting the information visualization (top) and the data mining (bottom) processes volume and complexity information, visualization can no longer be applied alone. A new research discipline within information visualization was introduced. Visual analytics is defined as “the science of analytical reasoning facilitated by interactive visual interfaces” (Thomas and Cook 2005). The goal of visual analytics research is the creation of tools and techniques to enable the user to (a) synthesize information and derive insight from massive, dynamic, ambiguous, and often conflicting data, (b)detect the expected and discover the unexpected, (c) provide timely, defensible, and understandable assessments, and (d) communicate assessment effectively for action. In contrast to pure information visualization, visual analytics combines interactive visualization with automated data analysis methods to provide scalable interactive decision support. Figure 15.2 shows an adaptation of Keim’s widely accepted process model for visual analytics (Keim et al. 2008). The visual data exploration process from information visualization (upper part), and automated data analysis methods (lower part) are combined with one visual, and interactive analysis process model. The users directly included in the model by interactive access to the process steps. This generic process model makes visual analytics applicable to a variety of data-oriented research fields such as engineering, financial analysis, public safety and security, environment and climate change, as well as socioeconomic applications and policy analysis, respectively. The scope of visual analytics can also be described in terms of the incorporated information and communication technologies
  • 10. (ICT) key technologies like information visualization, data mining, knowledge discovery or modeling, and simulation (Keim et al. 2008). In its framework program seven, the European Commission (EC) emphasized visualization as a key technology in the objective for ICT for governance and policy modeling (European Commission 2010). Recently, methodologies on how to design and implement information visualization and visual analytics solutions for data-driven challenges of domain specialists have been presented (Munzner 2009; Sedlmair et al. 2012). Due to their reflection upon practical experiences of hundreds of information visualization and visual analytics research papers, the value of the introduced methodologies is widely recognized. In these methodologies, visualization researchers are guided in how to analyze a specific real-world problem faced by domain experts, how to design visualization systems that support solving this problem, and how to validate the design. Considering information visualization validation, we refer to Lam et al. (2012). Recent approaches in visual analytics focus on the questions on how to simplify the access to the analysis functionality of visual analytics techniques, and on how to present analysis results. This includes the analysis process with its intermediate steps, and the findings derived from the visual analytics techniques (Kosara and Mackinlay2013). PHY 101 Milestone Two Guidelines and Rubric The final project for this course is the creation of an analysis report. For Milestone Three, you will submit Setup of the Quantitative Description of Your Rube Goldberg Device Step. This milestone is due in Module Five. It will provide an
  • 11. additional step towards the completion of the final project. This step should be fully analyzed in the final submission. Your submission will demonstrate the knowledge of how to calculate the values that give a quantitative description of what is going on during the selected step and at the transitions to/from the neighboring steps, using the quantitative description as a starting point. Specifically, the following critical elements must be addressed: I. Step Selection: Select a step or stage in the Rube Goldberg device. Provide a concise description of the step. II. Previous Step A. Description: Analyze the behavior of the object in the interaction between the previous step and the selected step, qualitatively describing the transfer of energy that occurs. Which principles of conservation of energy and momentum can you apply to this behavior? B. Equations: Provide the equations that can be used to describe the transfer of energy and the momentum of the object from the previous step to the selected step. What is the connection between the basic physics concepts in the equations and the interaction of the object and force(s) from step to step? C. Calculations: Using the applicable equations you identified, calculate the transfer of energy and the momentum from the previous step to the selected step. How do these calculations help you predict the object’s location and velocity from the previous step to the step
  • 12. you selected? III. Selected Step B. Equations: If applicable, provide the equations that can be used to describe the change in type and amount of energy across the selected step. C. Energy Calculation: Calculate the amount of energy that is converted from one form to another form using the changes in mass and height. For example, if appropriate for your selected step, you could calculate the transformation of potential energy to kinetic energy. IV. Subsequent Step A. Description: Analyze the behavior of the object in the interaction between the selected step and the subsequent step, qualitatively describing the transfer of energy that occurs. Which principles of conservation of energy and momentum can you apply to this behavior? B. Equations: Provide the equations that can be used to describe the transfer of energy and the momentum of the object. What is the connection between the basic physics concepts in the equations and the interaction of the object and force(s) from step to step? C. Calculations: Using the applicable equations you identified, calculate the transfer of energy and the momentum from your selected step to the subsequent step. How do these calculations help you predict the
  • 13. object’s location and velocity from the step you selected to the subsequent step? Guidelines for Submission: Submit assignment as a Word document with double spacing, 12-point Times New Roman font, and one-inch margins. Your paper should be 2- to 3-pages. Critical Elements Proficient (100%) Needs Improvement (75%) Not Evident (0%) Value Step Selection Selects and concisely describes step in Rube Goldberg device Selects and describes step in Rube Goldberg device but description is wordy or vague Does not select and describe step in Rube Goldberg device 10 Previous Step: Description Accurately analyzes behavior of object in the interaction between the previous step and the selected step, qualitatively
  • 14. describing the transfer of energy that occurs, and applies principles of conservation of energy and momentum to behavior Analyzes behavior of object in the interaction between the previous step and the selected step and applies principles of conservation of energy and momentum to behavior but response lacks accuracy, detail, or qualitative description of transfer of energy Does not analyze behavior of object in the interaction between the previous step and the selected step and does not apply principles of conservation of energy and momentum to behavior 10 Previous Step: Equations Provides correct equations for describing the transfer of energy and momentum of the object from the previous step to the selected step and clearly explains the connection between laws and principles in the equations and the interaction of the object and force(s) Provides equations for describing the transfer of energy and momentum of the object from the previous step to the selected step and explains the connection
  • 15. between laws and principles in the equations and the interaction of the object and force(s), but not all equations are correct or explanation lacks clarity or detail Does not provide equations for describing the transfer of energy and momentum of the object from the previous step to the selected step 10 Previous Step: Calculations Accurately calculates the transfer of energy and momentum from the previous step to the selected step and clearly explains how the calculations can be used to predict the object’s location and velocity Calculates the transfer of energy and momentum from the previous step to the selected step and explains how the calculations can be used to predict the object’s location and velocity, but calculations contain inaccuracies or explanation lacks clarity or detail Does not calculate the transfer of energy and momentum from the previous step to the selected step 10
  • 16. Selected Step: Equations Provides correct, applicable equations for describing the change in type and amount of energy across the selected step Provides equations for describing the change in type and amount of energy across the selected step but not all equations are correct or applicable to energy changes Does not provide equations for describing the change in type and amount of energy across the selected step 10 Selected Step: Energy Calculation Accurately calculates the amount of energy converted from one form to another using changes in mass and height Calculates the amount of energy converted from one form to another using changes in mass and height but with gaps in accuracy Does not calculate the amount of energy converted from one form to another using changes in mass and height
  • 17. 10 Subsequent Step: Description Accurately analyzes behavior of object in the interaction between the selected step and the subsequent step, qualitatively describing the transfer of energy that occurs, and applies principles of conservation of energy and momentum to behavior Analyzes behavior of object in the interaction between the selected step and the subsequent step and applies principles of conservation of energy and momentum to behavior, but response lacks accuracy, detail, or qualitative description of transfer of energy Does not analyze behavior of object in the interaction between the selected step and the subsequent step and does not apply principles of conservation of energy and momentum to behavior 10 Subsequent Step: Equations Provides correct equations for describing
  • 18. the transfer of energy and momentum of the object from the selected step to the subsequent step and clearly explains the connection between laws and principles in the equations and the interaction of the object and force(s) Provides equations for describing the transfer of energy and momentum of the object from the selected step to the subsequent step and explains the connection between laws and principles in the equations and the interaction of the object and force(s), but not all equations are correct or explanation lacks clarity or detail Does not provide equations for describing the transfer of energy and momentum of the object from the selected step to the subsequent step 10 Subsequent Step: Calculations Accurately calculates the transfer of energy and momentum from the selected step to the subsequent step and clearly explains how the calculations can be used to predict the object’s location and velocity Calculates the transfer of energy and momentum from the selected step to the
  • 19. subsequent step and explains how the calculations can be used to predict the object’s location and velocity, but calculations contain inaccuracies or explanation lacks clarity or detail Does not calculate the transfer of energy and momentum from the selected step to the subsequent step 10 Articulation of Response Submission has no major errors related to citations, grammar, spelling, syntax, or organization Submission has major errors related to citations, grammar, spelling, syntax, or organization that negatively impact readability and articulation of main ideas Submission has critical errors related to citations, grammar, spelling, syntax, or organization that prevent understanding of ideas 10 Earned Total 100% PHY 101 Milestone Two Guidelines and Rubric Running head: QUALITATIVE DESCRIPTION OF YOUR
  • 20. RUBE GOLDBERG DEVICE STEP 1 QUALITATIVE DESCRIPTION OF YOUR RUBE GOLDBERG DEVICE STEP 2 Qualitative Description of Your Rube Goldberg Device Step Calvin Singh SNHU PHY 101: Milestone One. Qualitative Description of Your Rube Goldberg Device Step. I. Step Selection a. Select a step or stage in the Rube Goldberg device. Provide a concise description of the step. In this step, I will have a rubber block weighing 5kg on a table being pulled by a falling weight connected via a pulley using a chain. The rubber block rests 10cm away from the edge
  • 21. of the table and attains an acceleration of 3m/s^2 in 2 seconds before falling off the table’s edge. The static friction coefficient (µs) is 1.0, while the kinetic friction coefficient (µk) is 0.7. II. Selected Step A. Initial Velocity a. Calculate the initial velocity of the object in the selected step. The initial velocity of the rubber block is 0m/s. This is because the rubber block is resting stationary on the table. According to Newton’s first law of motion, a body at rest will stay at rest until a net external force acts on it (Suleiman, 2018). In the setup, the net external force due to the falling weight that will overcome the friction force between the rubber block and the surface of the table b. What does the initial velocity of the object tell you about the behavior of the object? The 0m/s velocity implies that the rubber block remains in a state of inertia until the net force due to the falling weight causes it to move. When the falling weight pulls the rubber block, the rubber block simultaneously pulls the falling weight. These forces are opposite in direction and equal in size. Selected step B. Velocity and Force Calculations c. Calculate the change in velocity that would be observed based on kinematics and force principles. Change in velocity = Final velocity – Initial velocity. Final velocity = displacement / time. Final velocity = 10 cm / 2 seconds = 5cm/s =0.05m/s. Change in velocity = 0.05m/s. d. Then, use Newton’s Second Law to calculate the force acting on the object. Newton’s second states that the acceleration of an object as produced by a net force is directly proportional to the magnitude of the net force, in the same direction as the net force, and inversely proportional to the mass of the object (Roeder, 2017). F = ma. In the set-up, the force that causes the rubber block to
  • 22. accelerate towards the table’s edge, ma is equal to the force due to the weight of the falling weight, mg. These forces are equal in size and exert in the opposite direction. F = ma = mg = 5kg × 3m/s^2 = 15N. Considering the effects of static and kinetic friction, Static friction, Ff max = µsF =1.0 × 15 = 15N. Kinetic friction, Ff = µkF =0.7 × 15 = 10.5N References. Roeder, J. L. (2017). More on deriving Newton’s second law. The Physics Teacher, 55(7), 388-388. Suleiman, R. (2018). Newton's First Law revisited. Journal of Modern Physics.