z
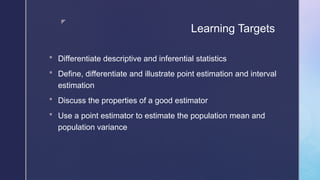
Learning Targets
Differentiatedescriptive and inferential statistics
Define, differentiate and illustrate point estimation and interval
estimation
Discuss the properties of a good estimator
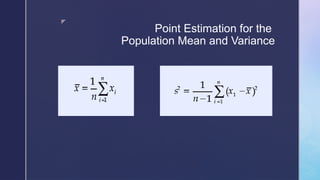
Use a point estimator to estimate the population mean and
population variance
4.
z
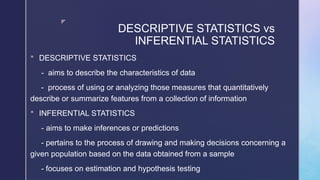
DESCRIPTIVE STATISTICS vs
INFERENTIALSTATISTICS
DESCRIPTIVE STATISTICS
- aims to describe the characteristics of data
- process of using or analyzing those measures that quantitatively
describe or summarize features from a collection of information
INFERENTIAL STATISTICS
- aims to make inferences or predictions
- pertains to the process of drawing and making decisions concerning a
given population based on the data obtained from a sample
- focuses on estimation and hypothesis testing
5.
z
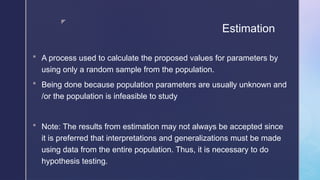
Estimation
A processused to calculate the proposed values for parameters by
using only a random sample from the population.
Being done because population parameters are usually unknown and
/or the population is infeasible to study
Note: The results from estimation may not always be accepted since
it is preferred that interpretations and generalizations must be made
using data from the entire population. Thus, it is necessary to do
hypothesis testing.
6.
z
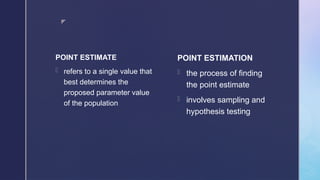
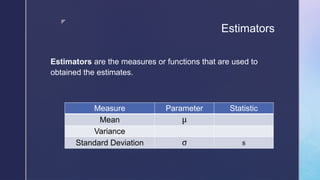
POINT ESTIMATE
- refersto a single value that
best determines the
proposed parameter value
of the population
POINT ESTIMATION
- the process of finding
the point estimate
- involves sampling and
hypothesis testing
z
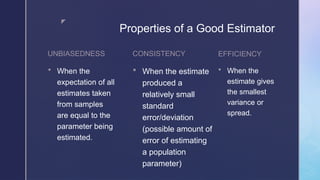
Properties of aGood Estimator
UNBIASEDNESS
When the
expectation of all
estimates taken
from samples
are equal to the
parameter being
estimated.
CONSISTENCY
When the estimate
produced a
relatively small
standard
error/deviation
(possible amount of
error of estimating
a population
parameter)
EFFICIENCY
When the
estimate gives
the smallest
variance or
spread.
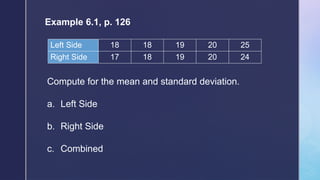
Example 6.1, p.126
A concert for a cause is attended by individuals of
different age groups. Given in the table below are the
ages of randomly selected audience of the concert.
Compute the point estimates if the randomly selected
audience in the right side and left side are being
considered.
11.
Example 6.1, p.126
Left Side 18 18 19 20 25
Right Side 17 18 19 20 24
Compute for the mean and standard deviation.
a. Left Side
b. Right Side
c. Combined
12.
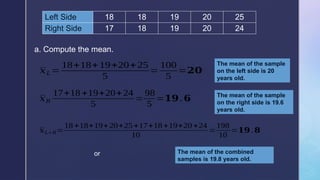
Left Side 1818 19 20 25
Right Side 17 18 19 20 24
a. Compute the mean.
𝑥𝐿=
18+18+19+20+25
5
=
100
5
=𝟐𝟎
The mean of the sample
on the left side is 20
years old.
𝑥𝑅
17+18 +19+20+24
5
=
98
5
=𝟏𝟗.𝟔 The mean of the sample
on the right side is 19.6
years old.
𝑥𝐿+ 𝑅=
18 +18+19+20+25+17+18+19+20 +24
10
=
198
10
=𝟏𝟗.𝟖
or The mean of the combined
samples is 19.8 years old.
13.
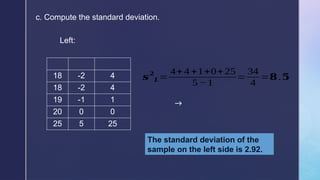
c. Compute thestandard deviation.
𝒔
𝟐
𝑳=
4+4 +1+0+25
5 −1
=
34
4
=𝟖.𝟓
The standard deviation of the
sample on the left side is 2.92.
18 -2 4
18 -2 4
19 -1 1
20 0 0
25 5 25
Left:
→
14.
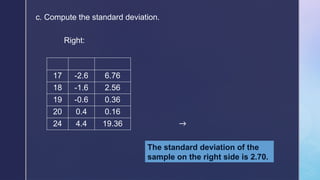
c. Compute thestandard deviation.
The standard deviation of the
sample on the right side is 2.70.
17 -2.6 6.76
18 -1.6 2.56
19 -0.6 0.36
20 0.4 0.16
24 4.4 19.36
Right:
→
15.
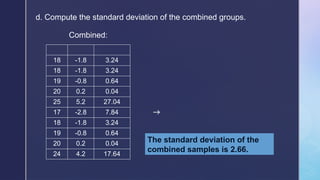
d. Compute thestandard deviation of the combined groups.
The standard deviation of the
combined samples is 2.66.
18 -1.8 3.24
18 -1.8 3.24
19 -0.8 0.64
20 0.2 0.04
25 5.2 27.04
17 -2.8 7.84
18 -1.8 3.24
19 -0.8 0.64
20 0.2 0.04
24 4.2 17.64
Combined:
→
16.
Enhancement (Seatwork):
Go overthe properties of a good estimator and
relate them to the obtained point estimates in Example
6.1. Which is the best estimator of the ages of the
audience:
the point estimate of sample
a. from the left,
b. from the right, or
c. the combined samples?
Why?