Download to read offline
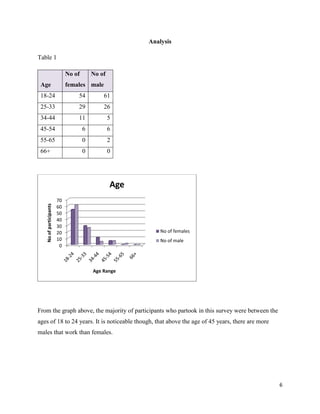
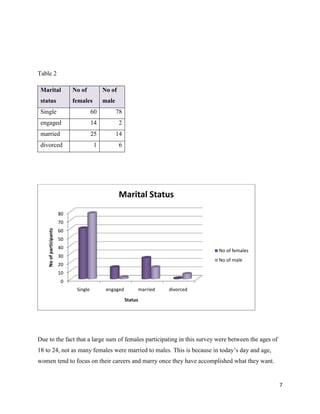
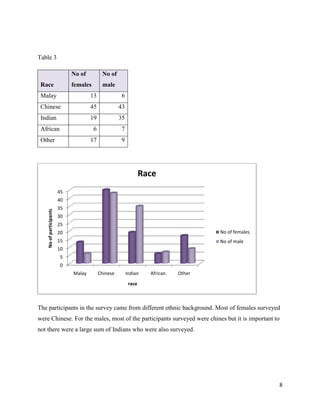
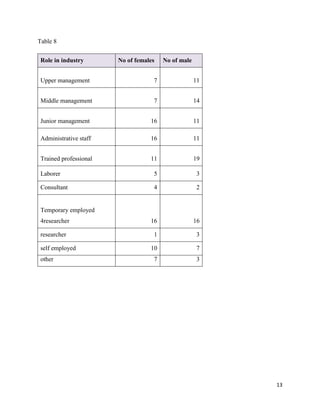
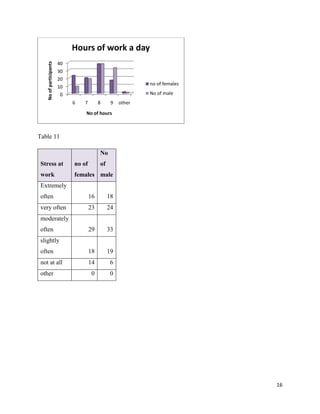
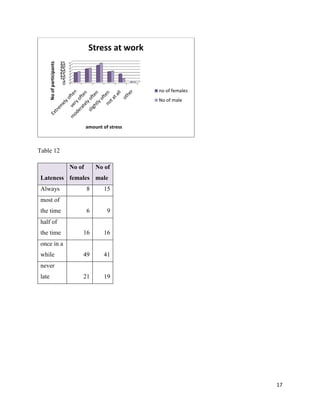
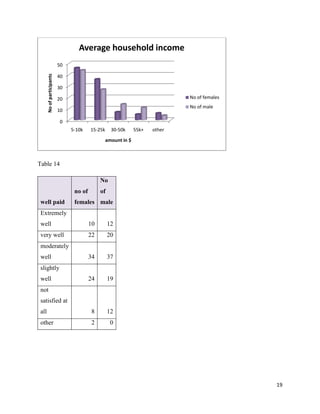
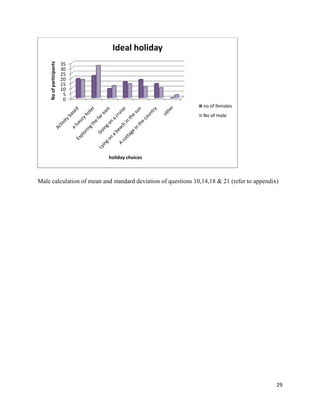


No of male type of holiday This document summarizes the results of a survey comparing males and females in the working world. The survey included 200 participants, with equal numbers of males and females. Some key findings from the survey include: - Females generally had higher educational qualifications than males, though some males had doctorates. - Both males and females worked equally in the public and private sectors. However, males held more managerial roles while females held more administrative roles. - On average, males earned higher salaries than females, despite some having similar jobs and qualifications. - Both males and females experienced moderate levels of stress at work and were sometimes late. However, more males reported being


