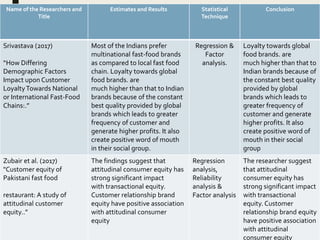
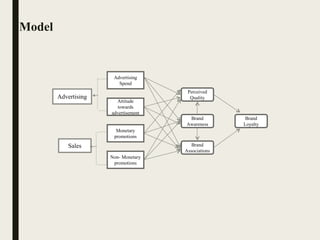
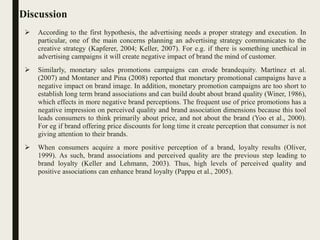
1) The document analyzes the impact of advertising and sales promotions on brand equity for international fast food brands in Pakistan. It studies how advertising spend, promotions, brand awareness, perceived quality, and associations influence brand loyalty.
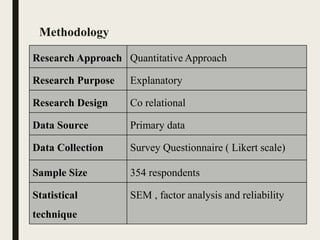
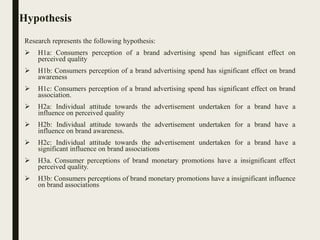
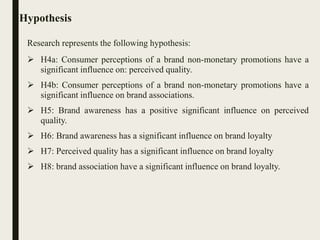
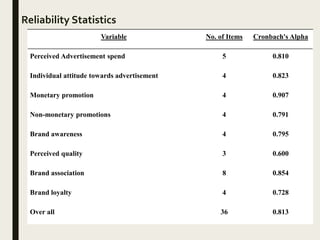
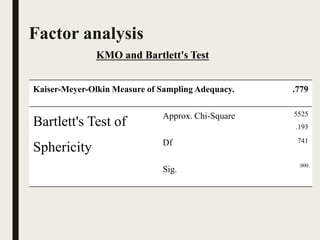
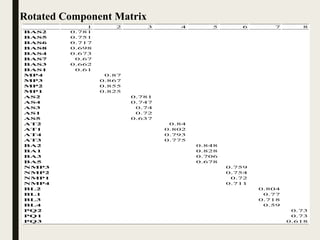
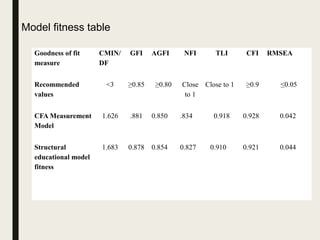
2) A model and hypotheses are proposed relating these brand equity dimensions. Data is collected through a survey and analyzed using reliability testing, factor analysis, and structural equation modeling.
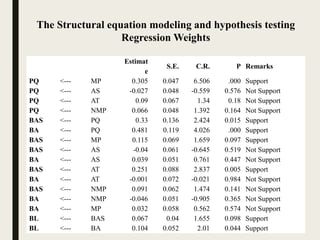
3) The results find that perceived quality positively impacts awareness and associations. Awareness and associations then positively influence loyalty. However, advertising spend was found to not significantly impact quality or awareness. Promotions had mixed effects on quality and associations.


![[rokonz.com] Glossary of Semantic SEO Part-1.pdf](https://cdn.slidesharecdn.com/ss_thumbnails/rokonz-260123200456-440e4060-thumbnail.jpg?width=640&height=640&fit=bounds)


![[rokonz.com] Glossary of Semantic SEO Part-3.pdf](https://cdn.slidesharecdn.com/ss_thumbnails/rokonz-260123200835-55123e1e-thumbnail.jpg?width=640&height=640&fit=bounds)


