Download to read offline


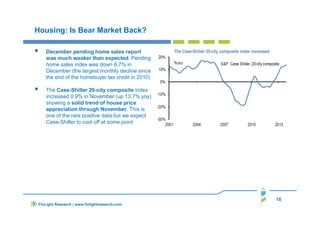
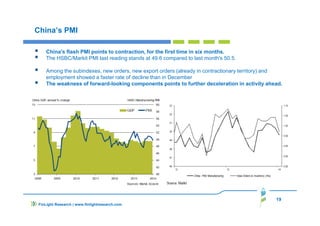
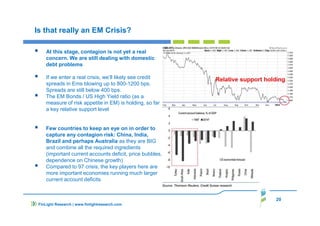
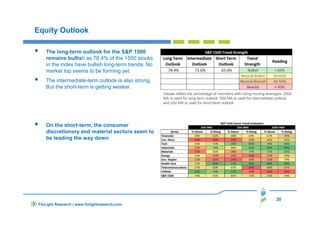


The document analyzes macroeconomic trends as of January 2014, highlighting a mixed global economic outlook with indicators of recovery in industrial production and employment, but signs of emerging risks in Europe and China. Consumer confidence is rising in the U.S., yet housing data shows weakness with declining new home sales and housing starts. The equity market is experiencing corrections amid concerns over high valuations, while emerging market equities face significant outflows and underperformance.


