Download to read offline


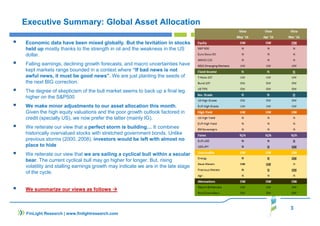

The document analyzes the current state of global markets, highlighting concerns over economic data mixed with a strengthening bull market, driven by oil prices and a weak dollar, amid fears of an impending market correction. It notes the cyclical nature of the bull market, with high equity valuations and low earnings growth suggesting a cautious approach to investing, particularly in stocks. Additionally, it emphasizes systemic risks in China and the deteriorating credit environment, urging a defensive asset allocation strategy.


