Downloaded 51 times
![Risk Assessment Essential Elements
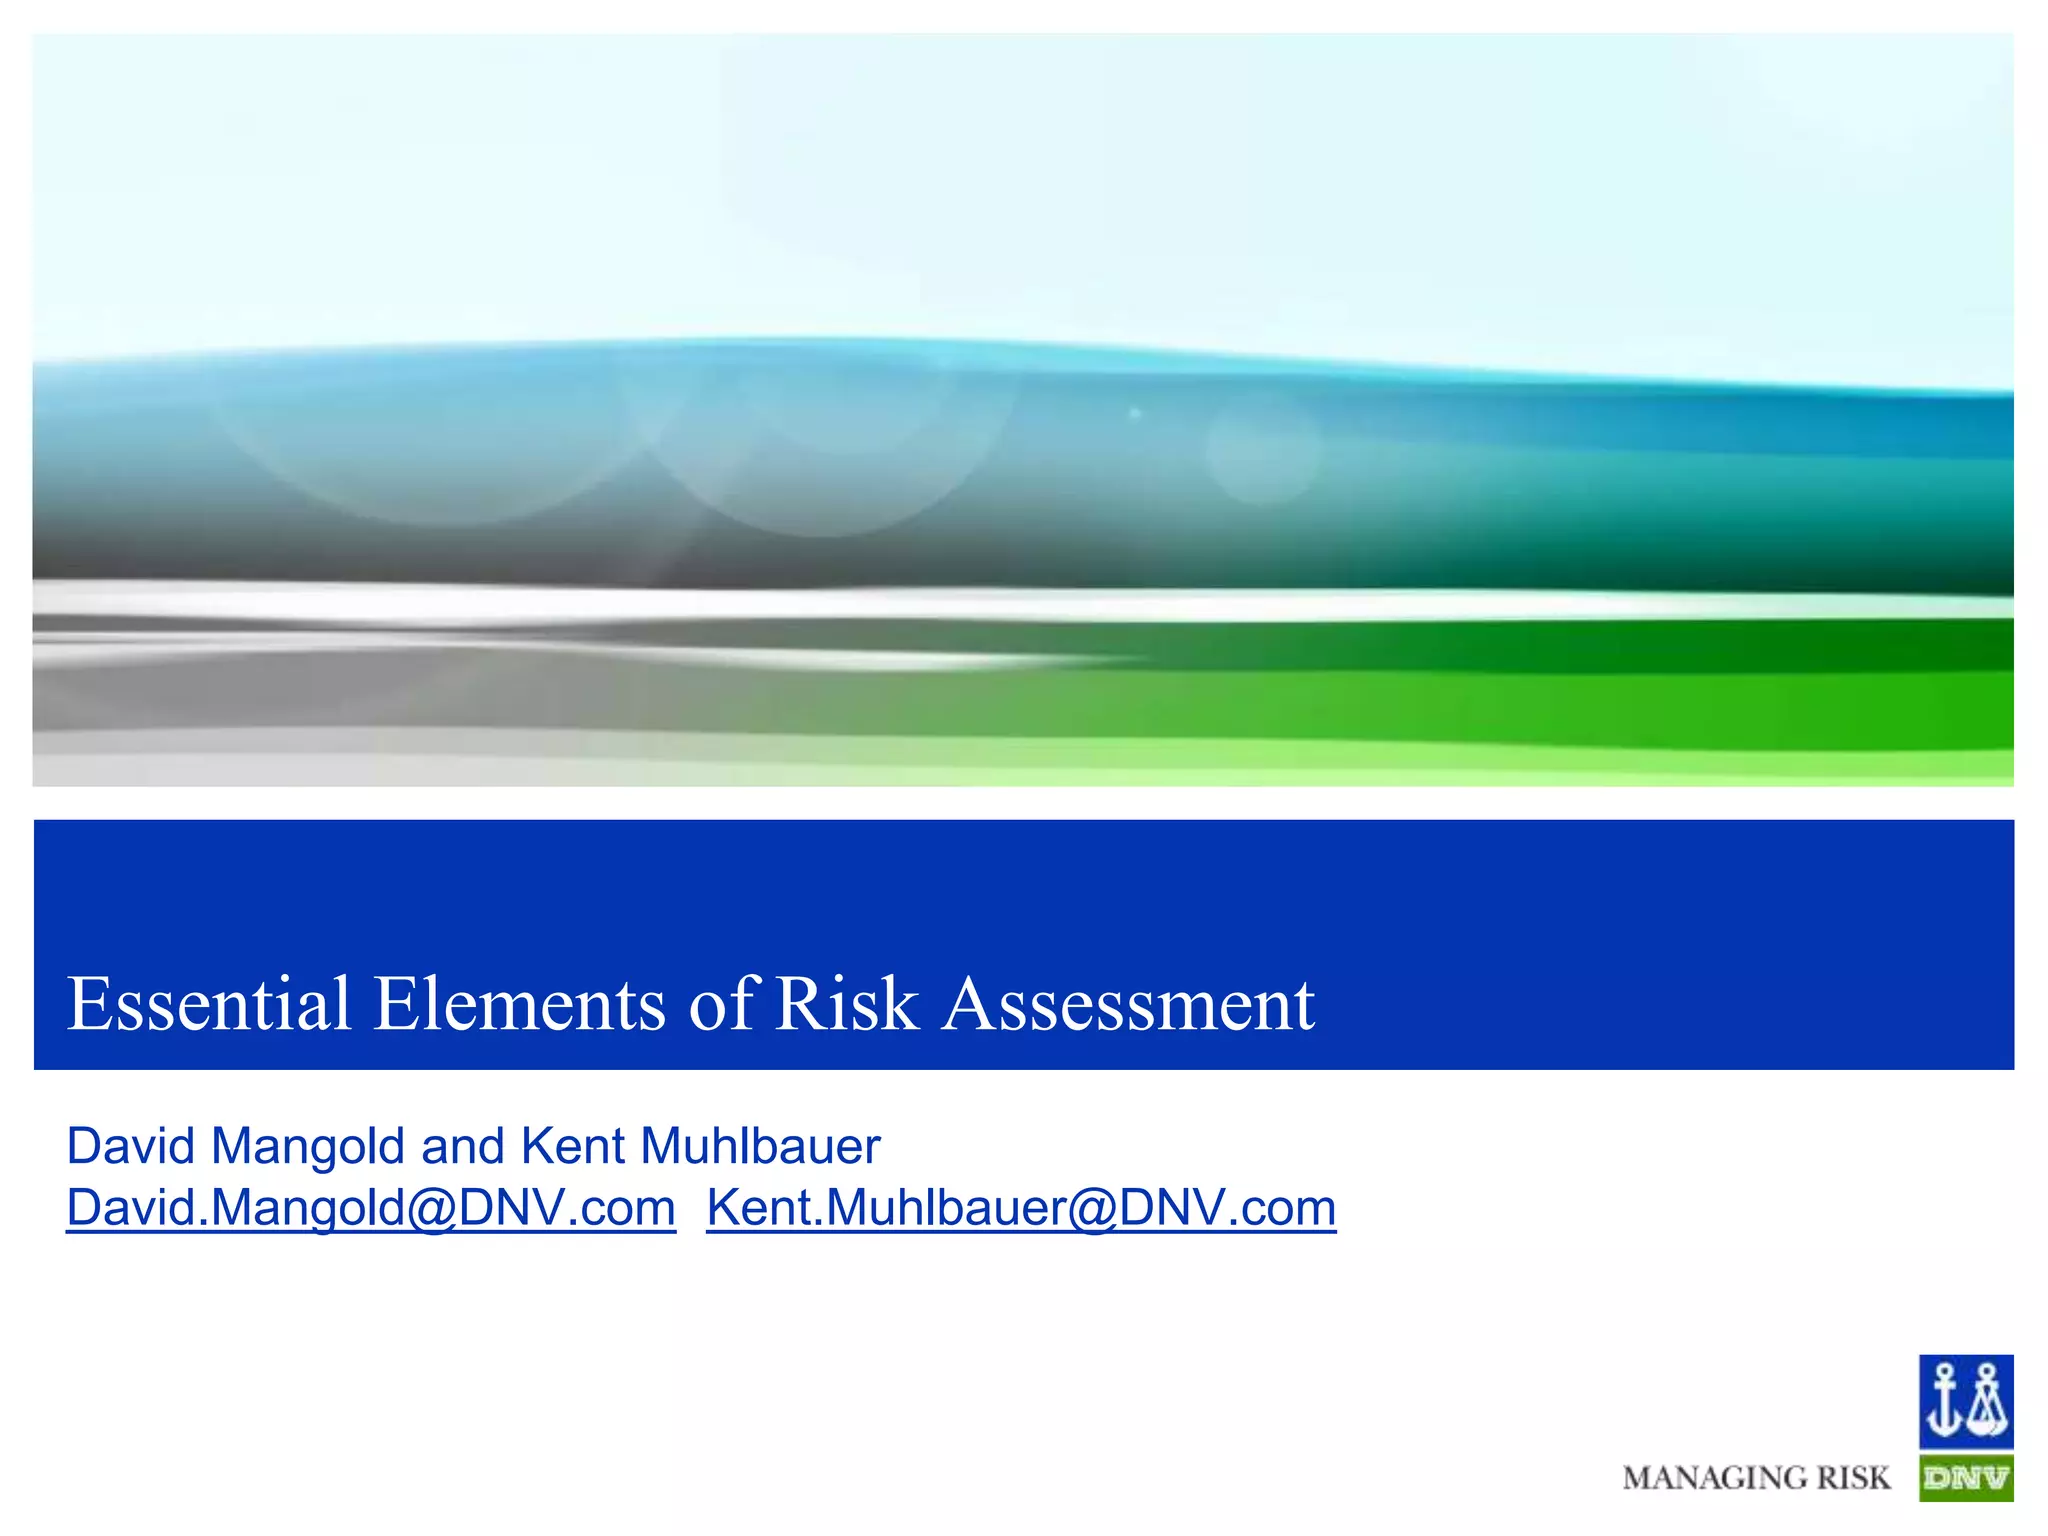
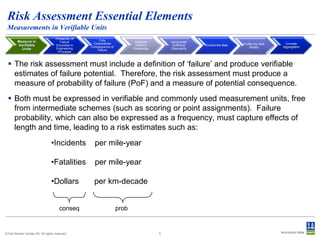
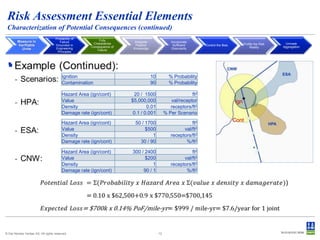
Proper Probability of Failure Assessment (continued)
Measure in
Verifiable
Units
Probability of
Failure
Grounded in
Engineering
Principles
Fully
Characterize
Consequence of
Failure
Integrate
Pipeline
Knowledge
Incorporate
Sufficient
Granularity
Unmask
Aggregation
Profile the Risk
Reality
Control the Bias
Measuring Mitigation
Strong, single measure
Or
Accumulation of lesser measures
1 - (remaining threat)
Remaining threat = (remnant from mit1) AND (remnant from mit2)
(remnant from mit3) …
AND
Mitigation
Mitigation % = 1-[(1-mit1) x (1-mit2) x (1-mit3)…]
Exposure
Coating
© Det Norske Veritas AS. All rights reserved.
8
CP
Mitigated
Exposure
Mitigation % =](https://image.slidesharecdn.com/mangoldessentialelementsofriskassessment-wkm-131129123240-phpapp02/85/Mangold-essential-elements-of-risk-assessment-8-320.jpg)
![Risk Assessment Essential Elements
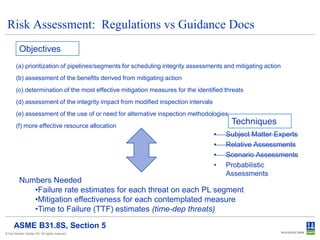
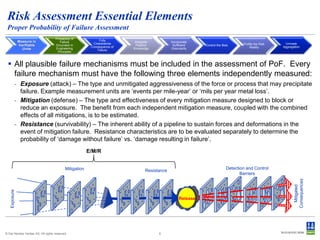
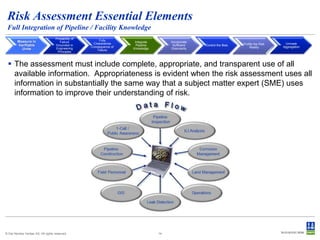
Proper Aggregation
Measure in
Verifiable
Units
Probability of
Failure
Grounded in
Engineering
Principles
Fully
Characterize
Consequence of
Failure
Integrate
Pipeline
Knowledge
Incorporate
Sufficient
Granularity
Control the Bias
Profile the Risk
Reality
Unmask
Aggregation
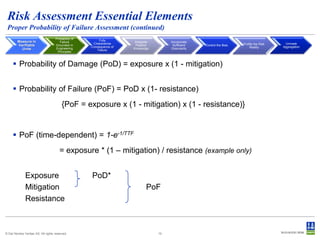
A proper process for aggregation of the risks from multiple pipeline segments must
be included.
Summarization of the risks from multiple segments must avoid simple statistics or
weighted statistics that mask the actual risks
PoF total = PoF1 + PoF2 + PoF3 + PoF4 + … PoFn
PoF total = Avg(PoF1, PoF2, … PoFn)
Overall PoF is probability of failure by [(thd pty) OR (corr) OR (geohaz)…]
Ps = 1 - PoF
Overall Ps is probability of surviving [(thd pty) AND (corr) AND (geohaz)….]
So…
PoFoverall = 1-[(1-PoFthdpty) x (1-PoFcorr) x (1-PoFgeohaz) x (1-PoFincops)]
© Det Norske Veritas AS. All rights reserved.
19](https://image.slidesharecdn.com/mangoldessentialelementsofriskassessment-wkm-131129123240-phpapp02/85/Mangold-essential-elements-of-risk-assessment-19-320.jpg)


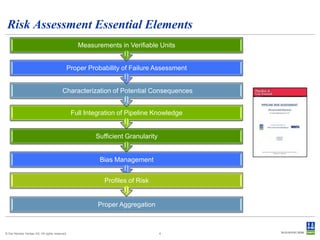
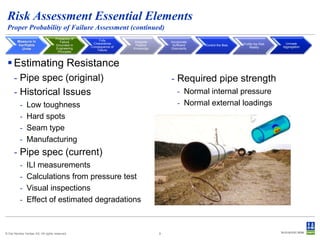
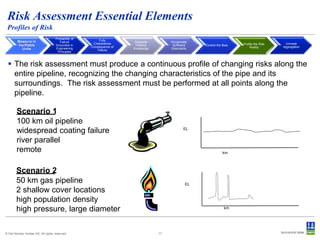
This document outlines essential elements for effective risk assessment of pipelines and pipeline segments. It discusses elements in three main categories: (1) proper probability of failure assessment grounded in engineering principles, including estimating exposure, mitigation, and resistance; (2) fully characterizing potential consequences; and (3) fully integrating available pipeline knowledge. The goal is for risk assessments to produce profiles of changing risk along pipelines using unbiased, granular methods and proper aggregation, leading to optimized safety and integrity decision-making.


